Cities with the Highest Percentage of Families with Income Below $10,000 in New Hampshire
RELATED REPORTS & OPTIONS
Family Income | $0-10k
New Hampshire
Compare Cities
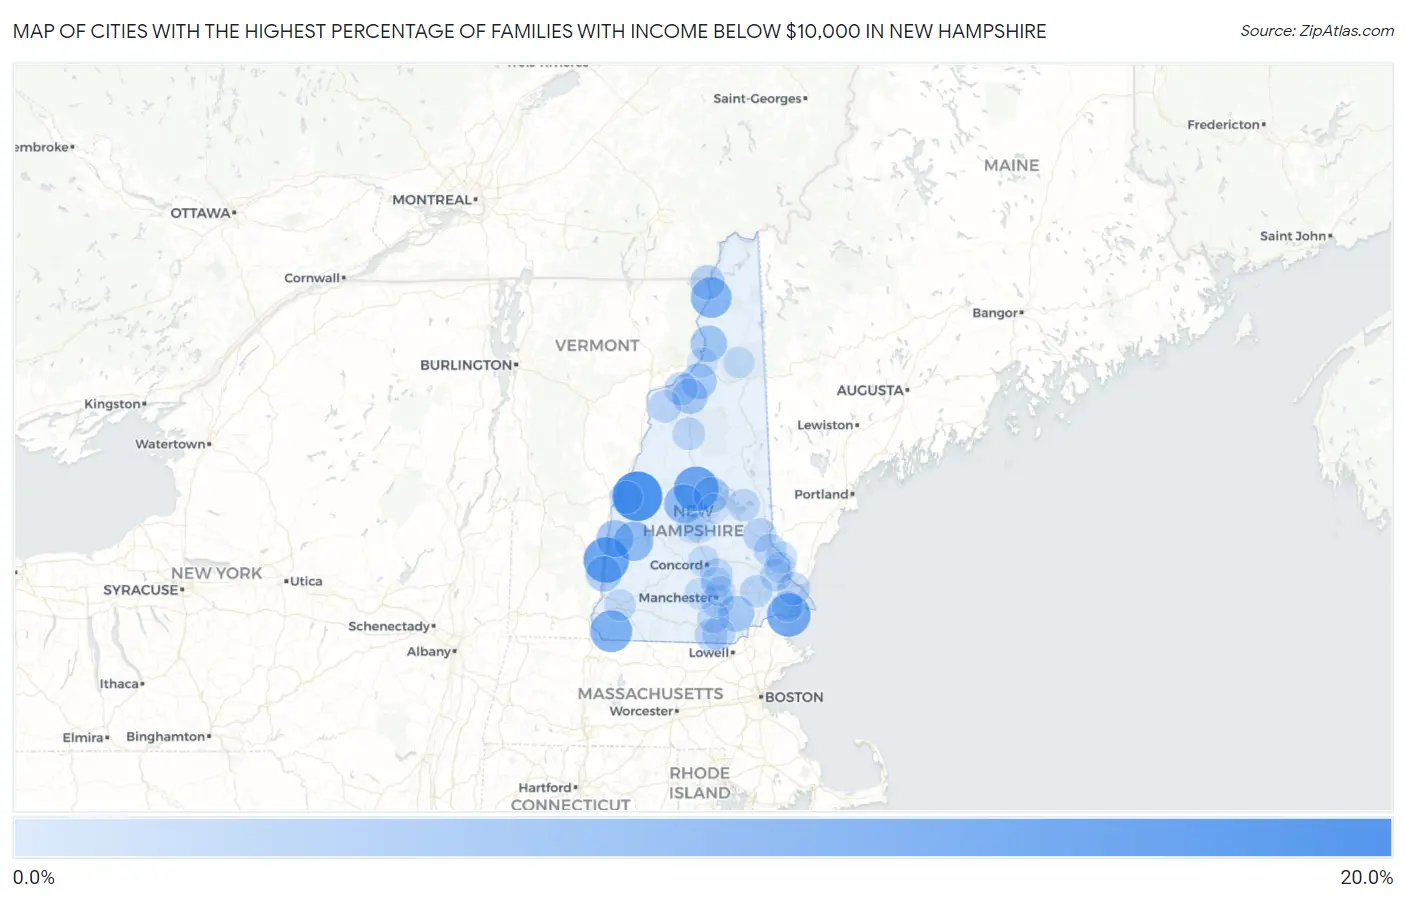
Map of Cities with the Highest Percentage of Families with Income Below $10,000 in New Hampshire
0.0%
20.0%
Cities with the Highest Percentage of Families with Income Below $10,000 in New Hampshire
| City | Families with Income < $10k | vs State | vs National | |
| 1. | Enfield | 17.9% | 1.6%(+16.3)#1 | 3.1%(+14.8)#1,113 |
| 2. | Charlestown | 14.1% | 1.6%(+12.5)#2 | 3.1%(+11.0)#1,653 |
| 3. | Ashland | 13.3% | 1.6%(+11.7)#3 | 3.1%(+10.2)#1,811 |
| 4. | Seabrook Beach | 12.2% | 1.6%(+10.6)#4 | 3.1%(+9.10)#2,074 |
| 5. | Winchester | 10.7% | 1.6%(+9.10)#5 | 3.1%(+7.60)#2,558 |
| 6. | Colebrook | 9.6% | 1.6%(+8.00)#6 | 3.1%(+6.50)#3,046 |
| 7. | Newport | 8.2% | 1.6%(+6.60)#7 | 3.1%(+5.10)#3,774 |
| 8. | Bristol | 8.0% | 1.6%(+6.40)#8 | 3.1%(+4.90)#3,900 |
| 9. | Claremont | 6.4% | 1.6%(+4.80)#9 | 3.1%(+3.30)#5,173 |
| 10. | Groveton | 5.7% | 1.6%(+4.10)#10 | 3.1%(+2.60)#6,023 |
| 11. | Derry | 5.2% | 1.6%(+3.60)#11 | 3.1%(+2.10)#6,627 |
| 12. | Meredith | 5.1% | 1.6%(+3.50)#12 | 3.1%(+2.00)#6,778 |
| 13. | North Walpole | 5.1% | 1.6%(+3.50)#13 | 3.1%(+2.00)#6,839 |
| 14. | Whitefield | 4.9% | 1.6%(+3.30)#14 | 3.1%(+1.80)#7,145 |
| 15. | Bethlehem | 4.7% | 1.6%(+3.10)#15 | 3.1%(+1.60)#7,446 |
| 16. | West Stewartstown | 4.1% | 1.6%(+2.50)#16 | 3.1%(+1.000)#8,514 |
| 17. | Littleton | 2.9% | 1.6%(+1.30)#17 | 3.1%(-0.200)#11,010 |
| 18. | Farmington | 2.9% | 1.6%(+1.30)#18 | 3.1%(-0.200)#11,019 |
| 19. | Lebanon | 2.8% | 1.6%(+1.20)#19 | 3.1%(-0.300)#11,222 |
| 20. | Portsmouth | 2.6% | 1.6%(+1.00)#20 | 3.1%(-0.500)#11,698 |
| 21. | Manchester | 2.5% | 1.6%(+0.900)#21 | 3.1%(-0.600)#11,952 |
| 22. | Hudson | 2.5% | 1.6%(+0.900)#22 | 3.1%(-0.600)#12,049 |
| 23. | Lisbon | 2.5% | 1.6%(+0.900)#23 | 3.1%(-0.600)#12,150 |
| 24. | Nashua | 2.4% | 1.6%(+0.800)#24 | 3.1%(-0.700)#12,225 |
| 25. | Rochester | 2.3% | 1.6%(+0.700)#25 | 3.1%(-0.800)#12,555 |
| 26. | Suncook | 2.3% | 1.6%(+0.700)#26 | 3.1%(-0.800)#12,651 |
| 27. | North Woodstock | 2.3% | 1.6%(+0.700)#27 | 3.1%(-0.800)#12,789 |
| 28. | Durham | 2.1% | 1.6%(+0.500)#28 | 3.1%(-1.000)#13,221 |
| 29. | Wolfeboro | 2.1% | 1.6%(+0.500)#29 | 3.1%(-1.000)#13,293 |
| 30. | Epping | 2.1% | 1.6%(+0.500)#30 | 3.1%(-1.000)#13,296 |
| 31. | East Merrimack | 1.7% | 1.6%(+0.100)#31 | 3.1%(-1.40)#14,498 |
| 32. | Somersworth | 1.6% | 1.6%(=0.000)#32 | 3.1%(-1.50)#14,782 |
| 33. | Keene | 1.5% | 1.6%(-0.100)#33 | 3.1%(-1.60)#15,097 |
| 34. | Goffstown | 1.3% | 1.6%(-0.300)#34 | 3.1%(-1.80)#15,911 |
| 35. | Concord | 1.2% | 1.6%(-0.400)#35 | 3.1%(-1.90)#16,099 |
| 36. | Hampton | 1.2% | 1.6%(-0.400)#36 | 3.1%(-1.90)#16,172 |
| 37. | Berlin | 1.2% | 1.6%(-0.400)#37 | 3.1%(-1.90)#16,175 |
| 38. | Dover | 1.1% | 1.6%(-0.500)#38 | 3.1%(-2.00)#16,445 |
| 39. | Franklin | 1.1% | 1.6%(-0.500)#39 | 3.1%(-2.00)#16,529 |
| 40. | Hooksett | 0.90% | 1.6%(-0.700)#40 | 3.1%(-2.20)#17,274 |
| 41. | Tilton Northfield | 0.90% | 1.6%(-0.700)#41 | 3.1%(-2.20)#17,319 |
| 42. | South Hooksett | 0.50% | 1.6%(-1.10)#42 | 3.1%(-2.60)#18,507 |
| 43. | Lancaster | 0.40% | 1.6%(-1.20)#43 | 3.1%(-2.70)#18,756 |
| 44. | Laconia | 0.10% | 1.6%(-1.50)#44 | 3.1%(-3.00)#18,992 |
1
Common Questions
What are the Top 10 Cities with the Highest Percentage of Families with Income Below $10,000 in New Hampshire?
Top 10 Cities with the Highest Percentage of Families with Income Below $10,000 in New Hampshire are:
#1
17.9%
#2
14.1%
#3
13.3%
#4
12.2%
#5
10.7%
#6
9.6%
#7
8.2%
#8
8.0%
#9
6.4%
#10
5.7%
What city has the Highest Percentage of Families with Income Below $10,000 in New Hampshire?
Enfield has the Highest Percentage of Families with Income Below $10,000 in New Hampshire with 17.9%.
What is the Percentage of Families with Income Below $10,000 in the State of New Hampshire?
Percentage of Families with Income Below $10,000 in New Hampshire is 1.6%.
What is the Percentage of Families with Income Below $10,000 in the United States?
Percentage of Families with Income Below $10,000 in the United States is 3.1%.