Cities with the Highest Percentage of Families with Income Below $10,000 in Tennessee
RELATED REPORTS & OPTIONS
Family Income | $0-10k
Tennessee
Compare Cities
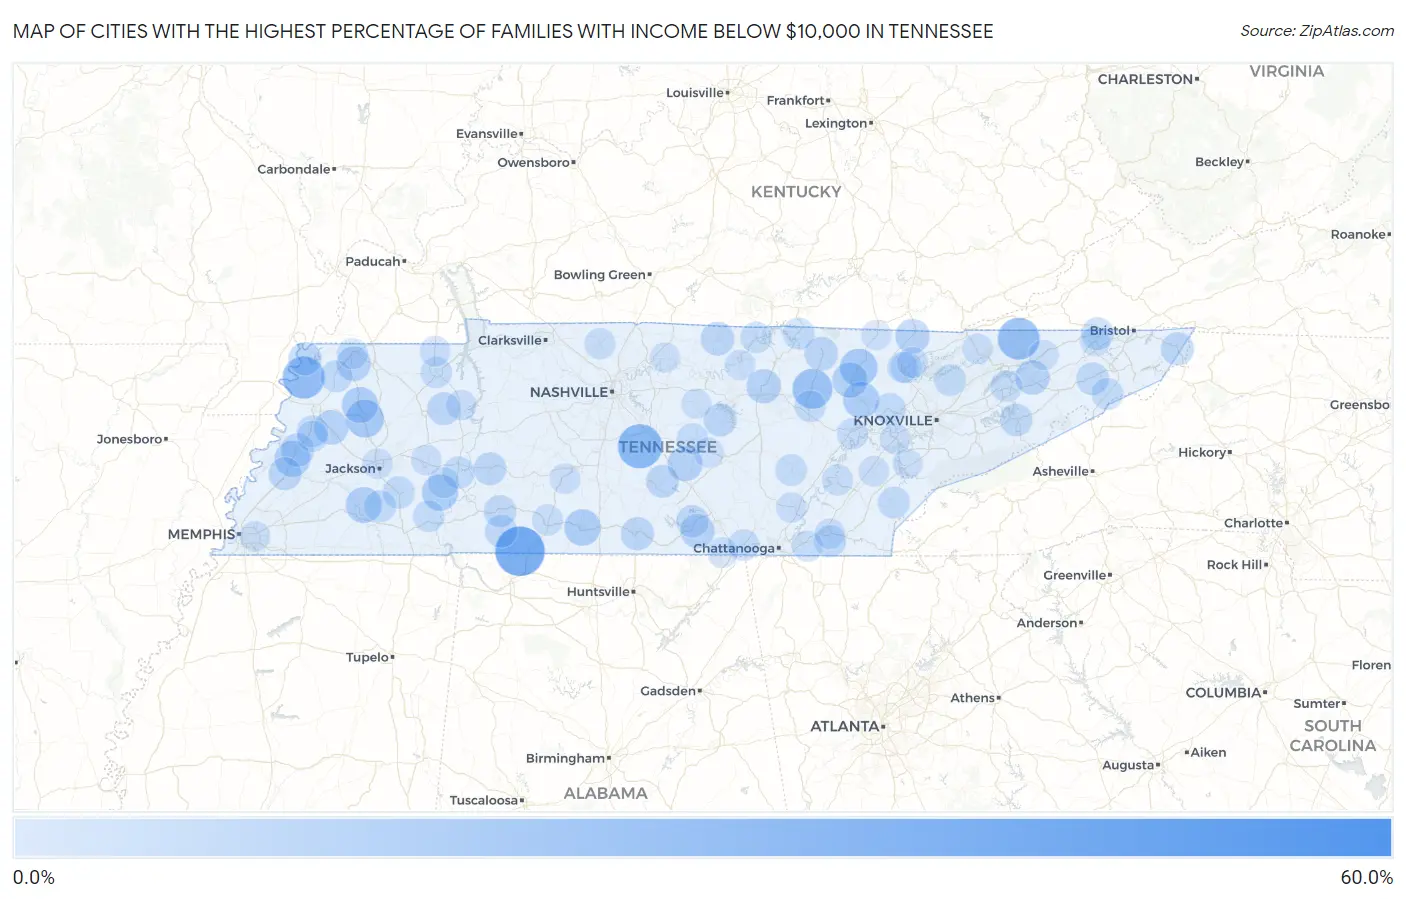
Map of Cities with the Highest Percentage of Families with Income Below $10,000 in Tennessee
0.0%
60.0%
Cities with the Highest Percentage of Families with Income Below $10,000 in Tennessee
| City | Families with Income < $10k | vs State | vs National | |
| 1. | Essary Springs | 53.8% | 3.5%(+50.3)#1 | 3.1%(+50.7)#102 |
| 2. | Dukedom | 52.8% | 3.5%(+49.3)#2 | 3.1%(+49.7)#109 |
| 3. | Iron City | 39.5% | 3.5%(+36.0)#3 | 3.1%(+36.4)#226 |
| 4. | Rockvale | 30.1% | 3.5%(+26.6)#4 | 3.1%(+27.0)#406 |
| 5. | Ridgely | 26.8% | 3.5%(+23.3)#5 | 3.1%(+23.7)#512 |
| 6. | Sneedville | 26.2% | 3.5%(+22.7)#6 | 3.1%(+23.1)#533 |
| 7. | Clarkrange | 22.8% | 3.5%(+19.3)#7 | 3.1%(+19.7)#709 |
| 8. | Rocky Top | 21.8% | 3.5%(+18.3)#8 | 3.1%(+18.7)#771 |
| 9. | Nixon | 21.7% | 3.5%(+18.2)#9 | 3.1%(+18.6)#776 |
| 10. | Randolph | 21.6% | 3.5%(+18.1)#10 | 3.1%(+18.5)#783 |
| 11. | Trenton | 19.1% | 3.5%(+15.6)#11 | 3.1%(+16.0)#994 |
| 12. | Elgin | 18.8% | 3.5%(+15.3)#12 | 3.1%(+15.7)#1,024 |
| 13. | Pulaski | 17.0% | 3.5%(+13.5)#13 | 3.1%(+13.9)#1,203 |
| 14. | Sardis | 16.8% | 3.5%(+13.3)#14 | 3.1%(+13.7)#1,232 |
| 15. | Wartburg | 16.7% | 3.5%(+13.2)#15 | 3.1%(+13.6)#1,235 |
| 16. | Dyer | 16.4% | 3.5%(+12.9)#16 | 3.1%(+13.3)#1,274 |
| 17. | Toone | 16.3% | 3.5%(+12.8)#17 | 3.1%(+13.2)#1,287 |
| 18. | Henning | 16.1% | 3.5%(+12.6)#18 | 3.1%(+13.0)#1,310 |
| 19. | Sunbright | 15.0% | 3.5%(+11.5)#19 | 3.1%(+11.9)#1,460 |
| 20. | Lakewood Park | 14.5% | 3.5%(+11.0)#20 | 3.1%(+11.4)#1,549 |
| 21. | Jellico | 13.6% | 3.5%(+10.1)#21 | 3.1%(+10.5)#1,738 |
| 22. | Rives | 13.6% | 3.5%(+10.1)#22 | 3.1%(+10.5)#1,753 |
| 23. | Bulls Gap | 13.5% | 3.5%(+10.00)#23 | 3.1%(+10.4)#1,771 |
| 24. | Algood | 13.4% | 3.5%(+9.90)#24 | 3.1%(+10.3)#1,784 |
| 25. | Friendship | 13.4% | 3.5%(+9.90)#25 | 3.1%(+10.3)#1,794 |
| 26. | Farner | 13.3% | 3.5%(+9.80)#26 | 3.1%(+10.2)#1,822 |
| 27. | Cowan | 13.1% | 3.5%(+9.60)#27 | 3.1%(+10.00)#1,855 |
| 28. | Jamestown | 12.4% | 3.5%(+8.90)#28 | 3.1%(+9.30)#2,026 |
| 29. | Red Boiling Springs | 12.4% | 3.5%(+8.90)#29 | 3.1%(+9.30)#2,031 |
| 30. | Ripley | 11.7% | 3.5%(+8.20)#30 | 3.1%(+8.60)#2,212 |
| 31. | Sullivan Gardens | 11.7% | 3.5%(+8.20)#31 | 3.1%(+8.60)#2,223 |
| 32. | Fayetteville | 11.5% | 3.5%(+8.00)#32 | 3.1%(+8.40)#2,271 |
| 33. | Tiptonville | 11.5% | 3.5%(+8.00)#33 | 3.1%(+8.40)#2,276 |
| 34. | Mountain City | 11.4% | 3.5%(+7.90)#34 | 3.1%(+8.30)#2,319 |
| 35. | Covington | 11.1% | 3.5%(+7.60)#35 | 3.1%(+8.00)#2,404 |
| 36. | Smithville | 11.1% | 3.5%(+7.60)#36 | 3.1%(+8.00)#2,409 |
| 37. | Bruceton | 11.0% | 3.5%(+7.50)#37 | 3.1%(+7.90)#2,470 |
| 38. | Linden | 10.9% | 3.5%(+7.40)#38 | 3.1%(+7.80)#2,490 |
| 39. | Wartrace | 10.9% | 3.5%(+7.40)#39 | 3.1%(+7.80)#2,497 |
| 40. | Newport | 10.8% | 3.5%(+7.30)#40 | 3.1%(+7.70)#2,511 |
| 41. | Telford | 10.8% | 3.5%(+7.30)#41 | 3.1%(+7.70)#2,528 |
| 42. | Decherd | 10.7% | 3.5%(+7.20)#42 | 3.1%(+7.60)#2,553 |
| 43. | Collinwood | 10.7% | 3.5%(+7.20)#43 | 3.1%(+7.60)#2,561 |
| 44. | Bloomingdale | 10.5% | 3.5%(+7.00)#44 | 3.1%(+7.40)#2,631 |
| 45. | Bon Air | 10.4% | 3.5%(+6.90)#45 | 3.1%(+7.30)#2,688 |
| 46. | Waynesboro | 10.3% | 3.5%(+6.80)#46 | 3.1%(+7.20)#2,715 |
| 47. | Henderson | 9.8% | 3.5%(+6.30)#47 | 3.1%(+6.70)#2,931 |
| 48. | Wildwood Lake | 9.5% | 3.5%(+6.00)#48 | 3.1%(+6.40)#3,076 |
| 49. | Byrdstown | 9.5% | 3.5%(+6.00)#49 | 3.1%(+6.40)#3,086 |
| 50. | Decaturville | 9.5% | 3.5%(+6.00)#50 | 3.1%(+6.40)#3,092 |
| 51. | Tellico Plains | 9.4% | 3.5%(+5.90)#51 | 3.1%(+6.30)#3,136 |
| 52. | Silerton | 9.4% | 3.5%(+5.90)#52 | 3.1%(+6.30)#3,166 |
| 53. | Obion | 9.3% | 3.5%(+5.80)#53 | 3.1%(+6.20)#3,191 |
| 54. | Morristown | 9.2% | 3.5%(+5.70)#54 | 3.1%(+6.10)#3,215 |
| 55. | Maynardville | 9.2% | 3.5%(+5.70)#55 | 3.1%(+6.10)#3,236 |
| 56. | Pikeville | 9.1% | 3.5%(+5.60)#56 | 3.1%(+6.00)#3,288 |
| 57. | Erwin | 9.0% | 3.5%(+5.50)#57 | 3.1%(+5.90)#3,345 |
| 58. | Jasper | 9.0% | 3.5%(+5.50)#58 | 3.1%(+5.90)#3,350 |
| 59. | Halls | 9.0% | 3.5%(+5.50)#59 | 3.1%(+5.90)#3,360 |
| 60. | Oliver Springs | 8.9% | 3.5%(+5.40)#60 | 3.1%(+5.80)#3,393 |
| 61. | Paris | 8.8% | 3.5%(+5.30)#61 | 3.1%(+5.70)#3,436 |
| 62. | Bowman | 8.8% | 3.5%(+5.30)#62 | 3.1%(+5.70)#3,474 |
| 63. | Adamsville | 8.7% | 3.5%(+5.20)#63 | 3.1%(+5.60)#3,511 |
| 64. | Celina | 8.6% | 3.5%(+5.10)#64 | 3.1%(+5.50)#3,569 |
| 65. | Jacksboro | 8.5% | 3.5%(+5.00)#65 | 3.1%(+5.40)#3,621 |
| 66. | Woodbury | 8.5% | 3.5%(+5.00)#66 | 3.1%(+5.40)#3,623 |
| 67. | Beech Bluff | 8.5% | 3.5%(+5.00)#67 | 3.1%(+5.40)#3,642 |
| 68. | Lawrenceburg | 8.2% | 3.5%(+4.70)#68 | 3.1%(+5.10)#3,765 |
| 69. | Decatur | 8.2% | 3.5%(+4.70)#69 | 3.1%(+5.10)#3,787 |
| 70. | Scotts Hill | 8.2% | 3.5%(+4.70)#70 | 3.1%(+5.10)#3,791 |
| 71. | Gates | 8.2% | 3.5%(+4.70)#71 | 3.1%(+5.10)#3,799 |
| 72. | Springfield | 8.1% | 3.5%(+4.60)#72 | 3.1%(+5.00)#3,829 |
| 73. | Collegedale | 7.9% | 3.5%(+4.40)#73 | 3.1%(+4.80)#3,948 |
| 74. | John Sevier | 7.9% | 3.5%(+4.40)#74 | 3.1%(+4.80)#3,983 |
| 75. | Union City | 7.8% | 3.5%(+4.30)#75 | 3.1%(+4.70)#4,013 |
| 76. | Rockwood | 7.8% | 3.5%(+4.30)#76 | 3.1%(+4.70)#4,025 |
| 77. | Caryville | 7.8% | 3.5%(+4.30)#77 | 3.1%(+4.70)#4,036 |
| 78. | La Follette | 7.7% | 3.5%(+4.20)#78 | 3.1%(+4.60)#4,085 |
| 79. | Puryear | 7.4% | 3.5%(+3.90)#79 | 3.1%(+4.30)#4,324 |
| 80. | Jackson | 7.3% | 3.5%(+3.80)#80 | 3.1%(+4.20)#4,360 |
| 81. | Lenoir City | 7.3% | 3.5%(+3.80)#81 | 3.1%(+4.20)#4,370 |
| 82. | Lexington | 7.2% | 3.5%(+3.70)#82 | 3.1%(+4.10)#4,455 |
| 83. | Sweetwater | 7.2% | 3.5%(+3.70)#83 | 3.1%(+4.10)#4,457 |
| 84. | East Cleveland | 7.2% | 3.5%(+3.70)#84 | 3.1%(+4.10)#4,477 |
| 85. | Memphis | 7.1% | 3.5%(+3.60)#85 | 3.1%(+4.00)#4,506 |
| 86. | Camden | 7.1% | 3.5%(+3.60)#86 | 3.1%(+4.00)#4,535 |
| 87. | Tazewell | 7.1% | 3.5%(+3.60)#87 | 3.1%(+4.00)#4,542 |
| 88. | Orme | 7.1% | 3.5%(+3.60)#88 | 3.1%(+4.00)#4,599 |
| 89. | Gainesboro | 7.0% | 3.5%(+3.50)#89 | 3.1%(+3.90)#4,658 |
| 90. | Flat Top Mountain | 7.0% | 3.5%(+3.50)#90 | 3.1%(+3.90)#4,662 |
| 91. | Mount Pleasant | 6.9% | 3.5%(+3.40)#91 | 3.1%(+3.80)#4,712 |
| 92. | Delano | 6.8% | 3.5%(+3.30)#92 | 3.1%(+3.70)#4,836 |
| 93. | Centertown | 6.8% | 3.5%(+3.30)#93 | 3.1%(+3.70)#4,855 |
| 94. | Castalian Springs | 6.7% | 3.5%(+3.20)#94 | 3.1%(+3.60)#4,918 |
| 95. | Kingsport | 6.6% | 3.5%(+3.10)#95 | 3.1%(+3.50)#4,955 |
| 96. | Alexandria | 6.6% | 3.5%(+3.10)#96 | 3.1%(+3.50)#5,010 |
| 97. | Rogersville | 6.5% | 3.5%(+3.00)#97 | 3.1%(+3.40)#5,075 |
| 98. | Biltmore | 6.5% | 3.5%(+3.00)#98 | 3.1%(+3.40)#5,096 |
| 99. | Greenback | 6.5% | 3.5%(+3.00)#99 | 3.1%(+3.40)#5,105 |
| 100. | Winfield | 6.5% | 3.5%(+3.00)#100 | 3.1%(+3.40)#5,107 |
Common Questions
What are the Top 10 Cities with the Highest Percentage of Families with Income Below $10,000 in Tennessee?
Top 10 Cities with the Highest Percentage of Families with Income Below $10,000 in Tennessee are:
#1
39.5%
#2
30.1%
#3
26.8%
#4
26.2%
#5
22.8%
#6
19.1%
#7
18.8%
#8
17.0%
#9
16.8%
#10
16.7%
What city has the Highest Percentage of Families with Income Below $10,000 in Tennessee?
Iron City has the Highest Percentage of Families with Income Below $10,000 in Tennessee with 39.5%.
What is the Percentage of Families with Income Below $10,000 in the State of Tennessee?
Percentage of Families with Income Below $10,000 in Tennessee is 3.5%.
What is the Percentage of Families with Income Below $10,000 in the United States?
Percentage of Families with Income Below $10,000 in the United States is 3.1%.