Cities with the Highest Percentage of Families with Income Below $10,000 in Connecticut
RELATED REPORTS & OPTIONS
Family Income | $0-10k
Connecticut
Compare Cities
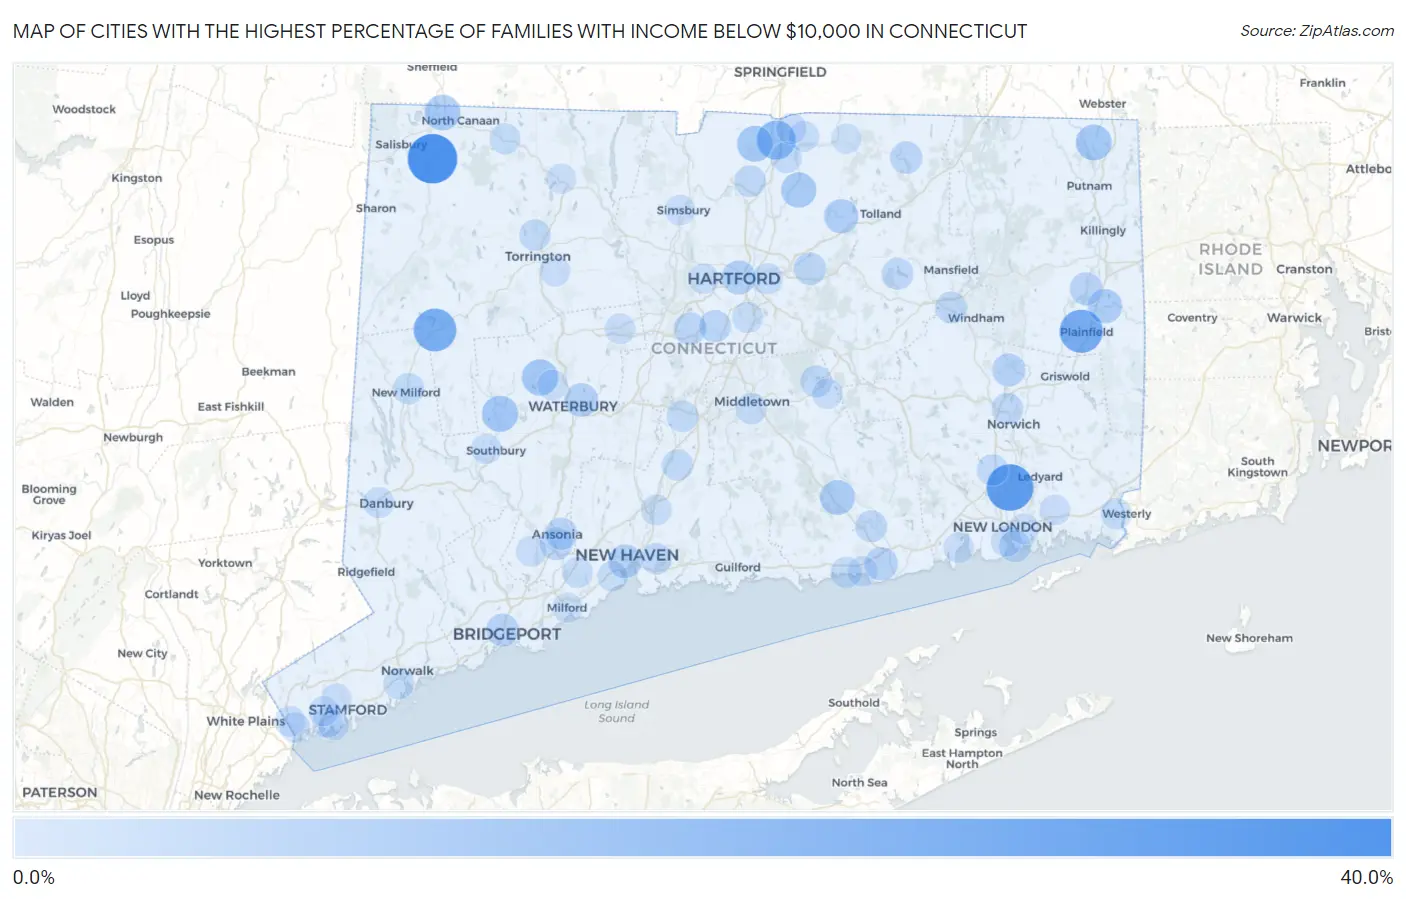
Map of Cities with the Highest Percentage of Families with Income Below $10,000 in Connecticut
0.0%
40.0%
Cities with the Highest Percentage of Families with Income Below $10,000 in Connecticut
| City | Families with Income < $10k | vs State | vs National | |
| 1. | Falls Village | 36.4% | 2.4%(+34.0)#1 | 3.1%(+33.3)#268 |
| 2. | Gales Ferry | 31.0% | 2.4%(+28.6)#2 | 3.1%(+27.9)#380 |
| 3. | Plainfield Village | 24.6% | 2.4%(+22.2)#3 | 3.1%(+21.5)#612 |
| 4. | New Preston | 23.7% | 2.4%(+21.3)#4 | 3.1%(+20.6)#663 |
| 5. | Thompsonville | 16.5% | 2.4%(+14.1)#5 | 3.1%(+13.4)#1,261 |
| 6. | Watertown | 11.8% | 2.4%(+9.40)#6 | 3.1%(+8.70)#2,181 |
| 7. | Woodbury Center | 11.4% | 2.4%(+9.00)#7 | 3.1%(+8.30)#2,324 |
| 8. | Suffield Depot | 11.0% | 2.4%(+8.60)#8 | 3.1%(+7.90)#2,468 |
| 9. | North Grosvenor Dale | 10.9% | 2.4%(+8.50)#9 | 3.1%(+7.80)#2,492 |
| 10. | Canaan | 10.6% | 2.4%(+8.20)#10 | 3.1%(+7.50)#2,599 |
| 11. | Broad Brook | 9.9% | 2.4%(+7.50)#11 | 3.1%(+6.80)#2,901 |
| 12. | Chester Center | 9.4% | 2.4%(+7.00)#12 | 3.1%(+6.30)#3,132 |
| 13. | Cornwall Bridge | 9.4% | 2.4%(+7.00)#13 | 3.1%(+6.30)#3,162 |
| 14. | Danielson Borough | 9.3% | 2.4%(+6.90)#14 | 3.1%(+6.20)#3,175 |
| 15. | Groton Long Point Borough | 9.0% | 2.4%(+6.60)#15 | 3.1%(+5.90)#3,377 |
| 16. | Moosup | 8.4% | 2.4%(+6.00)#16 | 3.1%(+5.30)#3,669 |
| 17. | Rockville | 8.3% | 2.4%(+5.90)#17 | 3.1%(+5.20)#3,706 |
| 18. | Hartford | 7.5% | 2.4%(+5.10)#18 | 3.1%(+4.40)#4,207 |
| 19. | New Haven | 7.0% | 2.4%(+4.60)#19 | 3.1%(+3.90)#4,602 |
| 20. | Waterbury | 7.0% | 2.4%(+4.60)#20 | 3.1%(+3.90)#4,603 |
| 21. | Riverton | 6.6% | 2.4%(+4.20)#21 | 3.1%(+3.50)#5,043 |
| 22. | Old Saybrook Center | 6.2% | 2.4%(+3.80)#22 | 3.1%(+3.10)#5,425 |
| 23. | Baltic | 6.2% | 2.4%(+3.80)#23 | 3.1%(+3.10)#5,446 |
| 24. | Staples | 5.8% | 2.4%(+3.40)#24 | 3.1%(+2.70)#5,858 |
| 25. | Bridgeport | 5.6% | 2.4%(+3.20)#25 | 3.1%(+2.50)#6,067 |
| 26. | Wauregan | 5.6% | 2.4%(+3.20)#26 | 3.1%(+2.50)#6,143 |
| 27. | Derby | 5.2% | 2.4%(+2.80)#27 | 3.1%(+2.10)#6,638 |
| 28. | New Britain | 5.0% | 2.4%(+2.60)#28 | 3.1%(+1.90)#6,877 |
| 29. | Manchester | 5.0% | 2.4%(+2.60)#29 | 3.1%(+1.90)#6,886 |
| 30. | Stafford Springs | 4.8% | 2.4%(+2.40)#30 | 3.1%(+1.70)#7,242 |
| 31. | Ansonia | 4.7% | 2.4%(+2.30)#31 | 3.1%(+1.60)#7,353 |
| 32. | Candlewood Orchards | 4.6% | 2.4%(+2.20)#32 | 3.1%(+1.50)#7,603 |
| 33. | Newington | 4.5% | 2.4%(+2.10)#33 | 3.1%(+1.40)#7,633 |
| 34. | Lake Pocotopaug | 4.1% | 2.4%(+1.70)#34 | 3.1%(+1.000)#8,401 |
| 35. | Willimantic | 4.0% | 2.4%(+1.60)#35 | 3.1%(+0.900)#8,574 |
| 36. | Stratford Downtown | 4.0% | 2.4%(+1.60)#36 | 3.1%(+0.900)#8,642 |
| 37. | Groton | 3.9% | 2.4%(+1.50)#37 | 3.1%(+0.800)#8,778 |
| 38. | Essex Village | 3.9% | 2.4%(+1.50)#38 | 3.1%(+0.800)#8,813 |
| 39. | Plattsville | 3.9% | 2.4%(+1.50)#39 | 3.1%(+0.800)#8,868 |
| 40. | Norwich | 3.8% | 2.4%(+1.40)#40 | 3.1%(+0.700)#8,930 |
| 41. | Windsor Locks | 3.8% | 2.4%(+1.40)#41 | 3.1%(+0.700)#8,951 |
| 42. | Coventry Lake | 3.7% | 2.4%(+1.30)#42 | 3.1%(+0.600)#9,221 |
| 43. | Meriden | 3.5% | 2.4%(+1.10)#43 | 3.1%(+0.400)#9,536 |
| 44. | Noroton Heights | 3.4% | 2.4%(+1.00)#44 | 3.1%(+0.300)#9,828 |
| 45. | Oxoboxo River | 3.4% | 2.4%(+1.00)#45 | 3.1%(+0.300)#9,838 |
| 46. | East Haven | 3.3% | 2.4%(+0.900)#46 | 3.1%(+0.200)#9,980 |
| 47. | Torrington | 3.2% | 2.4%(+0.800)#47 | 3.1%(+0.100)#10,215 |
| 48. | Tokeneke | 3.2% | 2.4%(+0.800)#48 | 3.1%(+0.100)#10,317 |
| 49. | Wallingford Center | 3.1% | 2.4%(+0.700)#49 | 3.1%(=0.000)#10,470 |
| 50. | New Milford | 3.1% | 2.4%(+0.700)#50 | 3.1%(=0.000)#10,507 |
| 51. | Noroton | 3.1% | 2.4%(+0.700)#51 | 3.1%(=0.000)#10,516 |
| 52. | Middletown | 2.9% | 2.4%(+0.500)#52 | 3.1%(-0.200)#10,907 |
| 53. | Pawcatuck | 2.8% | 2.4%(+0.400)#53 | 3.1%(-0.300)#11,254 |
| 54. | Ball Pond | 2.8% | 2.4%(+0.400)#54 | 3.1%(-0.300)#11,294 |
| 55. | Westbrook Center | 2.8% | 2.4%(+0.400)#55 | 3.1%(-0.300)#11,303 |
| 56. | Southwood Acres | 2.7% | 2.4%(+0.300)#56 | 3.1%(-0.400)#11,503 |
| 57. | Norwalk | 2.5% | 2.4%(+0.100)#57 | 3.1%(-0.600)#11,956 |
| 58. | East Hartford | 2.5% | 2.4%(+0.100)#58 | 3.1%(-0.600)#11,969 |
| 59. | Norfolk | 2.5% | 2.4%(+0.100)#59 | 3.1%(-0.600)#12,166 |
| 60. | Poplar Plains | 2.4% | 2.4%(=0.000)#60 | 3.1%(-0.700)#12,431 |
| 61. | Danbury | 2.3% | 2.4%(-0.100)#61 | 3.1%(-0.800)#12,530 |
| 62. | New London | 2.3% | 2.4%(-0.100)#62 | 3.1%(-0.800)#12,561 |
| 63. | Orange | 2.2% | 2.4%(-0.200)#63 | 3.1%(-0.900)#12,897 |
| 64. | Hazardville | 2.1% | 2.4%(-0.300)#64 | 3.1%(-1.000)#13,249 |
| 65. | Wethersfield | 2.0% | 2.4%(-0.400)#65 | 3.1%(-1.10)#13,466 |
| 66. | North Haven | 1.9% | 2.4%(-0.500)#66 | 3.1%(-1.20)#13,806 |
| 67. | Glenville | 1.9% | 2.4%(-0.500)#67 | 3.1%(-1.20)#13,904 |
| 68. | Stamford | 1.8% | 2.4%(-0.600)#68 | 3.1%(-1.30)#14,051 |
| 69. | Shelton | 1.8% | 2.4%(-0.600)#69 | 3.1%(-1.30)#14,073 |
| 70. | Sandy Hook | 1.8% | 2.4%(-0.600)#70 | 3.1%(-1.30)#14,145 |
| 71. | Oakville | 1.8% | 2.4%(-0.600)#71 | 3.1%(-1.30)#14,146 |
| 72. | Long Hill | 1.8% | 2.4%(-0.600)#72 | 3.1%(-1.30)#14,181 |
| 73. | Compo | 1.8% | 2.4%(-0.600)#73 | 3.1%(-1.30)#14,199 |
| 74. | Old Greenwich | 1.7% | 2.4%(-0.700)#74 | 3.1%(-1.40)#14,472 |
| 75. | Bristol | 1.6% | 2.4%(-0.800)#75 | 3.1%(-1.50)#14,717 |
| 76. | Sherwood Manor | 1.6% | 2.4%(-0.800)#76 | 3.1%(-1.50)#14,826 |
| 77. | Old Mystic | 1.6% | 2.4%(-0.800)#77 | 3.1%(-1.50)#14,868 |
| 78. | Pemberwick | 1.6% | 2.4%(-0.800)#78 | 3.1%(-1.50)#14,874 |
| 79. | Litchfield Borough | 1.6% | 2.4%(-0.800)#79 | 3.1%(-1.50)#14,950 |
| 80. | Niantic | 1.5% | 2.4%(-0.900)#80 | 3.1%(-1.60)#15,187 |
| 81. | Coleytown | 1.5% | 2.4%(-0.900)#81 | 3.1%(-1.60)#15,191 |
| 82. | Northwest Harwinton | 1.5% | 2.4%(-0.900)#82 | 3.1%(-1.60)#15,196 |
| 83. | East Hampton | 1.5% | 2.4%(-0.900)#83 | 3.1%(-1.60)#15,207 |
| 84. | Ridgebury | 1.5% | 2.4%(-0.900)#84 | 3.1%(-1.60)#15,232 |
| 85. | Mill Plain | 1.5% | 2.4%(-0.900)#85 | 3.1%(-1.60)#15,243 |
| 86. | Saybrook Manor | 1.5% | 2.4%(-0.900)#86 | 3.1%(-1.60)#15,285 |
| 87. | West Hartford | 1.4% | 2.4%(-1.00)#87 | 3.1%(-1.70)#15,379 |
| 88. | West Haven | 1.4% | 2.4%(-1.00)#88 | 3.1%(-1.70)#15,380 |
| 89. | Riverside | 1.4% | 2.4%(-1.00)#89 | 3.1%(-1.70)#15,470 |
| 90. | Westport | 1.4% | 2.4%(-1.00)#90 | 3.1%(-1.70)#15,566 |
| 91. | Stonington Borough | 1.4% | 2.4%(-1.00)#91 | 3.1%(-1.70)#15,645 |
| 92. | Simsbury Center | 1.3% | 2.4%(-1.10)#92 | 3.1%(-1.80)#15,871 |
| 93. | Heritage Village | 1.3% | 2.4%(-1.10)#93 | 3.1%(-1.80)#15,885 |
| 94. | Greens Farms | 1.3% | 2.4%(-1.10)#94 | 3.1%(-1.80)#15,909 |
| 95. | Cos Cob | 1.2% | 2.4%(-1.20)#95 | 3.1%(-1.90)#16,194 |
| 96. | Winsted | 1.2% | 2.4%(-1.20)#96 | 3.1%(-1.90)#16,197 |
| 97. | Somers | 1.2% | 2.4%(-1.20)#97 | 3.1%(-1.90)#16,288 |
| 98. | Old Hill | 1.1% | 2.4%(-1.30)#98 | 3.1%(-2.00)#16,623 |
| 99. | Milford City Balance | 1.0% | 2.4%(-1.40)#99 | 3.1%(-2.10)#16,790 |
| 100. | Naugatuck Borough | 1.0% | 2.4%(-1.40)#100 | 3.1%(-2.10)#16,805 |
Common Questions
What are the Top 10 Cities with the Highest Percentage of Families with Income Below $10,000 in Connecticut?
Top 10 Cities with the Highest Percentage of Families with Income Below $10,000 in Connecticut are:
#1
36.4%
#2
31.0%
#3
24.6%
#4
23.7%
#5
16.5%
#6
11.8%
#7
11.4%
#8
11.0%
#9
10.9%
#10
10.6%
What city has the Highest Percentage of Families with Income Below $10,000 in Connecticut?
Falls Village has the Highest Percentage of Families with Income Below $10,000 in Connecticut with 36.4%.
What is the Percentage of Families with Income Below $10,000 in the State of Connecticut?
Percentage of Families with Income Below $10,000 in Connecticut is 2.4%.
What is the Percentage of Families with Income Below $10,000 in the United States?
Percentage of Families with Income Below $10,000 in the United States is 3.1%.