Cities with the Highest Percentage of Families with Income Below $10,000 in South Carolina
RELATED REPORTS & OPTIONS
Family Income | $0-10k
South Carolina
Compare Cities
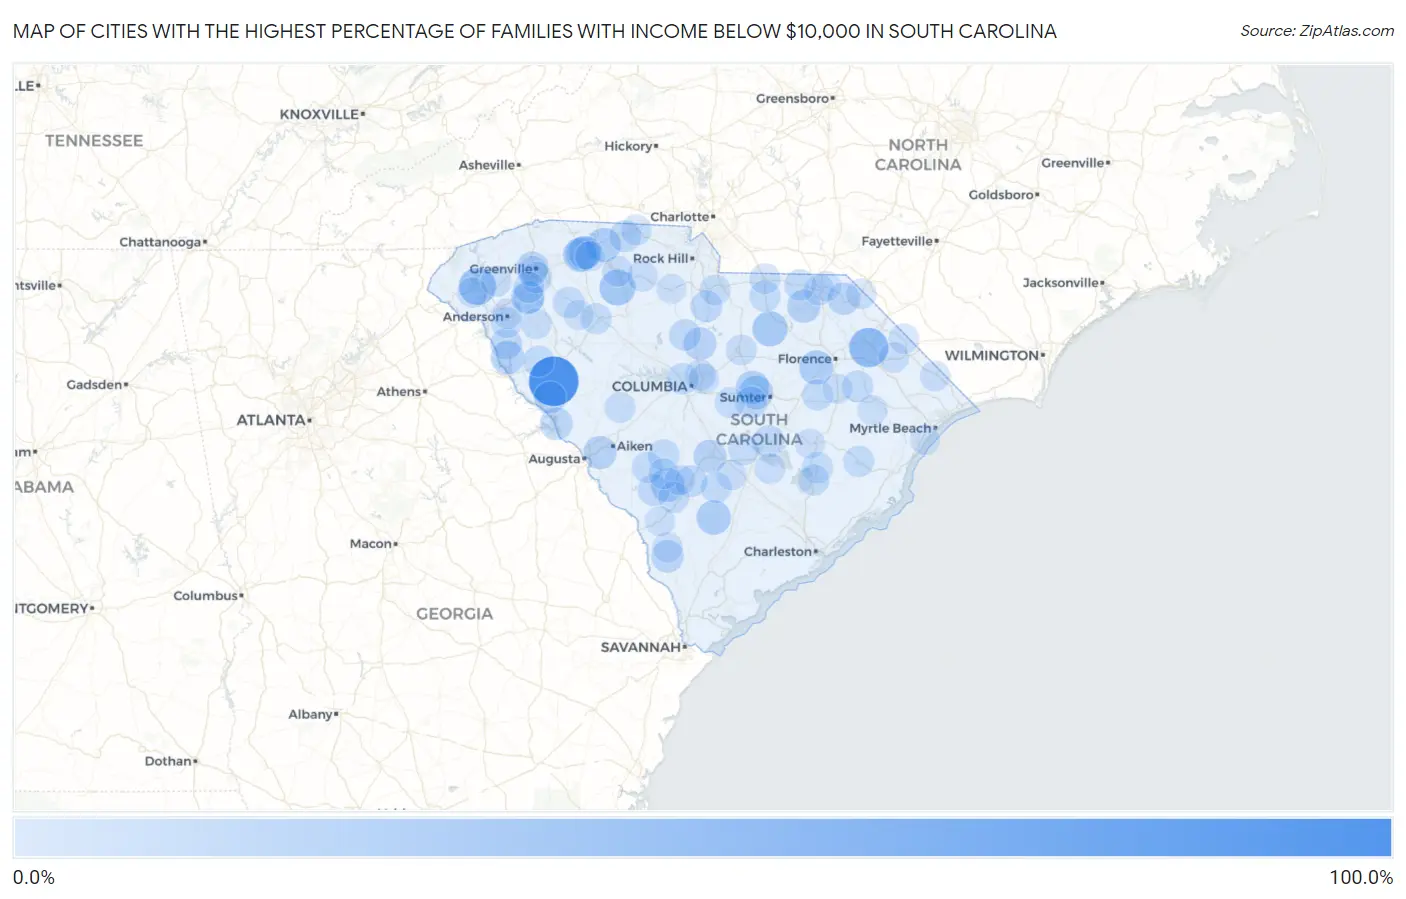
Map of Cities with the Highest Percentage of Families with Income Below $10,000 in South Carolina
0.0%
100.0%
Cities with the Highest Percentage of Families with Income Below $10,000 in South Carolina
| City | Families with Income < $10k | vs State | vs National | |
| 1. | Bradley | 83.9% | 3.7%(+80.2)#1 | 3.1%(+80.8)#45 |
| 2. | Manville | 52.7% | 3.7%(+49.0)#2 | 3.1%(+49.6)#110 |
| 3. | Sellers | 42.4% | 3.7%(+38.7)#3 | 3.1%(+39.3)#188 |
| 4. | Centenary | 37.3% | 3.7%(+33.6)#4 | 3.1%(+34.2)#253 |
| 5. | Newry | 34.6% | 3.7%(+30.9)#5 | 3.1%(+31.5)#301 |
| 6. | Olympia | 30.4% | 3.7%(+26.7)#6 | 3.1%(+27.3)#396 |
| 7. | Grover | 30.1% | 3.7%(+26.4)#7 | 3.1%(+27.0)#409 |
| 8. | Buffalo | 29.5% | 3.7%(+25.8)#8 | 3.1%(+26.4)#419 |
| 9. | Bethune | 26.2% | 3.7%(+22.5)#9 | 3.1%(+23.1)#536 |
| 10. | Edmund | 23.9% | 3.7%(+20.2)#10 | 3.1%(+20.8)#652 |
| 11. | Williams | 23.9% | 3.7%(+20.2)#11 | 3.1%(+20.8)#655 |
| 12. | Timmonsville | 23.2% | 3.7%(+19.5)#12 | 3.1%(+20.1)#687 |
| 13. | Cowpens | 22.7% | 3.7%(+19.0)#13 | 3.1%(+19.6)#714 |
| 14. | Arcadia | 22.5% | 3.7%(+18.8)#14 | 3.1%(+19.4)#730 |
| 15. | Fairforest | 22.1% | 3.7%(+18.4)#15 | 3.1%(+19.0)#755 |
| 16. | Cherryvale | 21.2% | 3.7%(+17.5)#16 | 3.1%(+18.1)#808 |
| 17. | Oakland | 20.9% | 3.7%(+17.2)#17 | 3.1%(+17.8)#825 |
| 18. | Hilda | 20.4% | 3.7%(+16.7)#18 | 3.1%(+17.3)#868 |
| 19. | Lowndesville | 20.0% | 3.7%(+16.3)#19 | 3.1%(+16.9)#899 |
| 20. | Seabrook | 19.5% | 3.7%(+15.8)#20 | 3.1%(+16.4)#946 |
| 21. | Saxon | 19.2% | 3.7%(+15.5)#21 | 3.1%(+16.1)#980 |
| 22. | Langley | 19.2% | 3.7%(+15.5)#22 | 3.1%(+16.1)#982 |
| 23. | Patrick | 18.9% | 3.7%(+15.2)#23 | 3.1%(+15.8)#1,015 |
| 24. | Orangeburg | 18.7% | 3.7%(+15.0)#24 | 3.1%(+15.6)#1,027 |
| 25. | Hamer | 18.5% | 3.7%(+14.8)#25 | 3.1%(+15.4)#1,046 |
| 26. | West Pelzer | 18.3% | 3.7%(+14.6)#26 | 3.1%(+15.2)#1,062 |
| 27. | Ridgeway | 17.9% | 3.7%(+14.2)#27 | 3.1%(+14.8)#1,119 |
| 28. | Modoc | 16.6% | 3.7%(+12.9)#28 | 3.1%(+13.5)#1,259 |
| 29. | Estill | 16.5% | 3.7%(+12.8)#29 | 3.1%(+13.4)#1,265 |
| 30. | Bennettsville | 16.2% | 3.7%(+12.5)#30 | 3.1%(+13.1)#1,288 |
| 31. | Dovesville | 16.2% | 3.7%(+12.5)#31 | 3.1%(+13.1)#1,293 |
| 32. | Mccormick | 15.3% | 3.7%(+11.6)#32 | 3.1%(+12.2)#1,424 |
| 33. | City View | 14.8% | 3.7%(+11.1)#33 | 3.1%(+11.7)#1,490 |
| 34. | Summerton | 14.4% | 3.7%(+10.7)#34 | 3.1%(+11.3)#1,573 |
| 35. | Bamberg | 13.9% | 3.7%(+10.2)#35 | 3.1%(+10.8)#1,687 |
| 36. | Wedgefield | 13.8% | 3.7%(+10.1)#36 | 3.1%(+10.7)#1,701 |
| 37. | East Gaffney | 13.6% | 3.7%(+9.90)#37 | 3.1%(+10.5)#1,734 |
| 38. | Barnwell | 13.5% | 3.7%(+9.80)#38 | 3.1%(+10.4)#1,762 |
| 39. | Winnsboro | 13.4% | 3.7%(+9.70)#39 | 3.1%(+10.3)#1,785 |
| 40. | Great Falls | 13.4% | 3.7%(+9.70)#40 | 3.1%(+10.3)#1,789 |
| 41. | Pelzer | 13.4% | 3.7%(+9.70)#41 | 3.1%(+10.3)#1,790 |
| 42. | Iva | 13.4% | 3.7%(+9.70)#42 | 3.1%(+10.3)#1,791 |
| 43. | Pamplico | 13.1% | 3.7%(+9.40)#43 | 3.1%(+10.00)#1,860 |
| 44. | St Andrews | 12.8% | 3.7%(+9.10)#44 | 3.1%(+9.70)#1,907 |
| 45. | Gray Court | 12.7% | 3.7%(+9.00)#45 | 3.1%(+9.60)#1,949 |
| 46. | Springfield | 12.7% | 3.7%(+9.00)#46 | 3.1%(+9.60)#1,954 |
| 47. | Chesterfield | 12.3% | 3.7%(+8.60)#47 | 3.1%(+9.20)#2,049 |
| 48. | Gantt | 11.8% | 3.7%(+8.10)#48 | 3.1%(+8.70)#2,175 |
| 49. | Jefferson | 11.8% | 3.7%(+8.10)#49 | 3.1%(+8.70)#2,192 |
| 50. | Branchville | 11.6% | 3.7%(+7.90)#50 | 3.1%(+8.50)#2,243 |
| 51. | Olanta | 11.6% | 3.7%(+7.90)#51 | 3.1%(+8.50)#2,257 |
| 52. | Williston | 11.5% | 3.7%(+7.80)#52 | 3.1%(+8.40)#2,281 |
| 53. | St Stephen | 11.5% | 3.7%(+7.80)#53 | 3.1%(+8.40)#2,287 |
| 54. | Olar | 11.4% | 3.7%(+7.70)#54 | 3.1%(+8.30)#2,345 |
| 55. | Clinton | 11.2% | 3.7%(+7.50)#55 | 3.1%(+8.10)#2,380 |
| 56. | Abbeville | 11.2% | 3.7%(+7.50)#56 | 3.1%(+8.10)#2,384 |
| 57. | Andrews | 11.2% | 3.7%(+7.50)#57 | 3.1%(+8.10)#2,387 |
| 58. | Arkwright | 11.2% | 3.7%(+7.50)#58 | 3.1%(+8.10)#2,389 |
| 59. | Piedmont | 11.1% | 3.7%(+7.40)#59 | 3.1%(+8.00)#2,408 |
| 60. | Bonneau | 10.8% | 3.7%(+7.10)#60 | 3.1%(+7.70)#2,535 |
| 61. | Dentsville | 10.5% | 3.7%(+6.80)#61 | 3.1%(+7.40)#2,629 |
| 62. | Homeland Park | 10.5% | 3.7%(+6.80)#62 | 3.1%(+7.40)#2,632 |
| 63. | Irwin | 10.3% | 3.7%(+6.60)#63 | 3.1%(+7.20)#2,717 |
| 64. | Ridge Spring | 10.1% | 3.7%(+6.40)#64 | 3.1%(+7.00)#2,808 |
| 65. | Eastover | 10.1% | 3.7%(+6.40)#65 | 3.1%(+7.00)#2,810 |
| 66. | Norris | 10.0% | 3.7%(+6.30)#66 | 3.1%(+6.90)#2,852 |
| 67. | Lockhart | 10.0% | 3.7%(+6.30)#67 | 3.1%(+6.90)#2,855 |
| 68. | Honea Path | 9.8% | 3.7%(+6.10)#68 | 3.1%(+6.70)#2,936 |
| 69. | Pageland | 9.8% | 3.7%(+6.10)#69 | 3.1%(+6.70)#2,939 |
| 70. | Blacksburg | 9.8% | 3.7%(+6.10)#70 | 3.1%(+6.70)#2,944 |
| 71. | Cheraw | 9.7% | 3.7%(+6.00)#71 | 3.1%(+6.60)#2,986 |
| 72. | Capitol View | 9.7% | 3.7%(+6.00)#72 | 3.1%(+6.60)#2,991 |
| 73. | Blackville | 9.7% | 3.7%(+6.00)#73 | 3.1%(+6.60)#3,003 |
| 74. | Elloree | 9.7% | 3.7%(+6.00)#74 | 3.1%(+6.60)#3,008 |
| 75. | Camden | 9.6% | 3.7%(+5.90)#75 | 3.1%(+6.50)#3,031 |
| 76. | Jonesville | 9.6% | 3.7%(+5.90)#76 | 3.1%(+6.50)#3,050 |
| 77. | Denmark | 9.2% | 3.7%(+5.50)#77 | 3.1%(+6.10)#3,230 |
| 78. | Newtown | 9.2% | 3.7%(+5.50)#78 | 3.1%(+6.10)#3,248 |
| 79. | Woodfield | 9.1% | 3.7%(+5.40)#79 | 3.1%(+6.00)#3,271 |
| 80. | Seneca | 9.1% | 3.7%(+5.40)#80 | 3.1%(+6.00)#3,272 |
| 81. | Eutawville | 9.1% | 3.7%(+5.40)#81 | 3.1%(+6.00)#3,310 |
| 82. | Loris | 9.0% | 3.7%(+5.30)#82 | 3.1%(+5.90)#3,356 |
| 83. | Mullins | 8.9% | 3.7%(+5.20)#83 | 3.1%(+5.80)#3,392 |
| 84. | Bowman | 8.8% | 3.7%(+5.10)#84 | 3.1%(+5.70)#3,469 |
| 85. | Anderson | 8.7% | 3.7%(+5.00)#85 | 3.1%(+5.60)#3,492 |
| 86. | Dunbar | 8.7% | 3.7%(+5.00)#86 | 3.1%(+5.60)#3,521 |
| 87. | Lake View | 8.7% | 3.7%(+5.00)#87 | 3.1%(+5.60)#3,526 |
| 88. | Judson | 8.5% | 3.7%(+4.80)#88 | 3.1%(+5.40)#3,626 |
| 89. | Luray | 8.3% | 3.7%(+4.60)#89 | 3.1%(+5.20)#3,749 |
| 90. | Mccoll | 8.2% | 3.7%(+4.50)#90 | 3.1%(+5.10)#3,783 |
| 91. | Wallace | 8.1% | 3.7%(+4.40)#91 | 3.1%(+5.00)#3,858 |
| 92. | Allendale | 8.0% | 3.7%(+4.30)#92 | 3.1%(+4.90)#3,896 |
| 93. | Laurens | 7.9% | 3.7%(+4.20)#93 | 3.1%(+4.80)#3,952 |
| 94. | Chester | 7.9% | 3.7%(+4.20)#94 | 3.1%(+4.80)#3,958 |
| 95. | Greeleyville | 7.9% | 3.7%(+4.20)#95 | 3.1%(+4.80)#3,995 |
| 96. | Surfside Beach | 7.8% | 3.7%(+4.10)#96 | 3.1%(+4.70)#4,029 |
| 97. | Coward | 7.8% | 3.7%(+4.10)#97 | 3.1%(+4.70)#4,059 |
| 98. | Johnsonville | 7.7% | 3.7%(+4.00)#98 | 3.1%(+4.60)#4,113 |
| 99. | Spartanburg | 7.5% | 3.7%(+3.80)#99 | 3.1%(+4.40)#4,208 |
| 100. | Carolina Forest | 7.5% | 3.7%(+3.80)#100 | 3.1%(+4.40)#4,210 |
Common Questions
What are the Top 10 Cities with the Highest Percentage of Families with Income Below $10,000 in South Carolina?
Top 10 Cities with the Highest Percentage of Families with Income Below $10,000 in South Carolina are:
#1
83.9%
#2
42.4%
#3
34.6%
#4
29.5%
#5
26.2%
#6
23.9%
#7
23.2%
#8
22.7%
#9
22.5%
#10
22.1%
What city has the Highest Percentage of Families with Income Below $10,000 in South Carolina?
Bradley has the Highest Percentage of Families with Income Below $10,000 in South Carolina with 83.9%.
What is the Percentage of Families with Income Below $10,000 in the State of South Carolina?
Percentage of Families with Income Below $10,000 in South Carolina is 3.7%.
What is the Percentage of Families with Income Below $10,000 in the United States?
Percentage of Families with Income Below $10,000 in the United States is 3.1%.