Cities with the Highest Percentage of Families with Income Below $10,000 in New Mexico
RELATED REPORTS & OPTIONS
Family Income | $0-10k
New Mexico
Compare Cities
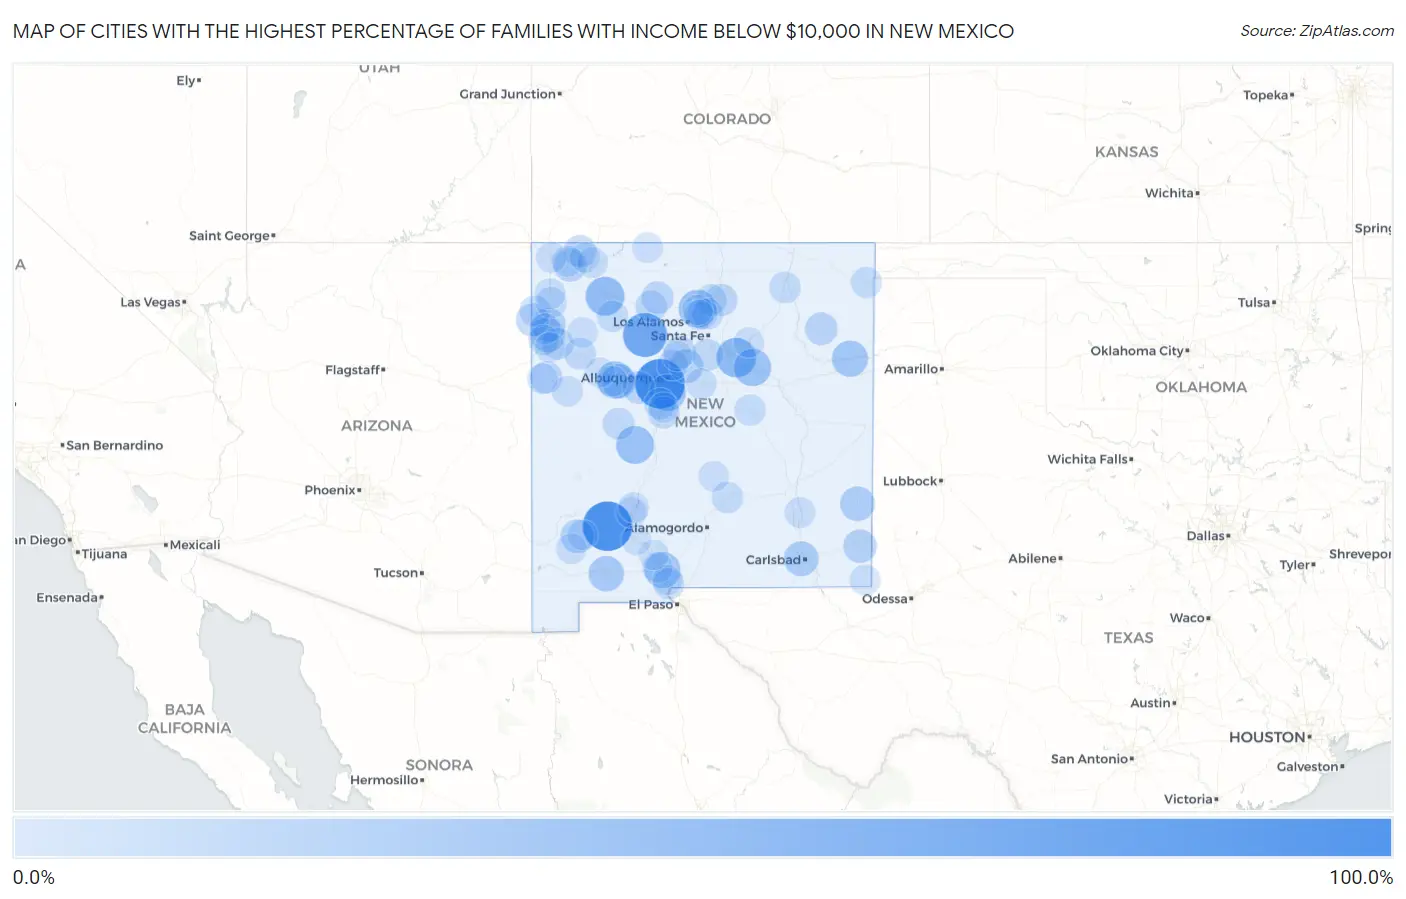
Map of Cities with the Highest Percentage of Families with Income Below $10,000 in New Mexico
0.0%
100.0%
Cities with the Highest Percentage of Families with Income Below $10,000 in New Mexico
| City | Families with Income < $10k | vs State | vs National | |
| 1. | Homer C Jones | 100.0% | 4.6%(+95.4)#1 | 3.1%(+96.9)#2 |
| 2. | Pajarito Mesa | 100.0% | 4.6%(+95.4)#2 | 3.1%(+96.9)#4 |
| 3. | Kingston | 100.0% | 4.6%(+95.4)#3 | 3.1%(+96.9)#13 |
| 4. | Encantado | 100.0% | 4.6%(+95.4)#4 | 3.1%(+96.9)#17 |
| 5. | San Luis | 73.3% | 4.6%(+68.7)#5 | 3.1%(+70.2)#59 |
| 6. | Ribera | 52.1% | 4.6%(+47.5)#6 | 3.1%(+49.0)#112 |
| 7. | Candy Kitchen | 50.0% | 4.6%(+45.4)#7 | 3.1%(+46.9)#128 |
| 8. | La Bajada | 50.0% | 4.6%(+45.4)#8 | 3.1%(+46.9)#134 |
| 9. | Nageezi | 48.4% | 4.6%(+43.8)#9 | 3.1%(+45.3)#142 |
| 10. | Magdalena | 43.6% | 4.6%(+39.0)#10 | 3.1%(+40.5)#174 |
| 11. | El Duende | 42.9% | 4.6%(+38.3)#11 | 3.1%(+39.8)#180 |
| 12. | Tecolotito | 42.0% | 4.6%(+37.4)#12 | 3.1%(+38.9)#191 |
| 13. | Manuelito | 41.7% | 4.6%(+37.1)#13 | 3.1%(+38.6)#195 |
| 14. | South Acomita Village | 40.7% | 4.6%(+36.1)#14 | 3.1%(+37.6)#201 |
| 15. | Chical | 39.1% | 4.6%(+34.5)#15 | 3.1%(+36.0)#229 |
| 16. | Logan | 35.9% | 4.6%(+31.3)#16 | 3.1%(+32.8)#278 |
| 17. | University Park | 35.8% | 4.6%(+31.2)#17 | 3.1%(+32.7)#282 |
| 18. | Borrego Pass | 35.0% | 4.6%(+30.4)#18 | 3.1%(+31.9)#295 |
| 19. | La Hacienda | 32.2% | 4.6%(+27.6)#19 | 3.1%(+29.1)#353 |
| 20. | Pinedale | 31.1% | 4.6%(+26.5)#20 | 3.1%(+28.0)#376 |
| 21. | Gamerco | 30.1% | 4.6%(+25.5)#21 | 3.1%(+27.0)#407 |
| 22. | Happy Valley | 29.7% | 4.6%(+25.1)#22 | 3.1%(+26.6)#416 |
| 23. | Tatum | 28.8% | 4.6%(+24.2)#23 | 3.1%(+25.7)#442 |
| 24. | Seama | 28.4% | 4.6%(+23.8)#24 | 3.1%(+25.3)#457 |
| 25. | Twin Lakes | 28.1% | 4.6%(+23.5)#25 | 3.1%(+25.0)#464 |
| 26. | Jamestown | 27.5% | 4.6%(+22.9)#26 | 3.1%(+24.4)#490 |
| 27. | Haystack | 25.9% | 4.6%(+21.3)#27 | 3.1%(+22.8)#552 |
| 28. | Tohatchi | 25.3% | 4.6%(+20.7)#28 | 3.1%(+22.2)#576 |
| 29. | La Madera | 25.3% | 4.6%(+20.7)#29 | 3.1%(+22.2)#579 |
| 30. | Rosedale | 24.5% | 4.6%(+19.9)#30 | 3.1%(+21.4)#620 |
| 31. | Monument | 23.6% | 4.6%(+19.0)#31 | 3.1%(+20.5)#667 |
| 32. | Ojo Amarillo | 22.8% | 4.6%(+18.2)#32 | 3.1%(+19.7)#711 |
| 33. | Torreon Cdp Sandoval County | 22.6% | 4.6%(+18.0)#33 | 3.1%(+19.5)#724 |
| 34. | Navajo | 21.4% | 4.6%(+16.8)#34 | 3.1%(+18.3)#792 |
| 35. | Prewitt | 20.9% | 4.6%(+16.3)#35 | 3.1%(+17.8)#827 |
| 36. | Mosquero | 20.0% | 4.6%(+15.4)#36 | 3.1%(+16.9)#915 |
| 37. | Highland Meadows | 19.7% | 4.6%(+15.1)#37 | 3.1%(+16.6)#933 |
| 38. | Williams Acres | 18.3% | 4.6%(+13.7)#38 | 3.1%(+15.2)#1,066 |
| 39. | Totah Vista | 18.3% | 4.6%(+13.7)#39 | 3.1%(+15.2)#1,067 |
| 40. | Gallina | 18.2% | 4.6%(+13.6)#40 | 3.1%(+15.1)#1,078 |
| 41. | Picuris Pueblo | 18.2% | 4.6%(+13.6)#41 | 3.1%(+15.1)#1,088 |
| 42. | La Plata | 18.0% | 4.6%(+13.4)#42 | 3.1%(+14.9)#1,106 |
| 43. | Becenti | 17.6% | 4.6%(+13.0)#43 | 3.1%(+14.5)#1,143 |
| 44. | San Felipe Pueblo | 17.5% | 4.6%(+12.9)#44 | 3.1%(+14.4)#1,154 |
| 45. | Black Rock | 17.2% | 4.6%(+12.6)#45 | 3.1%(+14.1)#1,182 |
| 46. | Madrone | 16.7% | 4.6%(+12.1)#46 | 3.1%(+13.6)#1,246 |
| 47. | Galisteo | 16.2% | 4.6%(+11.6)#47 | 3.1%(+13.1)#1,295 |
| 48. | Angustura | 16.1% | 4.6%(+11.5)#48 | 3.1%(+13.0)#1,307 |
| 49. | Church Rock | 16.1% | 4.6%(+11.5)#49 | 3.1%(+13.0)#1,309 |
| 50. | Alamo | 16.0% | 4.6%(+11.4)#50 | 3.1%(+12.9)#1,317 |
| 51. | Thoreau | 15.6% | 4.6%(+11.0)#51 | 3.1%(+12.5)#1,367 |
| 52. | La Jara | 15.4% | 4.6%(+10.8)#52 | 3.1%(+12.3)#1,411 |
| 53. | Iyanbito | 15.2% | 4.6%(+10.6)#53 | 3.1%(+12.1)#1,438 |
| 54. | Belen | 14.6% | 4.6%(+10.00)#54 | 3.1%(+11.5)#1,530 |
| 55. | Springer | 14.5% | 4.6%(+9.90)#55 | 3.1%(+11.4)#1,551 |
| 56. | Ruidoso Downs | 14.3% | 4.6%(+9.70)#56 | 3.1%(+11.2)#1,584 |
| 57. | Dixon | 14.3% | 4.6%(+9.70)#57 | 3.1%(+11.2)#1,590 |
| 58. | Pueblo Pintado | 14.1% | 4.6%(+9.50)#58 | 3.1%(+11.0)#1,657 |
| 59. | Chimayo | 14.0% | 4.6%(+9.40)#59 | 3.1%(+10.9)#1,668 |
| 60. | Crystal | 13.5% | 4.6%(+8.90)#60 | 3.1%(+10.4)#1,777 |
| 61. | Berino | 13.2% | 4.6%(+8.60)#61 | 3.1%(+10.1)#1,836 |
| 62. | Vaughn | 12.8% | 4.6%(+8.20)#62 | 3.1%(+9.70)#1,924 |
| 63. | Nenahnezad | 12.7% | 4.6%(+8.10)#63 | 3.1%(+9.60)#1,956 |
| 64. | Clayton | 12.4% | 4.6%(+7.80)#64 | 3.1%(+9.30)#2,023 |
| 65. | Sheep Springs | 12.3% | 4.6%(+7.70)#65 | 3.1%(+9.20)#2,056 |
| 66. | Newcomb | 12.2% | 4.6%(+7.60)#66 | 3.1%(+9.10)#2,080 |
| 67. | Pueblo Of Sandia Village | 12.1% | 4.6%(+7.50)#67 | 3.1%(+9.00)#2,110 |
| 68. | Williamsburg | 11.7% | 4.6%(+7.10)#68 | 3.1%(+8.60)#2,225 |
| 69. | Hagerman | 11.4% | 4.6%(+6.80)#69 | 3.1%(+8.30)#2,332 |
| 70. | Tortugas | 11.4% | 4.6%(+6.80)#70 | 3.1%(+8.30)#2,333 |
| 71. | Nakaibito | 11.3% | 4.6%(+6.70)#71 | 3.1%(+8.20)#2,375 |
| 72. | Moriarty | 10.9% | 4.6%(+6.30)#72 | 3.1%(+7.80)#2,488 |
| 73. | Pinehill | 10.9% | 4.6%(+6.30)#73 | 3.1%(+7.80)#2,503 |
| 74. | Jal | 10.8% | 4.6%(+6.20)#74 | 3.1%(+7.70)#2,521 |
| 75. | Bloomfield | 10.7% | 4.6%(+6.10)#75 | 3.1%(+7.60)#2,550 |
| 76. | Rock Springs | 10.7% | 4.6%(+6.10)#76 | 3.1%(+7.60)#2,563 |
| 77. | White Signal | 10.6% | 4.6%(+6.00)#77 | 3.1%(+7.50)#2,624 |
| 78. | Dulce | 10.5% | 4.6%(+5.90)#78 | 3.1%(+7.40)#2,644 |
| 79. | Fairacres | 10.4% | 4.6%(+5.80)#79 | 3.1%(+7.30)#2,682 |
| 80. | Shiprock | 10.3% | 4.6%(+5.70)#80 | 3.1%(+7.20)#2,703 |
| 81. | Ojo Encino | 10.3% | 4.6%(+5.70)#81 | 3.1%(+7.20)#2,728 |
| 82. | Santa Cruz | 10.3% | 4.6%(+5.70)#82 | 3.1%(+7.20)#2,737 |
| 83. | Zuni Pueblo | 10.2% | 4.6%(+5.60)#83 | 3.1%(+7.10)#2,756 |
| 84. | Truth Or Consequences | 10.2% | 4.6%(+5.60)#84 | 3.1%(+7.10)#2,758 |
| 85. | Las Vegas | 10.0% | 4.6%(+5.40)#85 | 3.1%(+6.90)#2,822 |
| 86. | Crownpoint | 9.9% | 4.6%(+5.30)#86 | 3.1%(+6.80)#2,904 |
| 87. | Carrizozo | 9.7% | 4.6%(+5.10)#87 | 3.1%(+6.60)#3,006 |
| 88. | Skyline Ganipa | 9.6% | 4.6%(+5.00)#88 | 3.1%(+6.50)#3,045 |
| 89. | Santa Clara | 9.5% | 4.6%(+4.90)#89 | 3.1%(+6.40)#3,081 |
| 90. | San Jose Cdp Rio Arriba County | 9.5% | 4.6%(+4.90)#90 | 3.1%(+6.40)#3,094 |
| 91. | Hernandez | 9.3% | 4.6%(+4.70)#91 | 3.1%(+6.20)#3,197 |
| 92. | Gallup | 9.0% | 4.6%(+4.40)#92 | 3.1%(+5.90)#3,333 |
| 93. | Vado | 9.0% | 4.6%(+4.40)#93 | 3.1%(+5.90)#3,352 |
| 94. | Radium Springs | 9.0% | 4.6%(+4.40)#94 | 3.1%(+5.90)#3,361 |
| 95. | Salem | 9.0% | 4.6%(+4.40)#95 | 3.1%(+5.90)#3,370 |
| 96. | Flora Vista | 8.9% | 4.6%(+4.30)#96 | 3.1%(+5.80)#3,401 |
| 97. | Santa Clara Pueblo | 8.8% | 4.6%(+4.20)#97 | 3.1%(+5.70)#3,465 |
| 98. | Grants | 8.5% | 4.6%(+3.90)#98 | 3.1%(+5.40)#3,611 |
| 99. | Rio Communities | 8.5% | 4.6%(+3.90)#99 | 3.1%(+5.40)#3,617 |
| 100. | Algodones | 8.4% | 4.6%(+3.80)#100 | 3.1%(+5.30)#3,682 |
Common Questions
What are the Top 10 Cities with the Highest Percentage of Families with Income Below $10,000 in New Mexico?
Top 10 Cities with the Highest Percentage of Families with Income Below $10,000 in New Mexico are:
#1
100.0%
#2
100.0%
#3
73.3%
#4
52.1%
#5
48.4%
#6
43.6%
#7
42.9%
#8
42.0%
#9
40.7%
#10
39.1%
What city has the Highest Percentage of Families with Income Below $10,000 in New Mexico?
Pajarito Mesa has the Highest Percentage of Families with Income Below $10,000 in New Mexico with 100.0%.
What is the Percentage of Families with Income Below $10,000 in the State of New Mexico?
Percentage of Families with Income Below $10,000 in New Mexico is 4.6%.
What is the Percentage of Families with Income Below $10,000 in the United States?
Percentage of Families with Income Below $10,000 in the United States is 3.1%.