Cities with the Highest Percentage of Families with Income Below $10,000 in Michigan
RELATED REPORTS & OPTIONS
Family Income | $0-10k
Michigan
Compare Cities
Map of Cities with the Highest Percentage of Families with Income Below $10,000 in Michigan
0.0%
25.0%
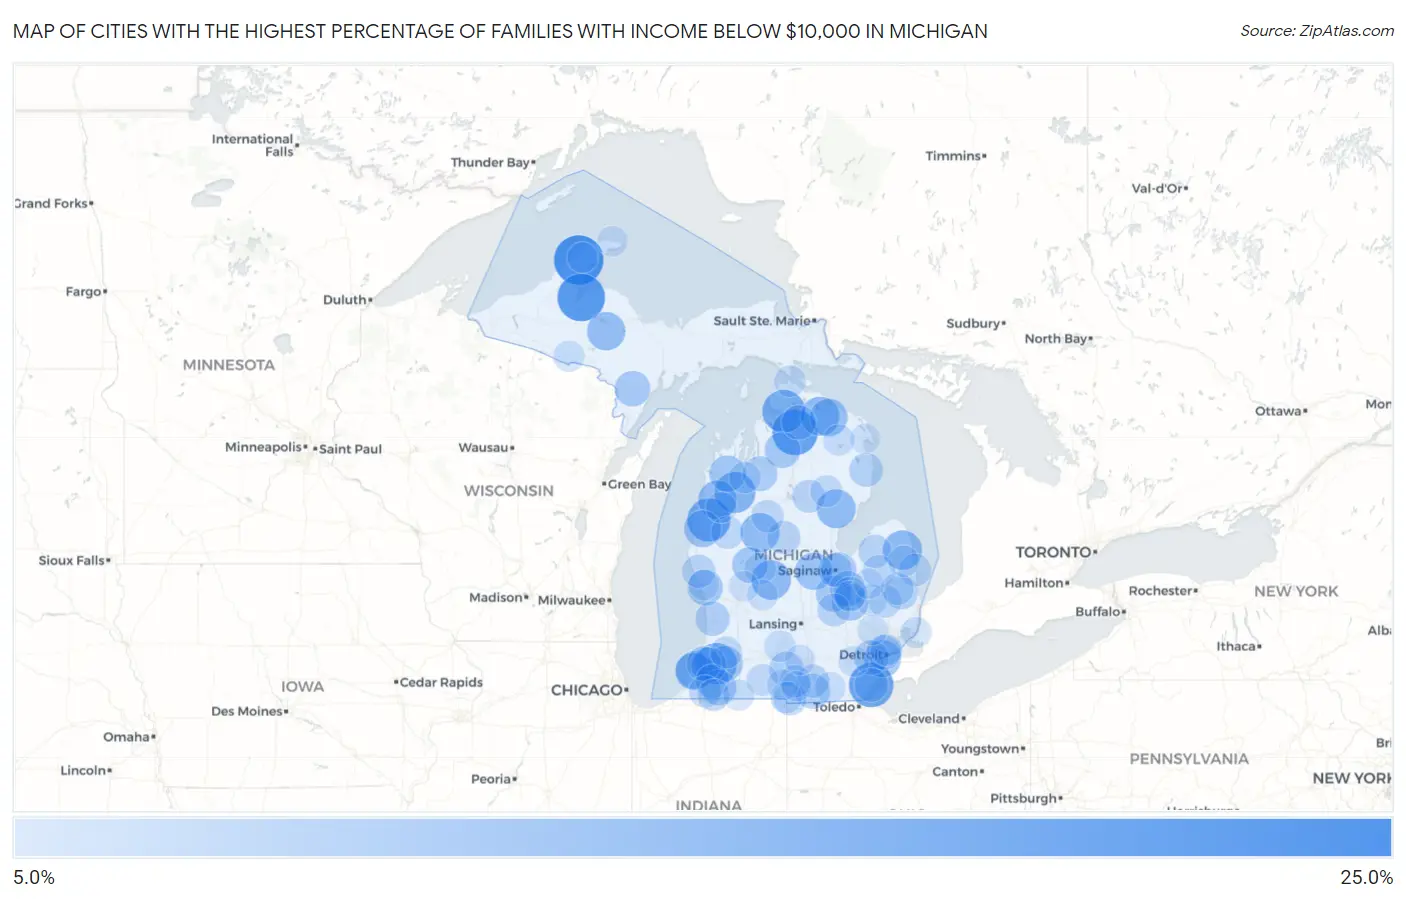
Cities with the Highest Percentage of Families with Income Below $10,000 in Michigan
| City | Families with Income < $10k | vs State | vs National | |
| 1. | Calumet | 24.4% | 3.0%(+21.4)#1 | 3.1%(+21.3)#623 |
| 2. | Zeba | 22.5% | 3.0%(+19.5)#2 | 3.1%(+19.4)#734 |
| 3. | Vanderbilt | 20.5% | 3.0%(+17.5)#3 | 3.1%(+17.4)#859 |
| 4. | Detroit Beach | 19.7% | 3.0%(+16.7)#4 | 3.1%(+16.6)#928 |
| 5. | Fountain | 18.4% | 3.0%(+15.4)#5 | 3.1%(+15.3)#1,056 |
| 6. | Conway | 18.2% | 3.0%(+15.2)#6 | 3.1%(+15.1)#1,086 |
| 7. | Lawrence | 16.9% | 3.0%(+13.9)#7 | 3.1%(+13.8)#1,218 |
| 8. | Mesick | 16.3% | 3.0%(+13.3)#8 | 3.1%(+13.2)#1,286 |
| 9. | Kincheloe | 15.5% | 3.0%(+12.5)#9 | 3.1%(+12.4)#1,383 |
| 10. | Stanton | 14.9% | 3.0%(+11.9)#10 | 3.1%(+11.8)#1,474 |
| 11. | Mohawk | 14.8% | 3.0%(+11.8)#11 | 3.1%(+11.7)#1,500 |
| 12. | Minden City | 14.8% | 3.0%(+11.8)#12 | 3.1%(+11.7)#1,503 |
| 13. | Evart | 14.6% | 3.0%(+11.6)#13 | 3.1%(+11.5)#1,536 |
| 14. | Onaway | 14.6% | 3.0%(+11.6)#14 | 3.1%(+11.5)#1,539 |
| 15. | Prescott | 14.6% | 3.0%(+11.6)#15 | 3.1%(+11.5)#1,543 |
| 16. | Cambria | 14.6% | 3.0%(+11.6)#16 | 3.1%(+11.5)#1,545 |
| 17. | Brethren | 14.4% | 3.0%(+11.4)#17 | 3.1%(+11.3)#1,578 |
| 18. | Riverdale | 14.1% | 3.0%(+11.1)#18 | 3.1%(+11.0)#1,656 |
| 19. | Republic | 13.9% | 3.0%(+10.9)#19 | 3.1%(+10.8)#1,691 |
| 20. | Benton Heights | 13.5% | 3.0%(+10.5)#20 | 3.1%(+10.4)#1,763 |
| 21. | Millersburg | 13.3% | 3.0%(+10.3)#21 | 3.1%(+10.2)#1,820 |
| 22. | Merrill | 13.0% | 3.0%(+10.00)#22 | 3.1%(+9.90)#1,878 |
| 23. | Benton Harbor | 12.9% | 3.0%(+9.90)#23 | 3.1%(+9.80)#1,889 |
| 24. | River Rouge | 12.9% | 3.0%(+9.90)#24 | 3.1%(+9.80)#1,890 |
| 25. | Scottville | 12.8% | 3.0%(+9.80)#25 | 3.1%(+9.70)#1,915 |
| 26. | Flint | 12.2% | 3.0%(+9.20)#26 | 3.1%(+9.10)#2,064 |
| 27. | Bendon | 12.2% | 3.0%(+9.20)#27 | 3.1%(+9.10)#2,084 |
| 28. | New Lothrop | 11.7% | 3.0%(+8.70)#28 | 3.1%(+8.60)#2,226 |
| 29. | Lakes Of The North | 11.6% | 3.0%(+8.60)#29 | 3.1%(+8.50)#2,247 |
| 30. | Morley | 11.6% | 3.0%(+8.60)#30 | 3.1%(+8.50)#2,255 |
| 31. | Muskegon Heights | 11.5% | 3.0%(+8.50)#31 | 3.1%(+8.40)#2,269 |
| 32. | Paw Paw | 11.5% | 3.0%(+8.50)#32 | 3.1%(+8.40)#2,277 |
| 33. | Cassopolis | 11.4% | 3.0%(+8.40)#33 | 3.1%(+8.30)#2,321 |
| 34. | Powers | 11.4% | 3.0%(+8.40)#34 | 3.1%(+8.30)#2,341 |
| 35. | Buena Vista | 11.3% | 3.0%(+8.30)#35 | 3.1%(+8.20)#2,349 |
| 36. | Hartford | 11.3% | 3.0%(+8.30)#36 | 3.1%(+8.20)#2,355 |
| 37. | Clio | 11.3% | 3.0%(+8.30)#37 | 3.1%(+8.20)#2,356 |
| 38. | Hudson | 10.8% | 3.0%(+7.80)#38 | 3.1%(+7.70)#2,520 |
| 39. | South Boardman | 10.8% | 3.0%(+7.80)#39 | 3.1%(+7.70)#2,533 |
| 40. | Atlantic Mine | 10.8% | 3.0%(+7.80)#40 | 3.1%(+7.70)#2,536 |
| 41. | Detroit | 10.5% | 3.0%(+7.50)#41 | 3.1%(+7.40)#2,625 |
| 42. | Inkster | 10.5% | 3.0%(+7.50)#42 | 3.1%(+7.40)#2,626 |
| 43. | Paw Paw Lake | 10.4% | 3.0%(+7.40)#43 | 3.1%(+7.30)#2,671 |
| 44. | Wolverine | 10.4% | 3.0%(+7.40)#44 | 3.1%(+7.30)#2,697 |
| 45. | Homer | 10.3% | 3.0%(+7.30)#45 | 3.1%(+7.20)#2,720 |
| 46. | Beechwood | 10.2% | 3.0%(+7.20)#46 | 3.1%(+7.10)#2,764 |
| 47. | Dowagiac | 10.0% | 3.0%(+7.00)#47 | 3.1%(+6.90)#2,827 |
| 48. | Saginaw | 9.8% | 3.0%(+6.80)#48 | 3.1%(+6.70)#2,928 |
| 49. | Woodland Beach | 9.8% | 3.0%(+6.80)#49 | 3.1%(+6.70)#2,940 |
| 50. | Lincoln | 9.8% | 3.0%(+6.80)#50 | 3.1%(+6.70)#2,966 |
| 51. | Mount Morris | 9.7% | 3.0%(+6.70)#51 | 3.1%(+6.60)#2,993 |
| 52. | Yale | 9.7% | 3.0%(+6.70)#52 | 3.1%(+6.60)#3,002 |
| 53. | Whitehall | 9.4% | 3.0%(+6.40)#53 | 3.1%(+6.30)#3,127 |
| 54. | Farwell | 9.4% | 3.0%(+6.40)#54 | 3.1%(+6.30)#3,138 |
| 55. | Addison | 9.4% | 3.0%(+6.40)#55 | 3.1%(+6.30)#3,148 |
| 56. | Camden | 9.3% | 3.0%(+6.30)#56 | 3.1%(+6.20)#3,200 |
| 57. | Gagetown | 9.2% | 3.0%(+6.20)#57 | 3.1%(+6.10)#3,263 |
| 58. | St Helen | 9.0% | 3.0%(+6.00)#58 | 3.1%(+5.90)#3,354 |
| 59. | Lakeport | 9.0% | 3.0%(+6.00)#59 | 3.1%(+5.90)#3,371 |
| 60. | Durand | 8.9% | 3.0%(+5.90)#60 | 3.1%(+5.80)#3,395 |
| 61. | Imlay City | 8.8% | 3.0%(+5.80)#61 | 3.1%(+5.70)#3,447 |
| 62. | Port Sanilac | 8.8% | 3.0%(+5.80)#62 | 3.1%(+5.70)#3,466 |
| 63. | Baldwin | 8.7% | 3.0%(+5.70)#63 | 3.1%(+5.60)#3,522 |
| 64. | Marion | 8.7% | 3.0%(+5.70)#64 | 3.1%(+5.60)#3,528 |
| 65. | Kingston | 8.6% | 3.0%(+5.60)#65 | 3.1%(+5.50)#3,590 |
| 66. | Melvin | 8.6% | 3.0%(+5.60)#66 | 3.1%(+5.50)#3,599 |
| 67. | Jonesville | 8.4% | 3.0%(+5.40)#67 | 3.1%(+5.30)#3,671 |
| 68. | Niles | 8.3% | 3.0%(+5.30)#68 | 3.1%(+5.20)#3,704 |
| 69. | Edwardsburg | 8.3% | 3.0%(+5.30)#69 | 3.1%(+5.20)#3,724 |
| 70. | Gobles | 8.2% | 3.0%(+5.20)#70 | 3.1%(+5.10)#3,801 |
| 71. | Rose City | 8.2% | 3.0%(+5.20)#71 | 3.1%(+5.10)#3,804 |
| 72. | Hamtramck | 8.0% | 3.0%(+5.00)#72 | 3.1%(+4.90)#3,879 |
| 73. | Sherwood | 8.0% | 3.0%(+5.00)#73 | 3.1%(+4.90)#3,923 |
| 74. | Kingsley | 7.9% | 3.0%(+4.90)#74 | 3.1%(+4.80)#3,972 |
| 75. | Lakeview | 7.9% | 3.0%(+4.90)#75 | 3.1%(+4.80)#3,978 |
| 76. | Mackinaw City | 7.9% | 3.0%(+4.90)#76 | 3.1%(+4.80)#3,988 |
| 77. | Lapeer | 7.8% | 3.0%(+4.80)#77 | 3.1%(+4.70)#4,017 |
| 78. | Olivet | 7.8% | 3.0%(+4.80)#78 | 3.1%(+4.70)#4,040 |
| 79. | Montgomery | 7.7% | 3.0%(+4.70)#79 | 3.1%(+4.60)#4,131 |
| 80. | Hillman | 7.5% | 3.0%(+4.50)#80 | 3.1%(+4.40)#4,257 |
| 81. | Iron River | 7.4% | 3.0%(+4.40)#81 | 3.1%(+4.30)#4,302 |
| 82. | Quincy | 7.4% | 3.0%(+4.40)#82 | 3.1%(+4.30)#4,310 |
| 83. | Deckerville | 7.4% | 3.0%(+4.40)#83 | 3.1%(+4.30)#4,316 |
| 84. | White Pigeon | 7.3% | 3.0%(+4.30)#84 | 3.1%(+4.20)#4,400 |
| 85. | Palo | 7.3% | 3.0%(+4.30)#85 | 3.1%(+4.20)#4,430 |
| 86. | Adrian | 7.2% | 3.0%(+4.20)#86 | 3.1%(+4.10)#4,444 |
| 87. | Beecher | 7.2% | 3.0%(+4.20)#87 | 3.1%(+4.10)#4,451 |
| 88. | Ypsilanti | 7.1% | 3.0%(+4.10)#88 | 3.1%(+4.00)#4,513 |
| 89. | Belding | 7.1% | 3.0%(+4.10)#89 | 3.1%(+4.00)#4,522 |
| 90. | Algonac | 7.1% | 3.0%(+4.10)#90 | 3.1%(+4.00)#4,530 |
| 91. | Wellston | 7.1% | 3.0%(+4.10)#91 | 3.1%(+4.00)#4,585 |
| 92. | Copper City | 6.9% | 3.0%(+3.90)#92 | 3.1%(+3.80)#4,775 |
| 93. | Copper Harbor | 6.9% | 3.0%(+3.90)#93 | 3.1%(+3.80)#4,781 |
| 94. | Muskegon | 6.8% | 3.0%(+3.80)#94 | 3.1%(+3.70)#4,785 |
| 95. | Fostoria | 6.8% | 3.0%(+3.80)#95 | 3.1%(+3.70)#4,831 |
| 96. | Parma | 6.8% | 3.0%(+3.80)#96 | 3.1%(+3.70)#4,839 |
| 97. | Pontiac | 6.7% | 3.0%(+3.70)#97 | 3.1%(+3.60)#4,866 |
| 98. | Cedar Springs | 6.7% | 3.0%(+3.70)#98 | 3.1%(+3.60)#4,891 |
| 99. | Alpena | 6.6% | 3.0%(+3.60)#99 | 3.1%(+3.50)#4,974 |
| 100. | Hillsdale | 6.6% | 3.0%(+3.60)#100 | 3.1%(+3.50)#4,979 |
Common Questions
What are the Top 10 Cities with the Highest Percentage of Families with Income Below $10,000 in Michigan?
Top 10 Cities with the Highest Percentage of Families with Income Below $10,000 in Michigan are:
#1
24.4%
#2
22.5%
#3
20.5%
#4
19.7%
#5
18.4%
#6
18.2%
#7
16.9%
#8
16.3%
#9
14.9%
#10
14.8%
What city has the Highest Percentage of Families with Income Below $10,000 in Michigan?
Calumet has the Highest Percentage of Families with Income Below $10,000 in Michigan with 24.4%.
What is the Percentage of Families with Income Below $10,000 in the State of Michigan?
Percentage of Families with Income Below $10,000 in Michigan is 3.0%.
What is the Percentage of Families with Income Below $10,000 in the United States?
Percentage of Families with Income Below $10,000 in the United States is 3.1%.