Cities with the Highest Percentage of Families with Income Below $10,000 in Wisconsin
RELATED REPORTS & OPTIONS
Family Income | $0-10k
Wisconsin
Compare Cities
Map of Cities with the Highest Percentage of Families with Income Below $10,000 in Wisconsin
0.0%
40.0%
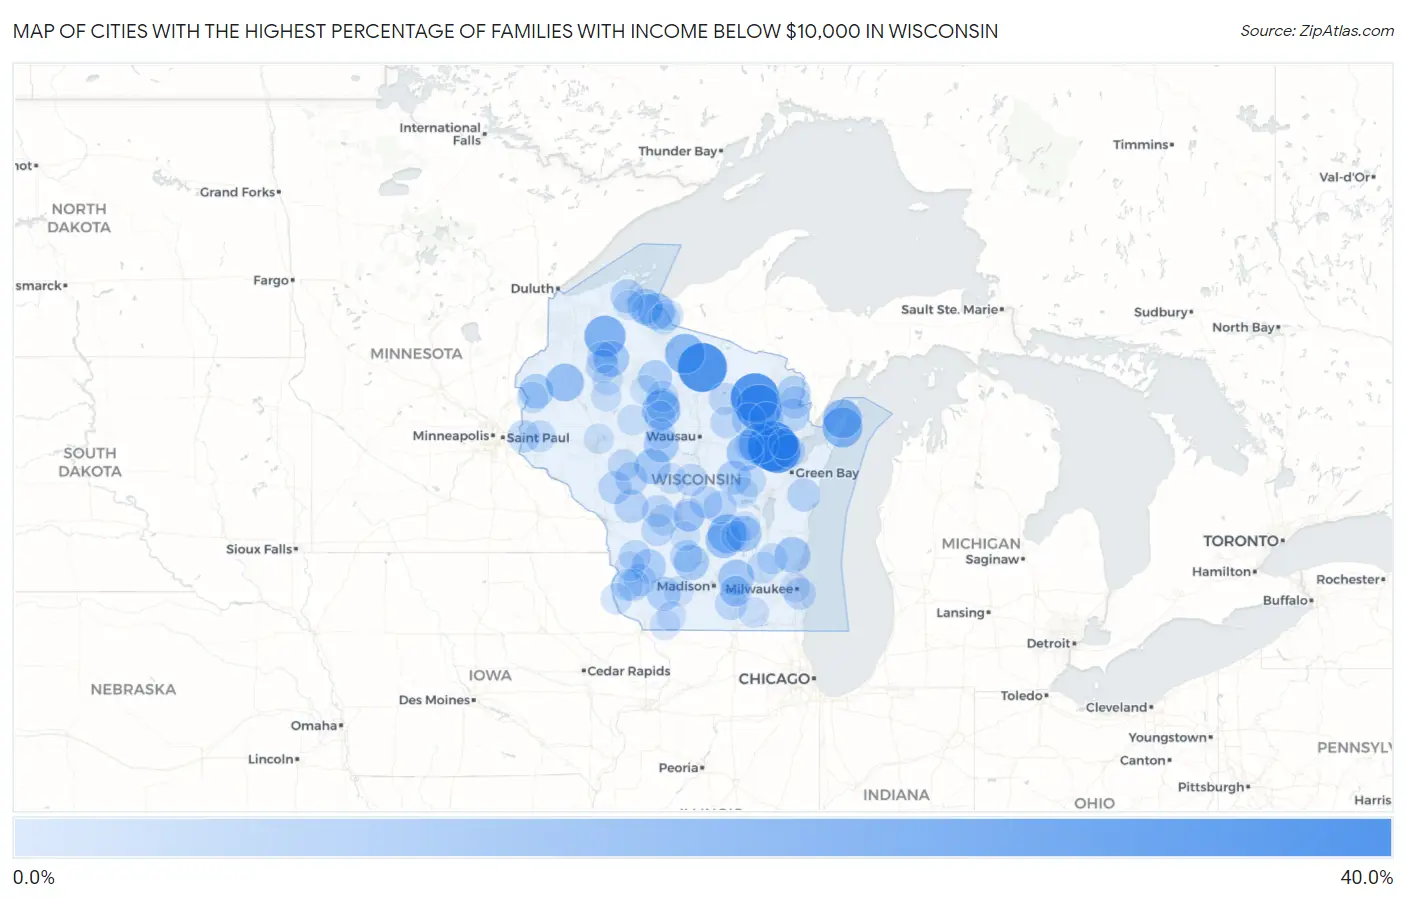
Cities with the Highest Percentage of Families with Income Below $10,000 in Wisconsin
| City | Families with Income < $10k | vs State | vs National | |
| 1. | Pulcifer | 32.6% | 2.3%(+30.3)#1 | 3.1%(+29.5)#345 |
| 2. | Lake Tomahawk | 31.6% | 2.3%(+29.3)#2 | 3.1%(+28.5)#364 |
| 3. | Wabeno | 31.0% | 2.3%(+28.7)#3 | 3.1%(+27.9)#381 |
| 4. | Green Valley | 27.8% | 2.3%(+25.5)#4 | 3.1%(+24.7)#479 |
| 5. | Townsend | 26.9% | 2.3%(+24.6)#5 | 3.1%(+23.8)#511 |
| 6. | Cable | 20.7% | 2.3%(+18.4)#6 | 3.1%(+17.6)#843 |
| 7. | Keshena | 19.2% | 2.3%(+16.9)#7 | 3.1%(+16.1)#983 |
| 8. | Lac Du Flambeau | 18.8% | 2.3%(+16.5)#8 | 3.1%(+15.7)#1,016 |
| 9. | Baileys Harbor | 18.8% | 2.3%(+16.5)#9 | 3.1%(+15.7)#1,023 |
| 10. | Marquette | 17.3% | 2.3%(+15.0)#10 | 3.1%(+14.2)#1,175 |
| 11. | Sister Bay | 17.1% | 2.3%(+14.8)#11 | 3.1%(+14.0)#1,193 |
| 12. | Chelsea | 16.7% | 2.3%(+14.4)#12 | 3.1%(+13.6)#1,252 |
| 13. | Barronett | 15.8% | 2.3%(+13.5)#13 | 3.1%(+12.7)#1,352 |
| 14. | Saxon | 14.3% | 2.3%(+12.0)#14 | 3.1%(+11.2)#1,617 |
| 15. | Leopolis | 14.3% | 2.3%(+12.0)#15 | 3.1%(+11.2)#1,619 |
| 16. | Dalton | 13.8% | 2.3%(+11.5)#16 | 3.1%(+10.7)#1,713 |
| 17. | Waterloo | 13.3% | 2.3%(+11.0)#17 | 3.1%(+10.2)#1,804 |
| 18. | Waubeka | 13.2% | 2.3%(+10.9)#18 | 3.1%(+10.1)#1,841 |
| 19. | New Post | 13.2% | 2.3%(+10.9)#19 | 3.1%(+10.1)#1,846 |
| 20. | Fairwater | 13.0% | 2.3%(+10.7)#20 | 3.1%(+9.90)#1,884 |
| 21. | Granton | 12.9% | 2.3%(+10.6)#21 | 3.1%(+9.80)#1,903 |
| 22. | Bluffview | 12.2% | 2.3%(+9.90)#22 | 3.1%(+9.10)#2,076 |
| 23. | Franks Field | 12.1% | 2.3%(+9.80)#23 | 3.1%(+9.00)#2,118 |
| 24. | Unity | 11.9% | 2.3%(+9.60)#24 | 3.1%(+8.80)#2,165 |
| 25. | Milltown | 11.6% | 2.3%(+9.30)#25 | 3.1%(+8.50)#2,251 |
| 26. | Boaz | 11.1% | 2.3%(+8.80)#26 | 3.1%(+8.00)#2,444 |
| 27. | Phillips | 11.0% | 2.3%(+8.70)#27 | 3.1%(+7.90)#2,469 |
| 28. | Ogdensburg | 10.6% | 2.3%(+8.30)#28 | 3.1%(+7.50)#2,621 |
| 29. | Edmund | 10.6% | 2.3%(+8.30)#29 | 3.1%(+7.50)#2,623 |
| 30. | Washburn | 10.4% | 2.3%(+8.10)#30 | 3.1%(+7.30)#2,676 |
| 31. | White Lake | 10.3% | 2.3%(+8.00)#31 | 3.1%(+7.20)#2,736 |
| 32. | Westboro | 10.2% | 2.3%(+7.90)#32 | 3.1%(+7.10)#2,787 |
| 33. | Mountain | 10.1% | 2.3%(+7.80)#33 | 3.1%(+7.00)#2,817 |
| 34. | Cataract | 10.0% | 2.3%(+7.70)#34 | 3.1%(+6.90)#2,872 |
| 35. | Paac Ciinak | 10.0% | 2.3%(+7.70)#35 | 3.1%(+6.90)#2,885 |
| 36. | Amberg | 9.7% | 2.3%(+7.40)#36 | 3.1%(+6.60)#3,024 |
| 37. | Crivitz | 9.6% | 2.3%(+7.30)#37 | 3.1%(+6.50)#3,044 |
| 38. | Kellnersville | 9.6% | 2.3%(+7.30)#38 | 3.1%(+6.50)#3,062 |
| 39. | Wautoma | 9.5% | 2.3%(+7.20)#39 | 3.1%(+6.40)#3,079 |
| 40. | Taylor | 9.5% | 2.3%(+7.20)#40 | 3.1%(+6.40)#3,106 |
| 41. | Abrams | 9.4% | 2.3%(+7.10)#41 | 3.1%(+6.30)#3,158 |
| 42. | North Lake | 9.4% | 2.3%(+7.10)#42 | 3.1%(+6.30)#3,163 |
| 43. | Merrillan | 9.1% | 2.3%(+6.80)#43 | 3.1%(+6.00)#3,304 |
| 44. | Reserve | 9.1% | 2.3%(+6.80)#44 | 3.1%(+6.00)#3,313 |
| 45. | Friendship | 8.9% | 2.3%(+6.60)#45 | 3.1%(+5.80)#3,414 |
| 46. | Hancock | 8.7% | 2.3%(+6.40)#46 | 3.1%(+5.60)#3,533 |
| 47. | Biron | 8.6% | 2.3%(+6.30)#47 | 3.1%(+5.50)#3,581 |
| 48. | Wausaukee | 8.6% | 2.3%(+6.30)#48 | 3.1%(+5.50)#3,585 |
| 49. | Hudson | 8.5% | 2.3%(+6.20)#49 | 3.1%(+5.40)#3,606 |
| 50. | North Freedom | 8.4% | 2.3%(+6.10)#50 | 3.1%(+5.30)#3,689 |
| 51. | Edgerton | 8.3% | 2.3%(+6.00)#51 | 3.1%(+5.20)#3,708 |
| 52. | Boscobel | 8.2% | 2.3%(+5.90)#52 | 3.1%(+5.10)#3,777 |
| 53. | Woodman | 8.2% | 2.3%(+5.90)#53 | 3.1%(+5.10)#3,823 |
| 54. | Readstown | 8.1% | 2.3%(+5.80)#54 | 3.1%(+5.00)#3,865 |
| 55. | Kendall | 8.1% | 2.3%(+5.80)#55 | 3.1%(+5.00)#3,866 |
| 56. | Elcho | 8.1% | 2.3%(+5.80)#56 | 3.1%(+5.00)#3,872 |
| 57. | Birch Hill | 8.0% | 2.3%(+5.70)#57 | 3.1%(+4.90)#3,928 |
| 58. | Wyeville | 8.0% | 2.3%(+5.70)#58 | 3.1%(+4.90)#3,934 |
| 59. | St Francis | 7.9% | 2.3%(+5.60)#59 | 3.1%(+4.80)#3,951 |
| 60. | Fairchild | 7.7% | 2.3%(+5.40)#60 | 3.1%(+4.60)#4,126 |
| 61. | Antigo | 7.5% | 2.3%(+5.20)#61 | 3.1%(+4.40)#4,220 |
| 62. | New London | 7.5% | 2.3%(+5.20)#62 | 3.1%(+4.40)#4,221 |
| 63. | Neosho | 7.4% | 2.3%(+5.10)#63 | 3.1%(+4.30)#4,336 |
| 64. | Hammond | 7.3% | 2.3%(+5.00)#64 | 3.1%(+4.20)#4,395 |
| 65. | Centuria | 7.3% | 2.3%(+5.00)#65 | 3.1%(+4.20)#4,413 |
| 66. | Wauzeka | 7.3% | 2.3%(+5.00)#66 | 3.1%(+4.20)#4,414 |
| 67. | Chief Lake | 7.3% | 2.3%(+5.00)#67 | 3.1%(+4.20)#4,419 |
| 68. | Ogema | 7.2% | 2.3%(+4.90)#68 | 3.1%(+4.10)#4,504 |
| 69. | Lake Ripley | 7.1% | 2.3%(+4.80)#69 | 3.1%(+4.00)#4,544 |
| 70. | Camp Douglas | 7.1% | 2.3%(+4.80)#70 | 3.1%(+4.00)#4,560 |
| 71. | Pence | 7.1% | 2.3%(+4.80)#71 | 3.1%(+4.00)#4,591 |
| 72. | Hurley | 6.9% | 2.3%(+4.60)#72 | 3.1%(+3.80)#4,737 |
| 73. | Fremont | 6.7% | 2.3%(+4.40)#73 | 3.1%(+3.60)#4,917 |
| 74. | Bagley | 6.7% | 2.3%(+4.40)#74 | 3.1%(+3.60)#4,928 |
| 75. | Allenton | 6.6% | 2.3%(+4.30)#75 | 3.1%(+3.50)#5,019 |
| 76. | Markesan | 6.5% | 2.3%(+4.20)#76 | 3.1%(+3.40)#5,109 |
| 77. | Whittlesey | 6.5% | 2.3%(+4.20)#77 | 3.1%(+3.40)#5,154 |
| 78. | Dorchester | 6.3% | 2.3%(+4.00)#78 | 3.1%(+3.20)#5,314 |
| 79. | Gilman | 6.3% | 2.3%(+4.00)#79 | 3.1%(+3.20)#5,332 |
| 80. | Exeland | 6.3% | 2.3%(+4.00)#80 | 3.1%(+3.20)#5,355 |
| 81. | Adams | 6.2% | 2.3%(+3.90)#81 | 3.1%(+3.10)#5,422 |
| 82. | Oconto Falls | 6.0% | 2.3%(+3.70)#82 | 3.1%(+2.90)#5,627 |
| 83. | Pittsville | 6.0% | 2.3%(+3.70)#83 | 3.1%(+2.90)#5,656 |
| 84. | Bruce | 6.0% | 2.3%(+3.70)#84 | 3.1%(+2.90)#5,662 |
| 85. | Mission | 6.0% | 2.3%(+3.70)#85 | 3.1%(+2.90)#5,686 |
| 86. | Turtle Lake | 5.9% | 2.3%(+3.60)#86 | 3.1%(+2.80)#5,810 |
| 87. | Cambridge | 5.8% | 2.3%(+3.50)#87 | 3.1%(+2.70)#5,900 |
| 88. | Milwaukee | 5.7% | 2.3%(+3.40)#88 | 3.1%(+2.60)#5,944 |
| 89. | Ridgeway | 5.7% | 2.3%(+3.40)#89 | 3.1%(+2.60)#6,034 |
| 90. | Chippewa Falls | 5.6% | 2.3%(+3.30)#90 | 3.1%(+2.50)#6,080 |
| 91. | Shullsburg | 5.6% | 2.3%(+3.30)#91 | 3.1%(+2.50)#6,147 |
| 92. | Brothertown | 5.5% | 2.3%(+3.20)#92 | 3.1%(+2.40)#6,320 |
| 93. | Batavia | 5.5% | 2.3%(+3.20)#93 | 3.1%(+2.40)#6,321 |
| 94. | Kennan | 5.4% | 2.3%(+3.10)#94 | 3.1%(+2.30)#6,439 |
| 95. | Ashland | 5.3% | 2.3%(+3.00)#95 | 3.1%(+2.20)#6,471 |
| 96. | Ripon | 5.3% | 2.3%(+3.00)#96 | 3.1%(+2.20)#6,472 |
| 97. | Darlington | 5.3% | 2.3%(+3.00)#97 | 3.1%(+2.20)#6,509 |
| 98. | Lyndon Station | 5.3% | 2.3%(+3.00)#98 | 3.1%(+2.20)#6,544 |
| 99. | Gresham | 5.3% | 2.3%(+3.00)#99 | 3.1%(+2.20)#6,553 |
| 100. | Gays Mills | 5.3% | 2.3%(+3.00)#100 | 3.1%(+2.20)#6,557 |
Common Questions
What are the Top 10 Cities with the Highest Percentage of Families with Income Below $10,000 in Wisconsin?
Top 10 Cities with the Highest Percentage of Families with Income Below $10,000 in Wisconsin are:
#1
32.6%
#2
31.6%
#3
31.0%
#4
27.8%
#5
26.9%
#6
20.7%
#7
19.2%
#8
18.8%
#9
18.8%
#10
17.3%
What city has the Highest Percentage of Families with Income Below $10,000 in Wisconsin?
Pulcifer has the Highest Percentage of Families with Income Below $10,000 in Wisconsin with 32.6%.
What is the Percentage of Families with Income Below $10,000 in the State of Wisconsin?
Percentage of Families with Income Below $10,000 in Wisconsin is 2.3%.
What is the Percentage of Families with Income Below $10,000 in the United States?
Percentage of Families with Income Below $10,000 in the United States is 3.1%.