Cities with the Highest Percentage of Families with Income Below $10,000 in Iowa
RELATED REPORTS & OPTIONS
Family Income | $0-10k
Iowa
Compare Cities
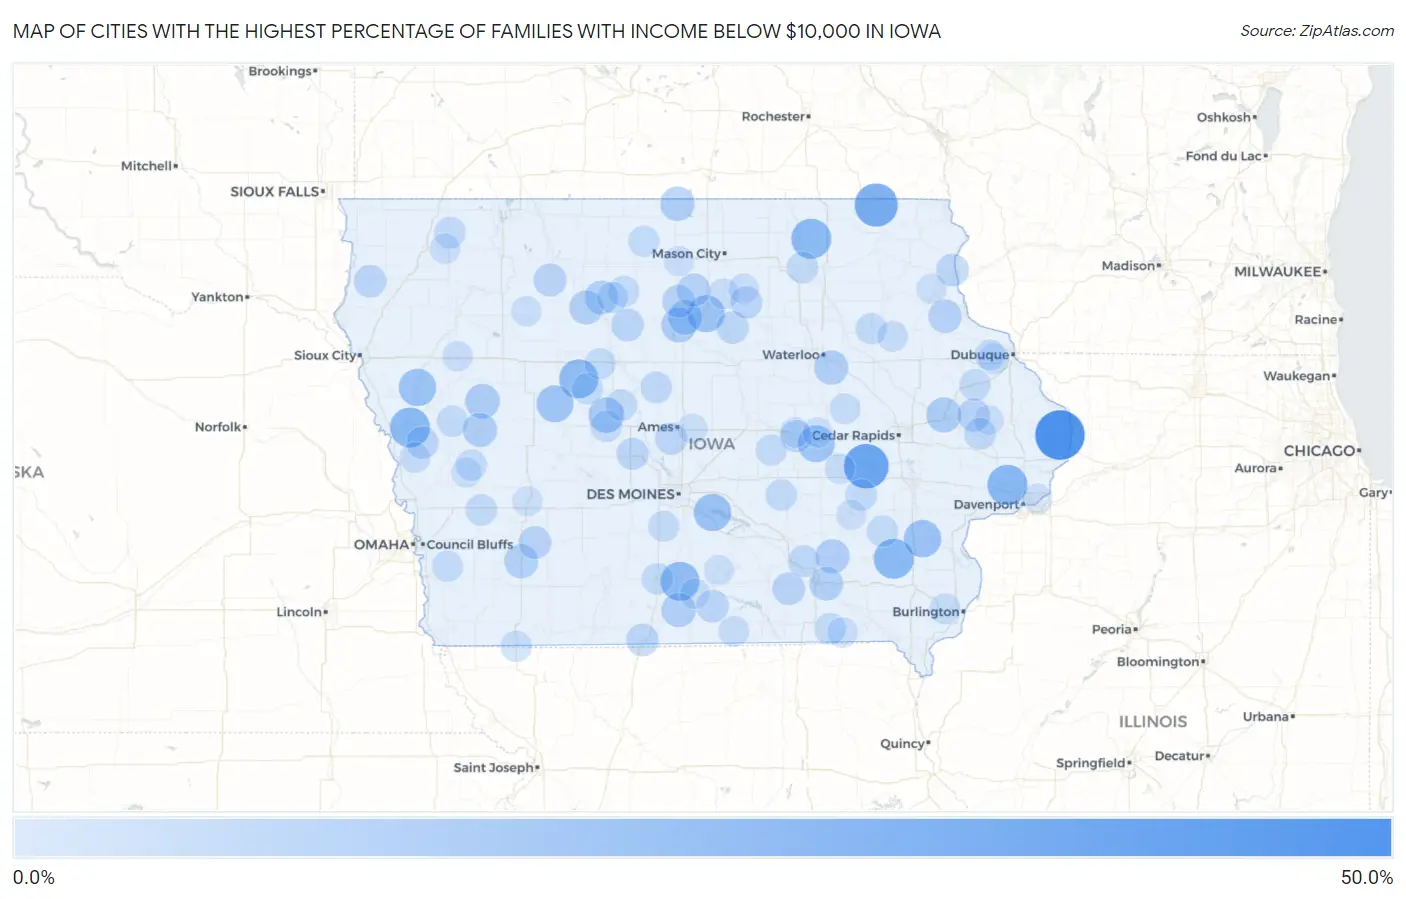
Map of Cities with the Highest Percentage of Families with Income Below $10,000 in Iowa
0.0%
50.0%
Cities with the Highest Percentage of Families with Income Below $10,000 in Iowa
| City | Families with Income < $10k | vs State | vs National | |
| 1. | Andover | 43.5% | 2.4%(+41.1)#1 | 3.1%(+40.4)#177 |
| 2. | South Amana | 34.0% | 2.4%(+31.6)#2 | 3.1%(+30.9)#312 |
| 3. | Burr Oak | 31.0% | 2.4%(+28.6)#3 | 3.1%(+27.9)#382 |
| 4. | Maysville | 25.5% | 2.4%(+23.1)#4 | 3.1%(+22.4)#569 |
| 5. | Elma | 25.0% | 2.4%(+22.6)#5 | 3.1%(+21.9)#588 |
| 6. | Turin | 25.0% | 2.4%(+22.6)#6 | 3.1%(+21.9)#598 |
| 7. | Coppock | 25.0% | 2.4%(+22.6)#7 | 3.1%(+21.9)#604 |
| 8. | Woodburn | 23.3% | 2.4%(+20.9)#8 | 3.1%(+20.2)#684 |
| 9. | Rinard | 23.1% | 2.4%(+20.7)#9 | 3.1%(+20.0)#701 |
| 10. | Oto | 20.0% | 2.4%(+17.6)#10 | 3.1%(+16.9)#908 |
| 11. | Swan | 20.0% | 2.4%(+17.6)#11 | 3.1%(+16.9)#910 |
| 12. | Cotter | 20.0% | 2.4%(+17.6)#12 | 3.1%(+16.9)#916 |
| 13. | Latimer | 19.3% | 2.4%(+16.9)#13 | 3.1%(+16.2)#976 |
| 14. | Chelsea | 19.2% | 2.4%(+16.8)#14 | 3.1%(+16.1)#989 |
| 15. | Lanesboro | 19.0% | 2.4%(+16.6)#15 | 3.1%(+15.9)#1,009 |
| 16. | Dana | 16.7% | 2.4%(+14.3)#16 | 3.1%(+13.6)#1,257 |
| 17. | Anamosa | 15.5% | 2.4%(+13.1)#17 | 3.1%(+12.4)#1,380 |
| 18. | Galt | 15.4% | 2.4%(+13.0)#18 | 3.1%(+12.3)#1,419 |
| 19. | Kiron | 15.0% | 2.4%(+12.6)#19 | 3.1%(+11.9)#1,463 |
| 20. | Rowan | 14.3% | 2.4%(+11.9)#20 | 3.1%(+11.2)#1,604 |
| 21. | Scarville | 14.3% | 2.4%(+11.9)#21 | 3.1%(+11.2)#1,618 |
| 22. | Garden Grove | 14.1% | 2.4%(+11.7)#22 | 3.1%(+11.0)#1,658 |
| 23. | Washburn | 14.0% | 2.4%(+11.6)#23 | 3.1%(+10.9)#1,674 |
| 24. | Denison | 13.9% | 2.4%(+11.5)#24 | 3.1%(+10.8)#1,683 |
| 25. | Martinsburg | 13.9% | 2.4%(+11.5)#25 | 3.1%(+10.8)#1,694 |
| 26. | Bradgate | 13.6% | 2.4%(+11.2)#26 | 3.1%(+10.5)#1,755 |
| 27. | Grant | 13.6% | 2.4%(+11.2)#27 | 3.1%(+10.5)#1,757 |
| 28. | Agency | 13.3% | 2.4%(+10.9)#28 | 3.1%(+10.2)#1,815 |
| 29. | Bode | 13.3% | 2.4%(+10.9)#29 | 3.1%(+10.2)#1,817 |
| 30. | Garber | 12.8% | 2.4%(+10.4)#30 | 3.1%(+9.70)#1,930 |
| 31. | Meservey | 12.3% | 2.4%(+9.90)#31 | 3.1%(+9.20)#2,060 |
| 32. | Onslow | 11.8% | 2.4%(+9.40)#32 | 3.1%(+8.70)#2,199 |
| 33. | Curlew | 11.8% | 2.4%(+9.40)#33 | 3.1%(+8.70)#2,210 |
| 34. | Belmond | 11.7% | 2.4%(+9.30)#34 | 3.1%(+8.60)#2,219 |
| 35. | Cumberland | 11.4% | 2.4%(+9.00)#35 | 3.1%(+8.30)#2,342 |
| 36. | Blakesburg | 11.3% | 2.4%(+8.90)#36 | 3.1%(+8.20)#2,373 |
| 37. | Marquette | 11.1% | 2.4%(+8.70)#37 | 3.1%(+8.00)#2,430 |
| 38. | Thor | 11.1% | 2.4%(+8.70)#38 | 3.1%(+8.00)#2,440 |
| 39. | Oak Hills | 11.1% | 2.4%(+8.70)#39 | 3.1%(+8.00)#2,446 |
| 40. | Millerton | 11.1% | 2.4%(+8.70)#40 | 3.1%(+8.00)#2,454 |
| 41. | Ireton | 10.8% | 2.4%(+8.40)#41 | 3.1%(+7.70)#2,537 |
| 42. | Geneva | 10.7% | 2.4%(+8.30)#42 | 3.1%(+7.60)#2,579 |
| 43. | Lamoni | 10.6% | 2.4%(+8.20)#43 | 3.1%(+7.50)#2,594 |
| 44. | Moorhead | 10.5% | 2.4%(+8.10)#44 | 3.1%(+7.40)#2,656 |
| 45. | Tama | 10.1% | 2.4%(+7.70)#45 | 3.1%(+7.00)#2,796 |
| 46. | Kelley | 10.1% | 2.4%(+7.70)#46 | 3.1%(+7.00)#2,813 |
| 47. | Bouton | 10.0% | 2.4%(+7.60)#47 | 3.1%(+6.90)#2,874 |
| 48. | Aredale | 10.0% | 2.4%(+7.60)#48 | 3.1%(+6.90)#2,889 |
| 49. | Kirkville | 9.7% | 2.4%(+7.30)#49 | 3.1%(+6.60)#3,020 |
| 50. | Stanhope | 9.6% | 2.4%(+7.20)#50 | 3.1%(+6.50)#3,056 |
| 51. | Oxford Junction | 9.5% | 2.4%(+7.10)#51 | 3.1%(+6.40)#3,101 |
| 52. | Avoca | 9.3% | 2.4%(+6.90)#52 | 3.1%(+6.20)#3,187 |
| 53. | Cascade | 9.2% | 2.4%(+6.80)#53 | 3.1%(+6.10)#3,237 |
| 54. | Pulaski | 9.2% | 2.4%(+6.80)#54 | 3.1%(+6.10)#3,261 |
| 55. | Melvin | 9.2% | 2.4%(+6.80)#55 | 3.1%(+6.10)#3,262 |
| 56. | Parnell | 9.2% | 2.4%(+6.80)#56 | 3.1%(+6.10)#3,265 |
| 57. | Osceola | 9.1% | 2.4%(+6.70)#57 | 3.1%(+6.00)#3,279 |
| 58. | Charter Oak | 9.1% | 2.4%(+6.70)#58 | 3.1%(+6.00)#3,309 |
| 59. | West Chester | 9.1% | 2.4%(+6.70)#59 | 3.1%(+6.00)#3,319 |
| 60. | Searsboro | 9.1% | 2.4%(+6.70)#60 | 3.1%(+6.00)#3,321 |
| 61. | Bassett | 9.1% | 2.4%(+6.70)#61 | 3.1%(+6.00)#3,327 |
| 62. | Grand Junction | 8.9% | 2.4%(+6.50)#62 | 3.1%(+5.80)#3,415 |
| 63. | Oelwein | 8.8% | 2.4%(+6.40)#63 | 3.1%(+5.70)#3,442 |
| 64. | Farnhamville | 8.8% | 2.4%(+6.40)#64 | 3.1%(+5.70)#3,473 |
| 65. | Boxholm | 8.8% | 2.4%(+6.40)#65 | 3.1%(+5.70)#3,486 |
| 66. | Earling | 8.7% | 2.4%(+6.30)#66 | 3.1%(+5.60)#3,534 |
| 67. | Lu Verne | 8.7% | 2.4%(+6.30)#67 | 3.1%(+5.60)#3,537 |
| 68. | Woden | 8.7% | 2.4%(+6.30)#68 | 3.1%(+5.60)#3,540 |
| 69. | Livermore | 8.6% | 2.4%(+6.20)#69 | 3.1%(+5.50)#3,588 |
| 70. | Silver City | 8.6% | 2.4%(+6.20)#70 | 3.1%(+5.50)#3,589 |
| 71. | Braddyville | 8.6% | 2.4%(+6.20)#71 | 3.1%(+5.50)#3,600 |
| 72. | Martensdale | 8.4% | 2.4%(+6.00)#72 | 3.1%(+5.30)#3,691 |
| 73. | Gilman | 8.3% | 2.4%(+5.90)#73 | 3.1%(+5.20)#3,732 |
| 74. | Moorland | 8.3% | 2.4%(+5.90)#74 | 3.1%(+5.20)#3,748 |
| 75. | Centralia | 8.1% | 2.4%(+5.70)#75 | 3.1%(+5.00)#3,873 |
| 76. | Seymour | 7.9% | 2.4%(+5.50)#76 | 3.1%(+4.80)#3,991 |
| 77. | Middletown | 7.8% | 2.4%(+5.40)#77 | 3.1%(+4.70)#4,066 |
| 78. | Garrison | 7.7% | 2.4%(+5.30)#78 | 3.1%(+4.60)#4,130 |
| 79. | Aurora | 7.7% | 2.4%(+5.30)#79 | 3.1%(+4.60)#4,135 |
| 80. | Graf | 7.7% | 2.4%(+5.30)#80 | 3.1%(+4.60)#4,148 |
| 81. | Pisgah | 7.6% | 2.4%(+5.20)#81 | 3.1%(+4.50)#4,205 |
| 82. | Sheffield | 7.2% | 2.4%(+4.80)#82 | 3.1%(+4.10)#4,486 |
| 83. | Ladora | 7.2% | 2.4%(+4.80)#83 | 3.1%(+4.10)#4,503 |
| 84. | Holstein | 7.1% | 2.4%(+4.70)#84 | 3.1%(+4.00)#4,548 |
| 85. | Sanborn | 7.1% | 2.4%(+4.70)#85 | 3.1%(+4.00)#4,550 |
| 86. | Milton | 7.1% | 2.4%(+4.70)#86 | 3.1%(+4.00)#4,571 |
| 87. | Dougherty | 7.1% | 2.4%(+4.70)#87 | 3.1%(+4.00)#4,596 |
| 88. | Toledo | 6.9% | 2.4%(+4.50)#88 | 3.1%(+3.80)#4,732 |
| 89. | Albert City | 6.9% | 2.4%(+4.50)#89 | 3.1%(+3.80)#4,759 |
| 90. | South English | 6.9% | 2.4%(+4.50)#90 | 3.1%(+3.80)#4,772 |
| 91. | Panama | 6.9% | 2.4%(+4.50)#91 | 3.1%(+3.80)#4,773 |
| 92. | Panorama Park | 6.9% | 2.4%(+4.50)#92 | 3.1%(+3.80)#4,777 |
| 93. | St Olaf | 6.9% | 2.4%(+4.50)#93 | 3.1%(+3.80)#4,778 |
| 94. | Garner | 6.8% | 2.4%(+4.40)#94 | 3.1%(+3.70)#4,803 |
| 95. | Monmouth | 6.7% | 2.4%(+4.30)#95 | 3.1%(+3.60)#4,938 |
| 96. | Williamson | 6.7% | 2.4%(+4.30)#96 | 3.1%(+3.60)#4,940 |
| 97. | Derby | 6.7% | 2.4%(+4.30)#97 | 3.1%(+3.60)#4,944 |
| 98. | Brayton | 6.7% | 2.4%(+4.30)#98 | 3.1%(+3.60)#4,945 |
| 99. | Vining | 6.7% | 2.4%(+4.30)#99 | 3.1%(+3.60)#4,946 |
| 100. | Nevada | 6.6% | 2.4%(+4.20)#100 | 3.1%(+3.50)#4,980 |
Common Questions
What are the Top 10 Cities with the Highest Percentage of Families with Income Below $10,000 in Iowa?
Top 10 Cities with the Highest Percentage of Families with Income Below $10,000 in Iowa are:
What city has the Highest Percentage of Families with Income Below $10,000 in Iowa?
Andover has the Highest Percentage of Families with Income Below $10,000 in Iowa with 43.5%.
What is the Percentage of Families with Income Below $10,000 in the State of Iowa?
Percentage of Families with Income Below $10,000 in Iowa is 2.4%.
What is the Percentage of Families with Income Below $10,000 in the United States?
Percentage of Families with Income Below $10,000 in the United States is 3.1%.