Cities with the Highest Percentage of Families with Income Below $10,000 in Pennsylvania
RELATED REPORTS & OPTIONS
Family Income | $0-10k
Pennsylvania
Compare Cities
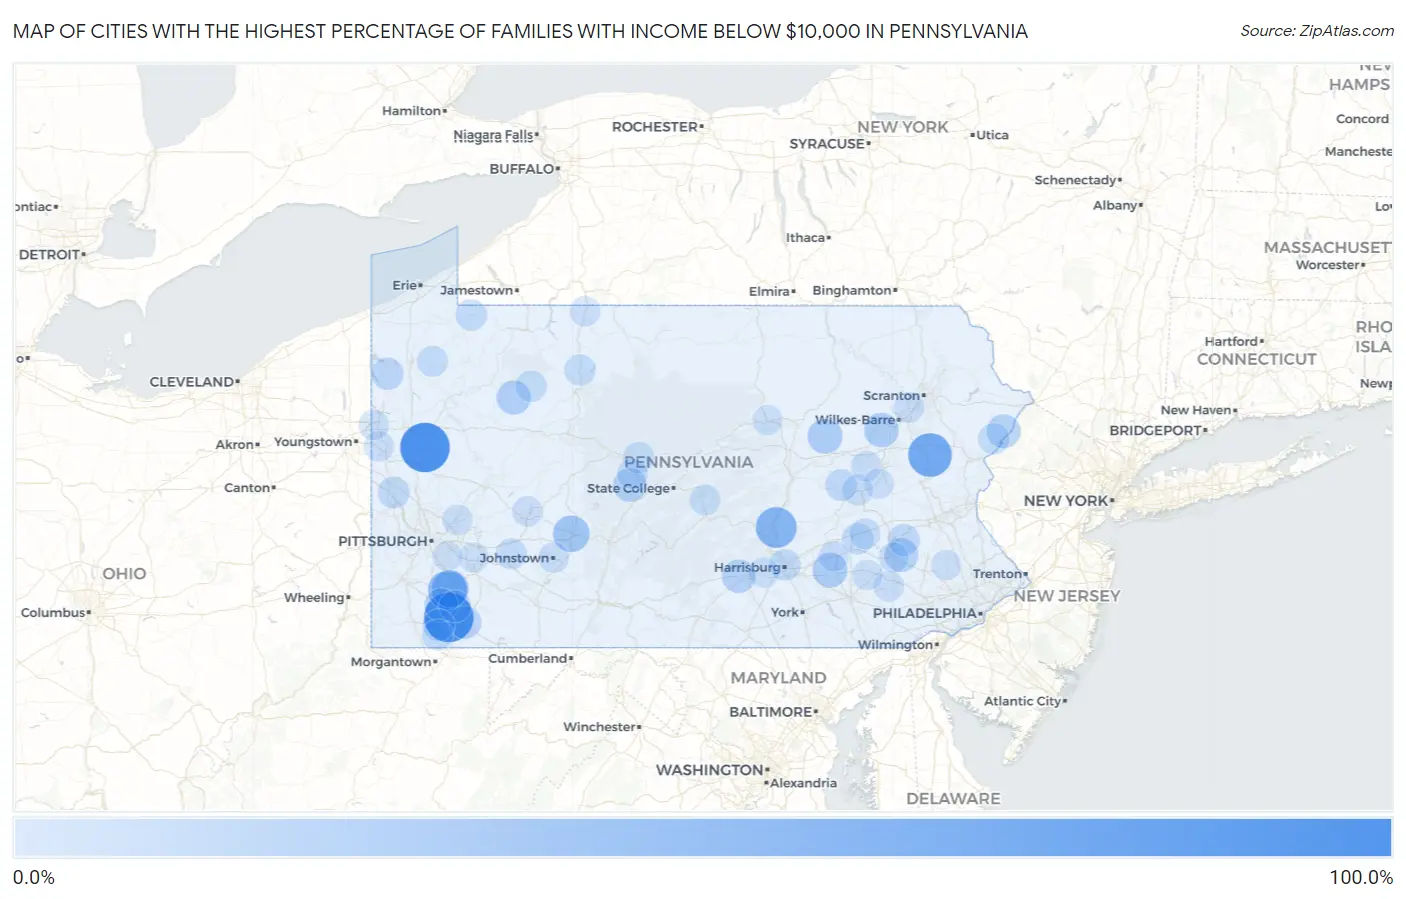
Map of Cities with the Highest Percentage of Families with Income Below $10,000 in Pennsylvania
0.0%
100.0%
Cities with the Highest Percentage of Families with Income Below $10,000 in Pennsylvania
| City | Families with Income < $10k | vs State | vs National | |
| 1. | Slippery Rock University | 100.0% | 2.9%(+97.1)#1 | 3.1%(+96.9)#1 |
| 2. | Buffington | 100.0% | 2.9%(+97.1)#2 | 3.1%(+96.9)#9 |
| 3. | Albrightsville | 71.9% | 2.9%(+69.0)#3 | 3.1%(+68.8)#61 |
| 4. | Lenkerville | 58.5% | 2.9%(+55.6)#4 | 3.1%(+55.4)#87 |
| 5. | East Altoona | 55.8% | 2.9%(+52.9)#5 | 3.1%(+52.7)#93 |
| 6. | Carson Valley | 52.9% | 2.9%(+50.0)#6 | 3.1%(+49.8)#108 |
| 7. | Naomi | 50.0% | 2.9%(+47.1)#7 | 3.1%(+46.9)#127 |
| 8. | Arnold City | 41.4% | 2.9%(+38.5)#8 | 3.1%(+38.3)#198 |
| 9. | St. Clair | 40.0% | 2.9%(+37.1)#9 | 3.1%(+36.9)#214 |
| 10. | Revloc | 38.7% | 2.9%(+35.8)#10 | 3.1%(+35.6)#233 |
| 11. | Timber Hills | 31.2% | 2.9%(+28.3)#11 | 3.1%(+28.1)#373 |
| 12. | Iola | 31.1% | 2.9%(+28.2)#12 | 3.1%(+28.0)#377 |
| 13. | Wanamie | 29.3% | 2.9%(+26.4)#13 | 3.1%(+26.2)#424 |
| 14. | Grampian Borough | 29.2% | 2.9%(+26.3)#14 | 3.1%(+26.1)#426 |
| 15. | Aaronsburg Cdp Washington County | 28.3% | 2.9%(+25.4)#15 | 3.1%(+25.2)#459 |
| 16. | Crown | 27.9% | 2.9%(+25.0)#16 | 3.1%(+24.8)#472 |
| 17. | Stony Creek Mills | 26.3% | 2.9%(+23.4)#17 | 3.1%(+23.2)#529 |
| 18. | Pocono Ranch Lands | 26.1% | 2.9%(+23.2)#18 | 3.1%(+23.0)#541 |
| 19. | Sandy Ridge | 25.6% | 2.9%(+22.7)#19 | 3.1%(+22.5)#565 |
| 20. | Hiller | 25.1% | 2.9%(+22.2)#20 | 3.1%(+22.0)#582 |
| 21. | Plainfield | 25.0% | 2.9%(+22.1)#21 | 3.1%(+21.9)#593 |
| 22. | New Columbus Borough | 22.2% | 2.9%(+19.3)#22 | 3.1%(+19.1)#746 |
| 23. | Westover Borough | 22.1% | 2.9%(+19.2)#23 | 3.1%(+19.0)#759 |
| 24. | Oreminea | 22.0% | 2.9%(+19.1)#24 | 3.1%(+18.9)#764 |
| 25. | East Uniontown | 21.4% | 2.9%(+18.5)#25 | 3.1%(+18.3)#791 |
| 26. | Hartstown | 19.1% | 2.9%(+16.2)#26 | 3.1%(+16.0)#999 |
| 27. | Washingtonville Borough | 18.8% | 2.9%(+15.9)#27 | 3.1%(+15.7)#1,021 |
| 28. | Smock | 18.5% | 2.9%(+15.6)#28 | 3.1%(+15.4)#1,048 |
| 29. | Alverda | 18.4% | 2.9%(+15.5)#29 | 3.1%(+15.3)#1,057 |
| 30. | Walnuttown | 18.2% | 2.9%(+15.3)#30 | 3.1%(+15.1)#1,075 |
| 31. | Beaver Falls | 18.1% | 2.9%(+15.2)#31 | 3.1%(+15.0)#1,094 |
| 32. | Wilburton Number One | 18.0% | 2.9%(+15.1)#32 | 3.1%(+14.9)#1,111 |
| 33. | Nemacolin | 17.7% | 2.9%(+14.8)#33 | 3.1%(+14.6)#1,133 |
| 34. | Westfield Borough | 16.9% | 2.9%(+14.0)#34 | 3.1%(+13.8)#1,216 |
| 35. | Continental Courts | 16.9% | 2.9%(+14.0)#35 | 3.1%(+13.8)#1,220 |
| 36. | Harrisburg | 16.1% | 2.9%(+13.2)#36 | 3.1%(+13.0)#1,300 |
| 37. | Corry | 16.1% | 2.9%(+13.2)#37 | 3.1%(+13.0)#1,304 |
| 38. | Edwardsville Borough | 16.1% | 2.9%(+13.2)#38 | 3.1%(+13.0)#1,305 |
| 39. | Mount Union Borough | 15.5% | 2.9%(+12.6)#39 | 3.1%(+12.4)#1,387 |
| 40. | Rehrersburg | 15.5% | 2.9%(+12.6)#40 | 3.1%(+12.4)#1,395 |
| 41. | Slatington Borough | 15.3% | 2.9%(+12.4)#41 | 3.1%(+12.2)#1,422 |
| 42. | Kylertown | 14.9% | 2.9%(+12.0)#42 | 3.1%(+11.8)#1,484 |
| 43. | Creekside Borough | 14.9% | 2.9%(+12.0)#43 | 3.1%(+11.8)#1,486 |
| 44. | Dauphin Borough | 14.8% | 2.9%(+11.9)#44 | 3.1%(+11.7)#1,492 |
| 45. | Wilcox | 14.7% | 2.9%(+11.8)#45 | 3.1%(+11.6)#1,521 |
| 46. | Mapletown | 14.7% | 2.9%(+11.8)#46 | 3.1%(+11.6)#1,526 |
| 47. | Marienville | 14.6% | 2.9%(+11.7)#47 | 3.1%(+11.5)#1,533 |
| 48. | Bentleyville Borough | 14.6% | 2.9%(+11.7)#48 | 3.1%(+11.5)#1,535 |
| 49. | Saw Creek | 14.5% | 2.9%(+11.6)#49 | 3.1%(+11.4)#1,546 |
| 50. | Rankin Borough | 14.4% | 2.9%(+11.5)#50 | 3.1%(+11.3)#1,565 |
| 51. | Dushore Borough | 14.4% | 2.9%(+11.5)#51 | 3.1%(+11.3)#1,577 |
| 52. | Guys Mills | 14.3% | 2.9%(+11.4)#52 | 3.1%(+11.2)#1,607 |
| 53. | Millwood | 14.1% | 2.9%(+11.2)#53 | 3.1%(+11.0)#1,654 |
| 54. | Eagles Mere Borough | 13.9% | 2.9%(+11.0)#54 | 3.1%(+10.8)#1,695 |
| 55. | Knox Borough | 13.8% | 2.9%(+10.9)#55 | 3.1%(+10.7)#1,704 |
| 56. | Turtle Creek Borough | 13.6% | 2.9%(+10.7)#56 | 3.1%(+10.5)#1,732 |
| 57. | Blawnox Borough | 13.5% | 2.9%(+10.6)#57 | 3.1%(+10.4)#1,766 |
| 58. | Strausstown | 13.4% | 2.9%(+10.5)#58 | 3.1%(+10.3)#1,799 |
| 59. | Englewood | 13.1% | 2.9%(+10.2)#59 | 3.1%(+10.00)#1,862 |
| 60. | Sykesville Borough | 12.9% | 2.9%(+10.00)#60 | 3.1%(+9.80)#1,899 |
| 61. | Milroy | 12.7% | 2.9%(+9.80)#61 | 3.1%(+9.60)#1,944 |
| 62. | Dawson Borough | 12.6% | 2.9%(+9.70)#62 | 3.1%(+9.50)#1,975 |
| 63. | Dallas Borough | 12.5% | 2.9%(+9.60)#63 | 3.1%(+9.40)#1,980 |
| 64. | Ulysses Borough | 12.5% | 2.9%(+9.60)#64 | 3.1%(+9.40)#1,993 |
| 65. | Chevy Chase Heights | 12.1% | 2.9%(+9.20)#65 | 3.1%(+9.00)#2,100 |
| 66. | Renovo Borough | 12.1% | 2.9%(+9.20)#66 | 3.1%(+9.00)#2,102 |
| 67. | Fairfield Borough | 12.1% | 2.9%(+9.20)#67 | 3.1%(+9.00)#2,106 |
| 68. | Irwin Borough | 12.0% | 2.9%(+9.10)#68 | 3.1%(+8.90)#2,123 |
| 69. | Frizzleburg | 12.0% | 2.9%(+9.10)#69 | 3.1%(+8.90)#2,138 |
| 70. | Johnstown | 11.8% | 2.9%(+8.90)#70 | 3.1%(+8.70)#2,174 |
| 71. | Smethport Borough | 11.8% | 2.9%(+8.90)#71 | 3.1%(+8.70)#2,185 |
| 72. | Perryopolis Borough | 11.8% | 2.9%(+8.90)#72 | 3.1%(+8.70)#2,186 |
| 73. | Churchtown | 11.8% | 2.9%(+8.90)#73 | 3.1%(+8.70)#2,195 |
| 74. | Eagle Creek | 11.8% | 2.9%(+8.90)#74 | 3.1%(+8.70)#2,203 |
| 75. | Pittston | 11.7% | 2.9%(+8.80)#75 | 3.1%(+8.60)#2,213 |
| 76. | Nuremberg | 11.7% | 2.9%(+8.80)#76 | 3.1%(+8.60)#2,236 |
| 77. | Pleasant Hill | 11.5% | 2.9%(+8.60)#77 | 3.1%(+8.40)#2,278 |
| 78. | Braddock Borough | 11.4% | 2.9%(+8.50)#78 | 3.1%(+8.30)#2,320 |
| 79. | Sadsburyville | 11.4% | 2.9%(+8.50)#79 | 3.1%(+8.30)#2,329 |
| 80. | South Philipsburg | 11.4% | 2.9%(+8.50)#80 | 3.1%(+8.30)#2,336 |
| 81. | Stevens | 11.4% | 2.9%(+8.50)#81 | 3.1%(+8.30)#2,337 |
| 82. | Northern Cambria Borough | 11.3% | 2.9%(+8.40)#82 | 3.1%(+8.20)#2,352 |
| 83. | Manchester Borough | 11.3% | 2.9%(+8.40)#83 | 3.1%(+8.20)#2,353 |
| 84. | Bradford | 11.2% | 2.9%(+8.30)#84 | 3.1%(+8.10)#2,379 |
| 85. | Arnold | 11.1% | 2.9%(+8.20)#85 | 3.1%(+8.00)#2,410 |
| 86. | Farrell | 11.1% | 2.9%(+8.20)#86 | 3.1%(+8.00)#2,412 |
| 87. | Donegal Borough | 11.1% | 2.9%(+8.20)#87 | 3.1%(+8.00)#2,447 |
| 88. | Brownsville Borough | 10.9% | 2.9%(+8.00)#88 | 3.1%(+7.80)#2,487 |
| 89. | Houston Borough | 10.9% | 2.9%(+8.00)#89 | 3.1%(+7.80)#2,493 |
| 90. | Spring Mount | 10.8% | 2.9%(+7.90)#90 | 3.1%(+7.70)#2,518 |
| 91. | Reynoldsville Borough | 10.8% | 2.9%(+7.90)#91 | 3.1%(+7.70)#2,519 |
| 92. | Jeannette | 10.7% | 2.9%(+7.80)#92 | 3.1%(+7.60)#2,548 |
| 93. | Rainsburg Borough | 10.7% | 2.9%(+7.80)#93 | 3.1%(+7.60)#2,581 |
| 94. | New Kingstown | 10.6% | 2.9%(+7.70)#94 | 3.1%(+7.50)#2,610 |
| 95. | Smithton Borough | 10.6% | 2.9%(+7.70)#95 | 3.1%(+7.50)#2,617 |
| 96. | Sharon Hill Borough | 10.4% | 2.9%(+7.50)#96 | 3.1%(+7.30)#2,669 |
| 97. | Grier City | 10.4% | 2.9%(+7.50)#97 | 3.1%(+7.30)#2,696 |
| 98. | Reading | 10.2% | 2.9%(+7.30)#98 | 3.1%(+7.10)#2,745 |
| 99. | Williamsport | 10.2% | 2.9%(+7.30)#99 | 3.1%(+7.10)#2,747 |
| 100. | Mckeesport | 10.2% | 2.9%(+7.30)#100 | 3.1%(+7.10)#2,749 |
Common Questions
What are the Top 10 Cities with the Highest Percentage of Families with Income Below $10,000 in Pennsylvania?
Top 10 Cities with the Highest Percentage of Families with Income Below $10,000 in Pennsylvania are:
#1
100.0%
#2
100.0%
#3
71.9%
#4
58.5%
#5
50.0%
#6
41.4%
#7
38.7%
#8
31.2%
#9
31.1%
#10
29.3%
What city has the Highest Percentage of Families with Income Below $10,000 in Pennsylvania?
Slippery Rock University has the Highest Percentage of Families with Income Below $10,000 in Pennsylvania with 100.0%.
What is the Percentage of Families with Income Below $10,000 in the State of Pennsylvania?
Percentage of Families with Income Below $10,000 in Pennsylvania is 2.9%.
What is the Percentage of Families with Income Below $10,000 in the United States?
Percentage of Families with Income Below $10,000 in the United States is 3.1%.