Zip Codes with the Highest Percentage of Families with Income Below $10,000 in San Diego, CA
RELATED REPORTS & OPTIONS
Family Income | $0-10k
San Diego
Compare Zip Codes
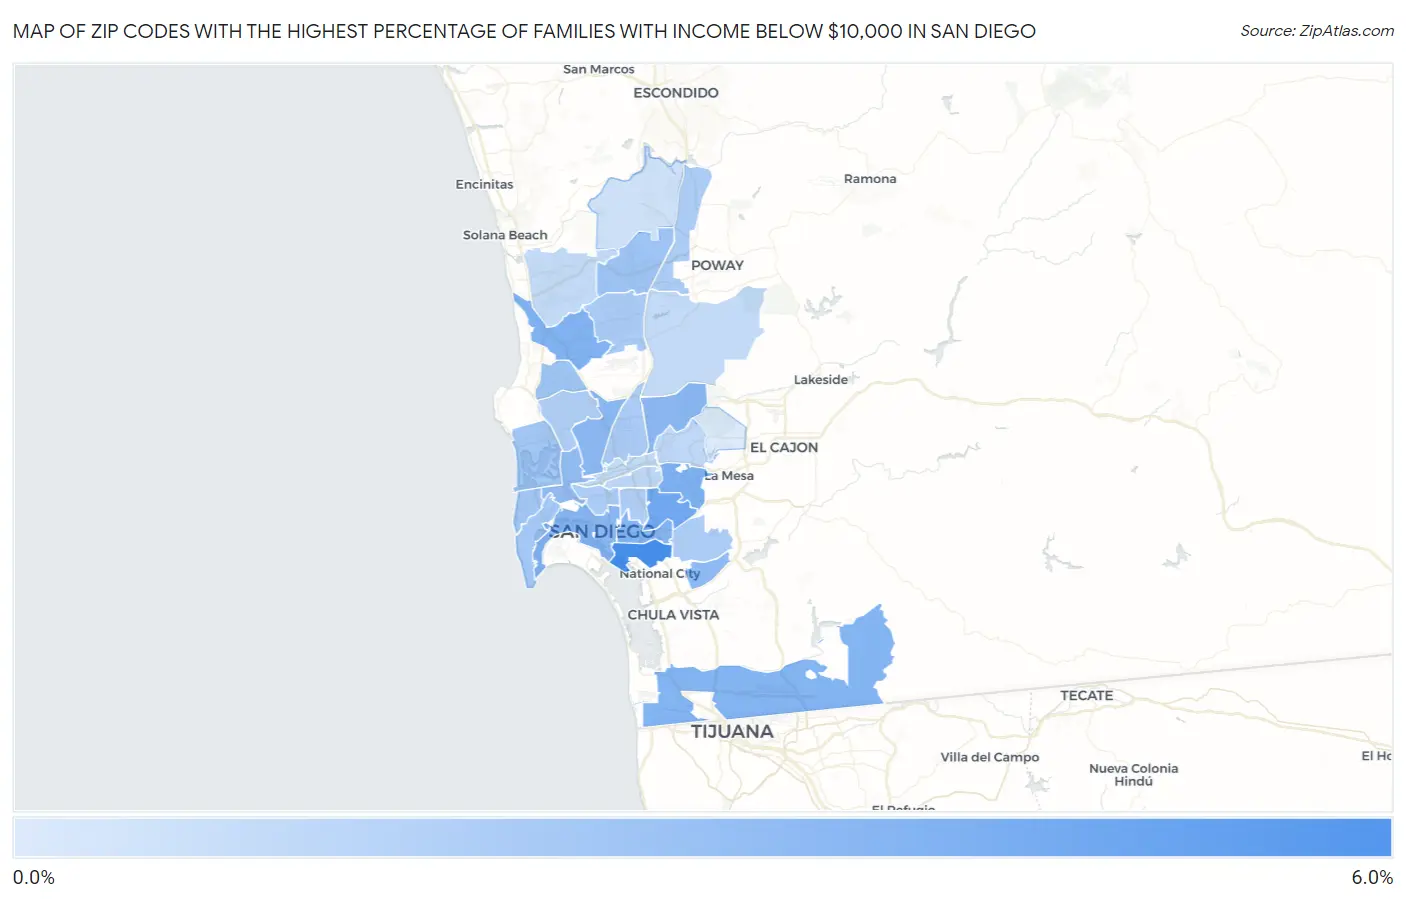
Map of Zip Codes with the Highest Percentage of Families with Income Below $10,000 in San Diego
0.50%
5.2%
Zip Codes with the Highest Percentage of Families with Income Below $10,000 in San Diego, CA
| Zip Code | Families with Income < $10k | vs State | vs National | |
| 1. | 92113 | 5.2% | 2.9%(+2.30)#265 | 3.1%(+2.10)#5,750 |
| 2. | 92105 | 3.9% | 2.9%(+1.00)#430 | 3.1%(+0.800)#8,370 |
| 3. | 92115 | 3.5% | 2.9%(+0.600)#504 | 3.1%(+0.400)#9,471 |
| 4. | 92121 | 3.4% | 2.9%(+0.500)#539 | 3.1%(+0.300)#9,956 |
| 5. | 92154 | 3.3% | 2.9%(+0.400)#543 | 3.1%(+0.200)#10,092 |
| 6. | 92102 | 3.3% | 2.9%(+0.400)#552 | 3.1%(+0.200)#10,117 |
| 7. | 92111 | 3.1% | 2.9%(+0.200)#586 | 3.1%(=0.000)#10,755 |
| 8. | 92101 | 3.1% | 2.9%(+0.200)#588 | 3.1%(=0.000)#10,760 |
| 9. | 92124 | 3.0% | 2.9%(+0.100)#623 | 3.1%(-0.100)#11,133 |
| 10. | 92139 | 2.9% | 2.9%(=0.000)#648 | 3.1%(-0.200)#11,471 |
| 11. | 92110 | 2.8% | 2.9%(-0.100)#667 | 3.1%(-0.300)#11,876 |
| 12. | 92129 | 2.4% | 2.9%(-0.500)#782 | 3.1%(-0.700)#13,431 |
| 13. | 92122 | 2.4% | 2.9%(-0.500)#785 | 3.1%(-0.700)#13,438 |
| 14. | 92109 | 2.3% | 2.9%(-0.600)#817 | 3.1%(-0.800)#13,897 |
| 15. | 92107 | 2.3% | 2.9%(-0.600)#821 | 3.1%(-0.800)#13,946 |
| 16. | 92106 | 2.3% | 2.9%(-0.600)#827 | 3.1%(-0.800)#13,999 |
| 17. | 92126 | 2.1% | 2.9%(-0.800)#871 | 3.1%(-1.000)#14,758 |
| 18. | 92123 | 2.1% | 2.9%(-0.800)#886 | 3.1%(-1.000)#14,830 |
| 19. | 92114 | 2.0% | 2.9%(-0.900)#915 | 3.1%(-1.10)#15,236 |
| 20. | 92128 | 2.0% | 2.9%(-0.900)#920 | 3.1%(-1.10)#15,254 |
| 21. | 92103 | 2.0% | 2.9%(-0.900)#926 | 3.1%(-1.10)#15,302 |
| 22. | 92117 | 1.9% | 2.9%(-1.000)#944 | 3.1%(-1.20)#15,724 |
| 23. | 92104 | 1.9% | 2.9%(-1.000)#948 | 3.1%(-1.20)#15,743 |
| 24. | 92116 | 1.5% | 2.9%(-1.40)#1,102 | 3.1%(-1.60)#17,722 |
| 25. | 92120 | 1.4% | 2.9%(-1.50)#1,132 | 3.1%(-1.70)#18,234 |
| 26. | 92130 | 1.3% | 2.9%(-1.60)#1,153 | 3.1%(-1.80)#18,669 |
| 27. | 92131 | 1.3% | 2.9%(-1.60)#1,166 | 3.1%(-1.80)#18,721 |
| 28. | 92108 | 1.3% | 2.9%(-1.60)#1,177 | 3.1%(-1.80)#18,780 |
| 29. | 92127 | 0.90% | 2.9%(-2.00)#1,261 | 3.1%(-2.20)#20,708 |
| 30. | 92119 | 0.50% | 2.9%(-2.40)#1,345 | 3.1%(-2.60)#22,644 |
1
Common Questions
What are the Top 10 Zip Codes with the Highest Percentage of Families with Income Below $10,000 in San Diego, CA?
Top 10 Zip Codes with the Highest Percentage of Families with Income Below $10,000 in San Diego, CA are:
What zip code has the Highest Percentage of Families with Income Below $10,000 in San Diego, CA?
92113 has the Highest Percentage of Families with Income Below $10,000 in San Diego, CA with 5.2%.
What is the Percentage of Families with Income Below $10,000 in San Diego, CA?
Percentage of Families with Income Below $10,000 in San Diego is 2.4%.
What is the Percentage of Families with Income Below $10,000 in California?
Percentage of Families with Income Below $10,000 in California is 2.9%.
What is the Percentage of Families with Income Below $10,000 in the United States?
Percentage of Families with Income Below $10,000 in the United States is 3.1%.