Cities with the Highest Percentage of Families with Income Below $10,000 in Vermont
RELATED REPORTS & OPTIONS
Family Income | $0-10k
Vermont
Compare Cities
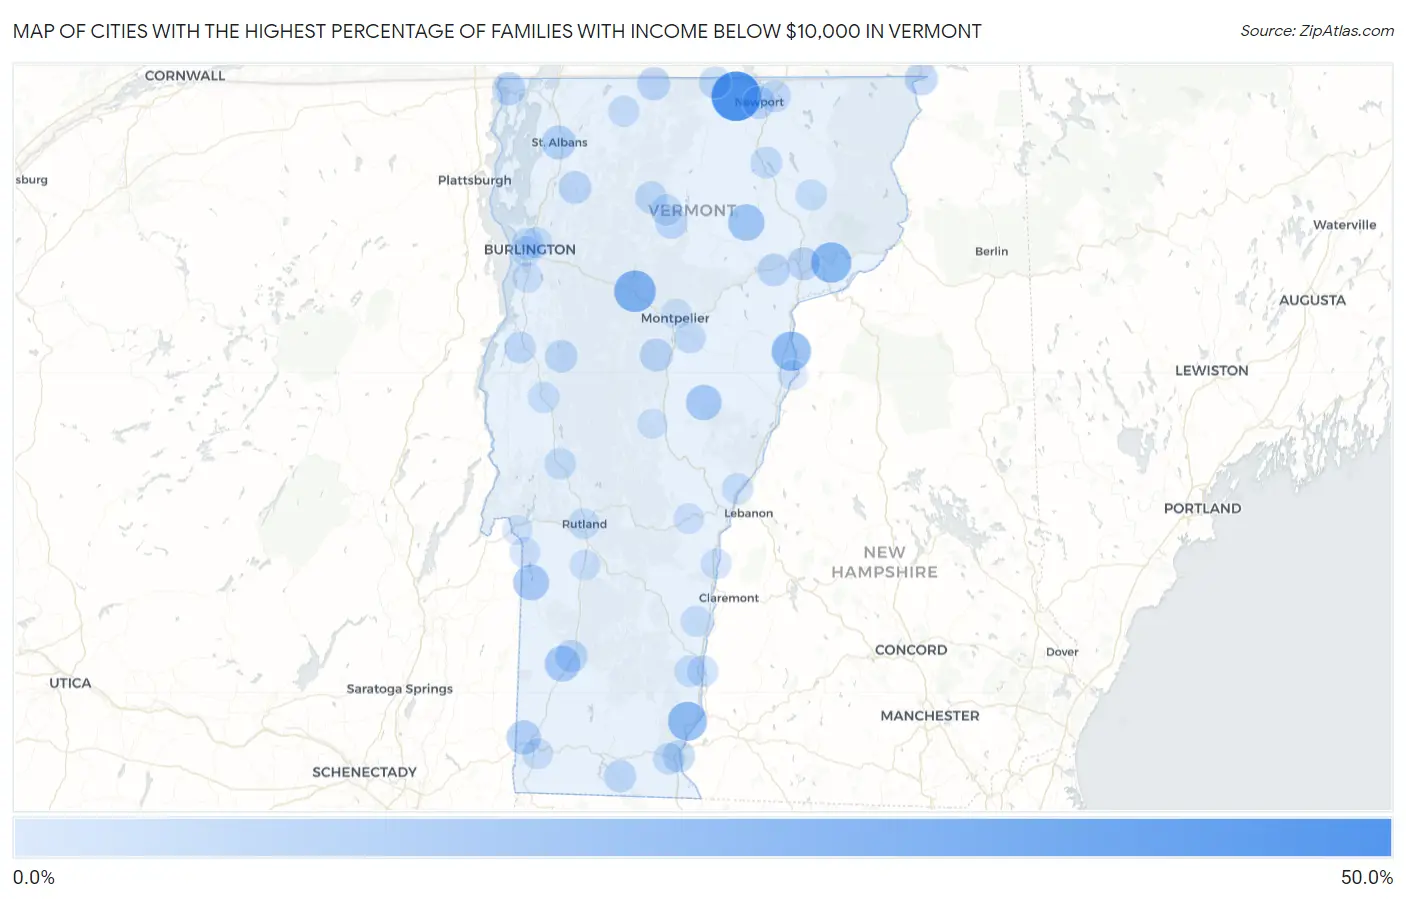
Map of Cities with the Highest Percentage of Families with Income Below $10,000 in Vermont
0.0%
50.0%
Cities with the Highest Percentage of Families with Income Below $10,000 in Vermont
| City | Families with Income < $10k | vs State | vs National | |
| 1. | Newport Center | 50.0% | 2.1%(+47.9)#1 | 3.1%(+46.9)#125 |
| 2. | Waterbury | 29.1% | 2.1%(+27.0)#2 | 3.1%(+26.0)#429 |
| 3. | Concord | 25.4% | 2.1%(+23.3)#3 | 3.1%(+22.3)#572 |
| 4. | Wells River | 23.1% | 2.1%(+21.0)#4 | 3.1%(+20.0)#698 |
| 5. | Putney | 22.6% | 2.1%(+20.5)#5 | 3.1%(+19.5)#725 |
| 6. | Lunenburg | 16.5% | 2.1%(+14.4)#6 | 3.1%(+13.4)#1,270 |
| 7. | Greensboro Bend | 16.1% | 2.1%(+14.0)#7 | 3.1%(+13.0)#1,312 |
| 8. | Hartford | 16.0% | 2.1%(+13.9)#8 | 3.1%(+12.9)#1,321 |
| 9. | Wells | 14.0% | 2.1%(+11.9)#9 | 3.1%(+10.9)#1,675 |
| 10. | West Pawlet | 14.0% | 2.1%(+11.9)#10 | 3.1%(+10.9)#1,678 |
| 11. | Manchester | 13.8% | 2.1%(+11.7)#11 | 3.1%(+10.7)#1,706 |
| 12. | Chelsea | 13.4% | 2.1%(+11.3)#12 | 3.1%(+10.3)#1,796 |
| 13. | Algiers | 10.6% | 2.1%(+8.50)#13 | 3.1%(+7.50)#2,619 |
| 14. | North Bennington | 10.3% | 2.1%(+8.20)#14 | 3.1%(+7.20)#2,721 |
| 15. | St Albans | 9.3% | 2.1%(+7.20)#15 | 3.1%(+6.20)#3,172 |
| 16. | Harmonyville | 8.3% | 2.1%(+6.20)#16 | 3.1%(+5.20)#3,744 |
| 17. | Alburgh | 7.9% | 2.1%(+5.80)#17 | 3.1%(+4.80)#3,994 |
| 18. | Pawlet | 7.8% | 2.1%(+5.70)#18 | 3.1%(+4.70)#4,067 |
| 19. | Northfield | 7.5% | 2.1%(+5.40)#19 | 3.1%(+4.40)#4,225 |
| 20. | Castleton Four Corners | 7.4% | 2.1%(+5.30)#20 | 3.1%(+4.30)#4,326 |
| 21. | Richford | 7.3% | 2.1%(+5.20)#21 | 3.1%(+4.20)#4,397 |
| 22. | Beecher Falls | 7.3% | 2.1%(+5.20)#22 | 3.1%(+4.20)#4,438 |
| 23. | Newport | 7.1% | 2.1%(+5.00)#23 | 3.1%(+4.00)#4,528 |
| 24. | St Johnsbury | 7.0% | 2.1%(+4.90)#24 | 3.1%(+3.90)#4,624 |
| 25. | Fairfax | 6.9% | 2.1%(+4.80)#25 | 3.1%(+3.80)#4,749 |
| 26. | Manchester Center | 6.6% | 2.1%(+4.50)#26 | 3.1%(+3.50)#4,997 |
| 27. | Danville | 6.4% | 2.1%(+4.30)#27 | 3.1%(+3.30)#5,236 |
| 28. | Bristol | 5.9% | 2.1%(+3.80)#28 | 3.1%(+2.80)#5,769 |
| 29. | Morrisville | 5.8% | 2.1%(+3.70)#29 | 3.1%(+2.70)#5,885 |
| 30. | Brattleboro | 5.4% | 2.1%(+3.30)#30 | 3.1%(+2.30)#6,358 |
| 31. | Johnson | 5.4% | 2.1%(+3.30)#31 | 3.1%(+2.30)#6,398 |
| 32. | Jacksonville | 5.4% | 2.1%(+3.30)#32 | 3.1%(+2.30)#6,434 |
| 33. | North Troy | 5.0% | 2.1%(+2.90)#33 | 3.1%(+1.90)#7,000 |
| 34. | Derby Center | 4.8% | 2.1%(+2.70)#34 | 3.1%(+1.70)#7,290 |
| 35. | West Woodstock | 4.4% | 2.1%(+2.30)#35 | 3.1%(+1.30)#7,941 |
| 36. | Vergennes | 4.3% | 2.1%(+2.20)#36 | 3.1%(+1.20)#8,042 |
| 37. | West Brattleboro | 4.1% | 2.1%(+2.00)#37 | 3.1%(+1.000)#8,419 |
| 38. | Barton | 4.0% | 2.1%(+1.90)#38 | 3.1%(+0.900)#8,677 |
| 39. | Saxtons River | 4.0% | 2.1%(+1.90)#39 | 3.1%(+0.900)#8,682 |
| 40. | Burlington | 3.9% | 2.1%(+1.80)#40 | 3.1%(+0.800)#8,734 |
| 41. | Barre | 3.8% | 2.1%(+1.70)#41 | 3.1%(+0.700)#8,972 |
| 42. | Brandon | 3.8% | 2.1%(+1.70)#42 | 3.1%(+0.700)#9,026 |
| 43. | Hyde Park | 3.7% | 2.1%(+1.60)#43 | 3.1%(+0.600)#9,286 |
| 44. | Bellows Falls | 3.6% | 2.1%(+1.50)#44 | 3.1%(+0.500)#9,416 |
| 45. | Norwich | 3.3% | 2.1%(+1.20)#45 | 3.1%(+0.200)#10,113 |
| 46. | Enosburg Falls | 3.2% | 2.1%(+1.10)#46 | 3.1%(+0.100)#10,345 |
| 47. | Winooski | 3.1% | 2.1%(+1.000)#47 | 3.1%(=0.000)#10,505 |
| 48. | Middlebury | 3.1% | 2.1%(+1.000)#48 | 3.1%(=0.000)#10,509 |
| 49. | Springfield | 2.6% | 2.1%(+0.500)#49 | 3.1%(-0.500)#11,776 |
| 50. | West Burke | 2.6% | 2.1%(+0.500)#50 | 3.1%(-0.500)#11,935 |
| 51. | Underhill Flats | 2.5% | 2.1%(+0.400)#51 | 3.1%(-0.600)#12,167 |
| 52. | Rutland | 2.4% | 2.1%(+0.300)#52 | 3.1%(-0.700)#12,280 |
| 53. | Bennington | 2.0% | 2.1%(-0.100)#53 | 3.1%(-1.10)#13,523 |
| 54. | Poultney | 1.7% | 2.1%(-0.400)#54 | 3.1%(-1.40)#14,577 |
| 55. | Wallingford | 1.7% | 2.1%(-0.400)#55 | 3.1%(-1.40)#14,619 |
| 56. | South Burlington | 1.5% | 2.1%(-0.600)#56 | 3.1%(-1.60)#15,101 |
| 57. | Windsor | 1.5% | 2.1%(-0.600)#57 | 3.1%(-1.60)#15,233 |
| 58. | Woodstock | 1.4% | 2.1%(-0.700)#58 | 3.1%(-1.70)#15,638 |
| 59. | Stamford | 1.4% | 2.1%(-0.700)#59 | 3.1%(-1.70)#15,686 |
| 60. | Shelburne | 1.0% | 2.1%(-1.10)#60 | 3.1%(-2.10)#16,913 |
| 61. | Montpelier | 0.90% | 2.1%(-1.20)#61 | 3.1%(-2.20)#17,238 |
| 62. | Newbury | 0.80% | 2.1%(-1.30)#62 | 3.1%(-2.30)#17,818 |
| 63. | Fair Haven | 0.70% | 2.1%(-1.40)#63 | 3.1%(-2.40)#18,004 |
| 64. | Randolph | 0.70% | 2.1%(-1.40)#64 | 3.1%(-2.40)#18,013 |
| 65. | Proctor | 0.50% | 2.1%(-1.60)#65 | 3.1%(-2.60)#18,585 |
1
2Common Questions
What are the Top 10 Cities with the Highest Percentage of Families with Income Below $10,000 in Vermont?
Top 10 Cities with the Highest Percentage of Families with Income Below $10,000 in Vermont are:
#1
50.0%
#2
29.1%
#3
25.4%
#4
23.1%
#5
22.6%
#6
16.1%
#7
14.0%
#8
13.8%
#9
13.4%
#10
10.3%
What city has the Highest Percentage of Families with Income Below $10,000 in Vermont?
Newport Center has the Highest Percentage of Families with Income Below $10,000 in Vermont with 50.0%.
What is the Percentage of Families with Income Below $10,000 in the State of Vermont?
Percentage of Families with Income Below $10,000 in Vermont is 2.1%.
What is the Percentage of Families with Income Below $10,000 in the United States?
Percentage of Families with Income Below $10,000 in the United States is 3.1%.