Cities with the Highest Percentage of Families with Income Below $10,000 in Texas
RELATED REPORTS & OPTIONS
Family Income | $0-10k
Texas
Compare Cities
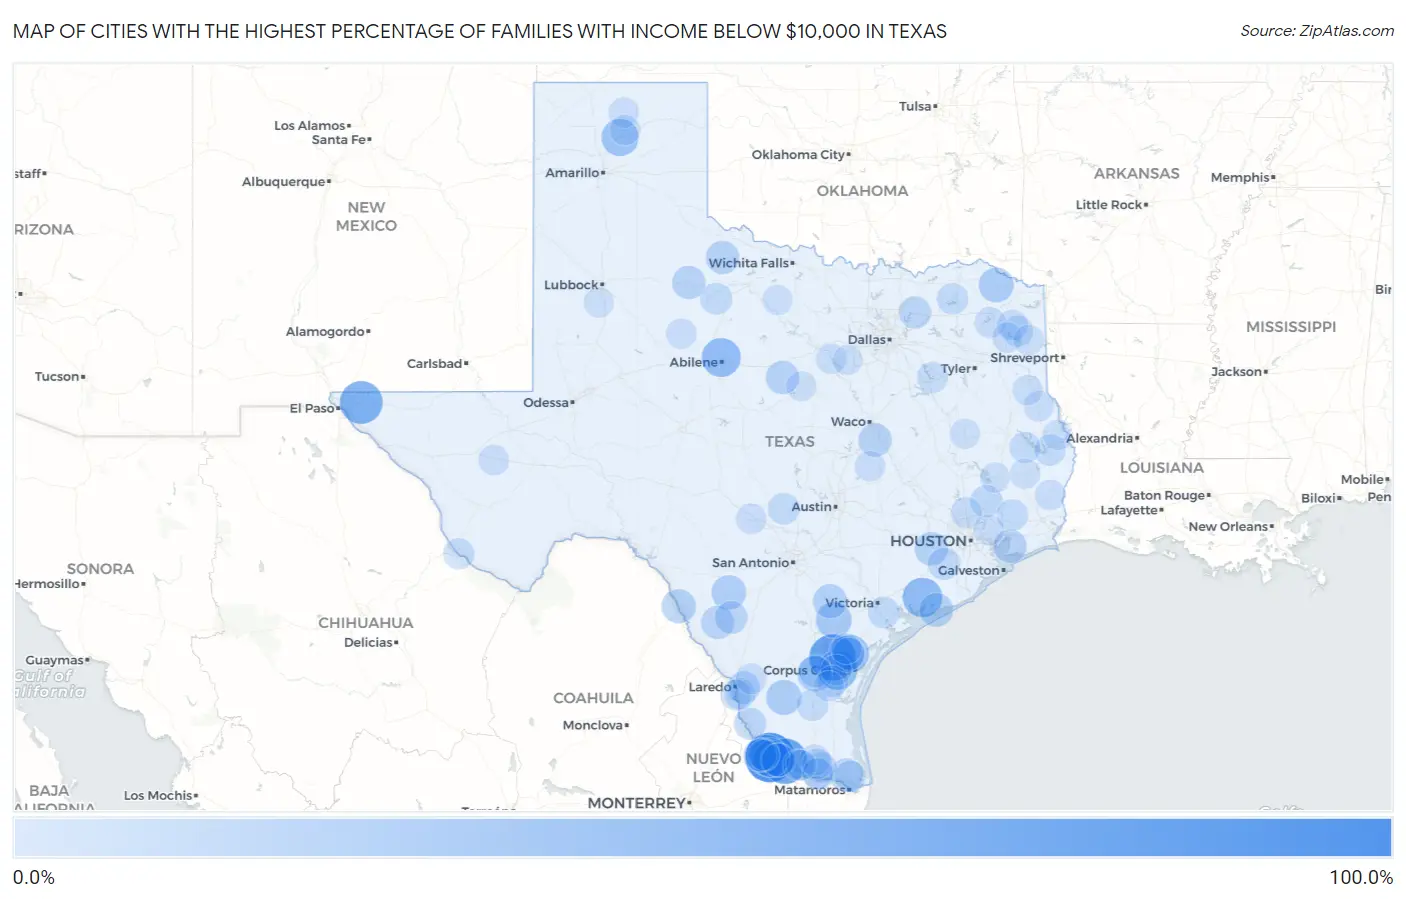
Map of Cities with the Highest Percentage of Families with Income Below $10,000 in Texas
0.0%
100.0%
Cities with the Highest Percentage of Families with Income Below $10,000 in Texas
| City | Families with Income < $10k | vs State | vs National | |
| 1. | Lopeno | 100.0% | 3.5%(+96.5)#1 | 3.1%(+96.9)#23 |
| 2. | Los Alvarez | 95.1% | 3.5%(+91.6)#2 | 3.1%(+92.0)#39 |
| 3. | Sandy Hollow Escondidas | 81.1% | 3.5%(+77.6)#3 | 3.1%(+78.0)#48 |
| 4. | El Socio | 76.2% | 3.5%(+72.7)#4 | 3.1%(+73.1)#54 |
| 5. | Butterfield | 65.6% | 3.5%(+62.1)#5 | 3.1%(+62.5)#71 |
| 6. | North Escobares | 55.1% | 3.5%(+51.6)#6 | 3.1%(+52.0)#97 |
| 7. | Tierra Verde | 52.0% | 3.5%(+48.5)#7 | 3.1%(+48.9)#114 |
| 8. | Blessing | 51.9% | 3.5%(+48.4)#8 | 3.1%(+48.8)#115 |
| 9. | Alanreed | 50.0% | 3.5%(+46.5)#9 | 3.1%(+46.9)#131 |
| 10. | Impact | 50.0% | 3.5%(+46.5)#10 | 3.1%(+46.9)#135 |
| 11. | Barrera | 49.4% | 3.5%(+45.9)#11 | 3.1%(+46.3)#137 |
| 12. | La Paloma Addition | 45.5% | 3.5%(+42.0)#12 | 3.1%(+42.4)#160 |
| 13. | Sanford | 41.7% | 3.5%(+38.2)#13 | 3.1%(+38.6)#194 |
| 14. | La Escondida | 40.0% | 3.5%(+36.5)#14 | 3.1%(+36.9)#210 |
| 15. | Morgan Farm | 36.5% | 3.5%(+33.0)#15 | 3.1%(+33.4)#266 |
| 16. | Normanna | 36.4% | 3.5%(+32.9)#16 | 3.1%(+33.3)#272 |
| 17. | Alice Acres | 34.0% | 3.5%(+30.5)#17 | 3.1%(+30.9)#311 |
| 18. | Salineno North | 33.3% | 3.5%(+29.8)#18 | 3.1%(+30.2)#325 |
| 19. | Las Lomitas | 33.3% | 3.5%(+29.8)#19 | 3.1%(+30.2)#326 |
| 20. | Loma Linda East Cdp Jim Wells County | 33.3% | 3.5%(+29.8)#20 | 3.1%(+30.2)#328 |
| 21. | Annona | 32.7% | 3.5%(+29.2)#21 | 3.1%(+29.6)#340 |
| 22. | Batesville | 31.0% | 3.5%(+27.5)#22 | 3.1%(+27.9)#379 |
| 23. | Fabrica | 29.3% | 3.5%(+25.8)#23 | 3.1%(+26.2)#423 |
| 24. | Kenedy | 28.8% | 3.5%(+25.3)#24 | 3.1%(+25.7)#439 |
| 25. | Ramos | 28.6% | 3.5%(+25.1)#25 | 3.1%(+25.5)#451 |
| 26. | Matagorda | 27.9% | 3.5%(+24.4)#26 | 3.1%(+24.8)#471 |
| 27. | Camargito | 26.7% | 3.5%(+23.2)#27 | 3.1%(+23.6)#514 |
| 28. | Chilton | 26.5% | 3.5%(+23.0)#28 | 3.1%(+23.4)#521 |
| 29. | Wallis | 26.2% | 3.5%(+22.7)#29 | 3.1%(+23.1)#534 |
| 30. | Gorman | 26.2% | 3.5%(+22.7)#30 | 3.1%(+23.1)#535 |
| 31. | Crowell | 25.9% | 3.5%(+22.4)#31 | 3.1%(+22.8)#551 |
| 32. | Guthrie | 25.9% | 3.5%(+22.4)#32 | 3.1%(+22.8)#553 |
| 33. | Oak Island | 25.8% | 3.5%(+22.3)#33 | 3.1%(+22.7)#556 |
| 34. | Garza Salinas Ii | 25.3% | 3.5%(+21.8)#34 | 3.1%(+22.2)#578 |
| 35. | Green Valley Farms | 25.2% | 3.5%(+21.7)#35 | 3.1%(+22.1)#580 |
| 36. | Carrizo Hill | 25.1% | 3.5%(+21.6)#36 | 3.1%(+22.0)#583 |
| 37. | Salida Del Sol Estates | 23.9% | 3.5%(+20.4)#37 | 3.1%(+20.8)#650 |
| 38. | Big Wells | 23.4% | 3.5%(+19.9)#38 | 3.1%(+20.3)#679 |
| 39. | Fronton | 23.3% | 3.5%(+19.8)#39 | 3.1%(+20.2)#683 |
| 40. | Ranchitos East | 22.6% | 3.5%(+19.1)#40 | 3.1%(+19.5)#726 |
| 41. | Farmersville | 21.5% | 3.5%(+18.0)#41 | 3.1%(+18.4)#785 |
| 42. | Mcleod | 21.5% | 3.5%(+18.0)#42 | 3.1%(+18.4)#789 |
| 43. | Medina | 21.3% | 3.5%(+17.8)#43 | 3.1%(+18.2)#805 |
| 44. | Needville | 20.9% | 3.5%(+17.4)#44 | 3.1%(+17.8)#823 |
| 45. | Del Sol | 20.8% | 3.5%(+17.3)#45 | 3.1%(+17.7)#835 |
| 46. | Rancho Alegre | 20.5% | 3.5%(+17.0)#46 | 3.1%(+17.4)#858 |
| 47. | North Cleveland | 20.0% | 3.5%(+16.5)#47 | 3.1%(+16.9)#898 |
| 48. | Grangerland | 19.9% | 3.5%(+16.4)#48 | 3.1%(+16.8)#923 |
| 49. | Stonewall | 19.5% | 3.5%(+16.0)#49 | 3.1%(+16.4)#951 |
| 50. | Bloomington | 19.3% | 3.5%(+15.8)#50 | 3.1%(+16.2)#973 |
| 51. | O Brien | 19.0% | 3.5%(+15.5)#51 | 3.1%(+15.9)#1,008 |
| 52. | Falfurrias | 18.7% | 3.5%(+15.2)#52 | 3.1%(+15.6)#1,028 |
| 53. | Scissors | 18.6% | 3.5%(+15.1)#53 | 3.1%(+15.5)#1,034 |
| 54. | Cooper | 18.2% | 3.5%(+14.7)#54 | 3.1%(+15.1)#1,073 |
| 55. | Bishop | 18.0% | 3.5%(+14.5)#55 | 3.1%(+14.9)#1,105 |
| 56. | Indian Lake | 17.9% | 3.5%(+14.4)#56 | 3.1%(+14.8)#1,114 |
| 57. | Hull | 17.6% | 3.5%(+14.1)#57 | 3.1%(+14.5)#1,142 |
| 58. | La Presa | 17.6% | 3.5%(+14.1)#58 | 3.1%(+14.5)#1,146 |
| 59. | Olivarez | 17.4% | 3.5%(+13.9)#59 | 3.1%(+14.3)#1,163 |
| 60. | Browndell | 17.4% | 3.5%(+13.9)#60 | 3.1%(+14.3)#1,168 |
| 61. | Doffing | 17.2% | 3.5%(+13.7)#61 | 3.1%(+14.1)#1,178 |
| 62. | Zavalla | 17.1% | 3.5%(+13.6)#62 | 3.1%(+14.0)#1,195 |
| 63. | Avinger | 17.1% | 3.5%(+13.6)#63 | 3.1%(+14.0)#1,196 |
| 64. | Presidio | 16.8% | 3.5%(+13.3)#64 | 3.1%(+13.7)#1,226 |
| 65. | Doolittle | 16.5% | 3.5%(+13.0)#65 | 3.1%(+13.4)#1,262 |
| 66. | Shenandoah | 16.4% | 3.5%(+12.9)#66 | 3.1%(+13.3)#1,272 |
| 67. | Caney City | 16.4% | 3.5%(+12.9)#67 | 3.1%(+13.3)#1,282 |
| 68. | Spring Gardens | 16.2% | 3.5%(+12.7)#68 | 3.1%(+13.1)#1,294 |
| 69. | Rocky Mound | 16.2% | 3.5%(+12.7)#69 | 3.1%(+13.1)#1,296 |
| 70. | Hughes Springs | 15.9% | 3.5%(+12.4)#70 | 3.1%(+12.8)#1,332 |
| 71. | Rio Bravo | 15.5% | 3.5%(+12.0)#71 | 3.1%(+12.4)#1,381 |
| 72. | Roma | 15.1% | 3.5%(+11.6)#72 | 3.1%(+12.0)#1,448 |
| 73. | Balmorhea | 15.0% | 3.5%(+11.5)#73 | 3.1%(+11.9)#1,462 |
| 74. | Donna | 14.9% | 3.5%(+11.4)#74 | 3.1%(+11.8)#1,468 |
| 75. | Ranchitos Las Lomas | 14.8% | 3.5%(+11.3)#75 | 3.1%(+11.7)#1,498 |
| 76. | St Paul | 14.7% | 3.5%(+11.2)#76 | 3.1%(+11.6)#1,514 |
| 77. | Ore City | 14.5% | 3.5%(+11.0)#77 | 3.1%(+11.4)#1,550 |
| 78. | Kingsville | 14.4% | 3.5%(+10.9)#78 | 3.1%(+11.3)#1,559 |
| 79. | Buckholts | 14.4% | 3.5%(+10.9)#79 | 3.1%(+11.3)#1,576 |
| 80. | Crosby | 14.3% | 3.5%(+10.8)#80 | 3.1%(+11.2)#1,587 |
| 81. | Morse | 14.3% | 3.5%(+10.8)#81 | 3.1%(+11.2)#1,600 |
| 82. | San Carlos | 14.2% | 3.5%(+10.7)#82 | 3.1%(+11.1)#1,629 |
| 83. | Center | 14.1% | 3.5%(+10.6)#83 | 3.1%(+11.0)#1,641 |
| 84. | Ingram | 14.1% | 3.5%(+10.6)#84 | 3.1%(+11.0)#1,645 |
| 85. | Rotan | 14.1% | 3.5%(+10.6)#85 | 3.1%(+11.0)#1,651 |
| 86. | Oak Trail Shores | 14.0% | 3.5%(+10.5)#86 | 3.1%(+10.9)#1,666 |
| 87. | Buna | 14.0% | 3.5%(+10.5)#87 | 3.1%(+10.9)#1,670 |
| 88. | Stinnett | 13.8% | 3.5%(+10.3)#88 | 3.1%(+10.7)#1,703 |
| 89. | Gary City | 13.8% | 3.5%(+10.3)#89 | 3.1%(+10.7)#1,711 |
| 90. | Woodville | 13.7% | 3.5%(+10.2)#90 | 3.1%(+10.6)#1,718 |
| 91. | Olney | 13.6% | 3.5%(+10.1)#91 | 3.1%(+10.5)#1,733 |
| 92. | Livingston | 13.5% | 3.5%(+10.00)#92 | 3.1%(+10.4)#1,759 |
| 93. | Godley | 13.3% | 3.5%(+9.80)#93 | 3.1%(+10.2)#1,808 |
| 94. | West Sharyland | 13.3% | 3.5%(+9.80)#94 | 3.1%(+10.2)#1,809 |
| 95. | Forest Heights | 13.2% | 3.5%(+9.70)#95 | 3.1%(+10.1)#1,834 |
| 96. | Jefferson | 13.1% | 3.5%(+9.60)#96 | 3.1%(+10.00)#1,854 |
| 97. | Hemphill | 13.1% | 3.5%(+9.60)#97 | 3.1%(+10.00)#1,856 |
| 98. | New Home | 13.1% | 3.5%(+9.60)#98 | 3.1%(+10.00)#1,865 |
| 99. | Latexo | 13.1% | 3.5%(+9.60)#99 | 3.1%(+10.00)#1,866 |
| 100. | Dublin | 13.0% | 3.5%(+9.50)#100 | 3.1%(+9.90)#1,872 |
Common Questions
What are the Top 10 Cities with the Highest Percentage of Families with Income Below $10,000 in Texas?
Top 10 Cities with the Highest Percentage of Families with Income Below $10,000 in Texas are:
#1
95.1%
#2
81.1%
#3
76.2%
#4
65.6%
#5
55.1%
#6
52.0%
#7
51.9%
#8
50.0%
#9
49.4%
#10
45.5%
What city has the Highest Percentage of Families with Income Below $10,000 in Texas?
Los Alvarez has the Highest Percentage of Families with Income Below $10,000 in Texas with 95.1%.
What is the Percentage of Families with Income Below $10,000 in the State of Texas?
Percentage of Families with Income Below $10,000 in Texas is 3.5%.
What is the Percentage of Families with Income Below $10,000 in the United States?
Percentage of Families with Income Below $10,000 in the United States is 3.1%.