Kettleman City, CA Map & Demographics
Kettleman City Map
Kettleman City Overview
$20,503
PER CAPITA INCOME
$41,793
AVG FAMILY INCOME
$46,261
AVG HOUSEHOLD INCOME
0.35
INEQUALITY / GINI INDEX
956
TOTAL POPULATION
569
MALE POPULATION
387
FEMALE POPULATION
147.03
MALES / 100 FEMALES
68.01
FEMALES / 100 MALES
42.0
MEDIAN AGE
2.8
AVG FAMILY SIZE
2.5
AVG HOUSEHOLD SIZE
590
LABOR FORCE [ PEOPLE ]
73.5%
PERCENT IN LABOR FORCE
7.8%
UNEMPLOYMENT RATE
Kettleman City Zip Codes
Kettleman City Area Codes
Income in Kettleman City
Income Overview in Kettleman City
Per Capita Income in Kettleman City is $20,503, while median incomes of families and households are $41,793 and $46,261 respectively.
| Characteristic | Number | Measure |
| Per Capita Income | 956 | $20,503 |
| Median Family Income | 261 | $41,793 |
| Mean Family Income | 261 | $54,923 |
| Median Household Income | 385 | $46,261 |
| Mean Household Income | 385 | $55,062 |
| Income Deficit | 261 | $0 |
| Wage / Income Gap (%) | 956 | 0.00% |
| Wage / Income Gap ($) | 956 | 100.00¢ per $1 |
| Gini / Inequality Index | 956 | 0.35 |
Earnings by Sex in Kettleman City
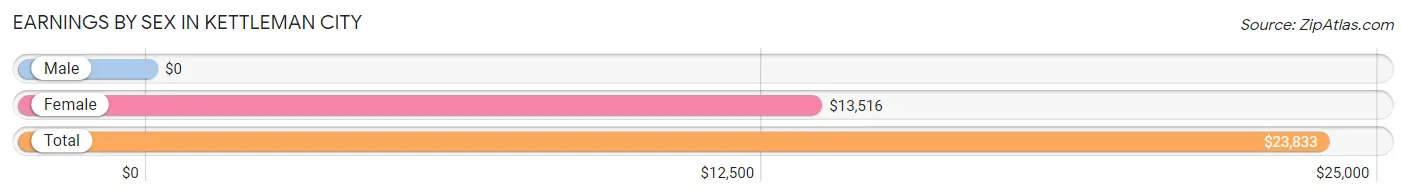
| Sex | Number | Average Earnings |
| Male | 389 (60.2%) | $0 |
| Female | 257 (39.8%) | $13,516 |
| Total | 646 (100.0%) | $23,833 |
Earnings by Sex by Income Bracket in Kettleman City
The most common earnings brackets in Kettleman City are $45,000 to $49,999 for men (134 | 34.4%) and $10,000 to $12,499 for women (53 | 20.6%).
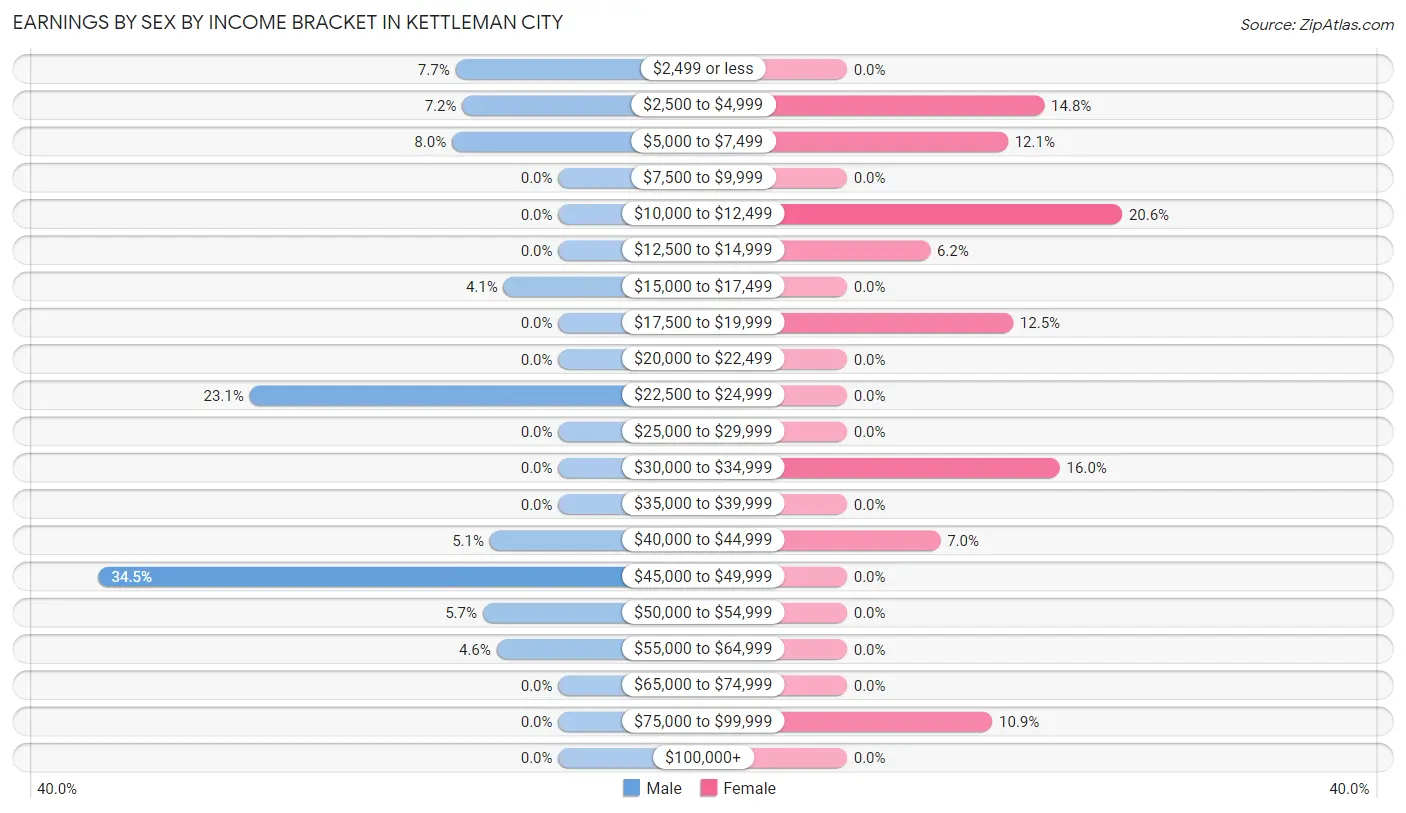
| Income | Male | Female |
| $2,499 or less | 30 (7.7%) | 0 (0.0%) |
| $2,500 to $4,999 | 28 (7.2%) | 38 (14.8%) |
| $5,000 to $7,499 | 31 (8.0%) | 31 (12.1%) |
| $7,500 to $9,999 | 0 (0.0%) | 0 (0.0%) |
| $10,000 to $12,499 | 0 (0.0%) | 53 (20.6%) |
| $12,500 to $14,999 | 0 (0.0%) | 16 (6.2%) |
| $15,000 to $17,499 | 16 (4.1%) | 0 (0.0%) |
| $17,500 to $19,999 | 0 (0.0%) | 32 (12.4%) |
| $20,000 to $22,499 | 0 (0.0%) | 0 (0.0%) |
| $22,500 to $24,999 | 90 (23.1%) | 0 (0.0%) |
| $25,000 to $29,999 | 0 (0.0%) | 0 (0.0%) |
| $30,000 to $34,999 | 0 (0.0%) | 41 (16.0%) |
| $35,000 to $39,999 | 0 (0.0%) | 0 (0.0%) |
| $40,000 to $44,999 | 20 (5.1%) | 18 (7.0%) |
| $45,000 to $49,999 | 134 (34.4%) | 0 (0.0%) |
| $50,000 to $54,999 | 22 (5.7%) | 0 (0.0%) |
| $55,000 to $64,999 | 18 (4.6%) | 0 (0.0%) |
| $65,000 to $74,999 | 0 (0.0%) | 0 (0.0%) |
| $75,000 to $99,999 | 0 (0.0%) | 28 (10.9%) |
| $100,000+ | 0 (0.0%) | 0 (0.0%) |
| Total | 389 (100.0%) | 257 (100.0%) |
Earnings by Sex by Educational Attainment in Kettleman City
Average earnings in Kettleman City are $44,188 for men and $13,516 for women, a difference of 69.4%. Men with an educational attainment of less than high school enjoy the highest average annual earnings of $23,804, while those with less than high school education earn the least with $23,804. Women with an educational attainment of college or associate's degree earn the most with the average annual earnings of $10,739, while those with college or associate's degree education have the smallest earnings of $10,739.
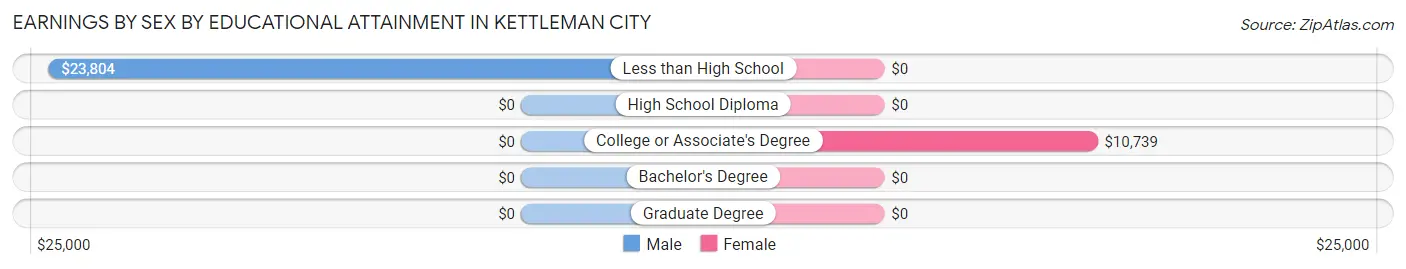
| Educational Attainment | Male Income | Female Income |
| Less than High School | $23,804 | $0 |
| High School Diploma | - | - |
| College or Associate's Degree | - | - |
| Bachelor's Degree | - | - |
| Graduate Degree | - | - |
| Total | $44,188 | $13,516 |
Family Income in Kettleman City
Family Income Brackets in Kettleman City
According to the Kettleman City family income data, there are 62 families falling into the $50,000 to $74,999 income range, which is the most common income bracket and makes up 23.7% of all families.
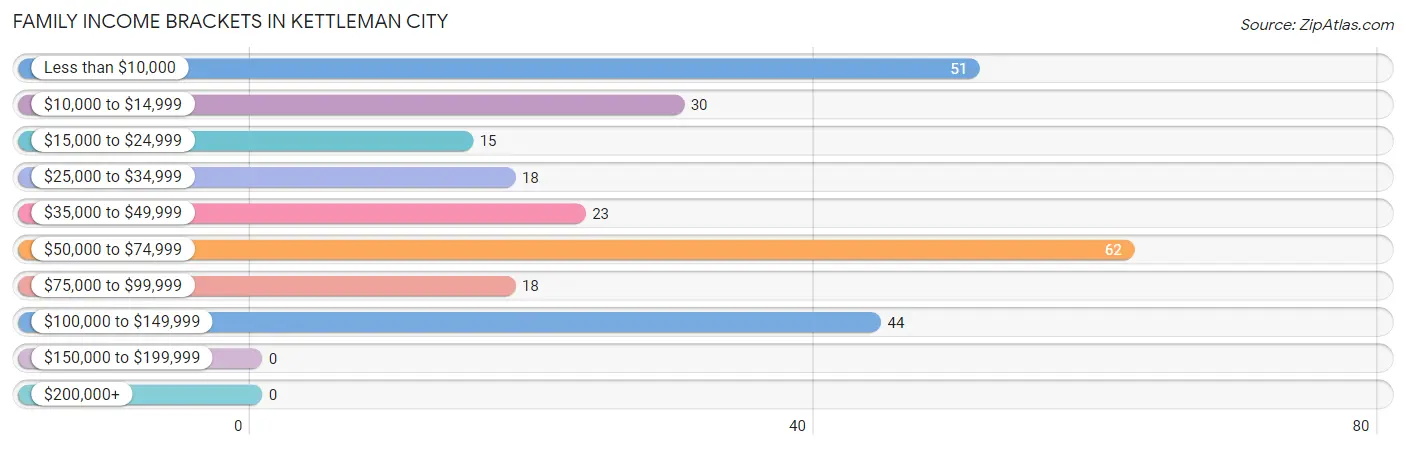
| Income Bracket | # Families | % Families |
| Less than $10,000 | 51 | 19.5% |
| $10,000 to $14,999 | 30 | 11.5% |
| $15,000 to $24,999 | 15 | 5.7% |
| $25,000 to $34,999 | 18 | 6.9% |
| $35,000 to $49,999 | 23 | 8.8% |
| $50,000 to $74,999 | 62 | 23.8% |
| $75,000 to $99,999 | 18 | 6.9% |
| $100,000 to $149,999 | 44 | 16.9% |
| $150,000 to $199,999 | 0 | 0.0% |
| $200,000+ | 0 | 0.0% |
Family Income by Famaliy Size in Kettleman City
| Income Bracket | # Families | Median Income |
| 2-Person Families | 136 (52.1%) | $0 |
| 3-Person Families | 48 (18.4%) | $0 |
| 4-Person Families | 59 (22.6%) | $0 |
| 5-Person Families | 0 (0.0%) | $0 |
| 6-Person Families | 18 (6.9%) | $0 |
| 7+ Person Families | 0 (0.0%) | $0 |
| Total | 261 (100.0%) | $41,793 |
Family Income by Number of Earners in Kettleman City
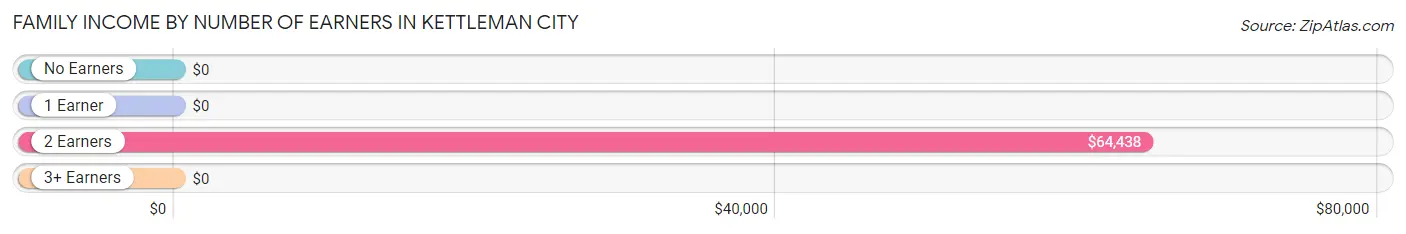
| Number of Earners | # Families | Median Income |
| No Earners | 20 (7.7%) | $0 |
| 1 Earner | 46 (17.6%) | $0 |
| 2 Earners | 177 (67.8%) | $64,438 |
| 3+ Earners | 18 (6.9%) | $0 |
| Total | 261 (100.0%) | $41,793 |
Household Income in Kettleman City
Household Income Brackets in Kettleman City
With 148 households falling in the category, the $35,000 to $49,999 income range is the most frequent in Kettleman City, accounting for 38.4% of all households.
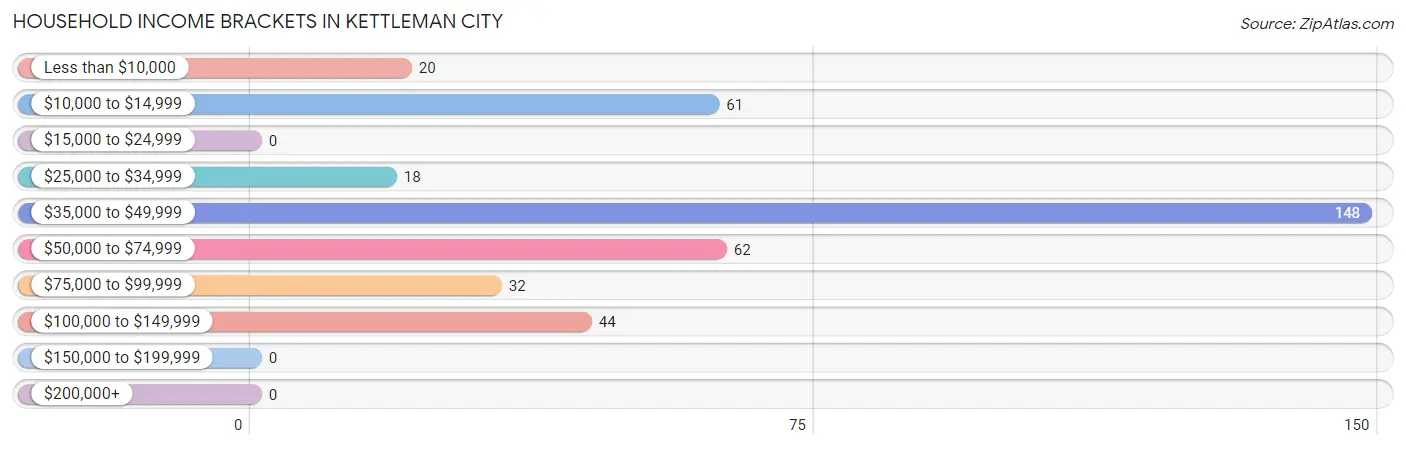
| Income Bracket | # Households | % Households |
| Less than $10,000 | 20 | 5.2% |
| $10,000 to $14,999 | 61 | 15.8% |
| $15,000 to $24,999 | 0 | 0.0% |
| $25,000 to $34,999 | 18 | 4.7% |
| $35,000 to $49,999 | 148 | 38.4% |
| $50,000 to $74,999 | 62 | 16.1% |
| $75,000 to $99,999 | 32 | 8.3% |
| $100,000 to $149,999 | 44 | 11.4% |
| $150,000 to $199,999 | 0 | 0.0% |
| $200,000+ | 0 | 0.0% |
Household Income by Householder Age in Kettleman City
The median household income in Kettleman City is $46,261, with the highest median household income of $46,318 found in the 25 to 44 years age bracket for the primary householder. A total of 208 households (54.0%) fall into this category.
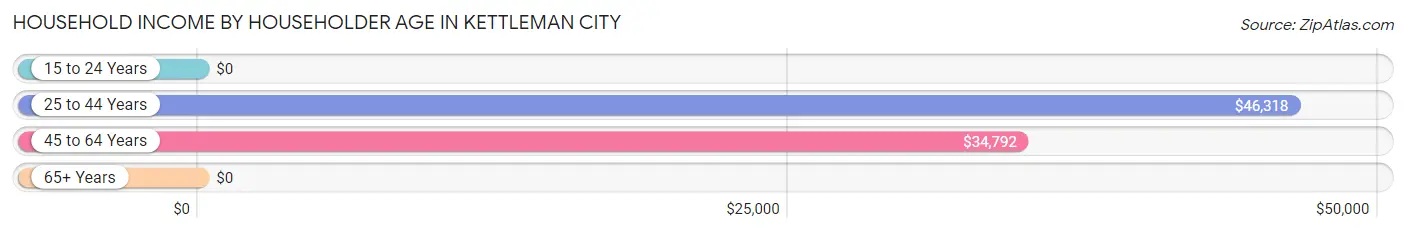
| Income Bracket | # Households | Median Income |
| 15 to 24 Years | 0 (0.0%) | $0 |
| 25 to 44 Years | 208 (54.0%) | $46,318 |
| 45 to 64 Years | 133 (34.5%) | $34,792 |
| 65+ Years | 44 (11.4%) | $0 |
| Total | 385 (100.0%) | $46,261 |
Poverty in Kettleman City
Income Below Poverty by Sex and Age in Kettleman City
With 27.1% poverty level for males and 31.0% for females among the residents of Kettleman City, 6 to 11 year old males and 5 year old females are the most vulnerable to poverty, with 17 males (100.0%) and 19 females (100.0%) in their respective age groups living below the poverty level.
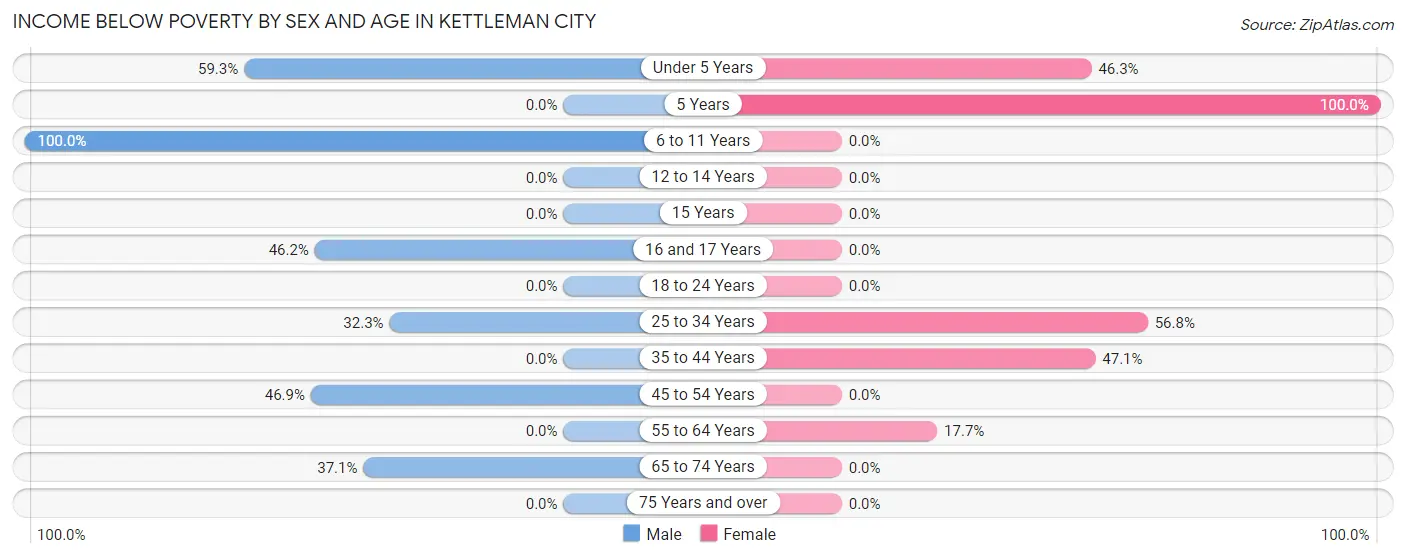
| Age Bracket | Male | Female |
| Under 5 Years | 32 (59.3%) | 19 (46.3%) |
| 5 Years | 0 (0.0%) | 19 (100.0%) |
| 6 to 11 Years | 17 (100.0%) | 0 (0.0%) |
| 12 to 14 Years | 0 (0.0%) | 0 (0.0%) |
| 15 Years | 0 (0.0%) | 0 (0.0%) |
| 16 and 17 Years | 18 (46.2%) | 0 (0.0%) |
| 18 to 24 Years | 0 (0.0%) | 0 (0.0%) |
| 25 to 34 Years | 31 (32.3%) | 46 (56.8%) |
| 35 to 44 Years | 0 (0.0%) | 16 (47.1%) |
| 45 to 54 Years | 30 (46.9%) | 0 (0.0%) |
| 55 to 64 Years | 0 (0.0%) | 20 (17.7%) |
| 65 to 74 Years | 26 (37.1%) | 0 (0.0%) |
| 75 Years and over | 0 (0.0%) | 0 (0.0%) |
| Total | 154 (27.1%) | 120 (31.0%) |
Income Above Poverty by Sex and Age in Kettleman City
According to the poverty statistics in Kettleman City, males aged 18 to 24 years and females aged 6 to 11 years are the age groups that are most secure financially, with 100.0% of males and 100.0% of females in these age groups living above the poverty line.
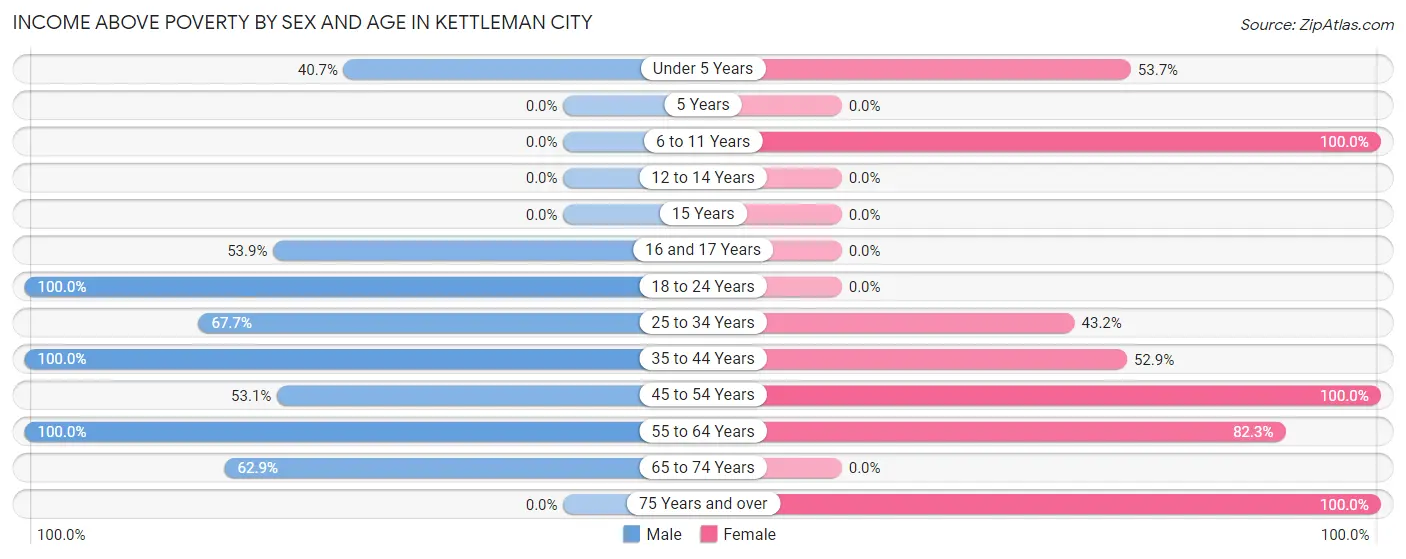
| Age Bracket | Male | Female |
| Under 5 Years | 22 (40.7%) | 22 (53.7%) |
| 5 Years | 0 (0.0%) | 0 (0.0%) |
| 6 to 11 Years | 0 (0.0%) | 22 (100.0%) |
| 12 to 14 Years | 0 (0.0%) | 0 (0.0%) |
| 15 Years | 0 (0.0%) | 0 (0.0%) |
| 16 and 17 Years | 21 (53.8%) | 0 (0.0%) |
| 18 to 24 Years | 28 (100.0%) | 0 (0.0%) |
| 25 to 34 Years | 65 (67.7%) | 35 (43.2%) |
| 35 to 44 Years | 158 (100.0%) | 18 (52.9%) |
| 45 to 54 Years | 34 (53.1%) | 49 (100.0%) |
| 55 to 64 Years | 43 (100.0%) | 93 (82.3%) |
| 65 to 74 Years | 44 (62.9%) | 0 (0.0%) |
| 75 Years and over | 0 (0.0%) | 28 (100.0%) |
| Total | 415 (72.9%) | 267 (69.0%) |
Income Below Poverty Among Married-Couple Families in Kettleman City
The poverty statistics for married-couple families in Kettleman City show that 26.0% or 50 of the total 192 families live below the poverty line. Families with 1 or 2 children have the highest poverty rate of 100.0%, comprising of 30 families. On the other hand, families with 3 or 4 children have the lowest poverty rate of 0.0%, which includes 0 families.
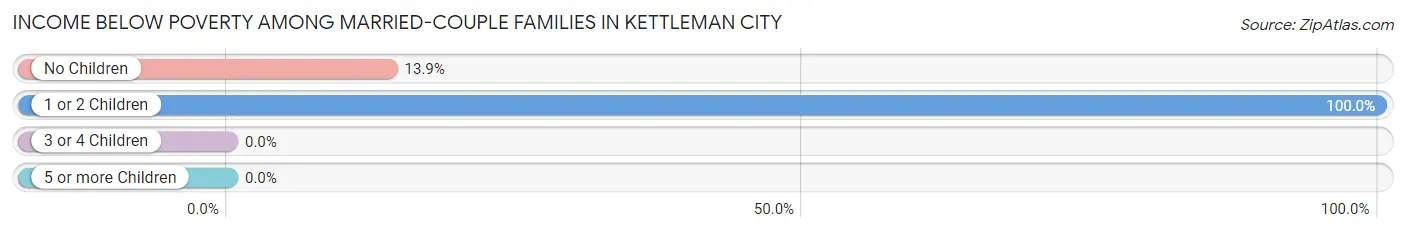
| Children | Above Poverty | Below Poverty |
| No Children | 124 (86.1%) | 20 (13.9%) |
| 1 or 2 Children | 0 (0.0%) | 30 (100.0%) |
| 3 or 4 Children | 18 (100.0%) | 0 (0.0%) |
| 5 or more Children | 0 (0.0%) | 0 (0.0%) |
| Total | 142 (74.0%) | 50 (26.0%) |
Income Below Poverty Among Single-Parent Households in Kettleman City
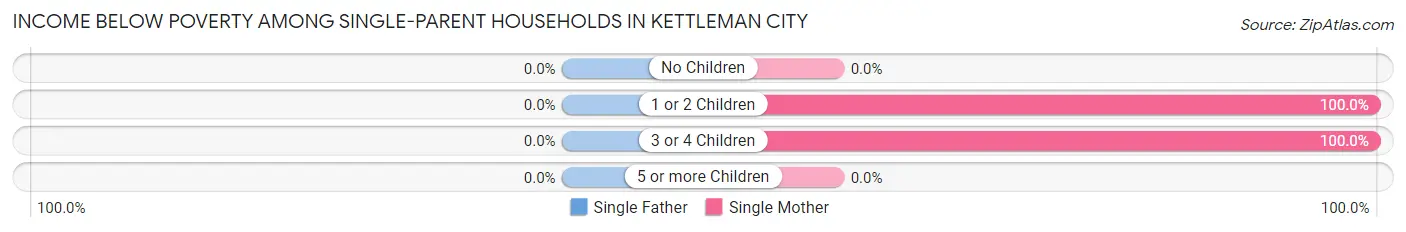
| Children | Single Father | Single Mother |
| No Children | 0 (0.0%) | 0 (0.0%) |
| 1 or 2 Children | 0 (0.0%) | 31 (100.0%) |
| 3 or 4 Children | 0 (0.0%) | 15 (100.0%) |
| 5 or more Children | 0 (0.0%) | 0 (0.0%) |
| Total | 0 (0.0%) | 46 (66.7%) |
Income Below Poverty Among Married-Couple vs Single-Parent Households in Kettleman City
The poverty data for Kettleman City shows that 50 of the married-couple family households (26.0%) and 46 of the single-parent households (66.7%) are living below the poverty level. Within the married-couple family households, those with 1 or 2 children have the highest poverty rate, with 30 households (100.0%) falling below the poverty line. Among the single-parent households, those with 1 or 2 children have the highest poverty rate, with 31 household (100.0%) living below poverty.
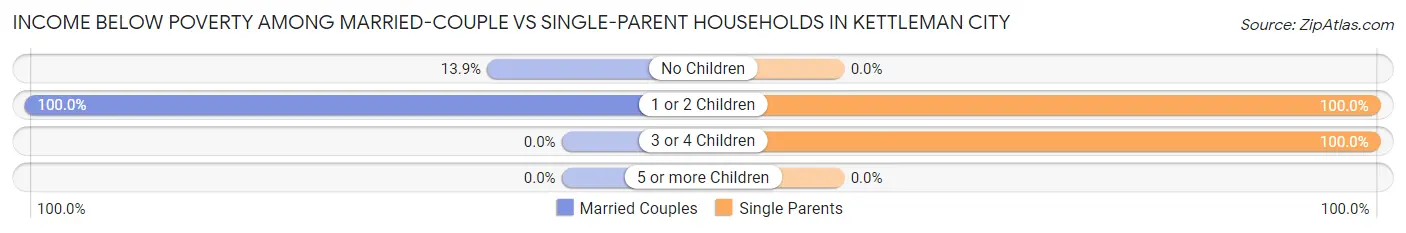
| Children | Married-Couple Families | Single-Parent Households |
| No Children | 20 (13.9%) | 0 (0.0%) |
| 1 or 2 Children | 30 (100.0%) | 31 (100.0%) |
| 3 or 4 Children | 0 (0.0%) | 15 (100.0%) |
| 5 or more Children | 0 (0.0%) | 0 (0.0%) |
| Total | 50 (26.0%) | 46 (66.7%) |
Race in Kettleman City
The most populous races in Kettleman City are Hispanic or Latino (956 | 100.0%), Some other Race (505 | 52.8%), and White / Caucasian (279 | 29.2%).
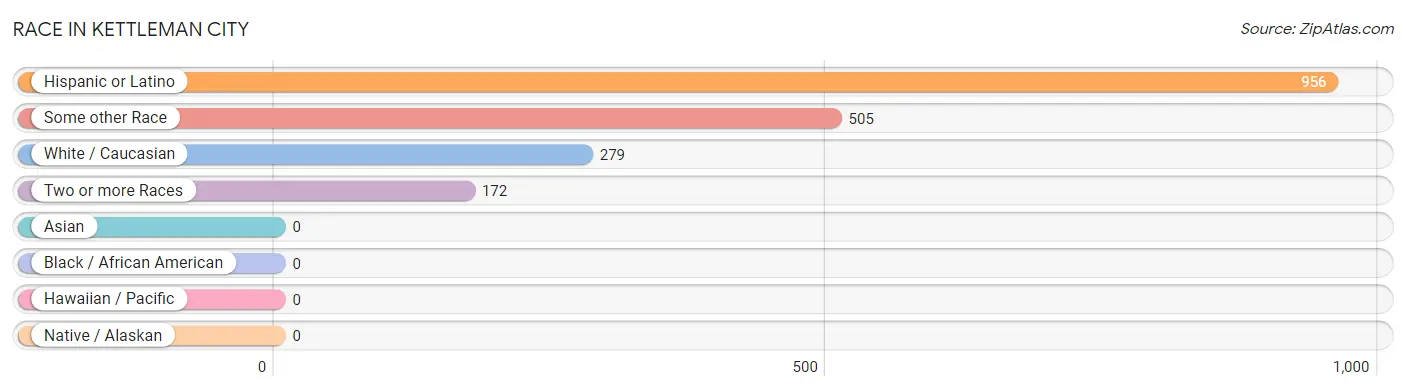
| Race | # Population | % Population |
| Asian | 0 | 0.0% |
| Black / African American | 0 | 0.0% |
| Hawaiian / Pacific | 0 | 0.0% |
| Hispanic or Latino | 956 | 100.0% |
| Native / Alaskan | 0 | 0.0% |
| White / Caucasian | 279 | 29.2% |
| Two or more Races | 172 | 18.0% |
| Some other Race | 505 | 52.8% |
| Total | 956 | 100.0% |
Ancestry in Kettleman City
The most populous ancestries reported in Kettleman City are , and Mexican (956 | 100.0%), together accounting for 100.0% of all Kettleman City residents.

| Ancestry | # Population | % Population |
| Mexican | 956 | 100.0% | View All 1 Rows |
Immigrants in Kettleman City
The most numerous immigrant groups reported in Kettleman City came from Central America (519 | 54.3%), Latin America (519 | 54.3%), and Mexico (519 | 54.3%), together accounting for 162.9% of all Kettleman City residents.
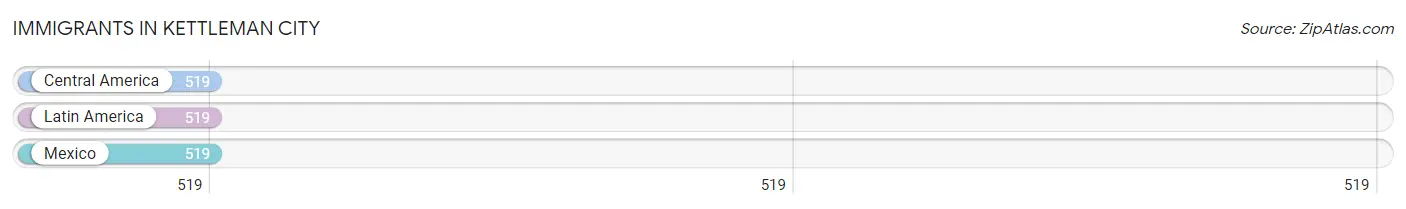
| Immigration Origin | # Population | % Population |
| Central America | 519 | 54.3% |
| Latin America | 519 | 54.3% |
| Mexico | 519 | 54.3% | View All 3 Rows |
Sex and Age in Kettleman City
Sex and Age in Kettleman City
The most populous age groups in Kettleman City are 40 to 44 Years (127 | 22.3%) for men and 55 to 59 Years (62 | 16.0%) for women.
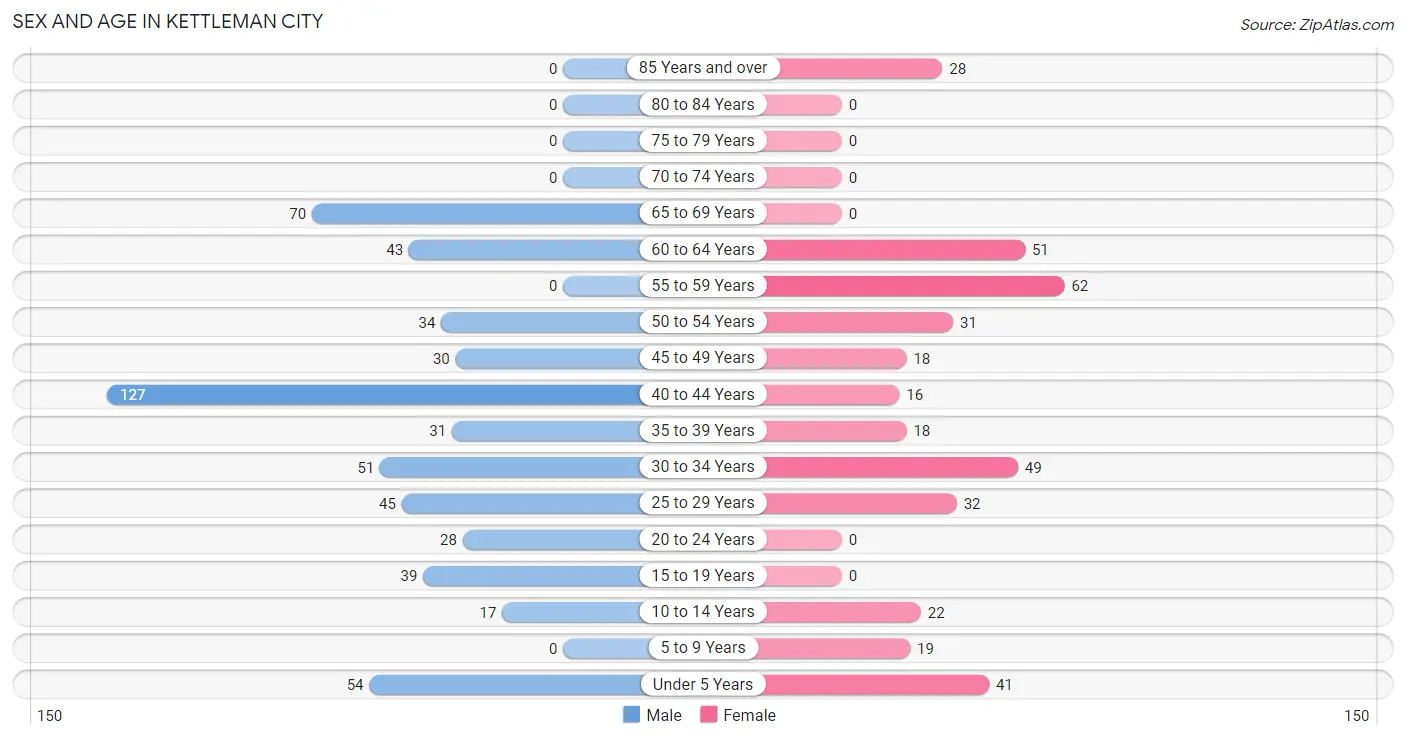
| Age Bracket | Male | Female |
| Under 5 Years | 54 (9.5%) | 41 (10.6%) |
| 5 to 9 Years | 0 (0.0%) | 19 (4.9%) |
| 10 to 14 Years | 17 (3.0%) | 22 (5.7%) |
| 15 to 19 Years | 39 (6.9%) | 0 (0.0%) |
| 20 to 24 Years | 28 (4.9%) | 0 (0.0%) |
| 25 to 29 Years | 45 (7.9%) | 32 (8.3%) |
| 30 to 34 Years | 51 (9.0%) | 49 (12.7%) |
| 35 to 39 Years | 31 (5.4%) | 18 (4.6%) |
| 40 to 44 Years | 127 (22.3%) | 16 (4.1%) |
| 45 to 49 Years | 30 (5.3%) | 18 (4.6%) |
| 50 to 54 Years | 34 (6.0%) | 31 (8.0%) |
| 55 to 59 Years | 0 (0.0%) | 62 (16.0%) |
| 60 to 64 Years | 43 (7.6%) | 51 (13.2%) |
| 65 to 69 Years | 70 (12.3%) | 0 (0.0%) |
| 70 to 74 Years | 0 (0.0%) | 0 (0.0%) |
| 75 to 79 Years | 0 (0.0%) | 0 (0.0%) |
| 80 to 84 Years | 0 (0.0%) | 0 (0.0%) |
| 85 Years and over | 0 (0.0%) | 28 (7.2%) |
| Total | 569 (100.0%) | 387 (100.0%) |
Families and Households in Kettleman City
Median Family Size in Kettleman City
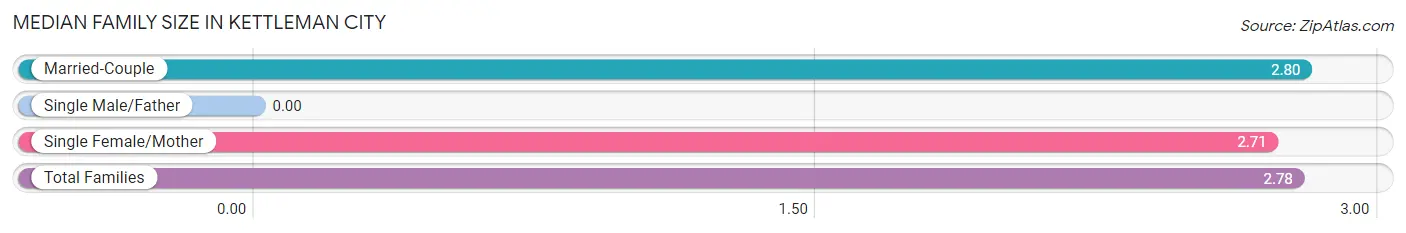
| Family Type | # Families | Family Size |
| Married-Couple | 192 (73.6%) | 2.80 |
| Single Male/Father | 0 (0.0%) | - |
| Single Female/Mother | 69 (26.4%) | 2.71 |
| Total Families | 261 (100.0%) | 2.78 |
Median Household Size in Kettleman City
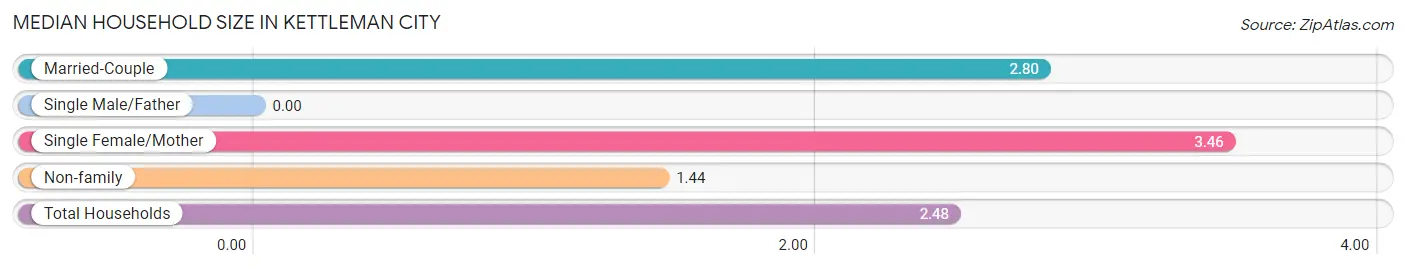
| Household Type | # Households | Household Size |
| Married-Couple | 192 (49.9%) | 2.80 |
| Single Male/Father | 0 (0.0%) | - |
| Single Female/Mother | 69 (17.9%) | 3.46 |
| Non-family | 124 (32.2%) | 1.44 |
| Total Households | 385 (100.0%) | 2.48 |
Household Size by Marriage Status in Kettleman City
Out of a total of 385 households in Kettleman City, 261 (67.8%) are family households, while 124 (32.2%) are nonfamily households. The most numerous type of family households are 2-person households, comprising 105, and the most common type of nonfamily households are 1-person households, comprising 110.
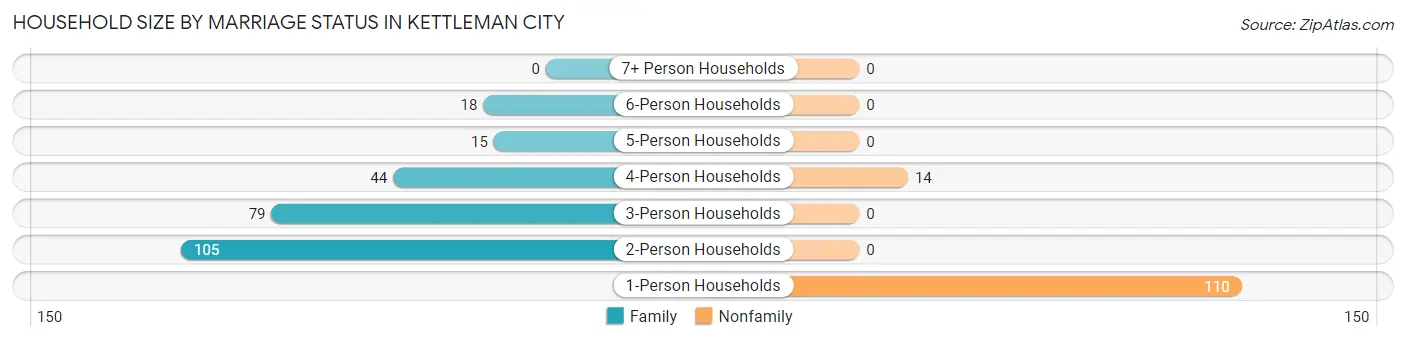
| Household Size | Family Households | Nonfamily Households |
| 1-Person Households | - | 110 (28.6%) |
| 2-Person Households | 105 (27.3%) | 0 (0.0%) |
| 3-Person Households | 79 (20.5%) | 0 (0.0%) |
| 4-Person Households | 44 (11.4%) | 14 (3.6%) |
| 5-Person Households | 15 (3.9%) | 0 (0.0%) |
| 6-Person Households | 18 (4.7%) | 0 (0.0%) |
| 7+ Person Households | 0 (0.0%) | 0 (0.0%) |
| Total | 261 (67.8%) | 124 (32.2%) |
Female Fertility in Kettleman City
Fertility by Age in Kettleman City
| Age Bracket | Women with Births | Births / 1,000 Women |
| 15 to 19 years | 0 (0.0%) | 0.0 |
| 20 to 34 years | 0 (0.0%) | 0.0 |
| 35 to 50 years | 0 (0.0%) | 0.0 |
| Total | 0 (0.0%) | 0.0 |
Fertility by Age by Marriage Status in Kettleman City
| Age Bracket | Married | Unmarried |
| 15 to 19 years | 0 (0.0%) | 0 (0.0%) |
| 20 to 34 years | 0 (0.0%) | 0 (0.0%) |
| 35 to 50 years | 0 (0.0%) | 0 (0.0%) |
| Total | 0 (0.0%) | 0 (0.0%) |
Fertility by Education in Kettleman City
| Educational Attainment | Women with Births | Births / 1,000 Women |
| Less than High School | 0 (0.0%) | 0.0 |
| High School Diploma | 0 (0.0%) | 0.0 |
| College or Associate's Degree | 0 (0.0%) | 0.0 |
| Bachelor's Degree | 0 (0.0%) | 0.0 |
| Graduate Degree | 0 (0.0%) | 0.0 |
| Total | 0 (0.0%) | 0.0 |
Fertility by Education by Marriage Status in Kettleman City
| Educational Attainment | Married | Unmarried |
| Less than High School | 0 (0.0%) | 0 (0.0%) |
| High School Diploma | 0 (0.0%) | 0 (0.0%) |
| College or Associate's Degree | 0 (0.0%) | 0 (0.0%) |
| Bachelor's Degree | 0 (0.0%) | 0 (0.0%) |
| Graduate Degree | 0 (0.0%) | 0 (0.0%) |
| Total | 0 (0.0%) | 0 (0.0%) |
Employment Characteristics in Kettleman City
Employment by Class of Employer in Kettleman City
Among the 475 employed individuals in Kettleman City, private company employees (447 | 94.1%), and not-for-profit organizations (28 | 5.9%) make up the most common classes of employment.
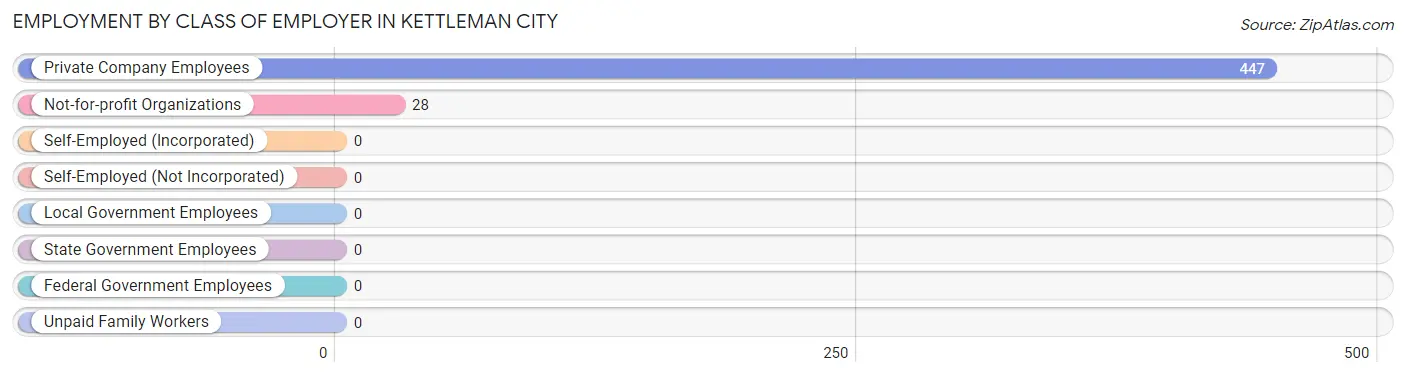
| Employer Class | # Employees | % Employees |
| Private Company Employees | 447 | 94.1% |
| Self-Employed (Incorporated) | 0 | 0.0% |
| Self-Employed (Not Incorporated) | 0 | 0.0% |
| Not-for-profit Organizations | 28 | 5.9% |
| Local Government Employees | 0 | 0.0% |
| State Government Employees | 0 | 0.0% |
| Federal Government Employees | 0 | 0.0% |
| Unpaid Family Workers | 0 | 0.0% |
| Total | 475 | 100.0% |
Employment Status by Age in Kettleman City
According to the labor force statistics for Kettleman City, out of the total population over 16 years of age (803), 73.5% or 590 individuals are in the labor force, with 7.8% or 46 of them unemployed. The age group with the highest labor force participation rate is 20 to 24 years, with 100.0% or 28 individuals in the labor force. Within the labor force, the 30 to 34 years age range has the highest percentage of unemployed individuals, with 31.0% or 31 of them being unemployed.
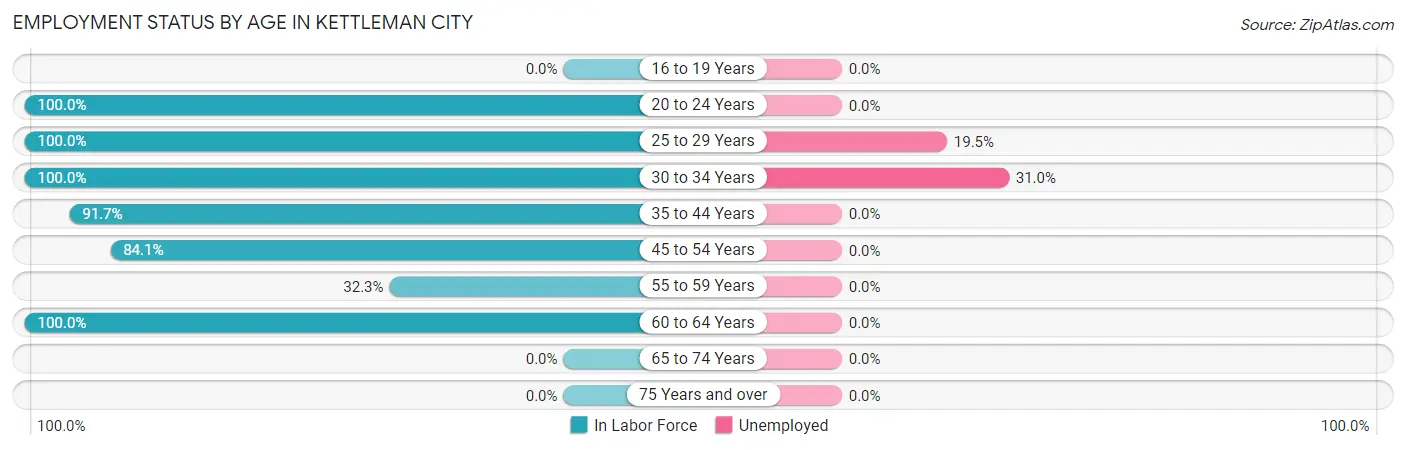
| Age Bracket | In Labor Force | Unemployed |
| 16 to 19 Years | 0 (0.0%) | 0 (0.0%) |
| 20 to 24 Years | 28 (100.0%) | 0 (0.0%) |
| 25 to 29 Years | 77 (100.0%) | 15 (19.5%) |
| 30 to 34 Years | 100 (100.0%) | 31 (31.0%) |
| 35 to 44 Years | 176 (91.7%) | 0 (0.0%) |
| 45 to 54 Years | 95 (84.1%) | 0 (0.0%) |
| 55 to 59 Years | 20 (32.3%) | 0 (0.0%) |
| 60 to 64 Years | 94 (100.0%) | 0 (0.0%) |
| 65 to 74 Years | 0 (0.0%) | 0 (0.0%) |
| 75 Years and over | 0 (0.0%) | 0 (0.0%) |
| Total | 590 (73.5%) | 46 (7.8%) |
Employment Status by Educational Attainment in Kettleman City
According to labor force statistics for Kettleman City, 88.1% of individuals (562) out of the total population between 25 and 64 years of age (638) are in the labor force, with 8.2% or 46 of them being unemployed. The group with the highest labor force participation rate are those with the educational attainment of high school diploma, with 100.0% or 213 individuals in the labor force. Within the labor force, individuals with college / associate degree education have the highest percentage of unemployment, with 27.7% or 31 of them being unemployed.
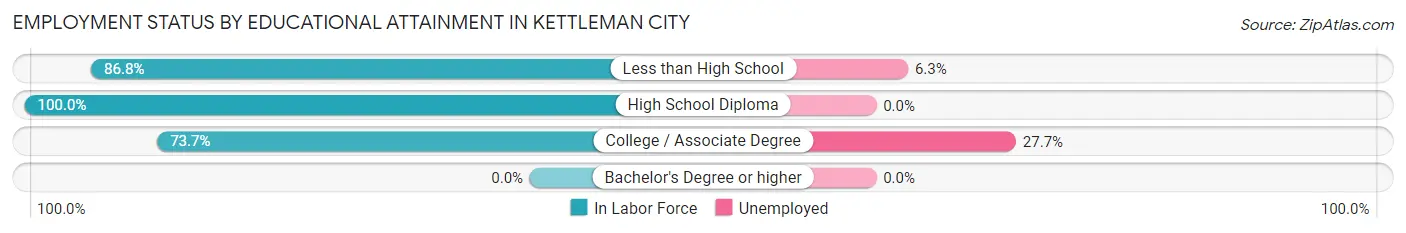
| Educational Attainment | In Labor Force | Unemployed |
| Less than High School | 237 (86.8%) | 17 (6.3%) |
| High School Diploma | 213 (100.0%) | 0 (0.0%) |
| College / Associate Degree | 112 (73.7%) | 42 (27.7%) |
| Bachelor's Degree or higher | 0 (0.0%) | 0 (0.0%) |
| Total | 562 (88.1%) | 52 (8.2%) |
Employment Occupations by Sex in Kettleman City
Management, Business, Science and Arts Occupations
Management, Business, Science and Arts Occupations by Sex
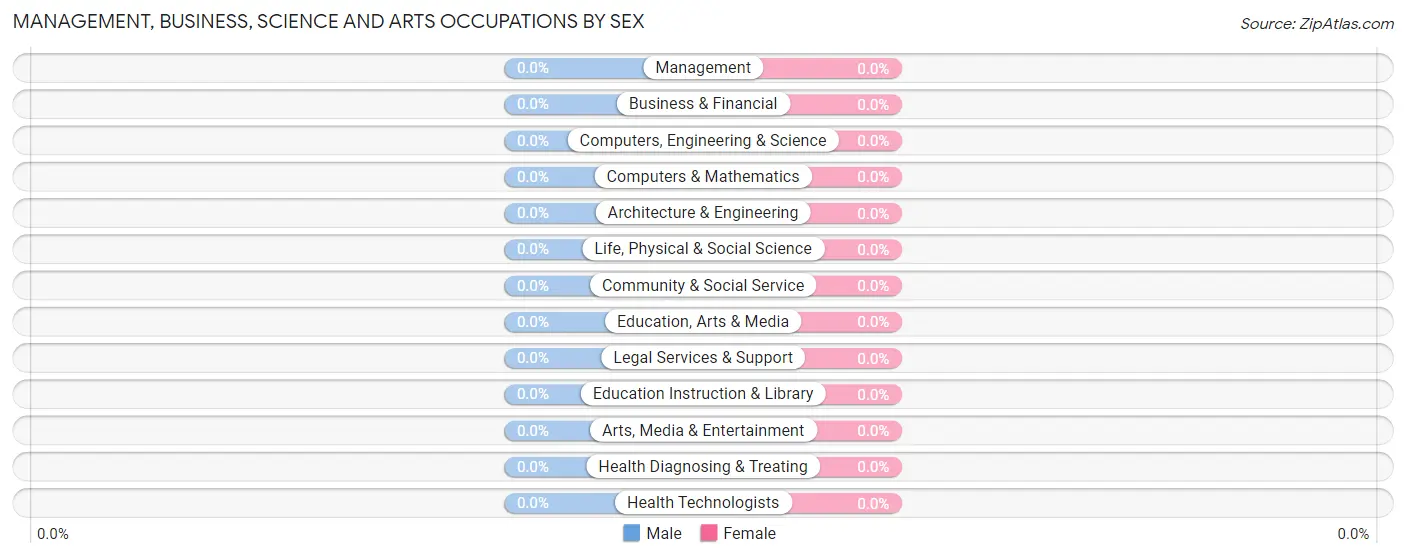
| Occupation | Male | Female |
| Management | 0 (0.0%) | 0 (0.0%) |
| Business & Financial | 0 (0.0%) | 0 (0.0%) |
| Computers, Engineering & Science | 0 (0.0%) | 0 (0.0%) |
| Computers & Mathematics | 0 (0.0%) | 0 (0.0%) |
| Architecture & Engineering | 0 (0.0%) | 0 (0.0%) |
| Life, Physical & Social Science | 0 (0.0%) | 0 (0.0%) |
| Community & Social Service | 0 (0.0%) | 0 (0.0%) |
| Education, Arts & Media | 0 (0.0%) | 0 (0.0%) |
| Legal Services & Support | 0 (0.0%) | 0 (0.0%) |
| Education Instruction & Library | 0 (0.0%) | 0 (0.0%) |
| Arts, Media & Entertainment | 0 (0.0%) | 0 (0.0%) |
| Health Diagnosing & Treating | 0 (0.0%) | 0 (0.0%) |
| Health Technologists | 0 (0.0%) | 0 (0.0%) |
| Total (Category) | 0 (0.0%) | 0 (0.0%) |
| Total (Overall) | 389 (71.5%) | 155 (28.5%) |
Services Occupations
The most common Services occupations in Kettleman City are Cleaning & Maintenance (72 | 13.2%), Healthcare Support (48 | 8.8%), and Personal Care & Service (17 | 3.1%).
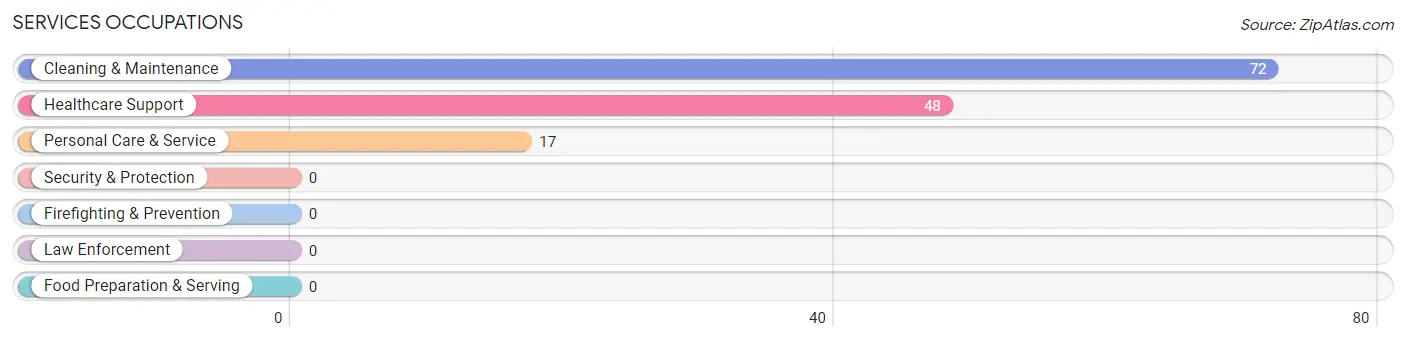
Services Occupations by Sex
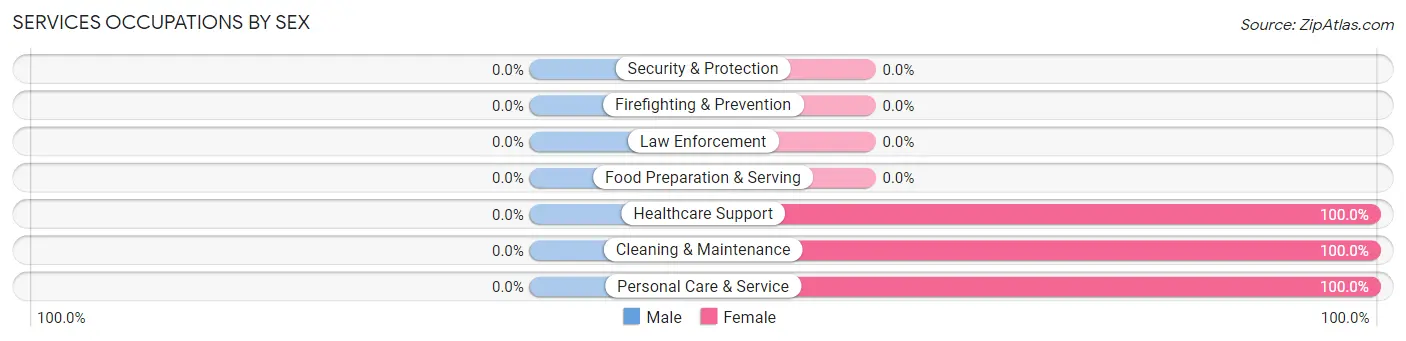
| Occupation | Male | Female |
| Healthcare Support | 0 (0.0%) | 48 (100.0%) |
| Security & Protection | 0 (0.0%) | 0 (0.0%) |
| Firefighting & Prevention | 0 (0.0%) | 0 (0.0%) |
| Law Enforcement | 0 (0.0%) | 0 (0.0%) |
| Food Preparation & Serving | 0 (0.0%) | 0 (0.0%) |
| Cleaning & Maintenance | 0 (0.0%) | 72 (100.0%) |
| Personal Care & Service | 0 (0.0%) | 17 (100.0%) |
| Total (Category) | 0 (0.0%) | 137 (100.0%) |
| Total (Overall) | 389 (71.5%) | 155 (28.5%) |
Sales and Office Occupations
Sales and Office Occupations by Sex
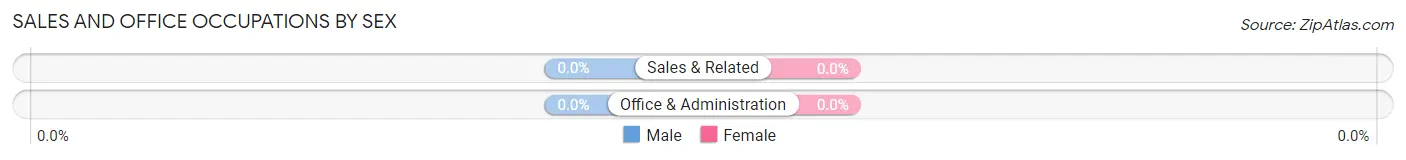
| Occupation | Male | Female |
| Sales & Related | 0 (0.0%) | 0 (0.0%) |
| Office & Administration | 0 (0.0%) | 0 (0.0%) |
| Total (Category) | 0 (0.0%) | 0 (0.0%) |
| Total (Overall) | 389 (71.5%) | 155 (28.5%) |
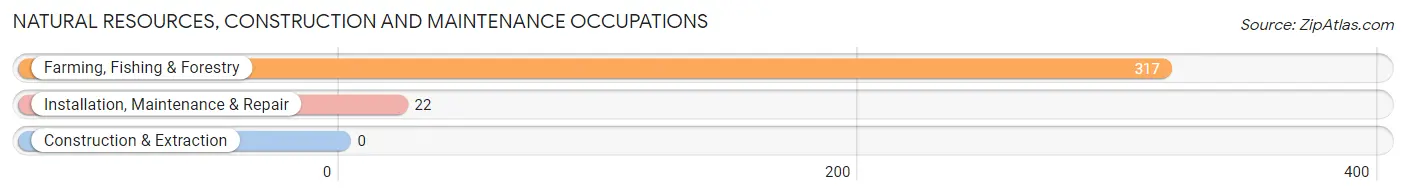
Natural Resources, Construction and Maintenance Occupations
The most common Natural Resources, Construction and Maintenance occupations in Kettleman City are Farming, Fishing & Forestry (317 | 58.3%), and Installation, Maintenance & Repair (22 | 4.0%).
Natural Resources, Construction and Maintenance Occupations by Sex
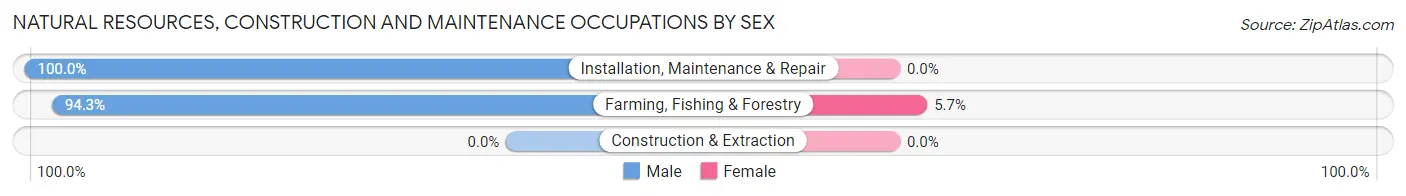
| Occupation | Male | Female |
| Farming, Fishing & Forestry | 299 (94.3%) | 18 (5.7%) |
| Construction & Extraction | 0 (0.0%) | 0 (0.0%) |
| Installation, Maintenance & Repair | 22 (100.0%) | 0 (0.0%) |
| Total (Category) | 321 (94.7%) | 18 (5.3%) |
| Total (Overall) | 389 (71.5%) | 155 (28.5%) |
Production, Transportation and Moving Occupations
The most common Production, Transportation and Moving occupations in Kettleman City are Material Moving (48 | 8.8%), and Transportation (20 | 3.7%).
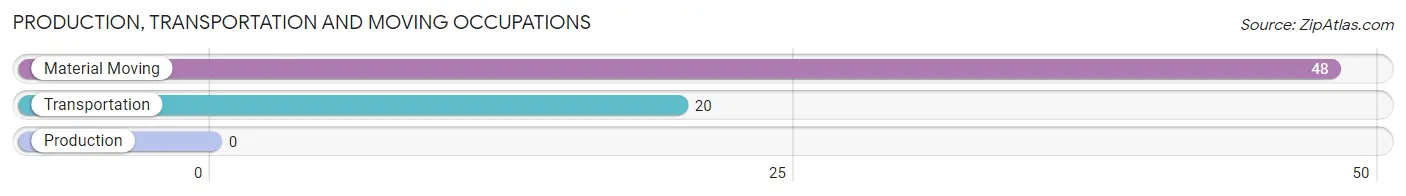
Production, Transportation and Moving Occupations by Sex
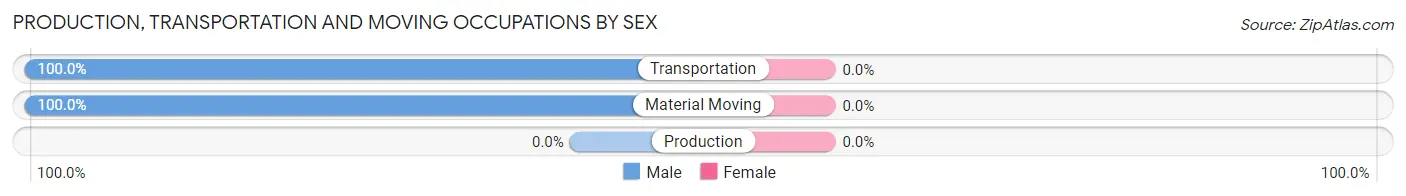
| Occupation | Male | Female |
| Production | 0 (0.0%) | 0 (0.0%) |
| Transportation | 20 (100.0%) | 0 (0.0%) |
| Material Moving | 48 (100.0%) | 0 (0.0%) |
| Total (Category) | 68 (100.0%) | 0 (0.0%) |
| Total (Overall) | 389 (71.5%) | 155 (28.5%) |
Employment Industries by Sex in Kettleman City
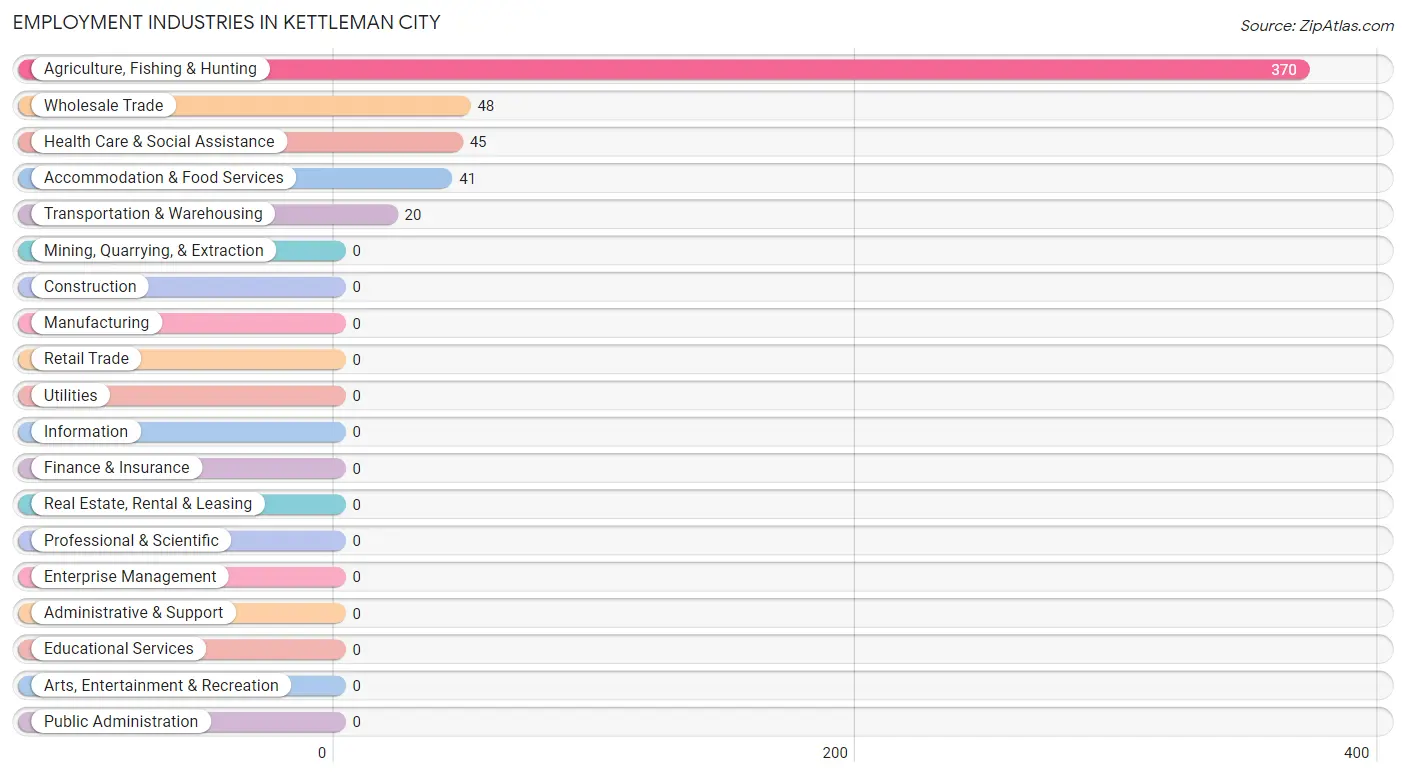
Employment Industries in Kettleman City
The major employment industries in Kettleman City include Agriculture, Fishing & Hunting (370 | 68.0%), Wholesale Trade (48 | 8.8%), Health Care & Social Assistance (45 | 8.3%), Accommodation & Food Services (41 | 7.5%), and Transportation & Warehousing (20 | 3.7%).
Employment Industries by Sex in Kettleman City
The Kettleman City industries that see more men than women are Wholesale Trade (100.0%), Transportation & Warehousing (100.0%), and Agriculture, Fishing & Hunting (86.8%), whereas the industries that tend to have a higher number of women are Health Care & Social Assistance (100.0%), Accommodation & Food Services (100.0%), and Agriculture, Fishing & Hunting (13.2%).
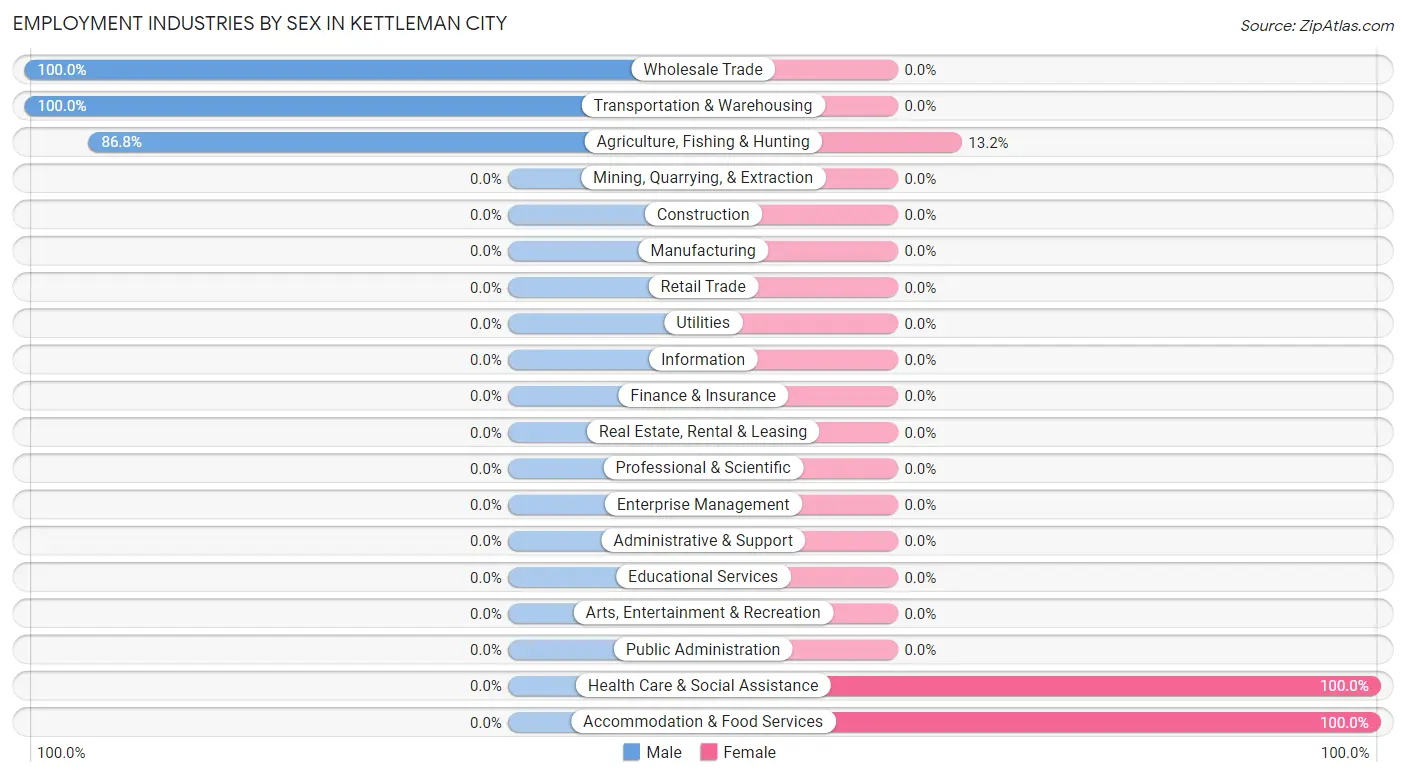
| Industry | Male | Female |
| Agriculture, Fishing & Hunting | 321 (86.8%) | 49 (13.2%) |
| Mining, Quarrying, & Extraction | 0 (0.0%) | 0 (0.0%) |
| Construction | 0 (0.0%) | 0 (0.0%) |
| Manufacturing | 0 (0.0%) | 0 (0.0%) |
| Wholesale Trade | 48 (100.0%) | 0 (0.0%) |
| Retail Trade | 0 (0.0%) | 0 (0.0%) |
| Transportation & Warehousing | 20 (100.0%) | 0 (0.0%) |
| Utilities | 0 (0.0%) | 0 (0.0%) |
| Information | 0 (0.0%) | 0 (0.0%) |
| Finance & Insurance | 0 (0.0%) | 0 (0.0%) |
| Real Estate, Rental & Leasing | 0 (0.0%) | 0 (0.0%) |
| Professional & Scientific | 0 (0.0%) | 0 (0.0%) |
| Enterprise Management | 0 (0.0%) | 0 (0.0%) |
| Administrative & Support | 0 (0.0%) | 0 (0.0%) |
| Educational Services | 0 (0.0%) | 0 (0.0%) |
| Health Care & Social Assistance | 0 (0.0%) | 45 (100.0%) |
| Arts, Entertainment & Recreation | 0 (0.0%) | 0 (0.0%) |
| Accommodation & Food Services | 0 (0.0%) | 41 (100.0%) |
| Public Administration | 0 (0.0%) | 0 (0.0%) |
| Total | 389 (71.5%) | 155 (28.5%) |
Education in Kettleman City
School Enrollment in Kettleman City
The most common levels of schooling among the 97 students in Kettleman City are high school (39 | 40.2%), middle school (22 | 22.7%), and kindergarten (19 | 19.6%).
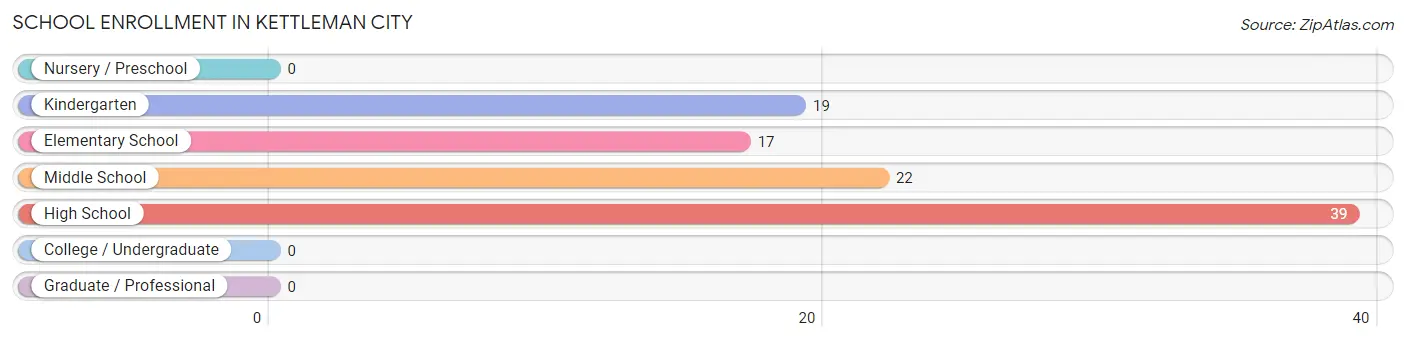
| School Level | # Students | % Students |
| Nursery / Preschool | 0 | 0.0% |
| Kindergarten | 19 | 19.6% |
| Elementary School | 17 | 17.5% |
| Middle School | 22 | 22.7% |
| High School | 39 | 40.2% |
| College / Undergraduate | 0 | 0.0% |
| Graduate / Professional | 0 | 0.0% |
| Total | 97 | 100.0% |
School Enrollment by Age by Funding Source in Kettleman City
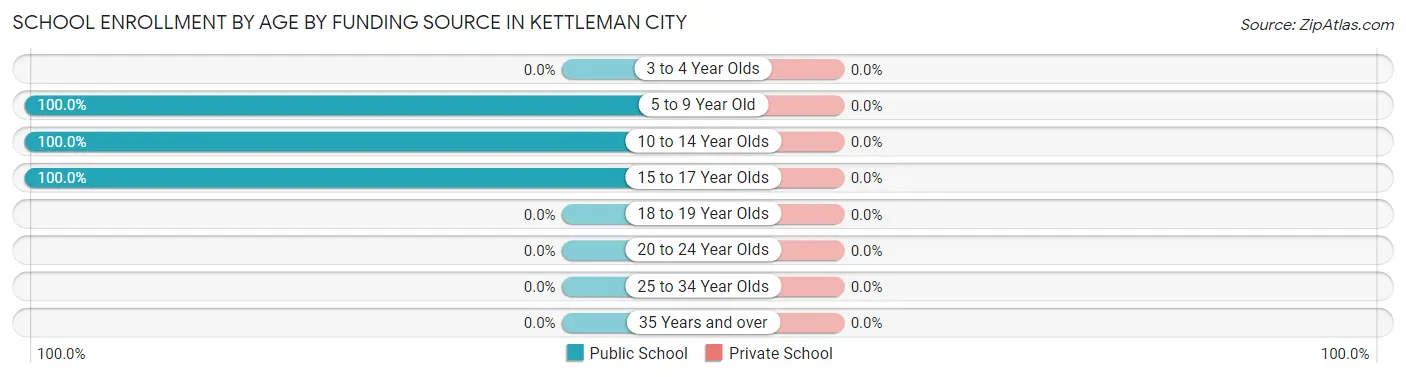
| Age Bracket | Public School | Private School |
| 3 to 4 Year Olds | 0 (0.0%) | 0 (0.0%) |
| 5 to 9 Year Old | 19 (100.0%) | 0 (0.0%) |
| 10 to 14 Year Olds | 39 (100.0%) | 0 (0.0%) |
| 15 to 17 Year Olds | 39 (100.0%) | 0 (0.0%) |
| 18 to 19 Year Olds | 0 (0.0%) | 0 (0.0%) |
| 20 to 24 Year Olds | 0 (0.0%) | 0 (0.0%) |
| 25 to 34 Year Olds | 0 (0.0%) | 0 (0.0%) |
| 35 Years and over | 0 (0.0%) | 0 (0.0%) |
| Total | 97 (100.0%) | 0 (0.0%) |
Educational Attainment by Field of Study in Kettleman City
| Field of Study | # Graduates | % Graduates |
| Computers & Mathematics | 0 | 0.0% |
| Bio, Nature & Agricultural | 0 | 0.0% |
| Physical & Health Sciences | 0 | 0.0% |
| Psychology | 0 | 0.0% |
| Social Sciences | 0 | 0.0% |
| Engineering | 0 | 0.0% |
| Multidisciplinary Studies | 0 | 0.0% |
| Science & Technology | 0 | 0.0% |
| Business | 0 | 0.0% |
| Education | 0 | 0.0% |
| Literature & Languages | 0 | 0.0% |
| Liberal Arts & History | 0 | 0.0% |
| Visual & Performing Arts | 0 | 0.0% |
| Communications | 0 | 0.0% |
| Arts & Humanities | 0 | 0.0% |
| Total | 0 | 0.0% |
Transportation & Commute in Kettleman City
Vehicle Availability by Sex in Kettleman City
The most prevalent vehicle ownership categories in Kettleman City are males with 1 vehicle (140, accounting for 43.8%) and females with 1 vehicle (100, making up 90.3%).
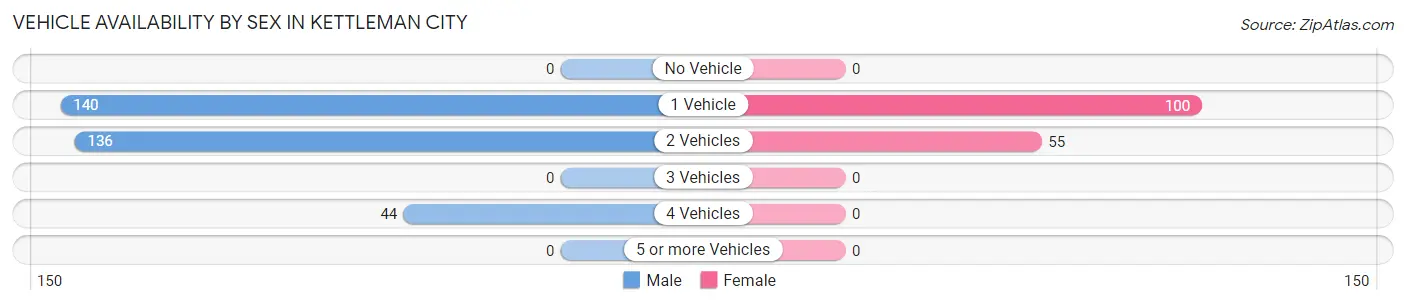
| Vehicles Available | Male | Female |
| No Vehicle | 0 (0.0%) | 0 (0.0%) |
| 1 Vehicle | 140 (43.8%) | 100 (64.5%) |
| 2 Vehicles | 136 (42.5%) | 55 (35.5%) |
| 3 Vehicles | 0 (0.0%) | 0 (0.0%) |
| 4 Vehicles | 44 (13.8%) | 0 (0.0%) |
| 5 or more Vehicles | 0 (0.0%) | 0 (0.0%) |
| Total | 320 (100.0%) | 155 (100.0%) |
Commute Time in Kettleman City
The most frequently occuring commute durations in Kettleman City are 20 to 24 minutes (128 commuters, 28.6%), 15 to 19 minutes (82 commuters, 18.3%), and 5 to 9 minutes (60 commuters, 13.4%).
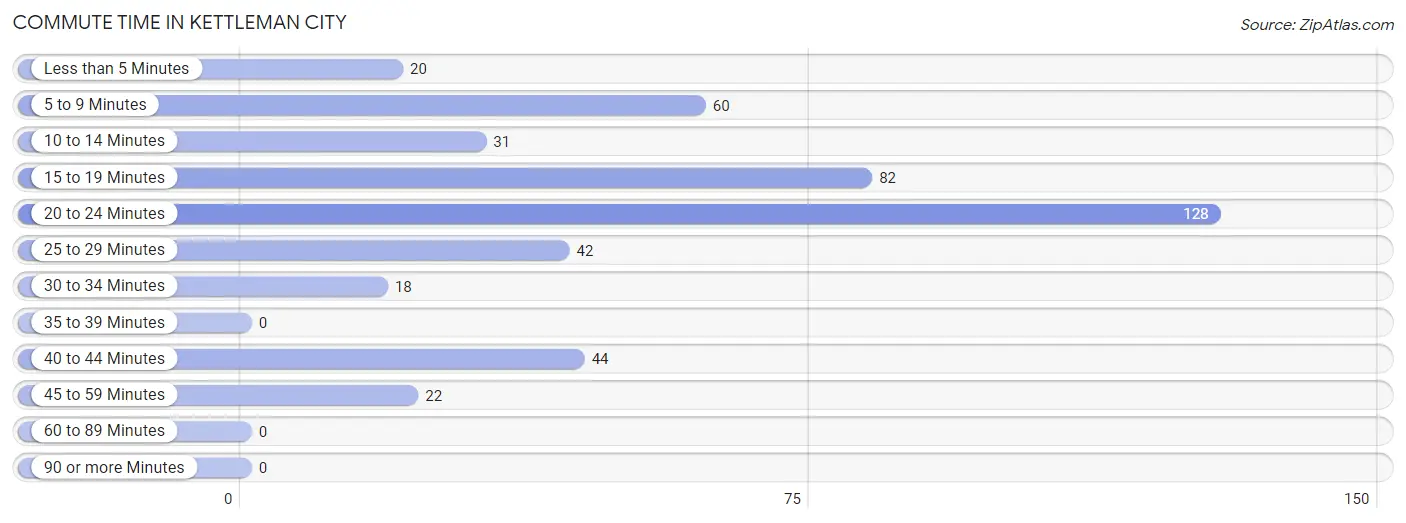
| Commute Time | # Commuters | % Commuters |
| Less than 5 Minutes | 20 | 4.5% |
| 5 to 9 Minutes | 60 | 13.4% |
| 10 to 14 Minutes | 31 | 6.9% |
| 15 to 19 Minutes | 82 | 18.3% |
| 20 to 24 Minutes | 128 | 28.6% |
| 25 to 29 Minutes | 42 | 9.4% |
| 30 to 34 Minutes | 18 | 4.0% |
| 35 to 39 Minutes | 0 | 0.0% |
| 40 to 44 Minutes | 44 | 9.8% |
| 45 to 59 Minutes | 22 | 4.9% |
| 60 to 89 Minutes | 0 | 0.0% |
| 90 or more Minutes | 0 | 0.0% |
Commute Time by Sex in Kettleman City
The most common commute times in Kettleman City are 20 to 24 minutes (110 commuters, 34.4%) for males and 5 to 9 minutes (40 commuters, 31.5%) for females.
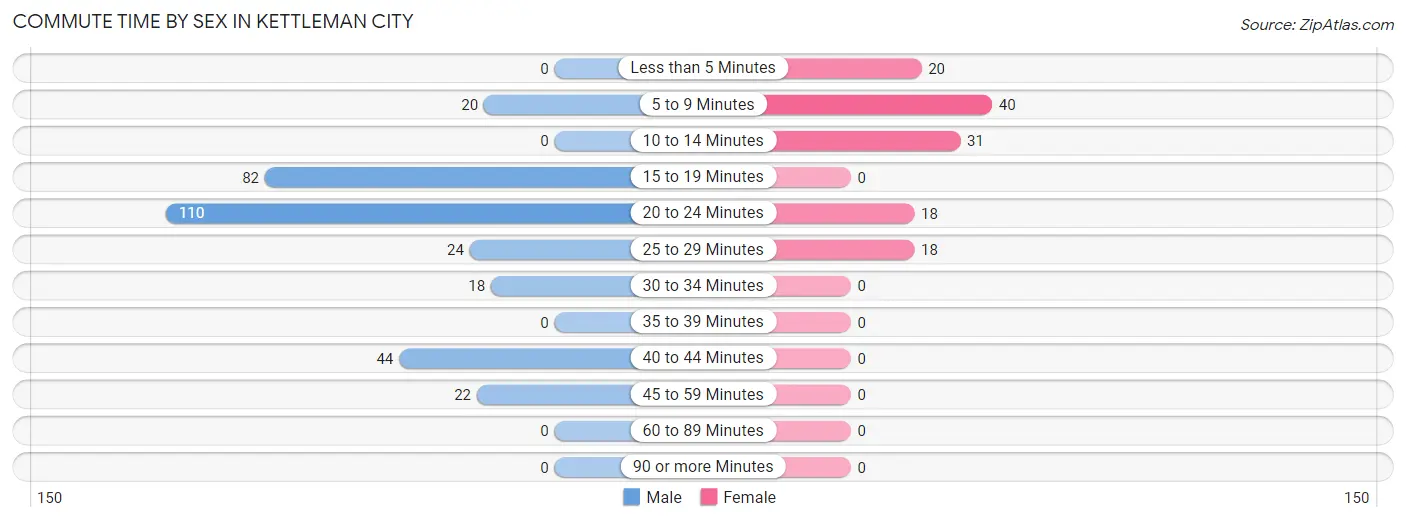
| Commute Time | Male | Female |
| Less than 5 Minutes | 0 (0.0%) | 20 (15.8%) |
| 5 to 9 Minutes | 20 (6.2%) | 40 (31.5%) |
| 10 to 14 Minutes | 0 (0.0%) | 31 (24.4%) |
| 15 to 19 Minutes | 82 (25.6%) | 0 (0.0%) |
| 20 to 24 Minutes | 110 (34.4%) | 18 (14.2%) |
| 25 to 29 Minutes | 24 (7.5%) | 18 (14.2%) |
| 30 to 34 Minutes | 18 (5.6%) | 0 (0.0%) |
| 35 to 39 Minutes | 0 (0.0%) | 0 (0.0%) |
| 40 to 44 Minutes | 44 (13.8%) | 0 (0.0%) |
| 45 to 59 Minutes | 22 (6.9%) | 0 (0.0%) |
| 60 to 89 Minutes | 0 (0.0%) | 0 (0.0%) |
| 90 or more Minutes | 0 (0.0%) | 0 (0.0%) |
Time of Departure to Work by Sex in Kettleman City
The most frequent times of departure to work in Kettleman City are 6:00 AM to 6:29 AM (185, 57.8%) for males and 7:00 AM to 7:29 AM (54, 42.5%) for females.
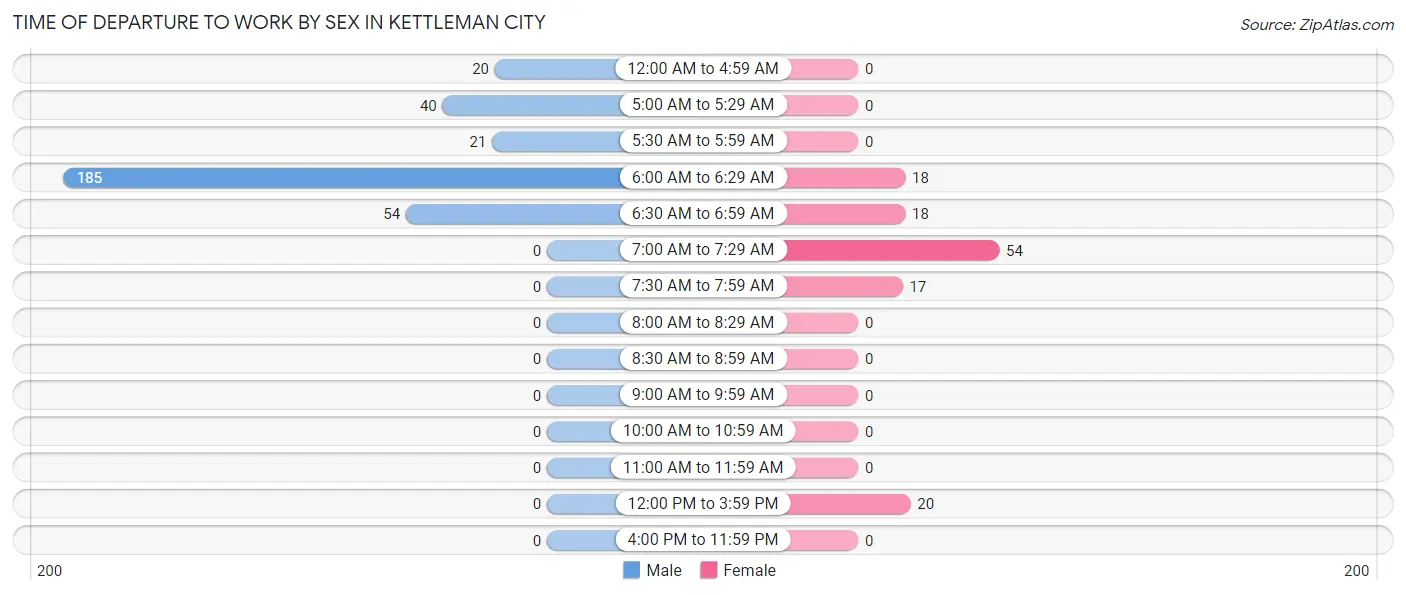
| Time of Departure | Male | Female |
| 12:00 AM to 4:59 AM | 20 (6.2%) | 0 (0.0%) |
| 5:00 AM to 5:29 AM | 40 (12.5%) | 0 (0.0%) |
| 5:30 AM to 5:59 AM | 21 (6.6%) | 0 (0.0%) |
| 6:00 AM to 6:29 AM | 185 (57.8%) | 18 (14.2%) |
| 6:30 AM to 6:59 AM | 54 (16.9%) | 18 (14.2%) |
| 7:00 AM to 7:29 AM | 0 (0.0%) | 54 (42.5%) |
| 7:30 AM to 7:59 AM | 0 (0.0%) | 17 (13.4%) |
| 8:00 AM to 8:29 AM | 0 (0.0%) | 0 (0.0%) |
| 8:30 AM to 8:59 AM | 0 (0.0%) | 0 (0.0%) |
| 9:00 AM to 9:59 AM | 0 (0.0%) | 0 (0.0%) |
| 10:00 AM to 10:59 AM | 0 (0.0%) | 0 (0.0%) |
| 11:00 AM to 11:59 AM | 0 (0.0%) | 0 (0.0%) |
| 12:00 PM to 3:59 PM | 0 (0.0%) | 20 (15.8%) |
| 4:00 PM to 11:59 PM | 0 (0.0%) | 0 (0.0%) |
| Total | 320 (100.0%) | 127 (100.0%) |
Housing Occupancy in Kettleman City
Occupancy by Ownership in Kettleman City
Of the total 385 dwellings in Kettleman City, owner-occupied units account for 83 (21.6%), while renter-occupied units make up 302 (78.4%).
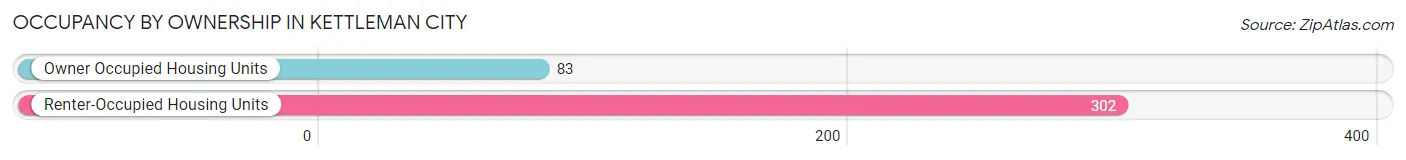
| Occupancy | # Housing Units | % Housing Units |
| Owner Occupied Housing Units | 83 | 21.6% |
| Renter-Occupied Housing Units | 302 | 78.4% |
| Total Occupied Housing Units | 385 | 100.0% |
Occupancy by Household Size in Kettleman City
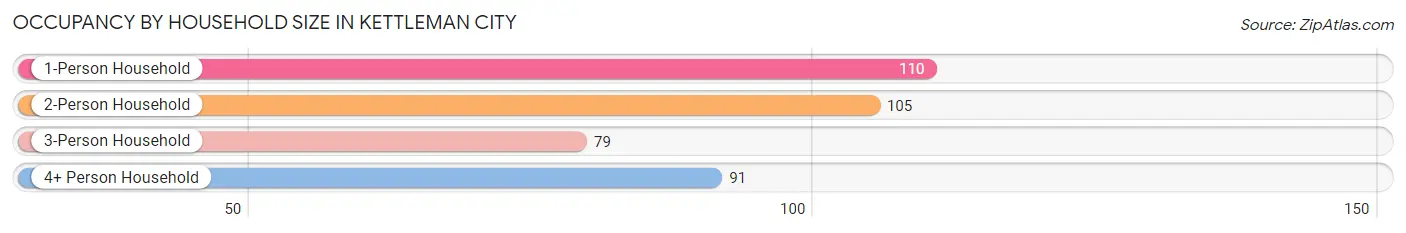
| Household Size | # Housing Units | % Housing Units |
| 1-Person Household | 110 | 28.6% |
| 2-Person Household | 105 | 27.3% |
| 3-Person Household | 79 | 20.5% |
| 4+ Person Household | 91 | 23.6% |
| Total Housing Units | 385 | 100.0% |
Occupancy by Ownership by Household Size in Kettleman City
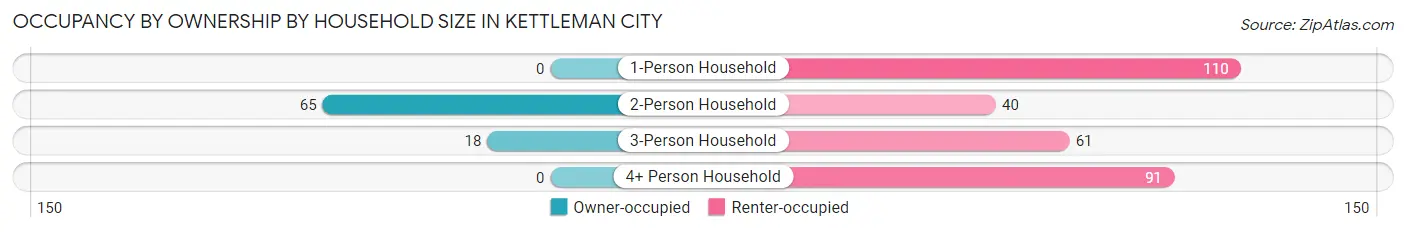
| Household Size | Owner-occupied | Renter-occupied |
| 1-Person Household | 0 (0.0%) | 110 (100.0%) |
| 2-Person Household | 65 (61.9%) | 40 (38.1%) |
| 3-Person Household | 18 (22.8%) | 61 (77.2%) |
| 4+ Person Household | 0 (0.0%) | 91 (100.0%) |
| Total Housing Units | 83 (21.6%) | 302 (78.4%) |
Occupancy by Educational Attainment in Kettleman City
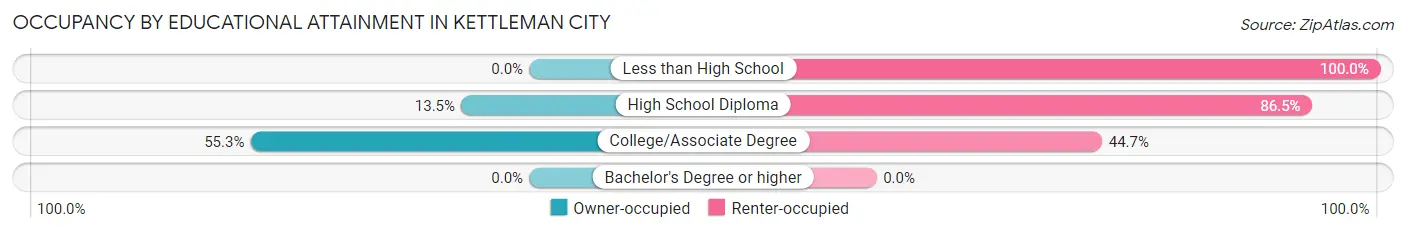
| Household Size | Owner-occupied | Renter-occupied |
| Less than High School | 0 (0.0%) | 123 (100.0%) |
| High School Diploma | 20 (13.5%) | 128 (86.5%) |
| College/Associate Degree | 63 (55.3%) | 51 (44.7%) |
| Bachelor's Degree or higher | 0 (0.0%) | 0 (0.0%) |
Occupancy by Age of Householder in Kettleman City
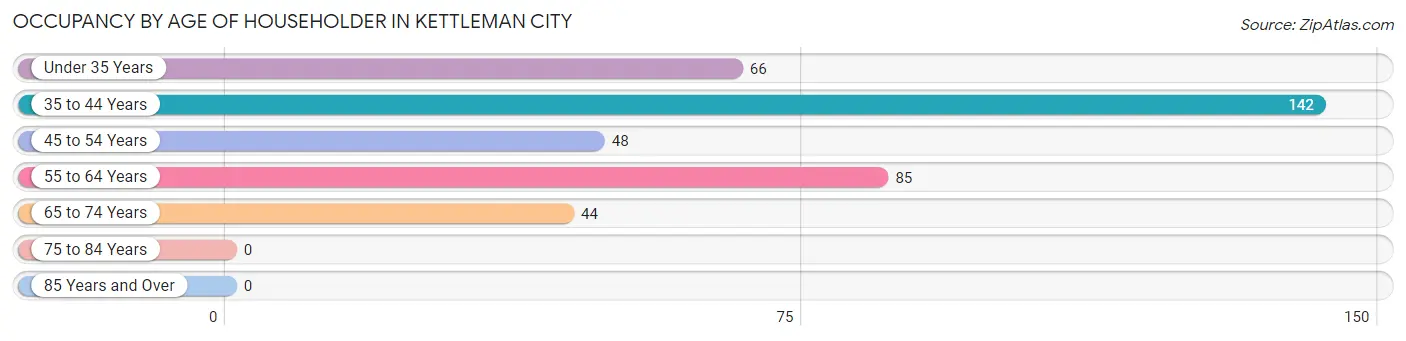
| Age Bracket | # Households | % Households |
| Under 35 Years | 66 | 17.1% |
| 35 to 44 Years | 142 | 36.9% |
| 45 to 54 Years | 48 | 12.5% |
| 55 to 64 Years | 85 | 22.1% |
| 65 to 74 Years | 44 | 11.4% |
| 75 to 84 Years | 0 | 0.0% |
| 85 Years and Over | 0 | 0.0% |
| Total | 385 | 100.0% |
Housing Finances in Kettleman City
Median Income by Occupancy in Kettleman City
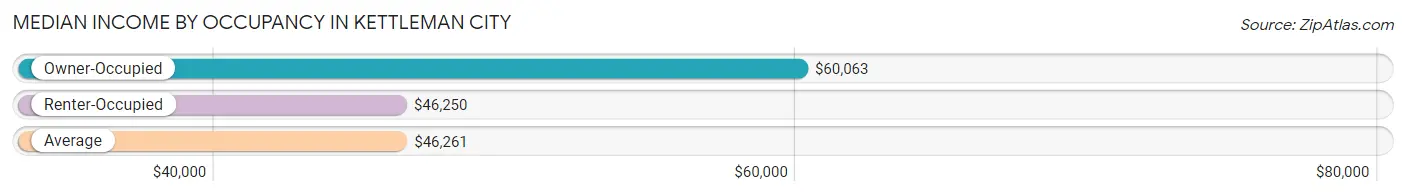
| Occupancy Type | # Households | Median Income |
| Owner-Occupied | 83 (21.6%) | $60,063 |
| Renter-Occupied | 302 (78.4%) | $46,250 |
| Average | 385 (100.0%) | $46,261 |
Occupancy by Householder Income Bracket in Kettleman City
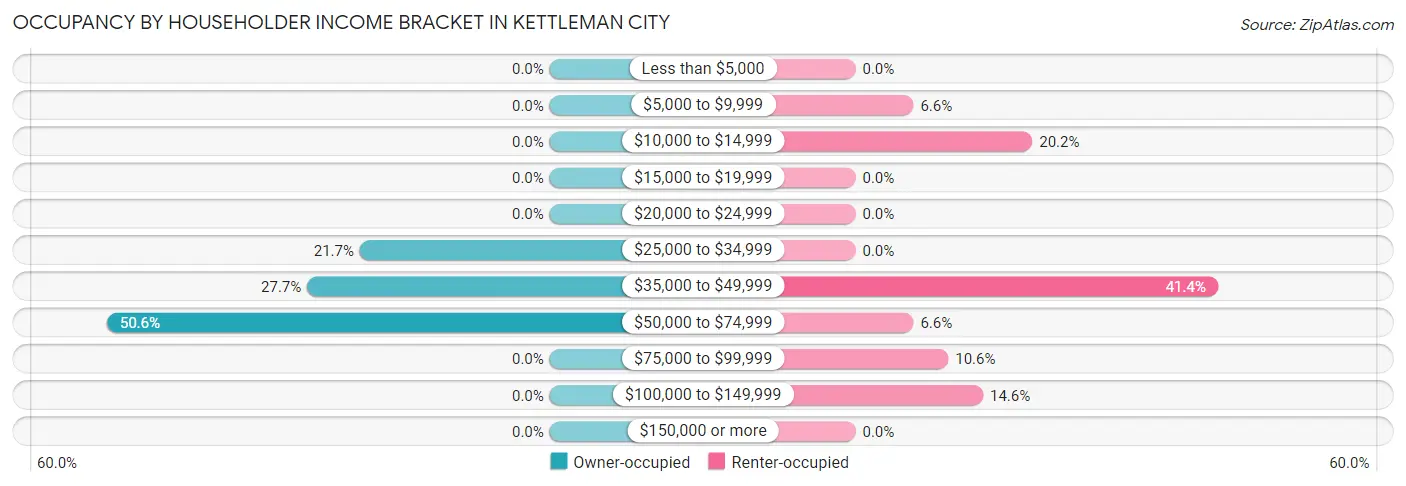
| Income Bracket | Owner-occupied | Renter-occupied |
| Less than $5,000 | 0 (0.0%) | 0 (0.0%) |
| $5,000 to $9,999 | 0 (0.0%) | 20 (6.6%) |
| $10,000 to $14,999 | 0 (0.0%) | 61 (20.2%) |
| $15,000 to $19,999 | 0 (0.0%) | 0 (0.0%) |
| $20,000 to $24,999 | 0 (0.0%) | 0 (0.0%) |
| $25,000 to $34,999 | 18 (21.7%) | 0 (0.0%) |
| $35,000 to $49,999 | 23 (27.7%) | 125 (41.4%) |
| $50,000 to $74,999 | 42 (50.6%) | 20 (6.6%) |
| $75,000 to $99,999 | 0 (0.0%) | 32 (10.6%) |
| $100,000 to $149,999 | 0 (0.0%) | 44 (14.6%) |
| $150,000 or more | 0 (0.0%) | 0 (0.0%) |
| Total | 83 (100.0%) | 302 (100.0%) |
Monthly Housing Cost Tiers in Kettleman City
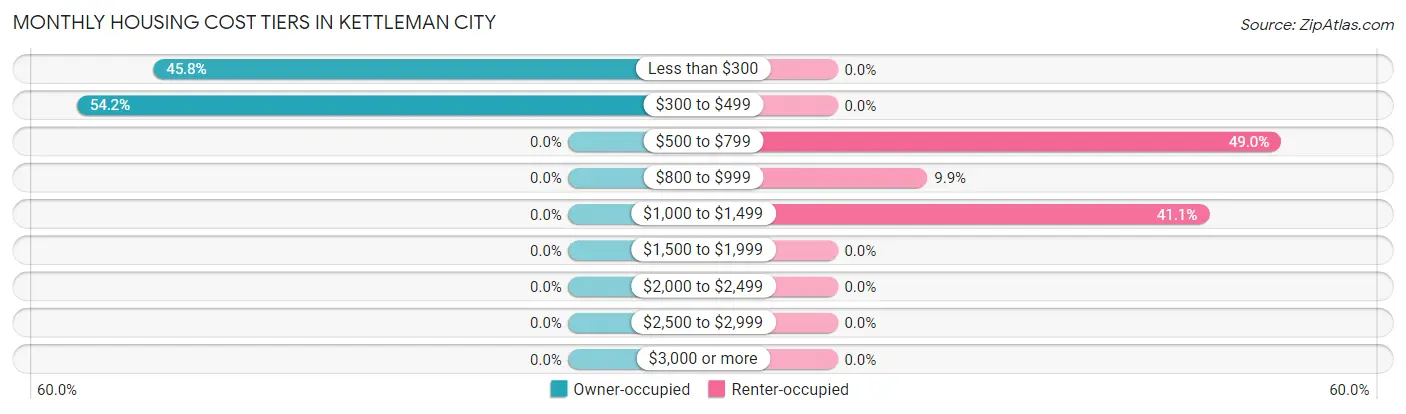
| Monthly Cost | Owner-occupied | Renter-occupied |
| Less than $300 | 38 (45.8%) | 0 (0.0%) |
| $300 to $499 | 45 (54.2%) | 0 (0.0%) |
| $500 to $799 | 0 (0.0%) | 148 (49.0%) |
| $800 to $999 | 0 (0.0%) | 30 (9.9%) |
| $1,000 to $1,499 | 0 (0.0%) | 124 (41.1%) |
| $1,500 to $1,999 | 0 (0.0%) | 0 (0.0%) |
| $2,000 to $2,499 | 0 (0.0%) | 0 (0.0%) |
| $2,500 to $2,999 | 0 (0.0%) | 0 (0.0%) |
| $3,000 or more | 0 (0.0%) | 0 (0.0%) |
| Total | 83 (100.0%) | 302 (100.0%) |
Physical Housing Characteristics in Kettleman City
Housing Structures in Kettleman City
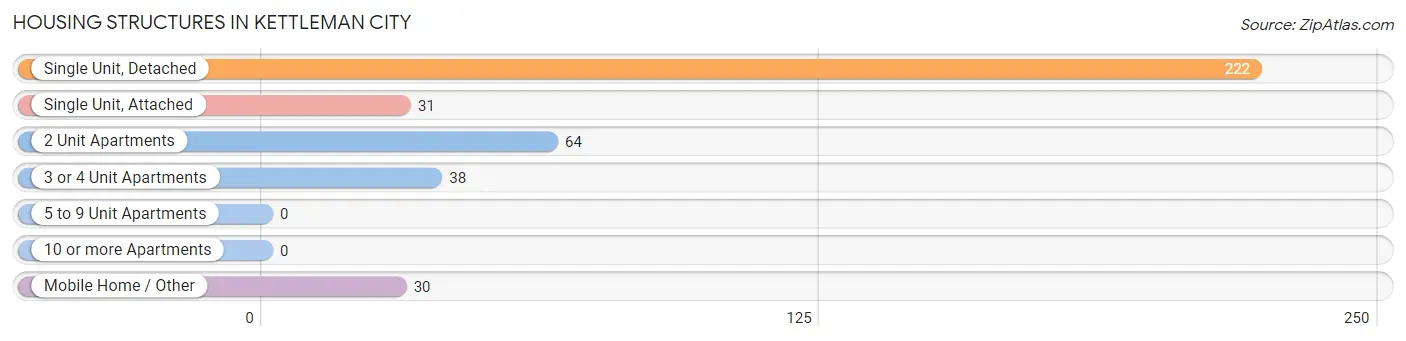
| Structure Type | # Housing Units | % Housing Units |
| Single Unit, Detached | 222 | 57.7% |
| Single Unit, Attached | 31 | 8.1% |
| 2 Unit Apartments | 64 | 16.6% |
| 3 or 4 Unit Apartments | 38 | 9.9% |
| 5 to 9 Unit Apartments | 0 | 0.0% |
| 10 or more Apartments | 0 | 0.0% |
| Mobile Home / Other | 30 | 7.8% |
| Total | 385 | 100.0% |
Housing Structures by Occupancy in Kettleman City
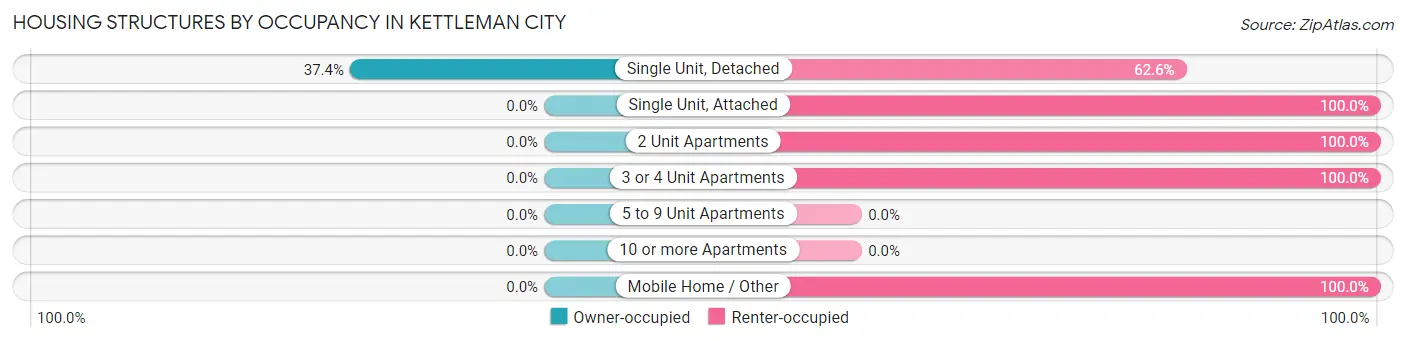
| Structure Type | Owner-occupied | Renter-occupied |
| Single Unit, Detached | 83 (37.4%) | 139 (62.6%) |
| Single Unit, Attached | 0 (0.0%) | 31 (100.0%) |
| 2 Unit Apartments | 0 (0.0%) | 64 (100.0%) |
| 3 or 4 Unit Apartments | 0 (0.0%) | 38 (100.0%) |
| 5 to 9 Unit Apartments | 0 (0.0%) | 0 (0.0%) |
| 10 or more Apartments | 0 (0.0%) | 0 (0.0%) |
| Mobile Home / Other | 0 (0.0%) | 30 (100.0%) |
| Total | 83 (21.6%) | 302 (78.4%) |
Housing Structures by Number of Rooms in Kettleman City
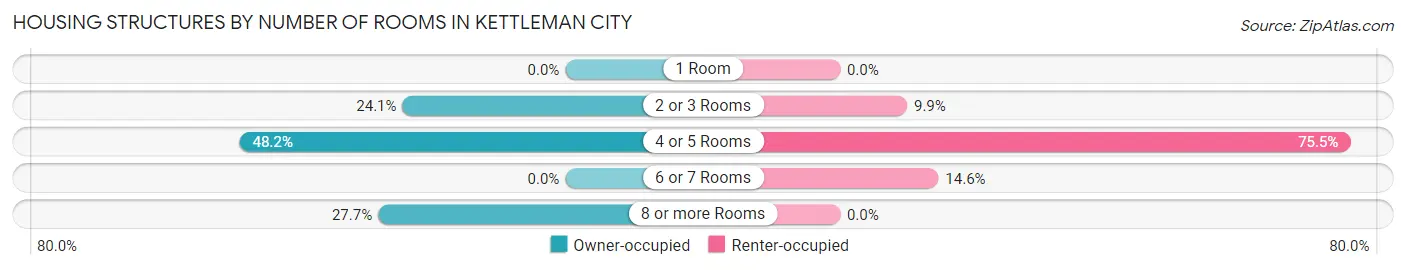
| Number of Rooms | Owner-occupied | Renter-occupied |
| 1 Room | 0 (0.0%) | 0 (0.0%) |
| 2 or 3 Rooms | 20 (24.1%) | 30 (9.9%) |
| 4 or 5 Rooms | 40 (48.2%) | 228 (75.5%) |
| 6 or 7 Rooms | 0 (0.0%) | 44 (14.6%) |
| 8 or more Rooms | 23 (27.7%) | 0 (0.0%) |
| Total | 83 (100.0%) | 302 (100.0%) |
Housing Structure by Heating Type in Kettleman City
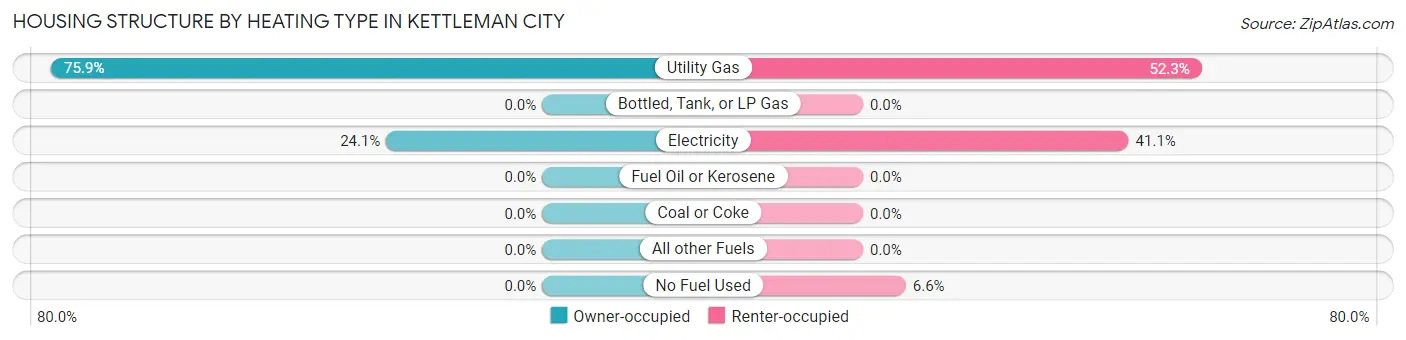
| Heating Type | Owner-occupied | Renter-occupied |
| Utility Gas | 63 (75.9%) | 158 (52.3%) |
| Bottled, Tank, or LP Gas | 0 (0.0%) | 0 (0.0%) |
| Electricity | 20 (24.1%) | 124 (41.1%) |
| Fuel Oil or Kerosene | 0 (0.0%) | 0 (0.0%) |
| Coal or Coke | 0 (0.0%) | 0 (0.0%) |
| All other Fuels | 0 (0.0%) | 0 (0.0%) |
| No Fuel Used | 0 (0.0%) | 20 (6.6%) |
| Total | 83 (100.0%) | 302 (100.0%) |
Household Vehicle Usage in Kettleman City
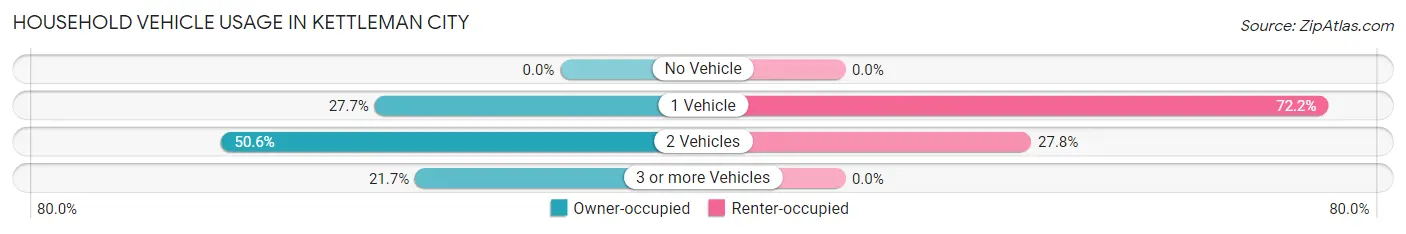
| Vehicles per Household | Owner-occupied | Renter-occupied |
| No Vehicle | 0 (0.0%) | 0 (0.0%) |
| 1 Vehicle | 23 (27.7%) | 218 (72.2%) |
| 2 Vehicles | 42 (50.6%) | 84 (27.8%) |
| 3 or more Vehicles | 18 (21.7%) | 0 (0.0%) |
| Total | 83 (100.0%) | 302 (100.0%) |
Real Estate & Mortgages in Kettleman City
Real Estate and Mortgage Overview in Kettleman City
| Characteristic | Without Mortgage | With Mortgage |
| Housing Units | 83 | 0 |
| Median Property Value | $136,900 | $0 |
| Median Household Income | $60,063 | $0 |
| Monthly Housing Costs | $354 | $0 |
| Real Estate Taxes | $832 | $0 |
Property Value by Mortgage Status in Kettleman City
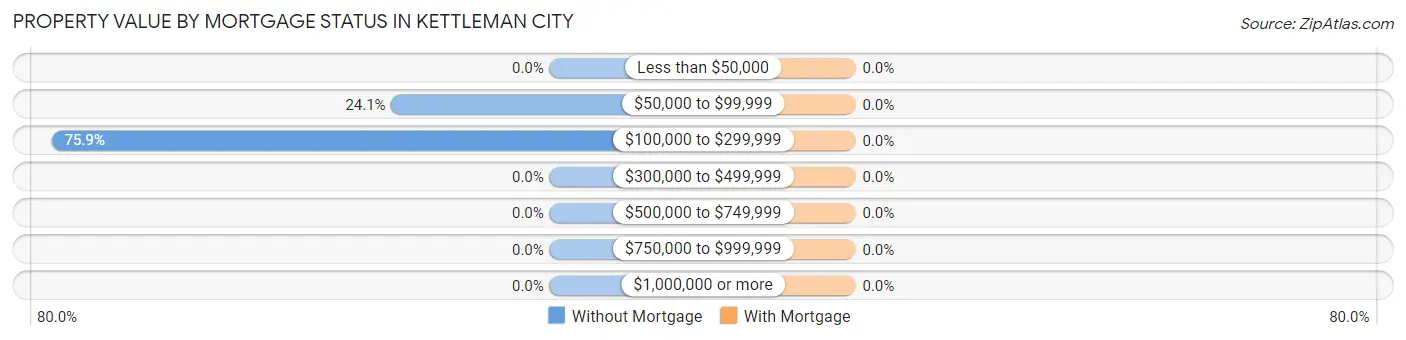
| Property Value | Without Mortgage | With Mortgage |
| Less than $50,000 | 0 (0.0%) | 0 (0.0%) |
| $50,000 to $99,999 | 20 (24.1%) | 0 (0.0%) |
| $100,000 to $299,999 | 63 (75.9%) | 0 (0.0%) |
| $300,000 to $499,999 | 0 (0.0%) | 0 (0.0%) |
| $500,000 to $749,999 | 0 (0.0%) | 0 (0.0%) |
| $750,000 to $999,999 | 0 (0.0%) | 0 (0.0%) |
| $1,000,000 or more | 0 (0.0%) | 0 (0.0%) |
| Total | 83 (100.0%) | 0 (0.0%) |
Household Income by Mortgage Status in Kettleman City
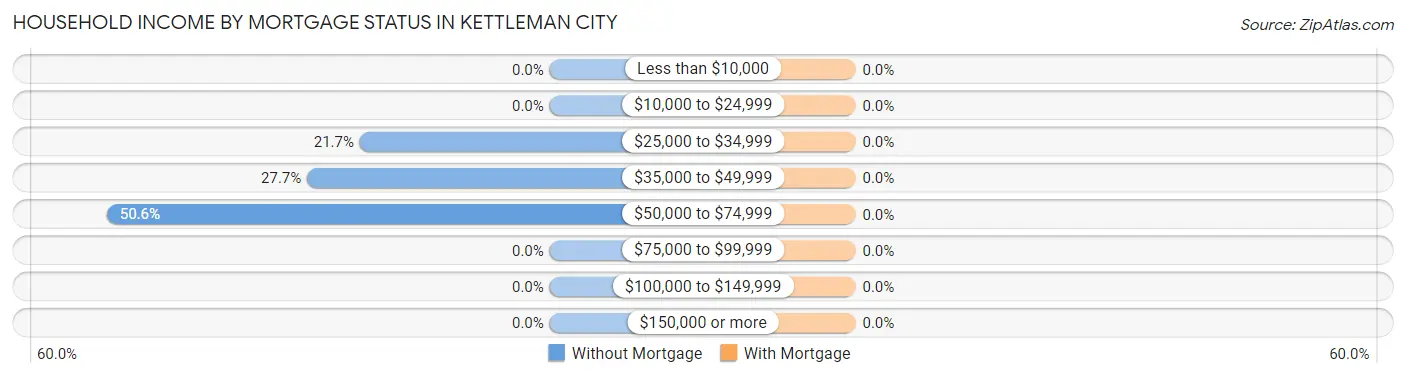
| Household Income | Without Mortgage | With Mortgage |
| Less than $10,000 | 0 (0.0%) | 0 (0.0%) |
| $10,000 to $24,999 | 0 (0.0%) | 0 (0.0%) |
| $25,000 to $34,999 | 18 (21.7%) | 0 (0.0%) |
| $35,000 to $49,999 | 23 (27.7%) | 0 (0.0%) |
| $50,000 to $74,999 | 42 (50.6%) | 0 (0.0%) |
| $75,000 to $99,999 | 0 (0.0%) | 0 (0.0%) |
| $100,000 to $149,999 | 0 (0.0%) | 0 (0.0%) |
| $150,000 or more | 0 (0.0%) | 0 (0.0%) |
| Total | 83 (100.0%) | 0 (0.0%) |
Property Value to Household Income Ratio in Kettleman City
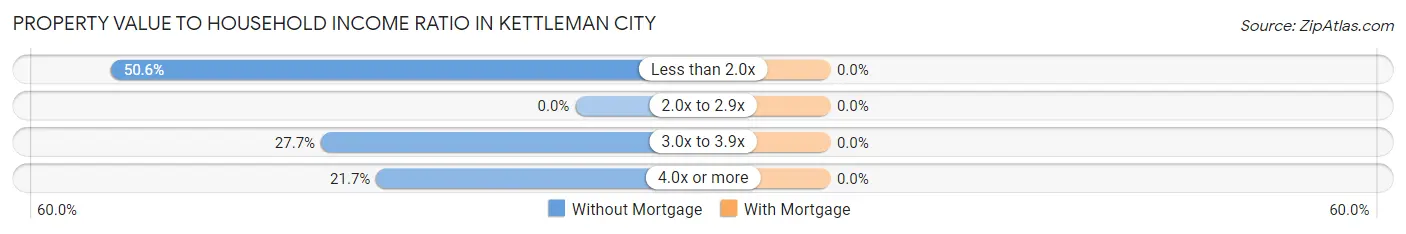
| Value-to-Income Ratio | Without Mortgage | With Mortgage |
| Less than 2.0x | 42 (50.6%) | 0 (0.0%) |
| 2.0x to 2.9x | 0 (0.0%) | 0 (0.0%) |
| 3.0x to 3.9x | 23 (27.7%) | 0 (0.0%) |
| 4.0x or more | 18 (21.7%) | 0 (0.0%) |
| Total | 83 (100.0%) | 0 (0.0%) |
Real Estate Taxes by Mortgage Status in Kettleman City
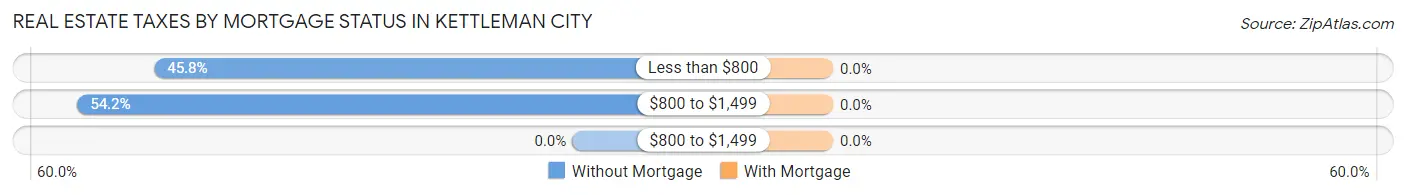
| Property Taxes | Without Mortgage | With Mortgage |
| Less than $800 | 38 (45.8%) | 0 (0.0%) |
| $800 to $1,499 | 45 (54.2%) | 0 (0.0%) |
| $800 to $1,499 | 0 (0.0%) | 0 (0.0%) |
| Total | 83 (100.0%) | 0 (0.0%) |
Health & Disability in Kettleman City
Health Insurance Coverage by Age in Kettleman City
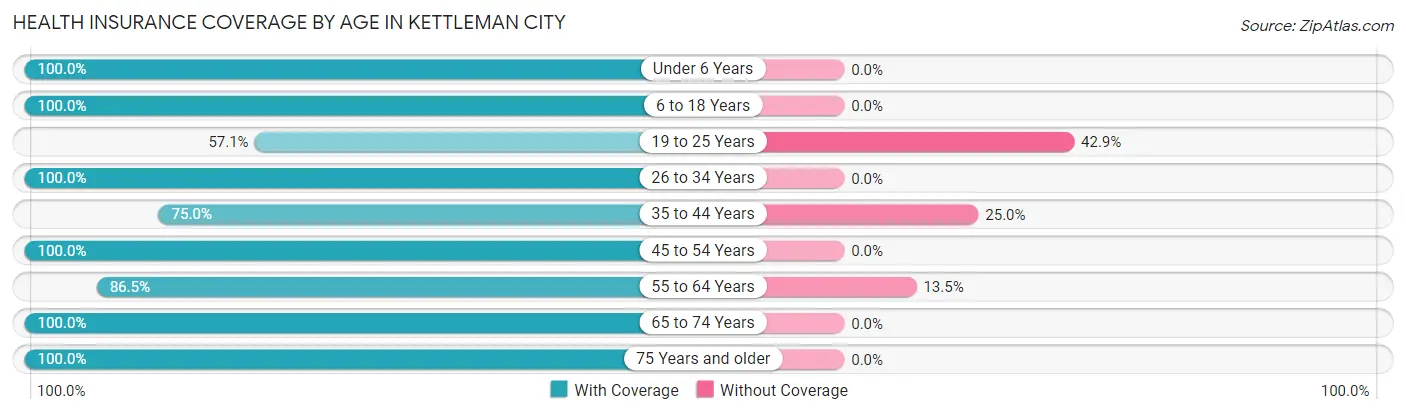
| Age Bracket | With Coverage | Without Coverage |
| Under 6 Years | 114 (100.0%) | 0 (0.0%) |
| 6 to 18 Years | 78 (100.0%) | 0 (0.0%) |
| 19 to 25 Years | 28 (57.1%) | 21 (42.9%) |
| 26 to 34 Years | 156 (100.0%) | 0 (0.0%) |
| 35 to 44 Years | 144 (75.0%) | 48 (25.0%) |
| 45 to 54 Years | 113 (100.0%) | 0 (0.0%) |
| 55 to 64 Years | 135 (86.5%) | 21 (13.5%) |
| 65 to 74 Years | 70 (100.0%) | 0 (0.0%) |
| 75 Years and older | 28 (100.0%) | 0 (0.0%) |
| Total | 866 (90.6%) | 90 (9.4%) |
Health Insurance Coverage by Citizenship Status in Kettleman City
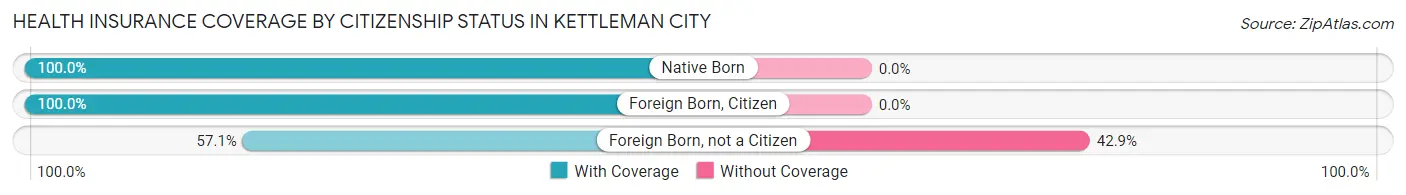
| Citizenship Status | With Coverage | Without Coverage |
| Native Born | 114 (100.0%) | 0 (0.0%) |
| Foreign Born, Citizen | 78 (100.0%) | 0 (0.0%) |
| Foreign Born, not a Citizen | 28 (57.1%) | 21 (42.9%) |
Health Insurance Coverage by Household Income in Kettleman City
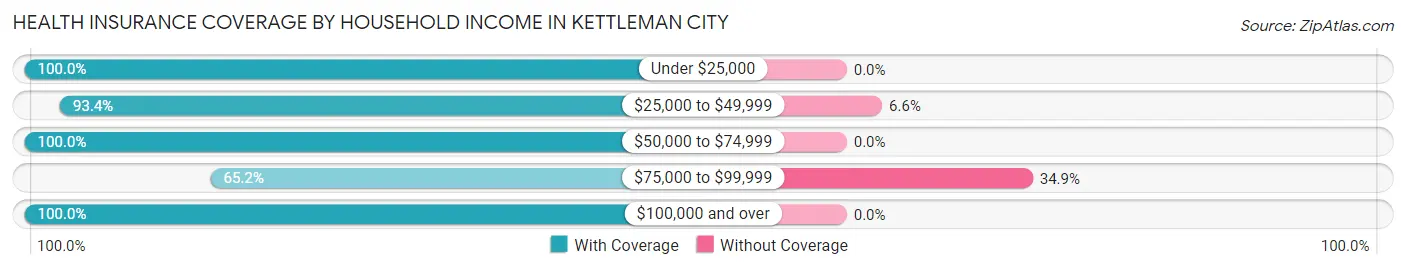
| Household Income | With Coverage | Without Coverage |
| Under $25,000 | 204 (100.0%) | 0 (0.0%) |
| $25,000 to $49,999 | 296 (93.4%) | 21 (6.6%) |
| $50,000 to $74,999 | 119 (100.0%) | 0 (0.0%) |
| $75,000 to $99,999 | 129 (65.1%) | 69 (34.8%) |
| $100,000 and over | 118 (100.0%) | 0 (0.0%) |
Public vs Private Health Insurance Coverage by Age in Kettleman City
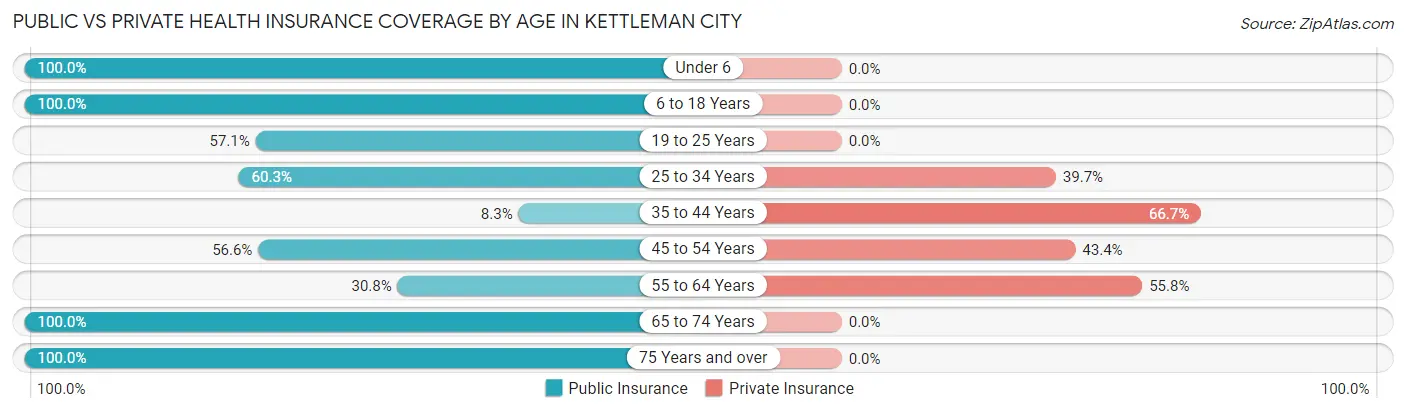
| Age Bracket | Public Insurance | Private Insurance |
| Under 6 | 114 (100.0%) | 0 (0.0%) |
| 6 to 18 Years | 78 (100.0%) | 0 (0.0%) |
| 19 to 25 Years | 28 (57.1%) | 0 (0.0%) |
| 25 to 34 Years | 94 (60.3%) | 62 (39.7%) |
| 35 to 44 Years | 16 (8.3%) | 128 (66.7%) |
| 45 to 54 Years | 64 (56.6%) | 49 (43.4%) |
| 55 to 64 Years | 48 (30.8%) | 87 (55.8%) |
| 65 to 74 Years | 70 (100.0%) | 0 (0.0%) |
| 75 Years and over | 28 (100.0%) | 0 (0.0%) |
| Total | 540 (56.5%) | 326 (34.1%) |
Disability Status by Sex by Age in Kettleman City
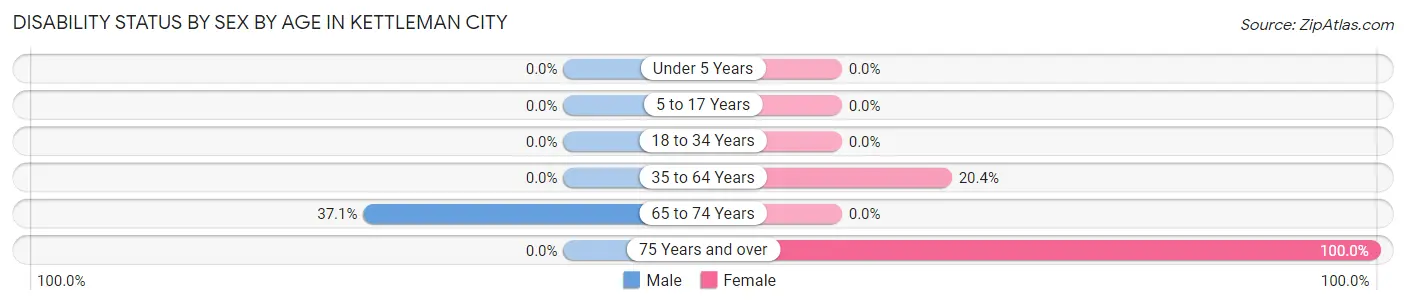
| Age Bracket | Male | Female |
| Under 5 Years | 0 (0.0%) | 0 (0.0%) |
| 5 to 17 Years | 0 (0.0%) | 0 (0.0%) |
| 18 to 34 Years | 0 (0.0%) | 0 (0.0%) |
| 35 to 64 Years | 0 (0.0%) | 40 (20.4%) |
| 65 to 74 Years | 26 (37.1%) | 0 (0.0%) |
| 75 Years and over | 0 (0.0%) | 28 (100.0%) |
Disability Class by Sex by Age in Kettleman City
Disability Class: Hearing Difficulty
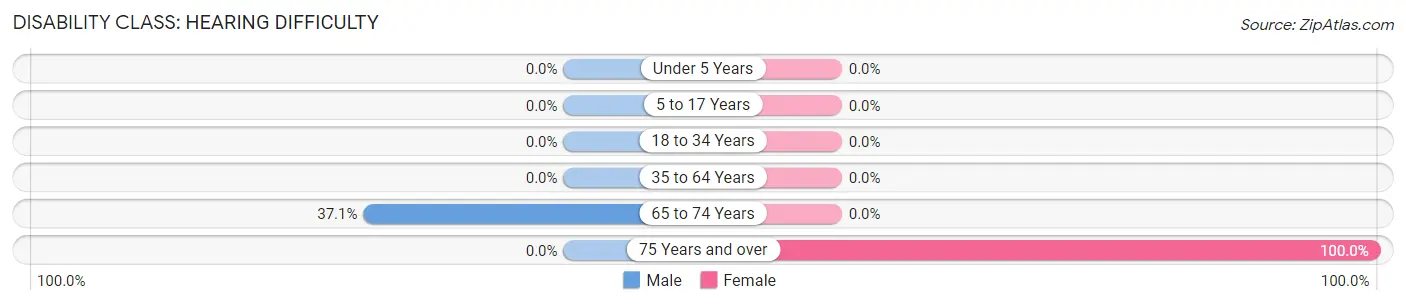
| Age Bracket | Male | Female |
| Under 5 Years | 0 (0.0%) | 0 (0.0%) |
| 5 to 17 Years | 0 (0.0%) | 0 (0.0%) |
| 18 to 34 Years | 0 (0.0%) | 0 (0.0%) |
| 35 to 64 Years | 0 (0.0%) | 0 (0.0%) |
| 65 to 74 Years | 26 (37.1%) | 0 (0.0%) |
| 75 Years and over | 0 (0.0%) | 28 (100.0%) |
Disability Class: Vision Difficulty
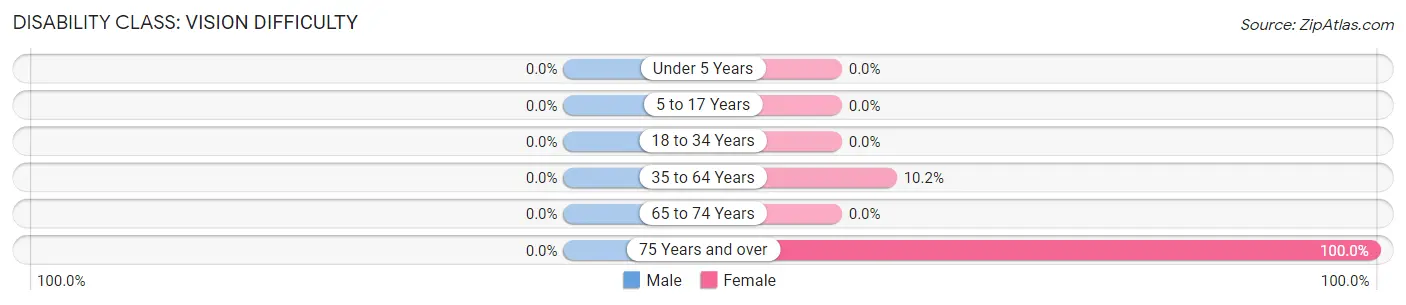
| Age Bracket | Male | Female |
| Under 5 Years | 0 (0.0%) | 0 (0.0%) |
| 5 to 17 Years | 0 (0.0%) | 0 (0.0%) |
| 18 to 34 Years | 0 (0.0%) | 0 (0.0%) |
| 35 to 64 Years | 0 (0.0%) | 20 (10.2%) |
| 65 to 74 Years | 0 (0.0%) | 0 (0.0%) |
| 75 Years and over | 0 (0.0%) | 28 (100.0%) |
Disability Class: Cognitive Difficulty
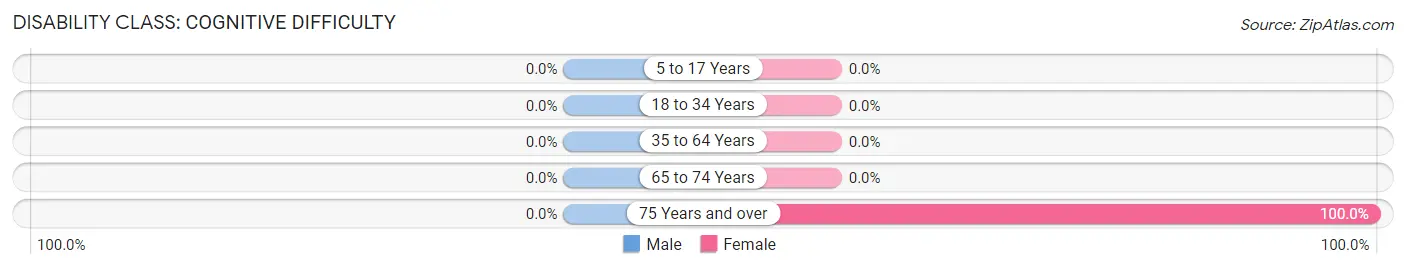
| Age Bracket | Male | Female |
| 5 to 17 Years | 0 (0.0%) | 0 (0.0%) |
| 18 to 34 Years | 0 (0.0%) | 0 (0.0%) |
| 35 to 64 Years | 0 (0.0%) | 0 (0.0%) |
| 65 to 74 Years | 0 (0.0%) | 0 (0.0%) |
| 75 Years and over | 0 (0.0%) | 28 (100.0%) |
Disability Class: Ambulatory Difficulty
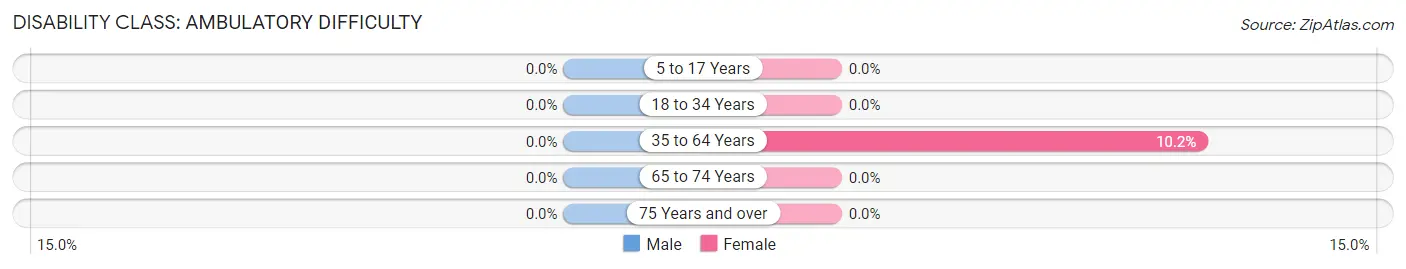
| Age Bracket | Male | Female |
| 5 to 17 Years | 0 (0.0%) | 0 (0.0%) |
| 18 to 34 Years | 0 (0.0%) | 0 (0.0%) |
| 35 to 64 Years | 0 (0.0%) | 20 (10.2%) |
| 65 to 74 Years | 0 (0.0%) | 0 (0.0%) |
| 75 Years and over | 0 (0.0%) | 0 (0.0%) |
Disability Class: Self-Care Difficulty
| Age Bracket | Male | Female |
| 5 to 17 Years | 0 (0.0%) | 0 (0.0%) |
| 18 to 34 Years | 0 (0.0%) | 0 (0.0%) |
| 35 to 64 Years | 0 (0.0%) | 0 (0.0%) |
| 65 to 74 Years | 0 (0.0%) | 0 (0.0%) |
| 75 Years and over | 0 (0.0%) | 0 (0.0%) |
Technology Access in Kettleman City
Computing Device Access in Kettleman City
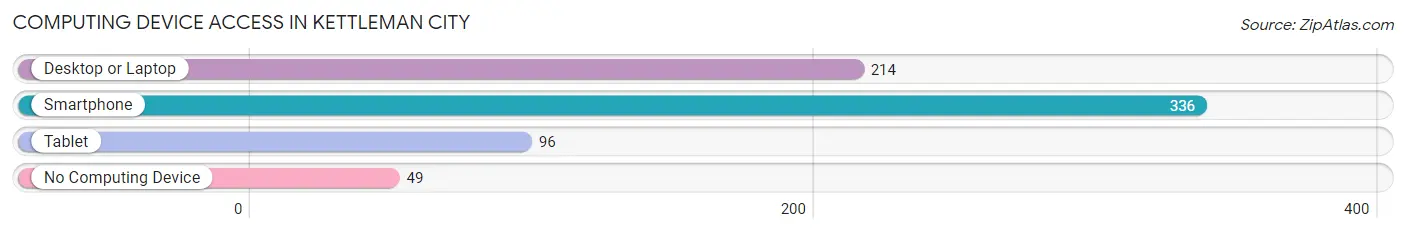
| Device Type | # Households | % Households |
| Desktop or Laptop | 214 | 55.6% |
| Smartphone | 336 | 87.3% |
| Tablet | 96 | 24.9% |
| No Computing Device | 49 | 12.7% |
| Total | 385 | 100.0% |
Internet Access in Kettleman City
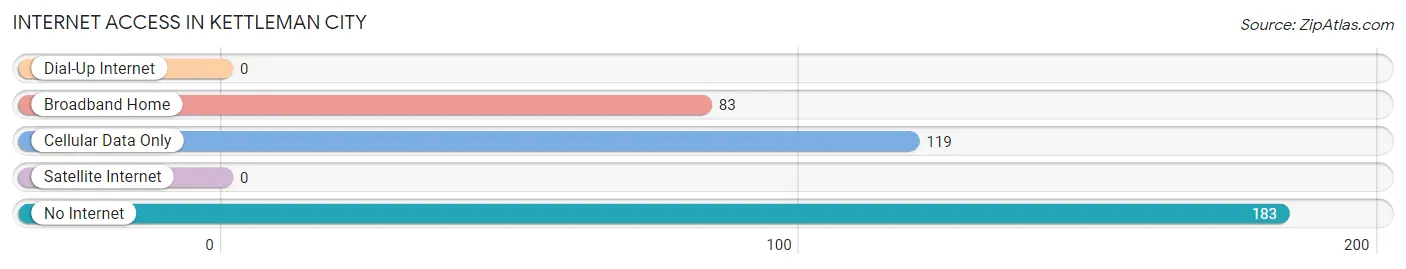
| Internet Type | # Households | % Households |
| Dial-Up Internet | 0 | 0.0% |
| Broadband Home | 83 | 21.6% |
| Cellular Data Only | 119 | 30.9% |
| Satellite Internet | 0 | 0.0% |
| No Internet | 183 | 47.5% |
| Total | 385 | 100.0% |
Kettleman City Summary
Kettleman City is a small unincorporated community located in Kings County, California, United States. It is situated along Interstate 5, approximately halfway between Los Angeles and San Francisco. The population was 1,542 at the 2010 census.
History
Kettleman City was founded in the late 19th century as a railroad town. The town was named after the Kettleman family, who owned a large ranch in the area. The Kettlemans were among the first settlers in the area, and their ranch was a major source of employment for the local community.
In the early 20th century, Kettleman City became a popular stop for travelers on the Southern Pacific Railroad. The town was also home to a number of businesses, including a hotel, a general store, and a post office.
In the 1950s, Kettleman City began to experience a decline in population as people moved away to larger cities. The town was further impacted by the construction of Interstate 5 in the 1960s, which bypassed the town and diverted traffic away from it.
Geography
Kettleman City is located in Kings County, California, at an elevation of approximately 200 feet (61 m). It is situated along Interstate 5, approximately halfway between Los Angeles and San Francisco. The town is located in the San Joaquin Valley, a large agricultural region in central California.
The climate in Kettleman City is hot and dry, with temperatures ranging from the mid-90s in the summer to the mid-50s in the winter. The area receives an average of 8 inches (20 cm) of precipitation per year.
Economy
Kettleman City is primarily a bedroom community, with most of its residents commuting to larger cities for work. The town is home to a number of businesses, including a gas station, a convenience store, and a few restaurants.
The town is also home to a number of industrial facilities, including a hazardous waste disposal site operated by Waste Management, Inc. The site has been the subject of controversy in recent years due to allegations of environmental contamination.
Demographics
As of the 2010 census, Kettleman City had a population of 1,542. The racial makeup of the town was 57.3% White, 0.7% African American, 0.7% Native American, 0.3% Asian, 0.1% Pacific Islander, 37.2% from other races, and 3.9% from two or more races. Hispanic or Latino of any race were 55.2% of the population.
The median household income in Kettleman City was $30,938, and the median family income was $35,625. The per capita income was $13,945. About 24.3% of families and 28.2% of the population were below the poverty line, including 37.3% of those under age 18 and 10.2% of those age 65 or over.
Common Questions
What is Per Capita Income in Kettleman City?
Per Capita income in Kettleman City is $20,503.
What is the Median Family Income in Kettleman City?
Median Family Income in Kettleman City is $41,793.
What is the Median Household income in Kettleman City?
Median Household Income in Kettleman City is $46,261.
What is Inequality or Gini Index in Kettleman City?
Inequality or Gini Index in Kettleman City is 0.35.
What is the Total Population of Kettleman City?
Total Population of Kettleman City is 956.
What is the Total Male Population of Kettleman City?
Total Male Population of Kettleman City is 569.
What is the Total Female Population of Kettleman City?
Total Female Population of Kettleman City is 387.
What is the Ratio of Males per 100 Females in Kettleman City?
There are 147.03 Males per 100 Females in Kettleman City.
What is the Ratio of Females per 100 Males in Kettleman City?
There are 68.01 Females per 100 Males in Kettleman City.
What is the Median Population Age in Kettleman City?
Median Population Age in Kettleman City is 42.0 Years.
What is the Average Family Size in Kettleman City
Average Family Size in Kettleman City is 2.8 People.
What is the Average Household Size in Kettleman City
Average Household Size in Kettleman City is 2.5 People.
How Large is the Labor Force in Kettleman City?
There are 590 People in the Labor Forcein in Kettleman City.
What is the Percentage of People in the Labor Force in Kettleman City?
73.5% of People are in the Labor Force in Kettleman City.
What is the Unemployment Rate in Kettleman City?
Unemployment Rate in Kettleman City is 7.8%.