Cities with the Highest Percentage of Families with Income Below $10,000 in Ohio
RELATED REPORTS & OPTIONS
Family Income | $0-10k
Ohio
Compare Cities
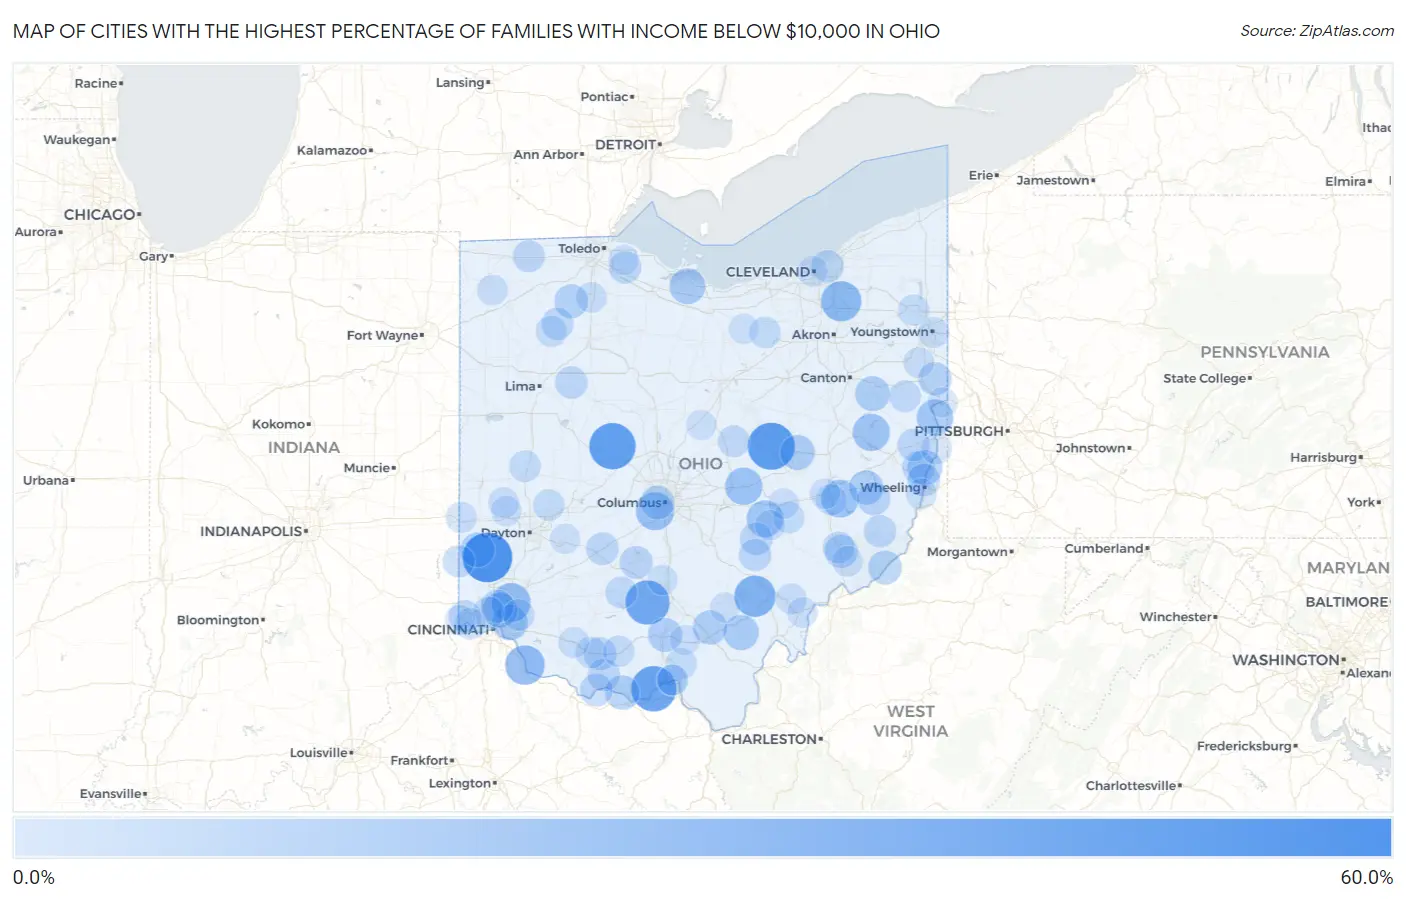
Map of Cities with the Highest Percentage of Families with Income Below $10,000 in Ohio
0.0%
60.0%
Cities with the Highest Percentage of Families with Income Below $10,000 in Ohio
| City | Families with Income < $10k | vs State | vs National | |
| 1. | West Elkton | 51.5% | 3.3%(+48.2)#1 | 3.1%(+48.4)#119 |
| 2. | Nellie | 46.0% | 3.3%(+42.7)#2 | 3.1%(+42.9)#156 |
| 3. | Raymond | 44.3% | 3.3%(+41.0)#3 | 3.1%(+41.2)#170 |
| 4. | Friendship | 42.0% | 3.3%(+38.7)#4 | 3.1%(+38.9)#190 |
| 5. | Bourneville | 39.6% | 3.3%(+36.3)#5 | 3.1%(+36.5)#224 |
| 6. | New Marshfield | 33.3% | 3.3%(+30.0)#6 | 3.1%(+30.2)#319 |
| 7. | Twinsburg Heights | 30.7% | 3.3%(+27.4)#7 | 3.1%(+27.6)#389 |
| 8. | Madison Place | 30.2% | 3.3%(+26.9)#8 | 3.1%(+27.1)#405 |
| 9. | Moscow | 29.0% | 3.3%(+25.7)#9 | 3.1%(+25.9)#432 |
| 10. | Brecon | 27.6% | 3.3%(+24.3)#10 | 3.1%(+24.5)#486 |
| 11. | Urbancrest | 26.1% | 3.3%(+22.8)#11 | 3.1%(+23.0)#542 |
| 12. | Lore City | 25.0% | 3.3%(+21.7)#12 | 3.1%(+21.9)#590 |
| 13. | Marne | 24.6% | 3.3%(+21.3)#13 | 3.1%(+21.5)#614 |
| 14. | Bowerston | 24.1% | 3.3%(+20.8)#14 | 3.1%(+21.0)#640 |
| 15. | East Fultonham | 23.3% | 3.3%(+20.0)#15 | 3.1%(+20.2)#685 |
| 16. | Stratton | 22.7% | 3.3%(+19.4)#16 | 3.1%(+19.6)#719 |
| 17. | Castalia | 20.8% | 3.3%(+17.5)#17 | 3.1%(+17.7)#831 |
| 18. | Plainville | 20.7% | 3.3%(+17.4)#18 | 3.1%(+17.6)#844 |
| 19. | Wilkesville | 20.0% | 3.3%(+16.7)#19 | 3.1%(+16.9)#897 |
| 20. | Lockland | 19.7% | 3.3%(+16.4)#20 | 3.1%(+16.6)#926 |
| 21. | Connorville | 19.4% | 3.3%(+16.1)#21 | 3.1%(+16.3)#965 |
| 22. | Malvern | 19.3% | 3.3%(+16.0)#22 | 3.1%(+16.2)#971 |
| 23. | Canal Lewisville | 19.2% | 3.3%(+15.9)#23 | 3.1%(+16.1)#986 |
| 24. | Camden | 18.7% | 3.3%(+15.4)#24 | 3.1%(+15.6)#1,029 |
| 25. | Coalton | 18.2% | 3.3%(+14.9)#25 | 3.1%(+15.1)#1,076 |
| 26. | Rome Stout | 18.2% | 3.3%(+14.9)#26 | 3.1%(+15.1)#1,090 |
| 27. | Fairview | 18.2% | 3.3%(+14.9)#27 | 3.1%(+15.1)#1,091 |
| 28. | Piketon | 17.6% | 3.3%(+14.3)#28 | 3.1%(+14.5)#1,138 |
| 29. | Valleyview | 17.1% | 3.3%(+13.8)#29 | 3.1%(+14.0)#1,194 |
| 30. | Matamoras | 16.9% | 3.3%(+13.6)#30 | 3.1%(+13.8)#1,217 |
| 31. | Petersburg | 16.8% | 3.3%(+13.5)#31 | 3.1%(+13.7)#1,233 |
| 32. | Milton Center | 16.7% | 3.3%(+13.4)#32 | 3.1%(+13.6)#1,245 |
| 33. | Rogers | 15.9% | 3.3%(+12.6)#33 | 3.1%(+12.8)#1,341 |
| 34. | Barnesville | 15.6% | 3.3%(+12.3)#34 | 3.1%(+12.5)#1,364 |
| 35. | Macksburg | 15.6% | 3.3%(+12.3)#35 | 3.1%(+12.5)#1,378 |
| 36. | Woodlawn | 15.0% | 3.3%(+11.7)#36 | 3.1%(+11.9)#1,452 |
| 37. | Seaman | 15.0% | 3.3%(+11.7)#37 | 3.1%(+11.9)#1,457 |
| 38. | New Holland | 15.0% | 3.3%(+11.7)#38 | 3.1%(+11.9)#1,459 |
| 39. | Dillonvale | 14.9% | 3.3%(+11.6)#39 | 3.1%(+11.8)#1,479 |
| 40. | Manchester | 14.7% | 3.3%(+11.4)#40 | 3.1%(+11.6)#1,509 |
| 41. | Martins Ferry | 14.6% | 3.3%(+11.3)#41 | 3.1%(+11.5)#1,531 |
| 42. | New Lexington | 14.6% | 3.3%(+11.3)#42 | 3.1%(+11.5)#1,532 |
| 43. | West Union | 14.3% | 3.3%(+11.0)#43 | 3.1%(+11.2)#1,582 |
| 44. | Bloomingdale | 14.3% | 3.3%(+11.0)#44 | 3.1%(+11.2)#1,610 |
| 45. | Ada | 14.2% | 3.3%(+10.9)#45 | 3.1%(+11.1)#1,627 |
| 46. | Jeffersonville | 14.1% | 3.3%(+10.8)#46 | 3.1%(+11.0)#1,652 |
| 47. | Woodsfield | 14.0% | 3.3%(+10.7)#47 | 3.1%(+10.9)#1,669 |
| 48. | East Cleveland | 13.8% | 3.3%(+10.5)#48 | 3.1%(+10.7)#1,696 |
| 49. | Shawnee | 13.8% | 3.3%(+10.5)#49 | 3.1%(+10.7)#1,709 |
| 50. | Hooven | 13.7% | 3.3%(+10.4)#50 | 3.1%(+10.6)#1,725 |
| 51. | Genoa | 13.6% | 3.3%(+10.3)#51 | 3.1%(+10.5)#1,737 |
| 52. | College Corner | 13.5% | 3.3%(+10.2)#52 | 3.1%(+10.4)#1,775 |
| 53. | Belmore | 13.3% | 3.3%(+10.00)#53 | 3.1%(+10.2)#1,823 |
| 54. | Tedrow | 13.2% | 3.3%(+9.90)#54 | 3.1%(+10.1)#1,847 |
| 55. | Gambier | 13.0% | 3.3%(+9.70)#55 | 3.1%(+9.90)#1,876 |
| 56. | Miller | 13.0% | 3.3%(+9.70)#56 | 3.1%(+9.90)#1,881 |
| 57. | Summitville | 12.8% | 3.3%(+9.50)#57 | 3.1%(+9.70)#1,928 |
| 58. | Greenfield | 12.7% | 3.3%(+9.40)#58 | 3.1%(+9.60)#1,938 |
| 59. | Dexter City | 12.5% | 3.3%(+9.20)#59 | 3.1%(+9.40)#2,009 |
| 60. | North College Hill | 12.4% | 3.3%(+9.10)#60 | 3.1%(+9.30)#2,019 |
| 61. | Camp Dennison | 12.3% | 3.3%(+9.00)#61 | 3.1%(+9.20)#2,055 |
| 62. | Lockington | 12.3% | 3.3%(+9.00)#62 | 3.1%(+9.20)#2,063 |
| 63. | Spencer | 12.1% | 3.3%(+8.80)#63 | 3.1%(+9.00)#2,109 |
| 64. | New Carlisle | 12.0% | 3.3%(+8.70)#64 | 3.1%(+8.90)#2,120 |
| 65. | Winchester | 12.0% | 3.3%(+8.70)#65 | 3.1%(+8.90)#2,132 |
| 66. | Peebles | 11.9% | 3.3%(+8.60)#66 | 3.1%(+8.80)#2,153 |
| 67. | Addyston | 11.9% | 3.3%(+8.60)#67 | 3.1%(+8.80)#2,157 |
| 68. | Philo | 11.9% | 3.3%(+8.60)#68 | 3.1%(+8.80)#2,158 |
| 69. | Minford | 11.5% | 3.3%(+8.20)#69 | 3.1%(+8.40)#2,296 |
| 70. | Warren | 11.4% | 3.3%(+8.10)#70 | 3.1%(+8.30)#2,312 |
| 71. | West Leipsic | 11.3% | 3.3%(+8.00)#71 | 3.1%(+8.20)#2,372 |
| 72. | New Boston | 11.1% | 3.3%(+7.80)#72 | 3.1%(+8.00)#2,416 |
| 73. | Byesville | 11.0% | 3.3%(+7.70)#73 | 3.1%(+7.90)#2,465 |
| 74. | New Paris | 10.9% | 3.3%(+7.60)#74 | 3.1%(+7.80)#2,491 |
| 75. | Sardinia | 10.8% | 3.3%(+7.50)#75 | 3.1%(+7.70)#2,522 |
| 76. | Stewart | 10.7% | 3.3%(+7.40)#76 | 3.1%(+7.60)#2,574 |
| 77. | Youngstown | 10.6% | 3.3%(+7.30)#77 | 3.1%(+7.50)#2,584 |
| 78. | Lower Salem | 10.5% | 3.3%(+7.20)#78 | 3.1%(+7.40)#2,661 |
| 79. | Portage | 10.4% | 3.3%(+7.10)#79 | 3.1%(+7.30)#2,687 |
| 80. | Potsdam | 10.4% | 3.3%(+7.10)#80 | 3.1%(+7.30)#2,690 |
| 81. | Bellaire | 10.3% | 3.3%(+7.00)#81 | 3.1%(+7.20)#2,706 |
| 82. | Mingo Junction | 10.3% | 3.3%(+7.00)#82 | 3.1%(+7.20)#2,709 |
| 83. | Washingtonville | 10.3% | 3.3%(+7.00)#83 | 3.1%(+7.20)#2,724 |
| 84. | Ney | 10.3% | 3.3%(+7.00)#84 | 3.1%(+7.20)#2,732 |
| 85. | Portsmouth | 10.2% | 3.3%(+6.90)#85 | 3.1%(+7.10)#2,748 |
| 86. | Cleveland | 10.0% | 3.3%(+6.70)#86 | 3.1%(+6.90)#2,819 |
| 87. | Pleasant Grove | 9.9% | 3.3%(+6.60)#87 | 3.1%(+6.80)#2,911 |
| 88. | Cambridge | 9.8% | 3.3%(+6.50)#88 | 3.1%(+6.70)#2,930 |
| 89. | Roseville | 9.8% | 3.3%(+6.50)#89 | 3.1%(+6.70)#2,945 |
| 90. | Phillipsburg | 9.8% | 3.3%(+6.50)#90 | 3.1%(+6.70)#2,960 |
| 91. | Beaver | 9.7% | 3.3%(+6.40)#91 | 3.1%(+6.60)#3,015 |
| 92. | Coolville | 9.6% | 3.3%(+6.30)#92 | 3.1%(+6.50)#3,054 |
| 93. | Andersonville | 9.6% | 3.3%(+6.30)#93 | 3.1%(+6.50)#3,058 |
| 94. | Chesterville | 9.5% | 3.3%(+6.20)#94 | 3.1%(+6.40)#3,112 |
| 95. | Wilberforce | 9.4% | 3.3%(+6.10)#95 | 3.1%(+6.30)#3,129 |
| 96. | Mcarthur | 9.4% | 3.3%(+6.10)#96 | 3.1%(+6.30)#3,131 |
| 97. | Clay Center | 9.4% | 3.3%(+6.10)#97 | 3.1%(+6.30)#3,154 |
| 98. | Elizabethtown | 9.3% | 3.3%(+6.00)#98 | 3.1%(+6.20)#3,207 |
| 99. | Rochester | 9.3% | 3.3%(+6.00)#99 | 3.1%(+6.20)#3,212 |
| 100. | East Liverpool | 9.2% | 3.3%(+5.90)#100 | 3.1%(+6.10)#3,217 |
Common Questions
What are the Top 10 Cities with the Highest Percentage of Families with Income Below $10,000 in Ohio?
Top 10 Cities with the Highest Percentage of Families with Income Below $10,000 in Ohio are:
#1
51.5%
#2
46.0%
#3
44.3%
#4
42.0%
#5
39.6%
#6
33.3%
#7
30.7%
#8
29.0%
#9
27.6%
#10
26.1%
What city has the Highest Percentage of Families with Income Below $10,000 in Ohio?
West Elkton has the Highest Percentage of Families with Income Below $10,000 in Ohio with 51.5%.
What is the Percentage of Families with Income Below $10,000 in the State of Ohio?
Percentage of Families with Income Below $10,000 in Ohio is 3.3%.
What is the Percentage of Families with Income Below $10,000 in the United States?
Percentage of Families with Income Below $10,000 in the United States is 3.1%.