Mendota, CA Map & Demographics
Mendota Map
Mendota Overview
$12,850
PER CAPITA INCOME
$43,301
AVG FAMILY INCOME
$43,315
AVG HOUSEHOLD INCOME
40.5%
WAGE / INCOME GAP [ % ]
59.5¢/ $1
WAGE / INCOME GAP [ $ ]
$13,445
FAMILY INCOME DEFICIT
0.41
INEQUALITY / GINI INDEX
12,603
TOTAL POPULATION
6,510
MALE POPULATION
6,093
FEMALE POPULATION
106.84
MALES / 100 FEMALES
93.59
FEMALES / 100 MALES
24.3
MEDIAN AGE
4.3
AVG FAMILY SIZE
4.1
AVG HOUSEHOLD SIZE
5,077
LABOR FORCE [ PEOPLE ]
63.5%
PERCENT IN LABOR FORCE
11.4%
UNEMPLOYMENT RATE
Mendota Zip Codes
Mendota Area Codes
Income in Mendota
Income Overview in Mendota
Per Capita Income in Mendota is $12,850, while median incomes of families and households are $43,301 and $43,315 respectively.
| Characteristic | Number | Measure |
| Per Capita Income | 12,603 | $12,850 |
| Median Family Income | 2,645 | $43,301 |
| Mean Family Income | 2,645 | $50,714 |
| Median Household Income | 3,068 | $43,315 |
| Mean Household Income | 3,068 | $50,701 |
| Income Deficit | 2,645 | $13,445 |
| Wage / Income Gap (%) | 12,603 | 40.48% |
| Wage / Income Gap ($) | 12,603 | 59.52¢ per $1 |
| Gini / Inequality Index | 12,603 | 0.41 |
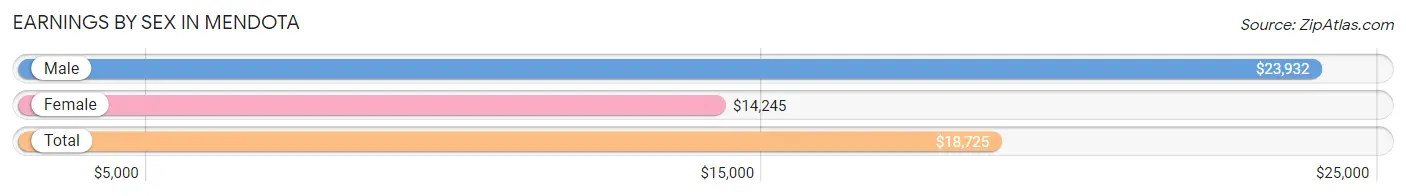
Earnings by Sex in Mendota
Average Earnings in Mendota are $18,725, $23,932 for men and $14,245 for women, a difference of 40.5%.
| Sex | Number | Average Earnings |
| Male | 3,045 (55.3%) | $23,932 |
| Female | 2,464 (44.7%) | $14,245 |
| Total | 5,509 (100.0%) | $18,725 |
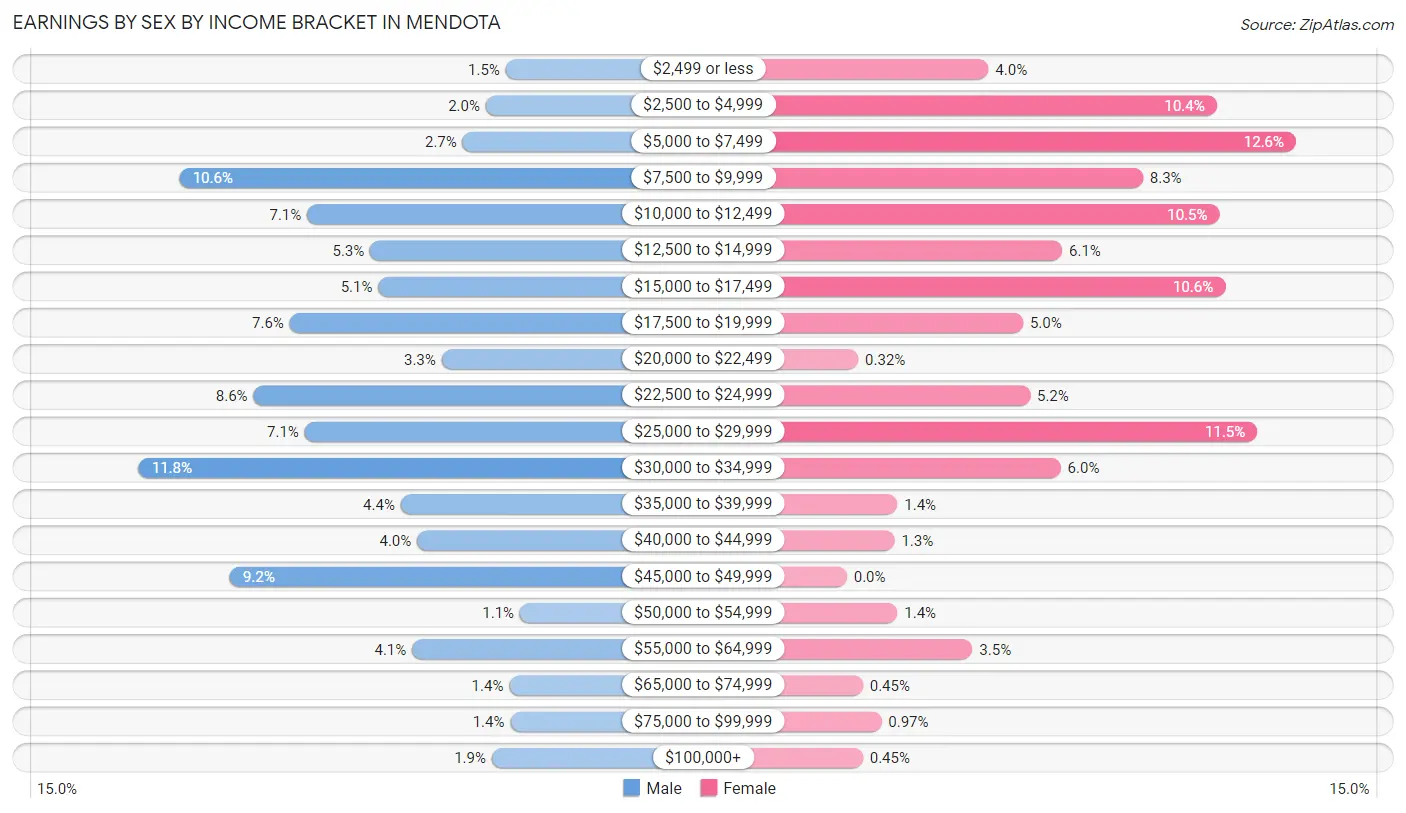
Earnings by Sex by Income Bracket in Mendota
The most common earnings brackets in Mendota are $30,000 to $34,999 for men (359 | 11.8%) and $5,000 to $7,499 for women (311 | 12.6%).
| Income | Male | Female |
| $2,499 or less | 45 (1.5%) | 98 (4.0%) |
| $2,500 to $4,999 | 62 (2.0%) | 256 (10.4%) |
| $5,000 to $7,499 | 82 (2.7%) | 311 (12.6%) |
| $7,500 to $9,999 | 324 (10.6%) | 205 (8.3%) |
| $10,000 to $12,499 | 215 (7.1%) | 258 (10.5%) |
| $12,500 to $14,999 | 161 (5.3%) | 149 (6.0%) |
| $15,000 to $17,499 | 154 (5.1%) | 262 (10.6%) |
| $17,500 to $19,999 | 230 (7.5%) | 122 (5.0%) |
| $20,000 to $22,499 | 100 (3.3%) | 8 (0.3%) |
| $22,500 to $24,999 | 261 (8.6%) | 127 (5.1%) |
| $25,000 to $29,999 | 217 (7.1%) | 284 (11.5%) |
| $30,000 to $34,999 | 359 (11.8%) | 148 (6.0%) |
| $35,000 to $39,999 | 135 (4.4%) | 35 (1.4%) |
| $40,000 to $44,999 | 121 (4.0%) | 33 (1.3%) |
| $45,000 to $49,999 | 281 (9.2%) | 0 (0.0%) |
| $50,000 to $54,999 | 33 (1.1%) | 35 (1.4%) |
| $55,000 to $64,999 | 125 (4.1%) | 87 (3.5%) |
| $65,000 to $74,999 | 42 (1.4%) | 11 (0.4%) |
| $75,000 to $99,999 | 41 (1.3%) | 24 (1.0%) |
| $100,000+ | 57 (1.9%) | 11 (0.4%) |
| Total | 3,045 (100.0%) | 2,464 (100.0%) |
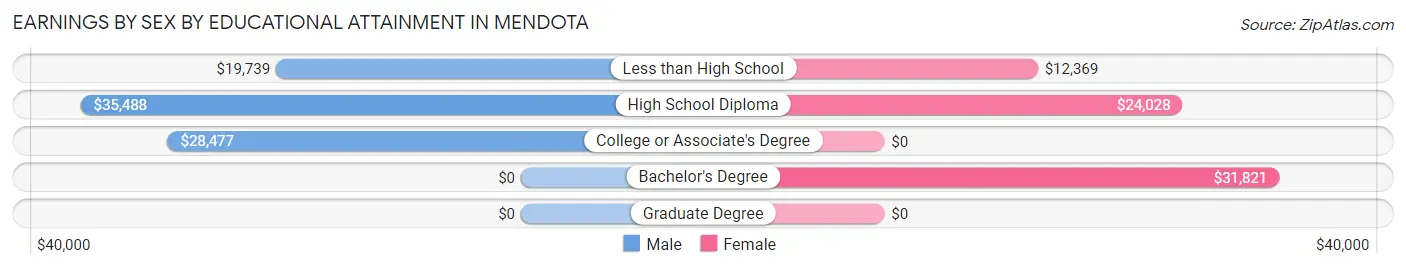
Earnings by Sex by Educational Attainment in Mendota
Average earnings in Mendota are $24,837 for men and $15,606 for women, a difference of 37.2%. Men with an educational attainment of high school diploma enjoy the highest average annual earnings of $35,488, while those with less than high school education earn the least with $19,739. Women with an educational attainment of bachelor's degree earn the most with the average annual earnings of $31,821, while those with less than high school education have the smallest earnings of $12,369.
| Educational Attainment | Male Income | Female Income |
| Less than High School | $19,739 | $12,369 |
| High School Diploma | $35,488 | $24,028 |
| College or Associate's Degree | $28,477 | $0 |
| Bachelor's Degree | - | - |
| Graduate Degree | - | - |
| Total | $24,837 | $15,606 |
Family Income in Mendota
Family Income Brackets in Mendota
According to the Mendota family income data, there are 630 families falling into the $50,000 to $74,999 income range, which is the most common income bracket and makes up 23.8% of all families. Conversely, the $200,000+ income bracket is the least frequent group with only 24 families (0.9%) belonging to this category.
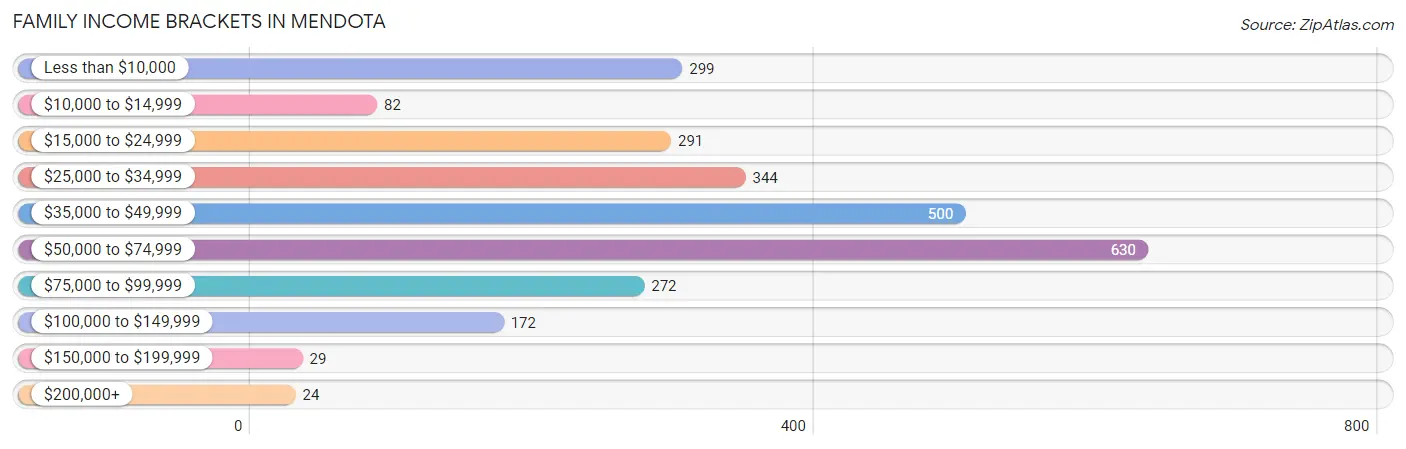
| Income Bracket | # Families | % Families |
| Less than $10,000 | 299 | 11.3% |
| $10,000 to $14,999 | 82 | 3.1% |
| $15,000 to $24,999 | 291 | 11.0% |
| $25,000 to $34,999 | 344 | 13.0% |
| $35,000 to $49,999 | 500 | 18.9% |
| $50,000 to $74,999 | 630 | 23.8% |
| $75,000 to $99,999 | 272 | 10.3% |
| $100,000 to $149,999 | 172 | 6.5% |
| $150,000 to $199,999 | 29 | 1.1% |
| $200,000+ | 24 | 0.9% |
Family Income by Famaliy Size in Mendota
7+ person families (251 | 9.5%) account for the highest median family income in Mendota with $58,977 per family, while 3-person families (604 | 22.8%) have the highest median income of $14,409 per family member.
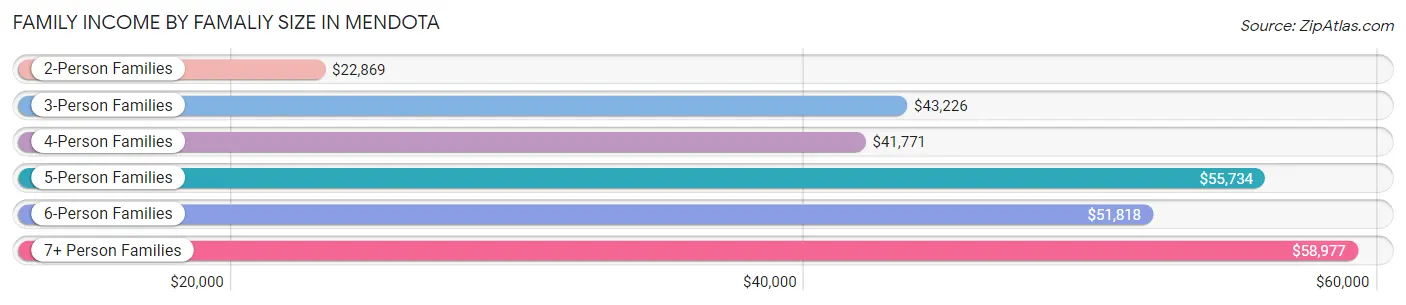
| Income Bracket | # Families | Median Income |
| 2-Person Families | 531 (20.1%) | $22,869 |
| 3-Person Families | 604 (22.8%) | $43,226 |
| 4-Person Families | 550 (20.8%) | $41,771 |
| 5-Person Families | 309 (11.7%) | $55,734 |
| 6-Person Families | 400 (15.1%) | $51,818 |
| 7+ Person Families | 251 (9.5%) | $58,977 |
| Total | 2,645 (100.0%) | $43,301 |
Family Income by Number of Earners in Mendota
The median family income in Mendota is $43,301, with families comprising 3+ earners (453) having the highest median family income of $85,298, while families with no earners (240) have the lowest median family income of $2,499, accounting for 17.1% and 9.1% of families, respectively.
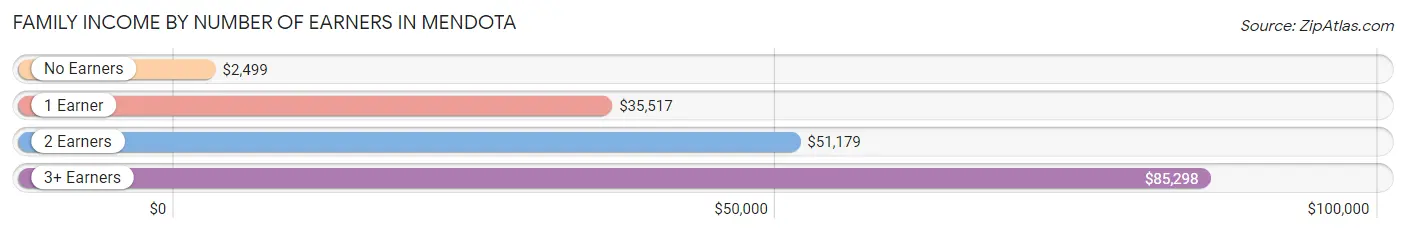
| Number of Earners | # Families | Median Income |
| No Earners | 240 (9.1%) | $2,499 |
| 1 Earner | 1,097 (41.5%) | $35,517 |
| 2 Earners | 855 (32.3%) | $51,179 |
| 3+ Earners | 453 (17.1%) | $85,298 |
| Total | 2,645 (100.0%) | $43,301 |
Household Income in Mendota
Household Income Brackets in Mendota
With 727 households falling in the category, the $50,000 to $74,999 income range is the most frequent in Mendota, accounting for 23.7% of all households. In contrast, only 25 households (0.8%) fall into the $200,000+ income bracket, making it the least populous group.
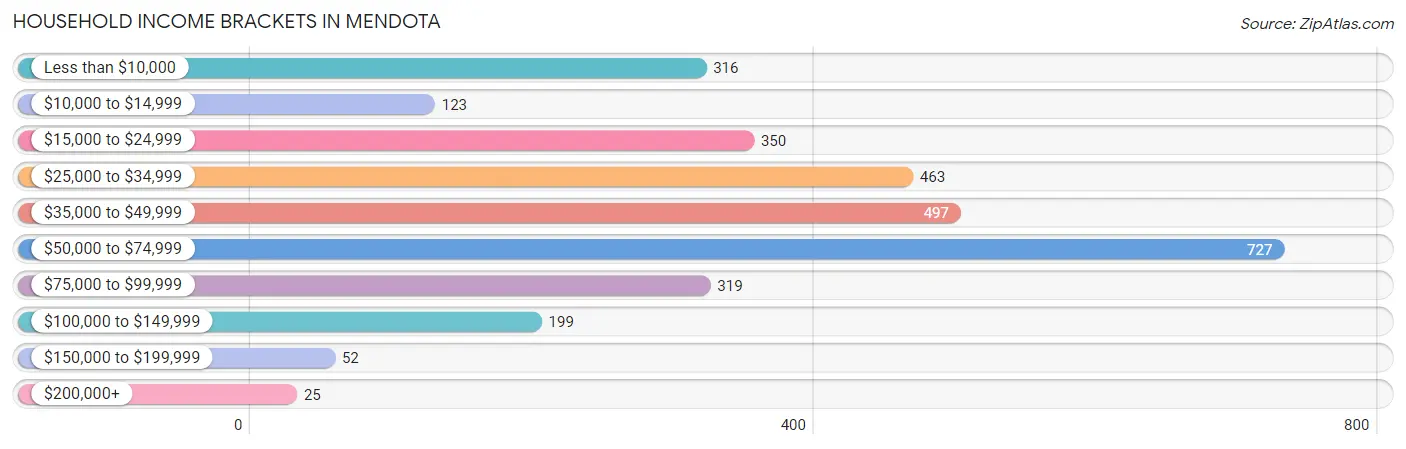
| Income Bracket | # Households | % Households |
| Less than $10,000 | 316 | 10.3% |
| $10,000 to $14,999 | 123 | 4.0% |
| $15,000 to $24,999 | 350 | 11.4% |
| $25,000 to $34,999 | 463 | 15.1% |
| $35,000 to $49,999 | 497 | 16.2% |
| $50,000 to $74,999 | 727 | 23.7% |
| $75,000 to $99,999 | 319 | 10.4% |
| $100,000 to $149,999 | 199 | 6.5% |
| $150,000 to $199,999 | 52 | 1.7% |
| $200,000+ | 25 | 0.8% |
Household Income by Householder Age in Mendota
The median household income in Mendota is $43,315, with the highest median household income of $53,125 found in the 45 to 64 years age bracket for the primary householder. A total of 965 households (31.5%) fall into this category. Meanwhile, the 15 to 24 years age bracket for the primary householder has the lowest median household income of $0, with 240 households (7.8%) in this group.
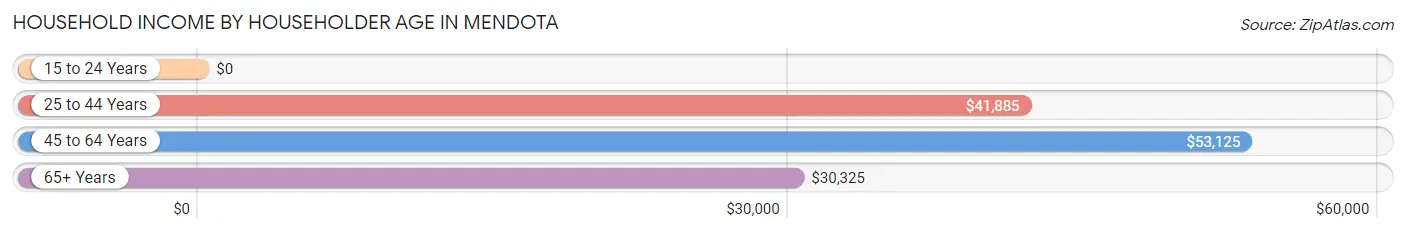
| Income Bracket | # Households | Median Income |
| 15 to 24 Years | 240 (7.8%) | $0 |
| 25 to 44 Years | 1,444 (47.1%) | $41,885 |
| 45 to 64 Years | 965 (31.5%) | $53,125 |
| 65+ Years | 419 (13.7%) | $30,325 |
| Total | 3,068 (100.0%) | $43,315 |
Poverty in Mendota
Income Below Poverty by Sex and Age in Mendota
With 26.5% poverty level for males and 39.4% for females among the residents of Mendota, 15 year old males and 6 to 11 year old females are the most vulnerable to poverty, with 98 males (46.7%) and 455 females (61.9%) in their respective age groups living below the poverty level.
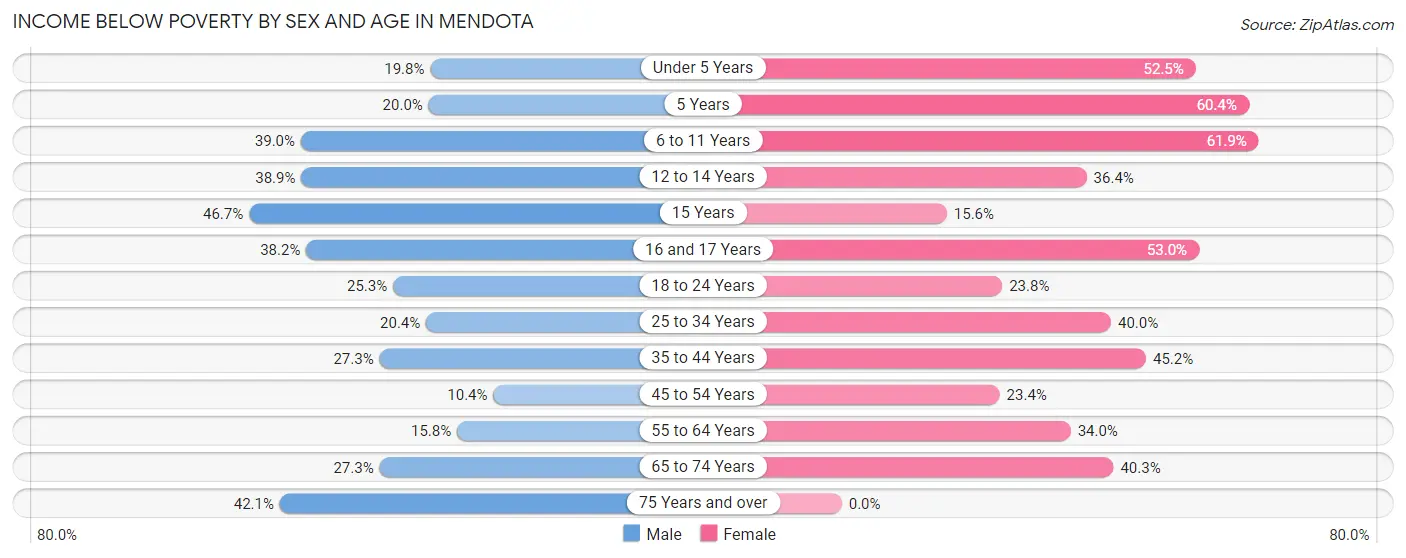
| Age Bracket | Male | Female |
| Under 5 Years | 116 (19.8%) | 332 (52.5%) |
| 5 Years | 48 (20.0%) | 58 (60.4%) |
| 6 to 11 Years | 384 (39.0%) | 455 (61.9%) |
| 12 to 14 Years | 193 (38.9%) | 152 (36.4%) |
| 15 Years | 98 (46.7%) | 22 (15.6%) |
| 16 and 17 Years | 42 (38.2%) | 70 (53.0%) |
| 18 to 24 Years | 151 (25.3%) | 222 (23.8%) |
| 25 to 34 Years | 181 (20.4%) | 341 (40.0%) |
| 35 to 44 Years | 196 (27.3%) | 380 (45.2%) |
| 45 to 54 Years | 62 (10.4%) | 128 (23.4%) |
| 55 to 64 Years | 87 (15.8%) | 138 (34.0%) |
| 65 to 74 Years | 95 (27.3%) | 94 (40.3%) |
| 75 Years and over | 56 (42.1%) | 0 (0.0%) |
| Total | 1,709 (26.5%) | 2,392 (39.4%) |
Income Above Poverty by Sex and Age in Mendota
According to the poverty statistics in Mendota, males aged 45 to 54 years and females aged 75 years and over are the age groups that are most secure financially, with 89.6% of males and 100.0% of females in these age groups living above the poverty line.
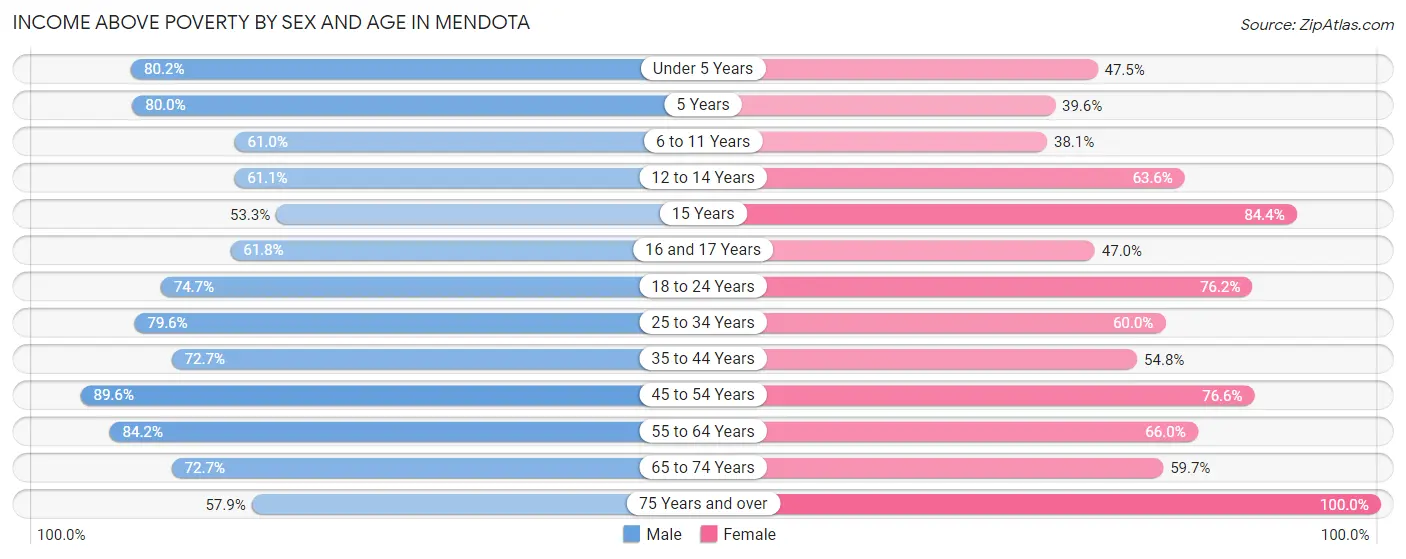
| Age Bracket | Male | Female |
| Under 5 Years | 471 (80.2%) | 300 (47.5%) |
| 5 Years | 192 (80.0%) | 38 (39.6%) |
| 6 to 11 Years | 601 (61.0%) | 280 (38.1%) |
| 12 to 14 Years | 303 (61.1%) | 266 (63.6%) |
| 15 Years | 112 (53.3%) | 119 (84.4%) |
| 16 and 17 Years | 68 (61.8%) | 62 (47.0%) |
| 18 to 24 Years | 446 (74.7%) | 710 (76.2%) |
| 25 to 34 Years | 707 (79.6%) | 512 (60.0%) |
| 35 to 44 Years | 522 (72.7%) | 461 (54.8%) |
| 45 to 54 Years | 535 (89.6%) | 418 (76.6%) |
| 55 to 64 Years | 464 (84.2%) | 268 (66.0%) |
| 65 to 74 Years | 253 (72.7%) | 139 (59.7%) |
| 75 Years and over | 77 (57.9%) | 111 (100.0%) |
| Total | 4,751 (73.5%) | 3,684 (60.6%) |
Income Below Poverty Among Married-Couple Families in Mendota
The poverty statistics for married-couple families in Mendota show that 16.3% or 268 of the total 1,643 families live below the poverty line. Families with 5 or more children have the highest poverty rate of 89.0%, comprising of 89 families. On the other hand, families with no children have the lowest poverty rate of 7.1%, which includes 20 families.
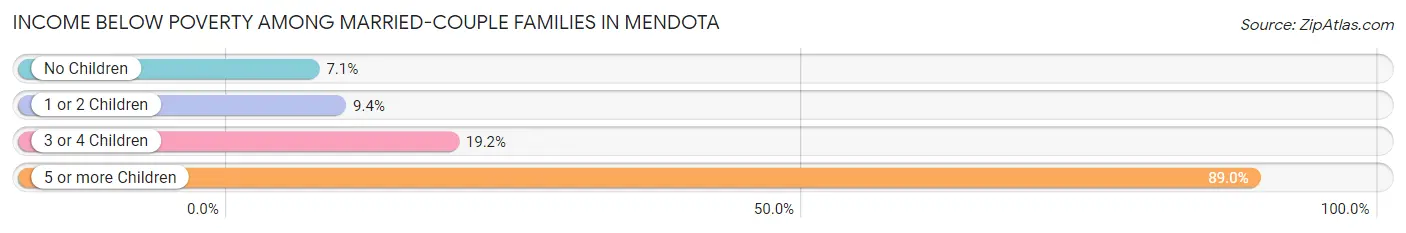
| Children | Above Poverty | Below Poverty |
| No Children | 262 (92.9%) | 20 (7.1%) |
| 1 or 2 Children | 770 (90.6%) | 80 (9.4%) |
| 3 or 4 Children | 332 (80.8%) | 79 (19.2%) |
| 5 or more Children | 11 (11.0%) | 89 (89.0%) |
| Total | 1,375 (83.7%) | 268 (16.3%) |
Income Below Poverty Among Single-Parent Households in Mendota
According to the poverty data in Mendota, 16.2% or 57 single-father households and 71.5% or 464 single-mother households are living below the poverty line. Among single-father households, those with 3 or 4 children have the highest poverty rate, with 17 households (41.5%) experiencing poverty. Likewise, among single-mother households, those with 5 or more children have the highest poverty rate, with 27 households (100.0%) falling below the poverty line.
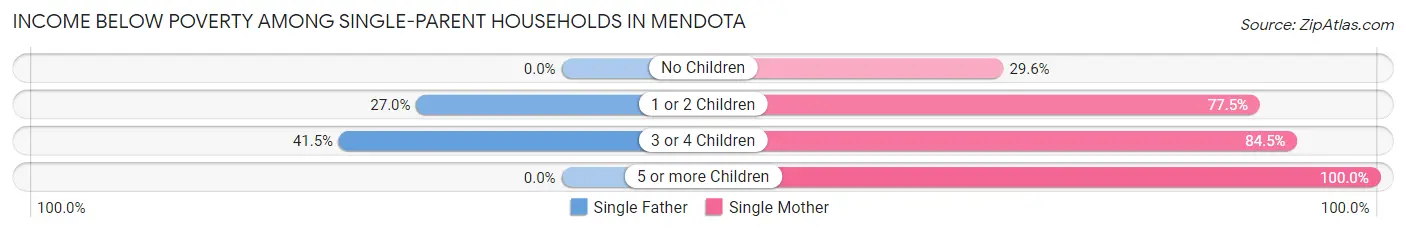
| Children | Single Father | Single Mother |
| No Children | 0 (0.0%) | 34 (29.6%) |
| 1 or 2 Children | 40 (27.0%) | 283 (77.5%) |
| 3 or 4 Children | 17 (41.5%) | 120 (84.5%) |
| 5 or more Children | 0 (0.0%) | 27 (100.0%) |
| Total | 57 (16.2%) | 464 (71.5%) |
Income Below Poverty Among Married-Couple vs Single-Parent Households in Mendota
The poverty data for Mendota shows that 268 of the married-couple family households (16.3%) and 521 of the single-parent households (52.0%) are living below the poverty level. Within the married-couple family households, those with 5 or more children have the highest poverty rate, with 89 households (89.0%) falling below the poverty line. Among the single-parent households, those with 5 or more children have the highest poverty rate, with 27 household (100.0%) living below poverty.
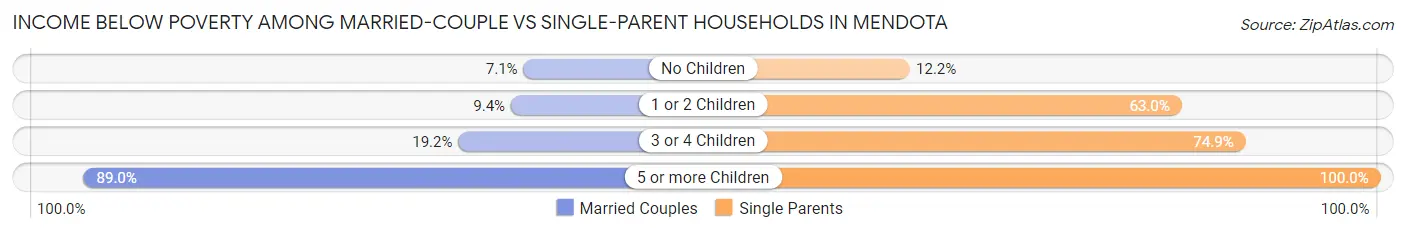
| Children | Married-Couple Families | Single-Parent Households |
| No Children | 20 (7.1%) | 34 (12.2%) |
| 1 or 2 Children | 80 (9.4%) | 323 (63.0%) |
| 3 or 4 Children | 79 (19.2%) | 137 (74.9%) |
| 5 or more Children | 89 (89.0%) | 27 (100.0%) |
| Total | 268 (16.3%) | 521 (52.0%) |
Race in Mendota
The most populous races in Mendota are Hispanic or Latino (12,334 | 97.9%), Some other Race (6,565 | 52.1%), and White / Caucasian (4,082 | 32.4%).
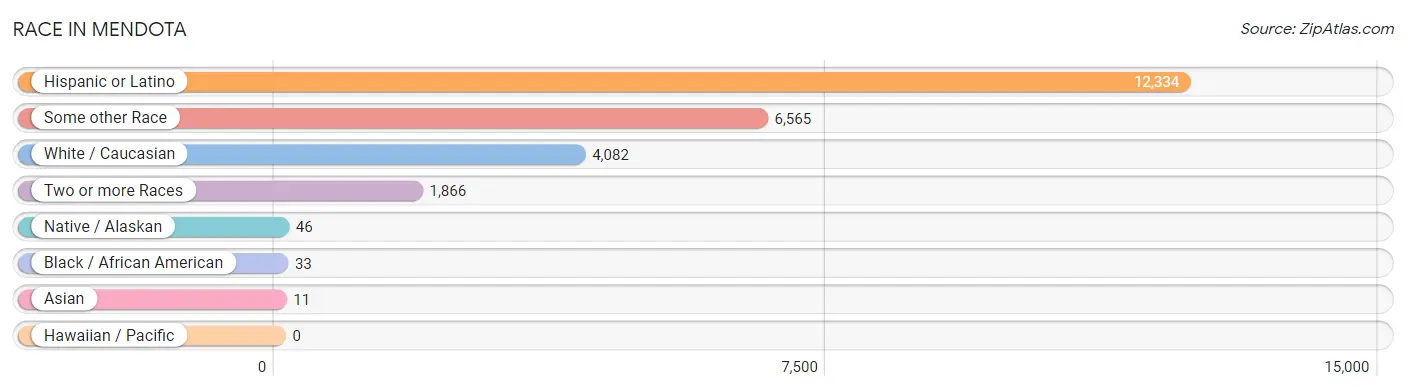
| Race | # Population | % Population |
| Asian | 11 | 0.1% |
| Black / African American | 33 | 0.3% |
| Hawaiian / Pacific | 0 | 0.0% |
| Hispanic or Latino | 12,334 | 97.9% |
| Native / Alaskan | 46 | 0.4% |
| White / Caucasian | 4,082 | 32.4% |
| Two or more Races | 1,866 | 14.8% |
| Some other Race | 6,565 | 52.1% |
| Total | 12,603 | 100.0% |
Ancestry in Mendota
The most populous ancestries reported in Mendota are Mexican (7,047 | 55.9%), Central American (5,152 | 40.9%), Salvadoran (4,717 | 37.4%), Honduran (306 | 2.4%), and Arab (213 | 1.7%), together accounting for 138.3% of all Mendota residents.
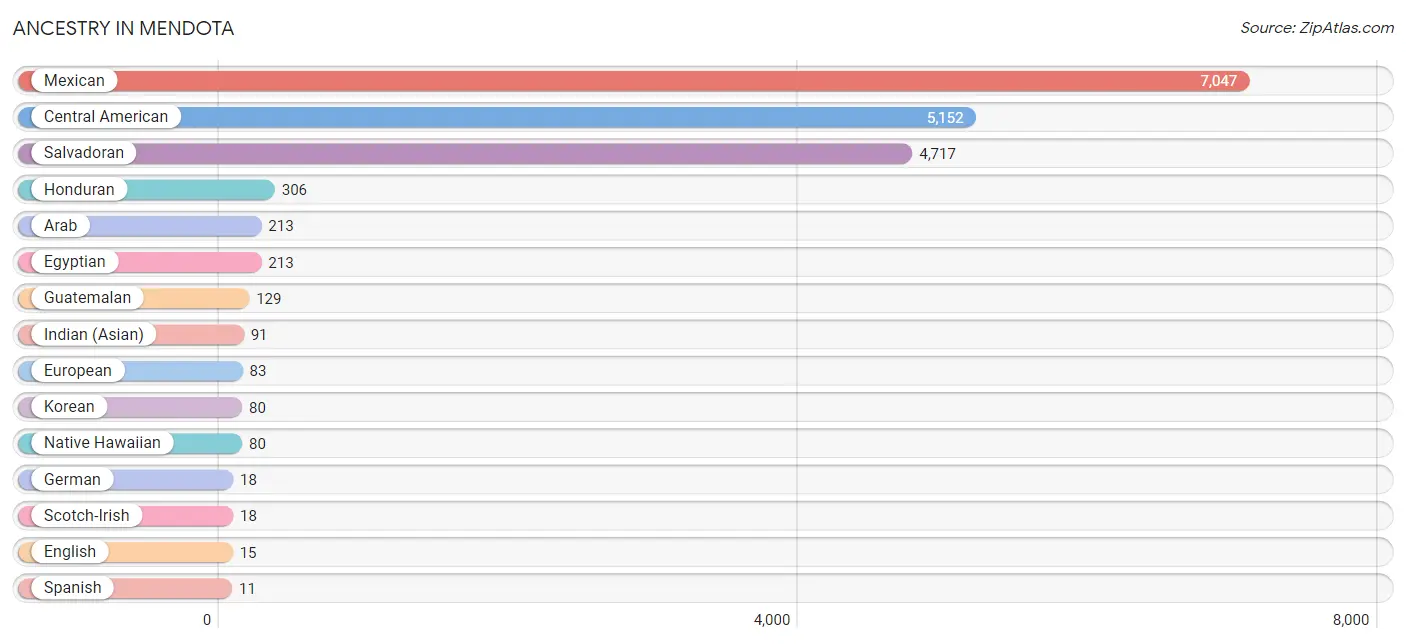
| Ancestry | # Population | % Population |
| Arab | 213 | 1.7% |
| Central American | 5,152 | 40.9% |
| Dutch | 10 | 0.1% |
| Egyptian | 213 | 1.7% |
| English | 15 | 0.1% |
| European | 83 | 0.7% |
| German | 18 | 0.1% |
| Guatemalan | 129 | 1.0% |
| Honduran | 306 | 2.4% |
| Indian (Asian) | 91 | 0.7% |
| Irish | 10 | 0.1% |
| Korean | 80 | 0.6% |
| Mexican | 7,047 | 55.9% |
| Native Hawaiian | 80 | 0.6% |
| Puerto Rican | 10 | 0.1% |
| Salvadoran | 4,717 | 37.4% |
| Scotch-Irish | 18 | 0.1% |
| Spanish | 11 | 0.1% | View All 18 Rows |
Immigrants in Mendota
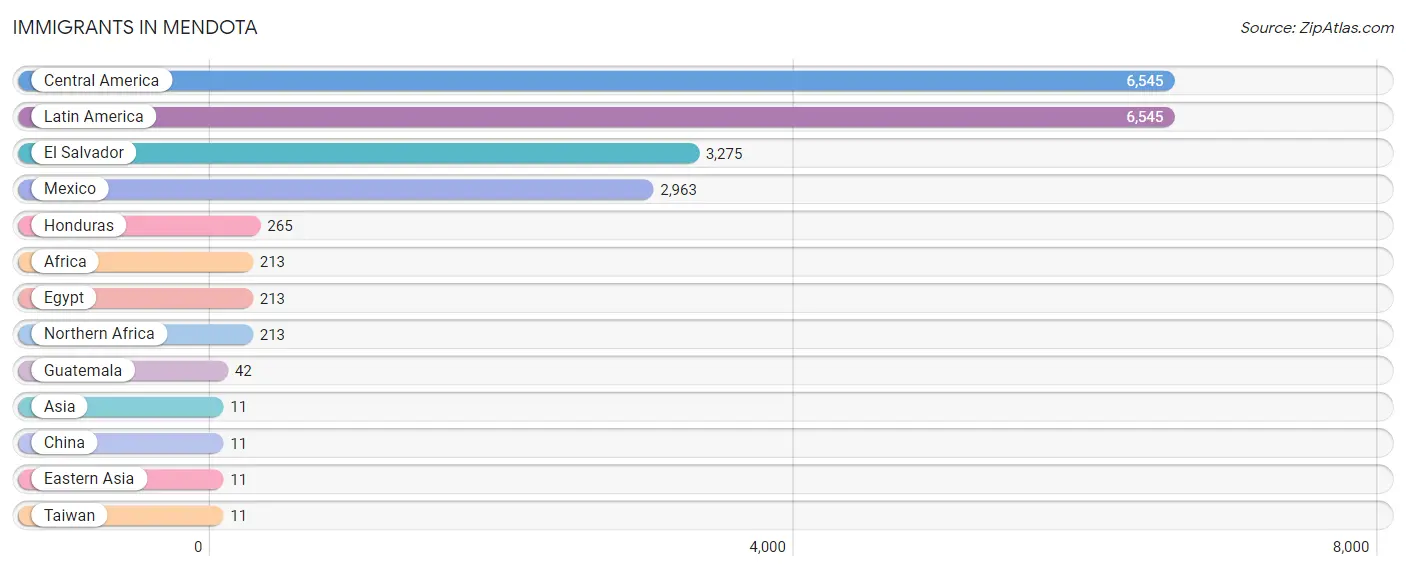
The most numerous immigrant groups reported in Mendota came from Central America (6,545 | 51.9%), Latin America (6,545 | 51.9%), El Salvador (3,275 | 26.0%), Mexico (2,963 | 23.5%), and Honduras (265 | 2.1%), together accounting for 155.5% of all Mendota residents.
| Immigration Origin | # Population | % Population |
| Africa | 213 | 1.7% |
| Asia | 11 | 0.1% |
| Central America | 6,545 | 51.9% |
| China | 11 | 0.1% |
| Eastern Asia | 11 | 0.1% |
| Egypt | 213 | 1.7% |
| El Salvador | 3,275 | 26.0% |
| Guatemala | 42 | 0.3% |
| Honduras | 265 | 2.1% |
| Latin America | 6,545 | 51.9% |
| Mexico | 2,963 | 23.5% |
| Northern Africa | 213 | 1.7% |
| Taiwan | 11 | 0.1% | View All 13 Rows |
Sex and Age in Mendota
Sex and Age in Mendota
The most populous age groups in Mendota are 5 to 9 Years (900 | 13.8%) for men and 10 to 14 Years (727 | 11.9%) for women.
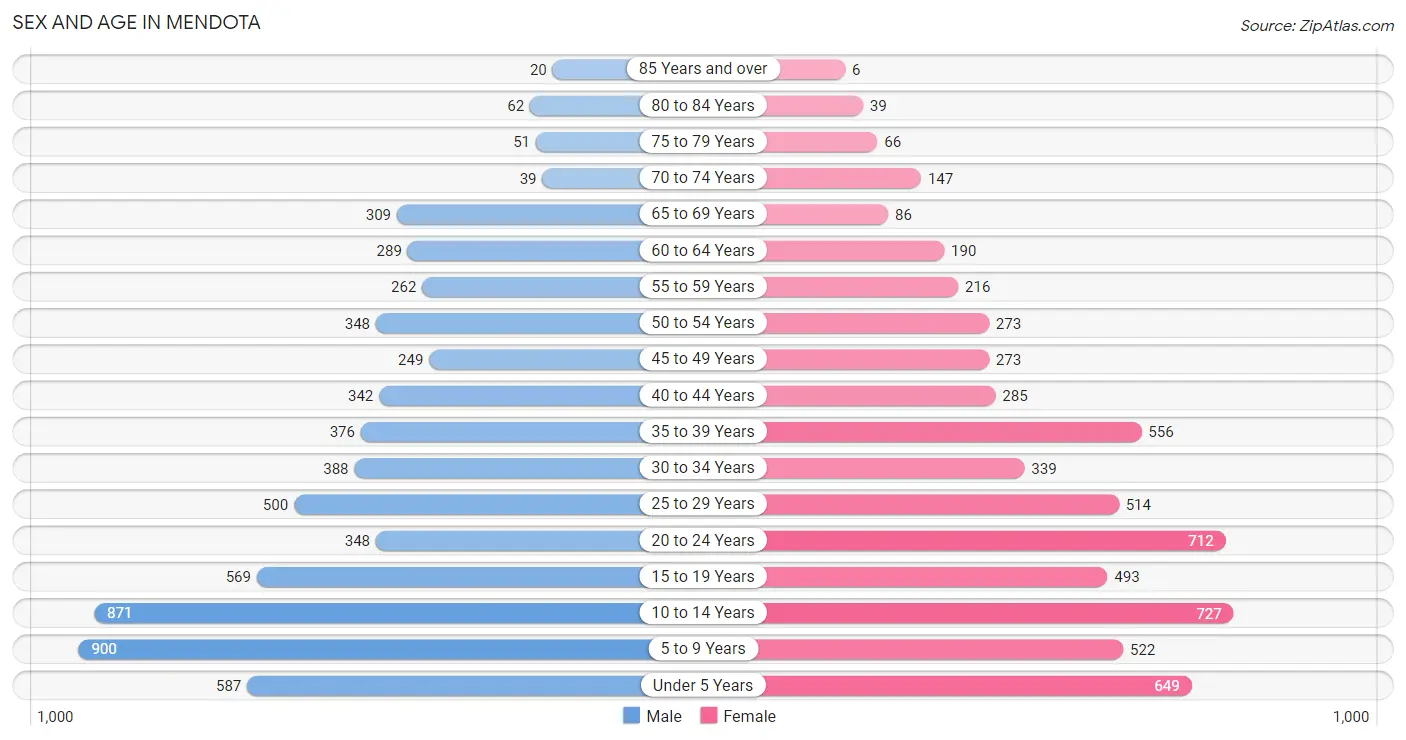
| Age Bracket | Male | Female |
| Under 5 Years | 587 (9.0%) | 649 (10.6%) |
| 5 to 9 Years | 900 (13.8%) | 522 (8.6%) |
| 10 to 14 Years | 871 (13.4%) | 727 (11.9%) |
| 15 to 19 Years | 569 (8.7%) | 493 (8.1%) |
| 20 to 24 Years | 348 (5.3%) | 712 (11.7%) |
| 25 to 29 Years | 500 (7.7%) | 514 (8.4%) |
| 30 to 34 Years | 388 (6.0%) | 339 (5.6%) |
| 35 to 39 Years | 376 (5.8%) | 556 (9.1%) |
| 40 to 44 Years | 342 (5.2%) | 285 (4.7%) |
| 45 to 49 Years | 249 (3.8%) | 273 (4.5%) |
| 50 to 54 Years | 348 (5.3%) | 273 (4.5%) |
| 55 to 59 Years | 262 (4.0%) | 216 (3.5%) |
| 60 to 64 Years | 289 (4.4%) | 190 (3.1%) |
| 65 to 69 Years | 309 (4.8%) | 86 (1.4%) |
| 70 to 74 Years | 39 (0.6%) | 147 (2.4%) |
| 75 to 79 Years | 51 (0.8%) | 66 (1.1%) |
| 80 to 84 Years | 62 (0.9%) | 39 (0.6%) |
| 85 Years and over | 20 (0.3%) | 6 (0.1%) |
| Total | 6,510 (100.0%) | 6,093 (100.0%) |
Families and Households in Mendota
Median Family Size in Mendota
The median family size in Mendota is 4.29 persons per family, with married-couple families (1,643 | 62.1%) accounting for the largest median family size of 4.73 persons per family. On the other hand, single male/father families (353 | 13.4%) represent the smallest median family size with 3.13 persons per family.
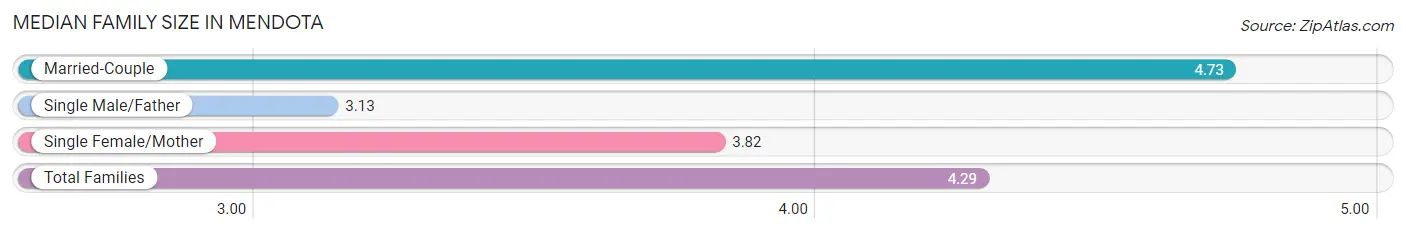
| Family Type | # Families | Family Size |
| Married-Couple | 1,643 (62.1%) | 4.73 |
| Single Male/Father | 353 (13.4%) | 3.13 |
| Single Female/Mother | 649 (24.5%) | 3.82 |
| Total Families | 2,645 (100.0%) | 4.29 |
Median Household Size in Mendota
The median household size in Mendota is 4.11 persons per household, with married-couple households (1,643 | 53.5%) accounting for the largest median household size of 4.79 persons per household. non-family households (423 | 13.8%) represent the smallest median household size with 1.39 persons per household.
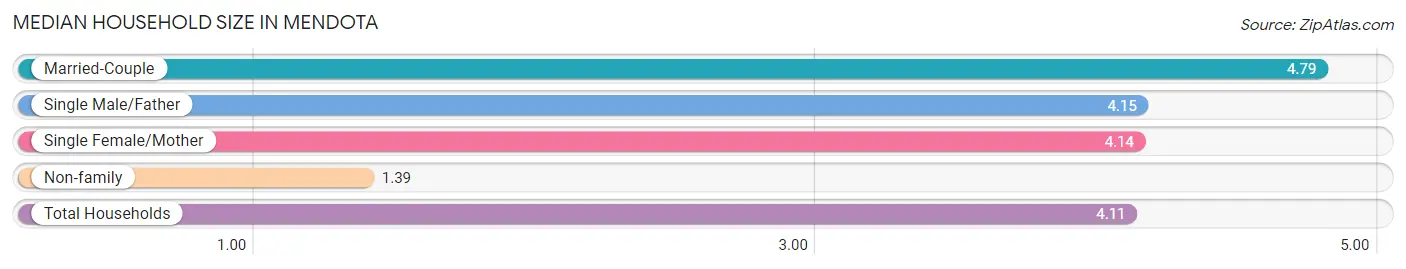
| Household Type | # Households | Household Size |
| Married-Couple | 1,643 (53.5%) | 4.79 |
| Single Male/Father | 353 (11.5%) | 4.15 |
| Single Female/Mother | 649 (21.1%) | 4.14 |
| Non-family | 423 (13.8%) | 1.39 |
| Total Households | 3,068 (100.0%) | 4.11 |
Household Size by Marriage Status in Mendota
Out of a total of 3,068 households in Mendota, 2,645 (86.2%) are family households, while 423 (13.8%) are nonfamily households. The most numerous type of family households are 4-person households, comprising 668, and the most common type of nonfamily households are 1-person households, comprising 278.
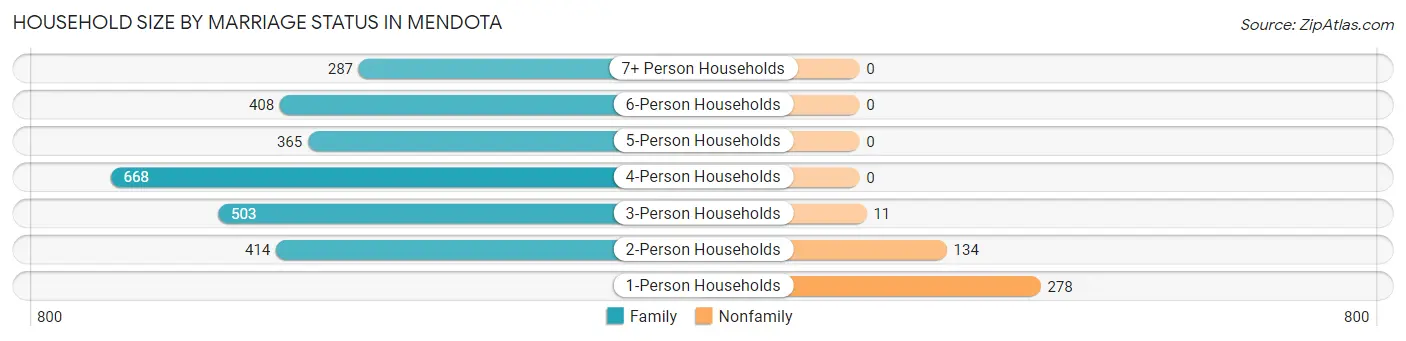
| Household Size | Family Households | Nonfamily Households |
| 1-Person Households | - | 278 (9.1%) |
| 2-Person Households | 414 (13.5%) | 134 (4.4%) |
| 3-Person Households | 503 (16.4%) | 11 (0.4%) |
| 4-Person Households | 668 (21.8%) | 0 (0.0%) |
| 5-Person Households | 365 (11.9%) | 0 (0.0%) |
| 6-Person Households | 408 (13.3%) | 0 (0.0%) |
| 7+ Person Households | 287 (9.3%) | 0 (0.0%) |
| Total | 2,645 (86.2%) | 423 (13.8%) |
Female Fertility in Mendota
Fertility by Age in Mendota
Average fertility rate in Mendota is 47.0 births per 1,000 women. Women in the age bracket of 35 to 50 years have the highest fertility rate with 76.0 births per 1,000 women. Women in the age bracket of 35 to 50 years acount for 58.4% of all women with births.
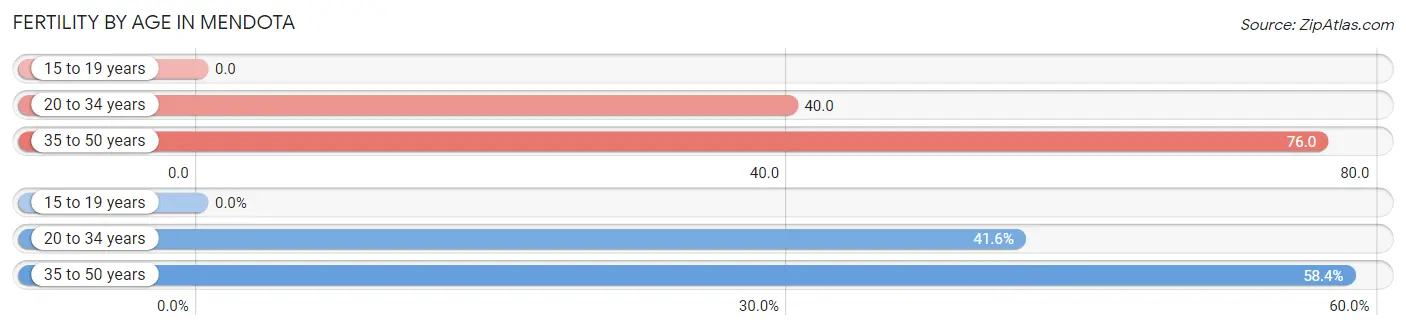
| Age Bracket | Women with Births | Births / 1,000 Women |
| 15 to 19 years | 0 (0.0%) | 0.0 |
| 20 to 34 years | 62 (41.6%) | 40.0 |
| 35 to 50 years | 87 (58.4%) | 76.0 |
| Total | 149 (100.0%) | 47.0 |
Fertility by Age by Marriage Status in Mendota
81.9% of women with births (149) in Mendota are married. The highest percentage of unmarried women with births falls into 35 to 50 years age bracket with 21.8% of them unmarried at the time of birth, while the lowest percentage of unmarried women with births belong to 20 to 34 years age bracket with 12.9% of them unmarried.
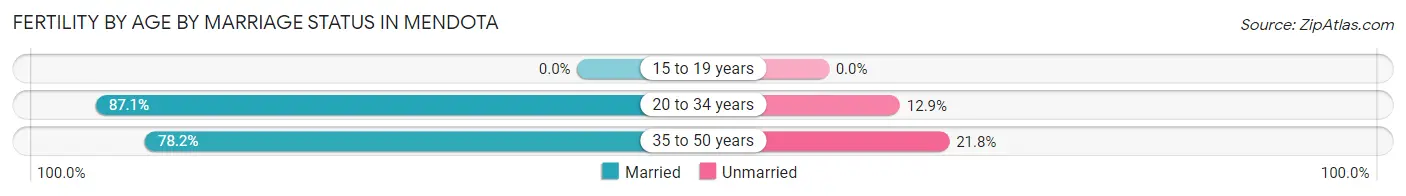
| Age Bracket | Married | Unmarried |
| 15 to 19 years | 0 (0.0%) | 0 (0.0%) |
| 20 to 34 years | 54 (87.1%) | 8 (12.9%) |
| 35 to 50 years | 68 (78.2%) | 19 (21.8%) |
| Total | 122 (81.9%) | 27 (18.1%) |
Fertility by Education in Mendota
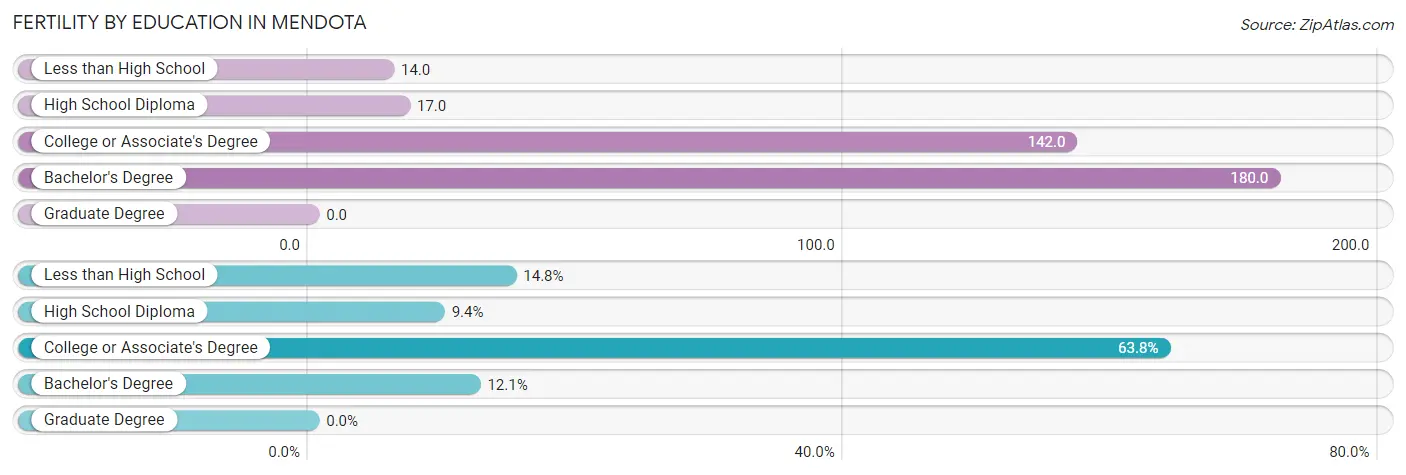
| Educational Attainment | Women with Births | Births / 1,000 Women |
| Less than High School | 22 (14.8%) | 14.0 |
| High School Diploma | 14 (9.4%) | 17.0 |
| College or Associate's Degree | 95 (63.8%) | 142.0 |
| Bachelor's Degree | 18 (12.1%) | 180.0 |
| Graduate Degree | 0 (0.0%) | 0.0 |
| Total | 149 (100.0%) | 47.0 |
Fertility by Education by Marriage Status in Mendota
18.1% of women with births in Mendota are unmarried. Women with the educational attainment of less than high school are most likely to be married with 100.0% of them married at childbirth, while women with the educational attainment of college or associate's degree are least likely to be married with 28.4% of them unmarried at childbirth.
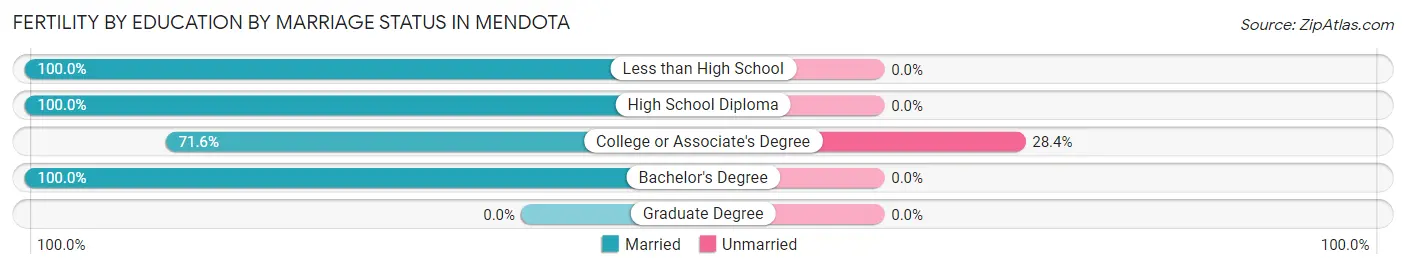
| Educational Attainment | Married | Unmarried |
| Less than High School | 22 (100.0%) | 0 (0.0%) |
| High School Diploma | 14 (100.0%) | 0 (0.0%) |
| College or Associate's Degree | 68 (71.6%) | 27 (28.4%) |
| Bachelor's Degree | 18 (100.0%) | 0 (0.0%) |
| Graduate Degree | 0 (0.0%) | 0 (0.0%) |
| Total | 122 (81.9%) | 27 (18.1%) |
Employment Characteristics in Mendota
Employment by Class of Employer in Mendota
Among the 3,833 employed individuals in Mendota, private company employees (3,497 | 91.2%), self-employed (not incorporated) (127 | 3.3%), and local government employees (78 | 2.0%) make up the most common classes of employment.
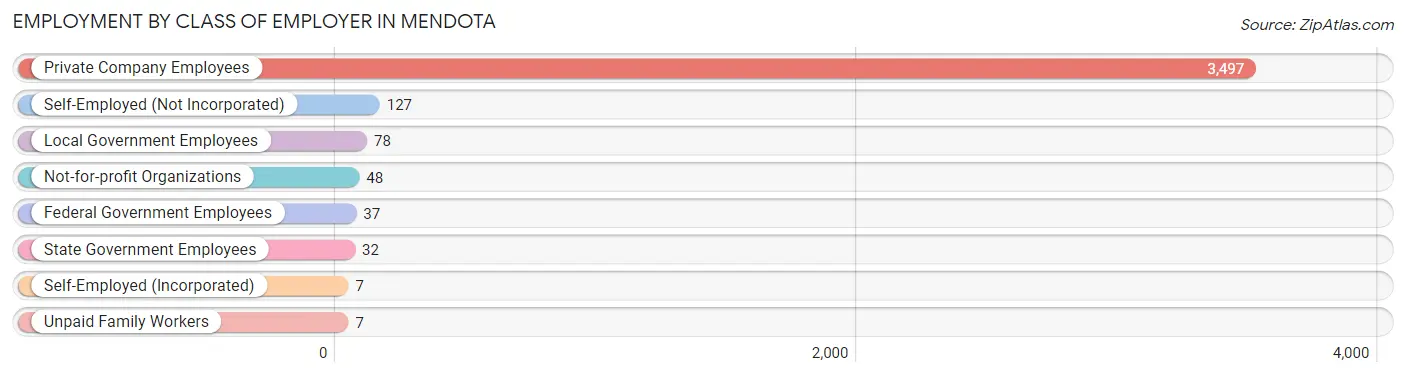
| Employer Class | # Employees | % Employees |
| Private Company Employees | 3,497 | 91.2% |
| Self-Employed (Incorporated) | 7 | 0.2% |
| Self-Employed (Not Incorporated) | 127 | 3.3% |
| Not-for-profit Organizations | 48 | 1.3% |
| Local Government Employees | 78 | 2.0% |
| State Government Employees | 32 | 0.8% |
| Federal Government Employees | 37 | 1.0% |
| Unpaid Family Workers | 7 | 0.2% |
| Total | 3,833 | 100.0% |
Employment Status by Age in Mendota
According to the labor force statistics for Mendota, out of the total population over 16 years of age (7,996), 63.5% or 5,077 individuals are in the labor force, with 11.4% or 579 of them unemployed. The age group with the highest labor force participation rate is 30 to 34 years, with 88.2% or 641 individuals in the labor force. Within the labor force, the 20 to 24 years age range has the highest percentage of unemployed individuals, with 25.0% or 195 of them being unemployed.
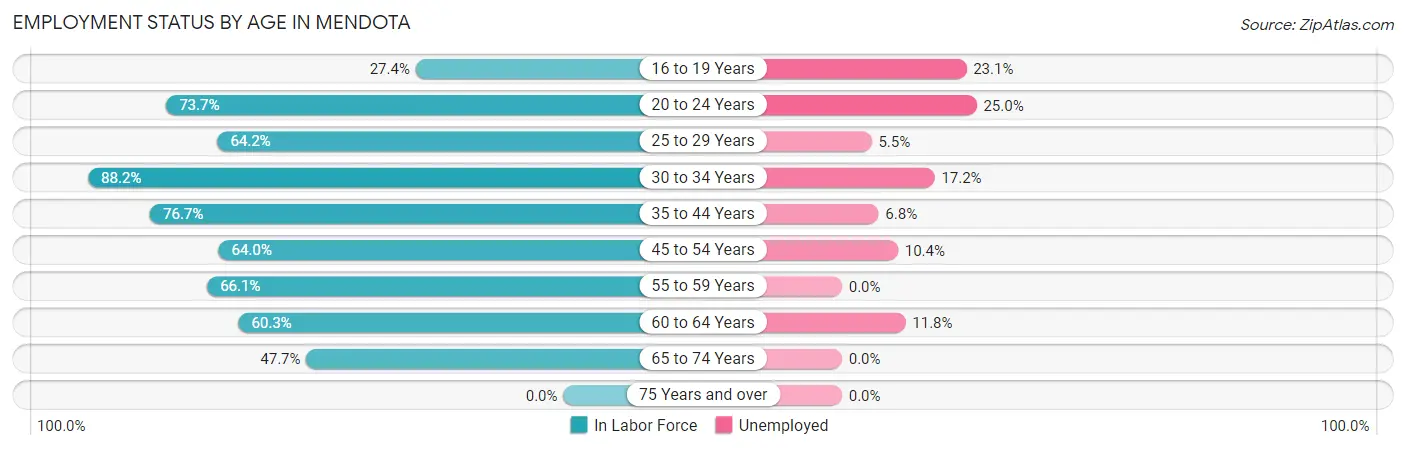
| Age Bracket | In Labor Force | Unemployed |
| 16 to 19 Years | 195 (27.4%) | 45 (23.1%) |
| 20 to 24 Years | 781 (73.7%) | 195 (25.0%) |
| 25 to 29 Years | 651 (64.2%) | 36 (5.5%) |
| 30 to 34 Years | 641 (88.2%) | 110 (17.2%) |
| 35 to 44 Years | 1,196 (76.7%) | 81 (6.8%) |
| 45 to 54 Years | 732 (64.0%) | 76 (10.4%) |
| 55 to 59 Years | 316 (66.1%) | 0 (0.0%) |
| 60 to 64 Years | 289 (60.3%) | 34 (11.8%) |
| 65 to 74 Years | 277 (47.7%) | 0 (0.0%) |
| 75 Years and over | 0 (0.0%) | 0 (0.0%) |
| Total | 5,077 (63.5%) | 579 (11.4%) |
Employment Status by Educational Attainment in Mendota
According to labor force statistics for Mendota, 70.8% of individuals (3,823) out of the total population between 25 and 64 years of age (5,400) are in the labor force, with 8.8% or 336 of them being unemployed. The group with the highest labor force participation rate are those with the educational attainment of college / associate degree, with 91.7% or 509 individuals in the labor force. Within the labor force, individuals with high school diploma education have the highest percentage of unemployment, with 10.0% or 86 of them being unemployed.
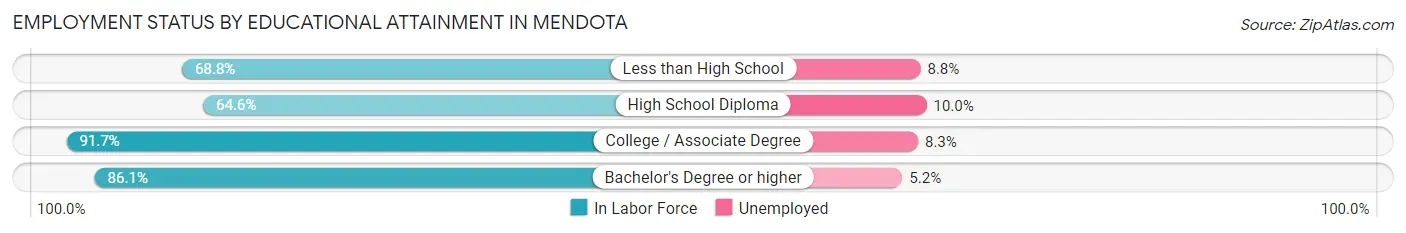
| Educational Attainment | In Labor Force | Unemployed |
| Less than High School | 2,263 (68.8%) | 289 (8.8%) |
| High School Diploma | 861 (64.6%) | 133 (10.0%) |
| College / Associate Degree | 509 (91.7%) | 46 (8.3%) |
| Bachelor's Degree or higher | 192 (86.1%) | 12 (5.2%) |
| Total | 3,823 (70.8%) | 475 (8.8%) |
Employment Occupations by Sex in Mendota
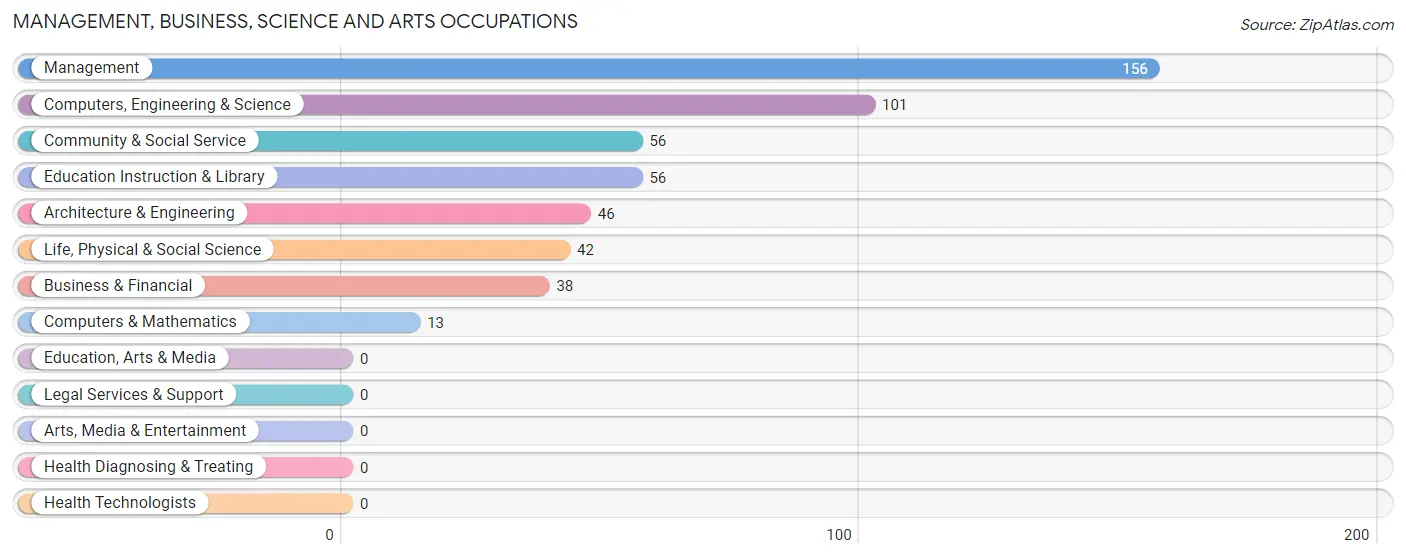
Management, Business, Science and Arts Occupations
The most common Management, Business, Science and Arts occupations in Mendota are Management (156 | 3.5%), Computers, Engineering & Science (101 | 2.2%), Community & Social Service (56 | 1.2%), Education Instruction & Library (56 | 1.2%), and Architecture & Engineering (46 | 1.0%).
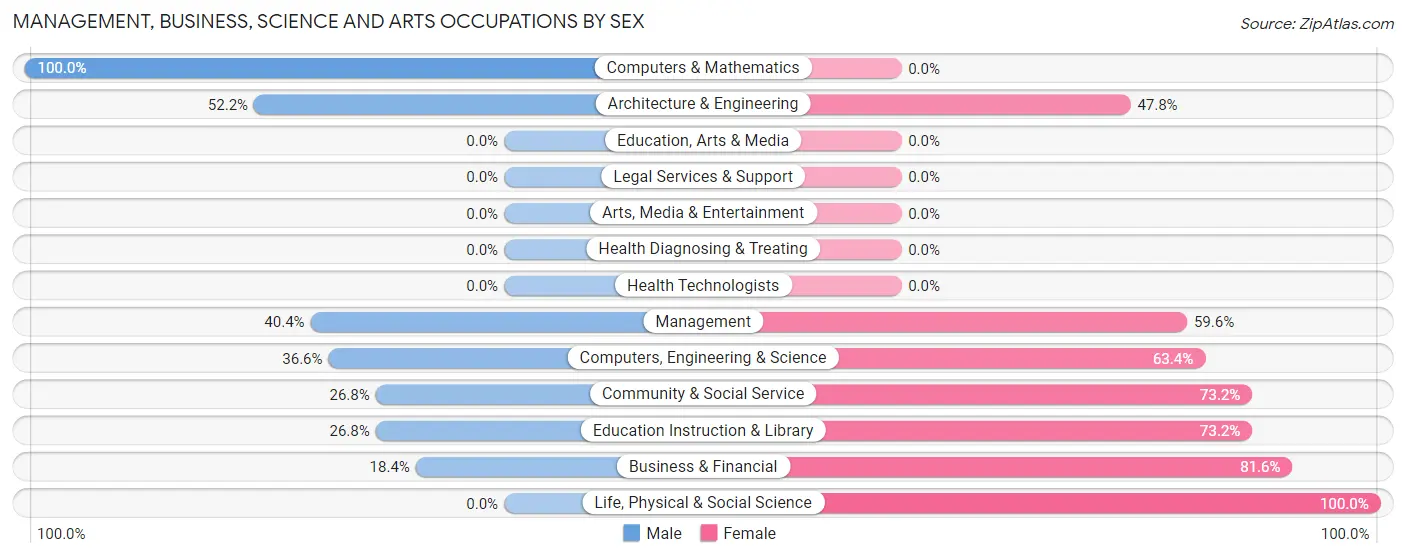
Management, Business, Science and Arts Occupations by Sex
Within the Management, Business, Science and Arts occupations in Mendota, the most male-oriented occupations are Computers & Mathematics (100.0%), Architecture & Engineering (52.2%), and Management (40.4%), while the most female-oriented occupations are Life, Physical & Social Science (100.0%), Business & Financial (81.6%), and Community & Social Service (73.2%).
| Occupation | Male | Female |
| Management | 63 (40.4%) | 93 (59.6%) |
| Business & Financial | 7 (18.4%) | 31 (81.6%) |
| Computers, Engineering & Science | 37 (36.6%) | 64 (63.4%) |
| Computers & Mathematics | 13 (100.0%) | 0 (0.0%) |
| Architecture & Engineering | 24 (52.2%) | 22 (47.8%) |
| Life, Physical & Social Science | 0 (0.0%) | 42 (100.0%) |
| Community & Social Service | 15 (26.8%) | 41 (73.2%) |
| Education, Arts & Media | 0 (0.0%) | 0 (0.0%) |
| Legal Services & Support | 0 (0.0%) | 0 (0.0%) |
| Education Instruction & Library | 15 (26.8%) | 41 (73.2%) |
| Arts, Media & Entertainment | 0 (0.0%) | 0 (0.0%) |
| Health Diagnosing & Treating | 0 (0.0%) | 0 (0.0%) |
| Health Technologists | 0 (0.0%) | 0 (0.0%) |
| Total (Category) | 122 (34.8%) | 229 (65.2%) |
| Total (Overall) | 2,578 (57.3%) | 1,922 (42.7%) |
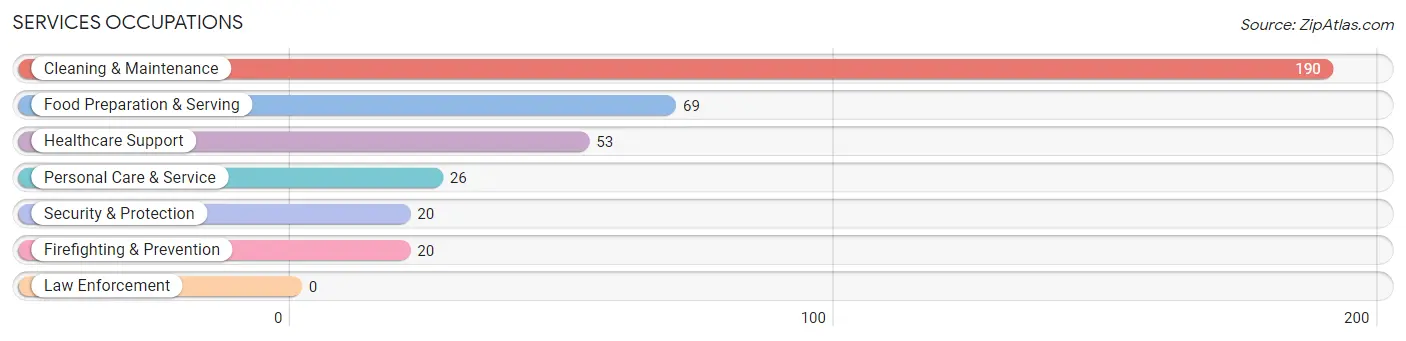
Services Occupations
The most common Services occupations in Mendota are Cleaning & Maintenance (190 | 4.2%), Food Preparation & Serving (69 | 1.5%), Healthcare Support (53 | 1.2%), Personal Care & Service (26 | 0.6%), and Security & Protection (20 | 0.4%).
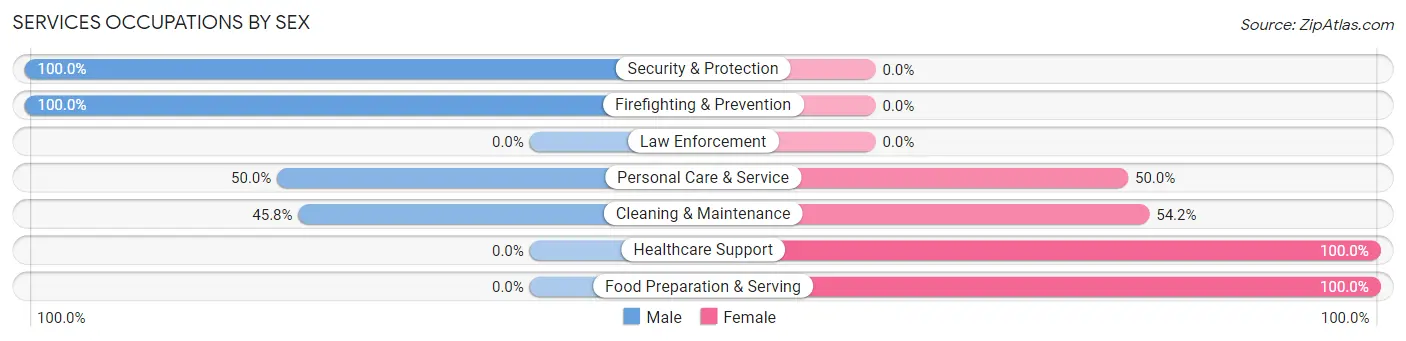
Services Occupations by Sex
Within the Services occupations in Mendota, the most male-oriented occupations are Security & Protection (100.0%), Firefighting & Prevention (100.0%), and Personal Care & Service (50.0%), while the most female-oriented occupations are Healthcare Support (100.0%), Food Preparation & Serving (100.0%), and Cleaning & Maintenance (54.2%).
| Occupation | Male | Female |
| Healthcare Support | 0 (0.0%) | 53 (100.0%) |
| Security & Protection | 20 (100.0%) | 0 (0.0%) |
| Firefighting & Prevention | 20 (100.0%) | 0 (0.0%) |
| Law Enforcement | 0 (0.0%) | 0 (0.0%) |
| Food Preparation & Serving | 0 (0.0%) | 69 (100.0%) |
| Cleaning & Maintenance | 87 (45.8%) | 103 (54.2%) |
| Personal Care & Service | 13 (50.0%) | 13 (50.0%) |
| Total (Category) | 120 (33.5%) | 238 (66.5%) |
| Total (Overall) | 2,578 (57.3%) | 1,922 (42.7%) |
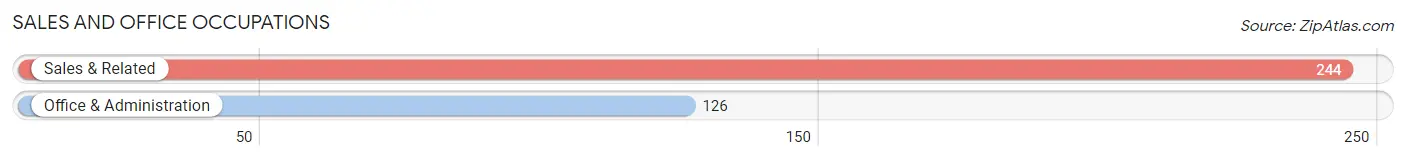
Sales and Office Occupations
The most common Sales and Office occupations in Mendota are Sales & Related (244 | 5.4%), and Office & Administration (126 | 2.8%).
Sales and Office Occupations by Sex
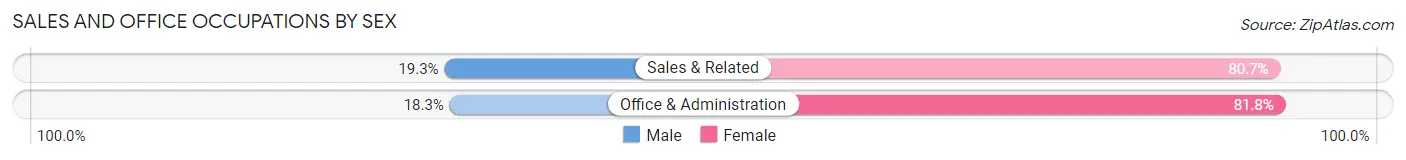
| Occupation | Male | Female |
| Sales & Related | 47 (19.3%) | 197 (80.7%) |
| Office & Administration | 23 (18.2%) | 103 (81.8%) |
| Total (Category) | 70 (18.9%) | 300 (81.1%) |
| Total (Overall) | 2,578 (57.3%) | 1,922 (42.7%) |
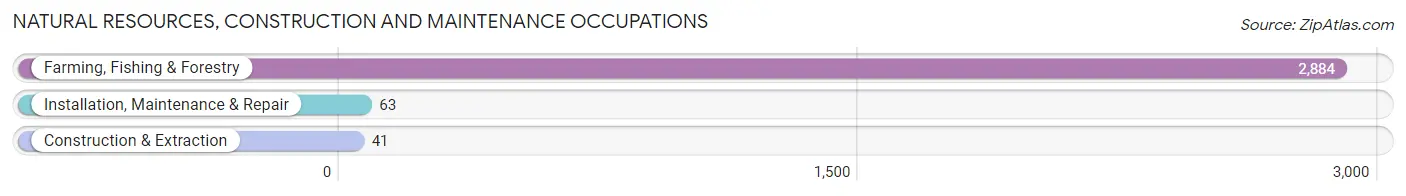
Natural Resources, Construction and Maintenance Occupations
The most common Natural Resources, Construction and Maintenance occupations in Mendota are Farming, Fishing & Forestry (2,884 | 64.1%), Installation, Maintenance & Repair (63 | 1.4%), and Construction & Extraction (41 | 0.9%).
Natural Resources, Construction and Maintenance Occupations by Sex
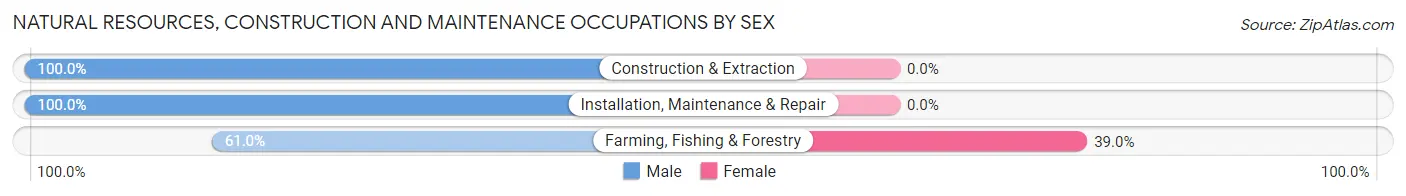
| Occupation | Male | Female |
| Farming, Fishing & Forestry | 1,760 (61.0%) | 1,124 (39.0%) |
| Construction & Extraction | 41 (100.0%) | 0 (0.0%) |
| Installation, Maintenance & Repair | 63 (100.0%) | 0 (0.0%) |
| Total (Category) | 1,864 (62.4%) | 1,124 (37.6%) |
| Total (Overall) | 2,578 (57.3%) | 1,922 (42.7%) |
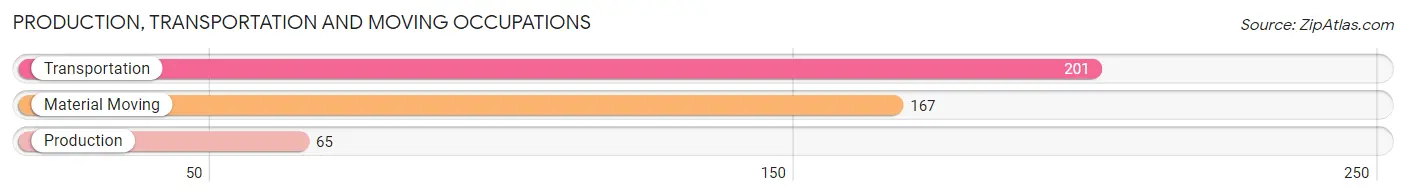
Production, Transportation and Moving Occupations
The most common Production, Transportation and Moving occupations in Mendota are Transportation (201 | 4.5%), Material Moving (167 | 3.7%), and Production (65 | 1.4%).
Production, Transportation and Moving Occupations by Sex
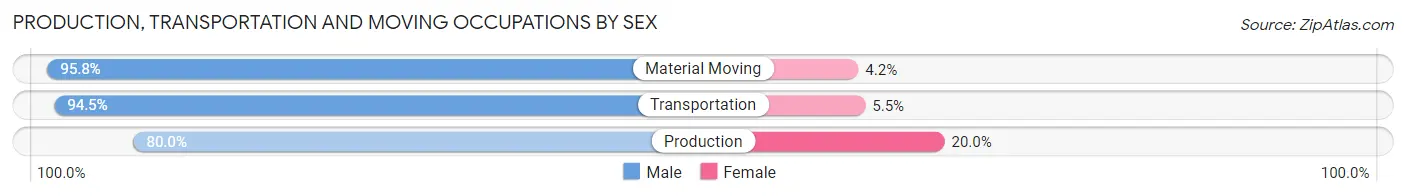
| Occupation | Male | Female |
| Production | 52 (80.0%) | 13 (20.0%) |
| Transportation | 190 (94.5%) | 11 (5.5%) |
| Material Moving | 160 (95.8%) | 7 (4.2%) |
| Total (Category) | 402 (92.8%) | 31 (7.2%) |
| Total (Overall) | 2,578 (57.3%) | 1,922 (42.7%) |
Employment Industries by Sex in Mendota
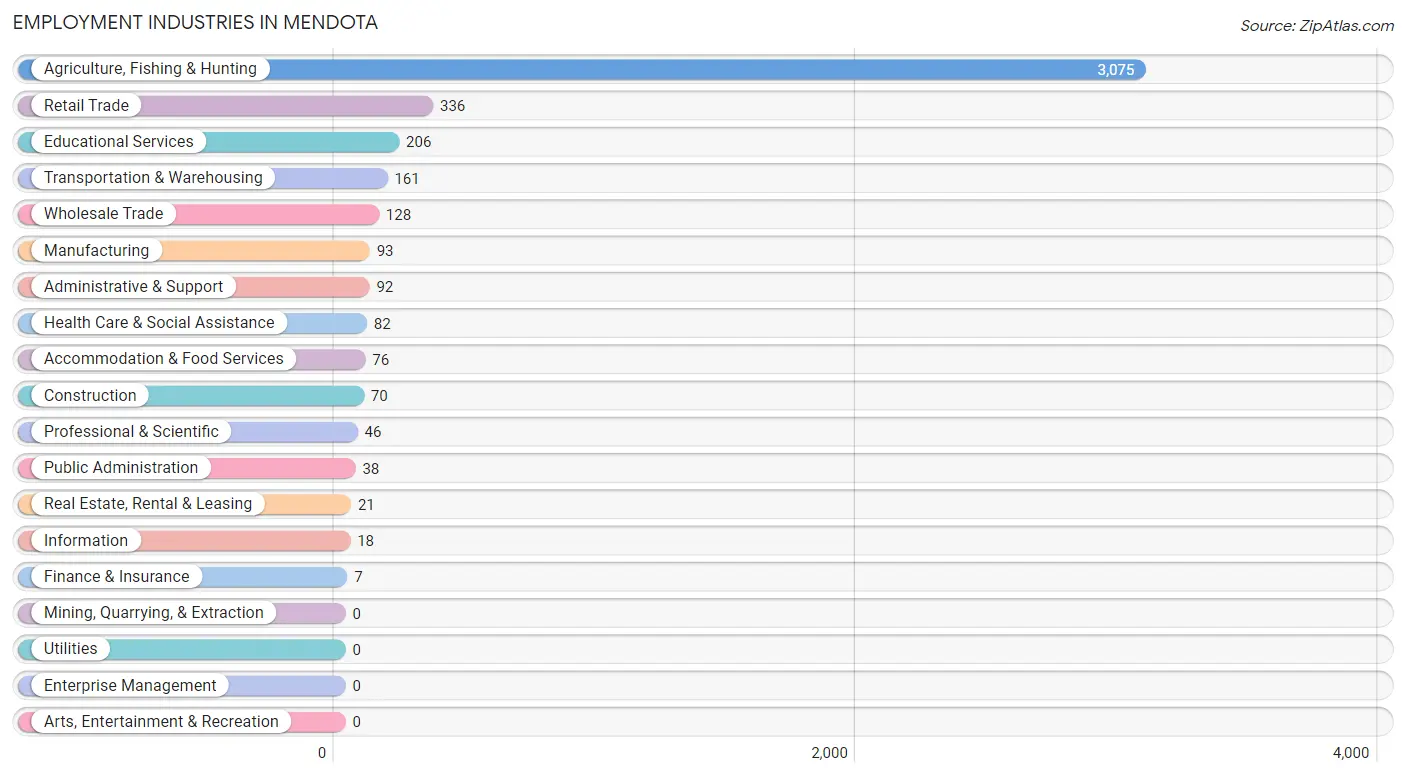
Employment Industries in Mendota
The major employment industries in Mendota include Agriculture, Fishing & Hunting (3,075 | 68.3%), Retail Trade (336 | 7.5%), Educational Services (206 | 4.6%), Transportation & Warehousing (161 | 3.6%), and Wholesale Trade (128 | 2.8%).
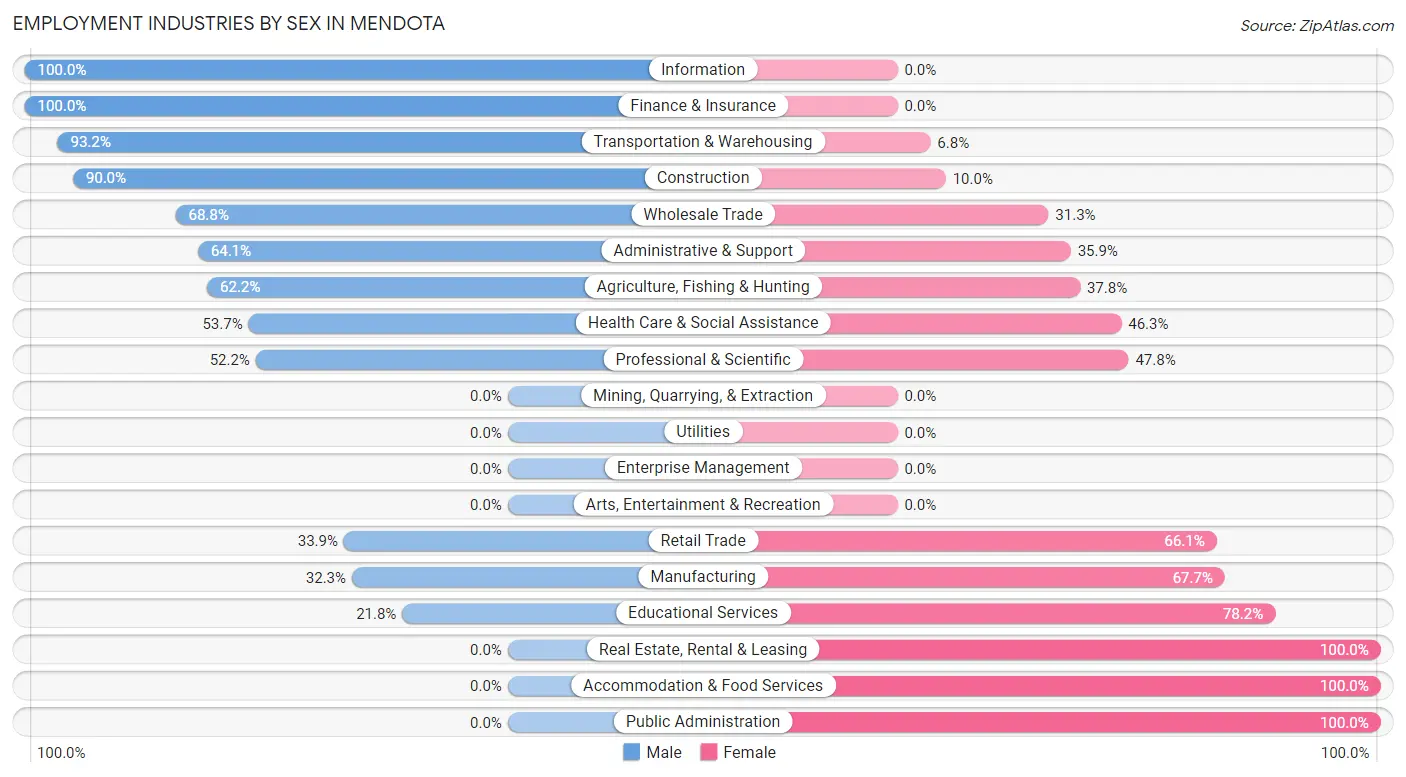
Employment Industries by Sex in Mendota
The Mendota industries that see more men than women are Information (100.0%), Finance & Insurance (100.0%), and Transportation & Warehousing (93.2%), whereas the industries that tend to have a higher number of women are Real Estate, Rental & Leasing (100.0%), Accommodation & Food Services (100.0%), and Public Administration (100.0%).
| Industry | Male | Female |
| Agriculture, Fishing & Hunting | 1,913 (62.2%) | 1,162 (37.8%) |
| Mining, Quarrying, & Extraction | 0 (0.0%) | 0 (0.0%) |
| Construction | 63 (90.0%) | 7 (10.0%) |
| Manufacturing | 30 (32.3%) | 63 (67.7%) |
| Wholesale Trade | 88 (68.8%) | 40 (31.2%) |
| Retail Trade | 114 (33.9%) | 222 (66.1%) |
| Transportation & Warehousing | 150 (93.2%) | 11 (6.8%) |
| Utilities | 0 (0.0%) | 0 (0.0%) |
| Information | 18 (100.0%) | 0 (0.0%) |
| Finance & Insurance | 7 (100.0%) | 0 (0.0%) |
| Real Estate, Rental & Leasing | 0 (0.0%) | 21 (100.0%) |
| Professional & Scientific | 24 (52.2%) | 22 (47.8%) |
| Enterprise Management | 0 (0.0%) | 0 (0.0%) |
| Administrative & Support | 59 (64.1%) | 33 (35.9%) |
| Educational Services | 45 (21.8%) | 161 (78.2%) |
| Health Care & Social Assistance | 44 (53.7%) | 38 (46.3%) |
| Arts, Entertainment & Recreation | 0 (0.0%) | 0 (0.0%) |
| Accommodation & Food Services | 0 (0.0%) | 76 (100.0%) |
| Public Administration | 0 (0.0%) | 38 (100.0%) |
| Total | 2,578 (57.3%) | 1,922 (42.7%) |
Education in Mendota
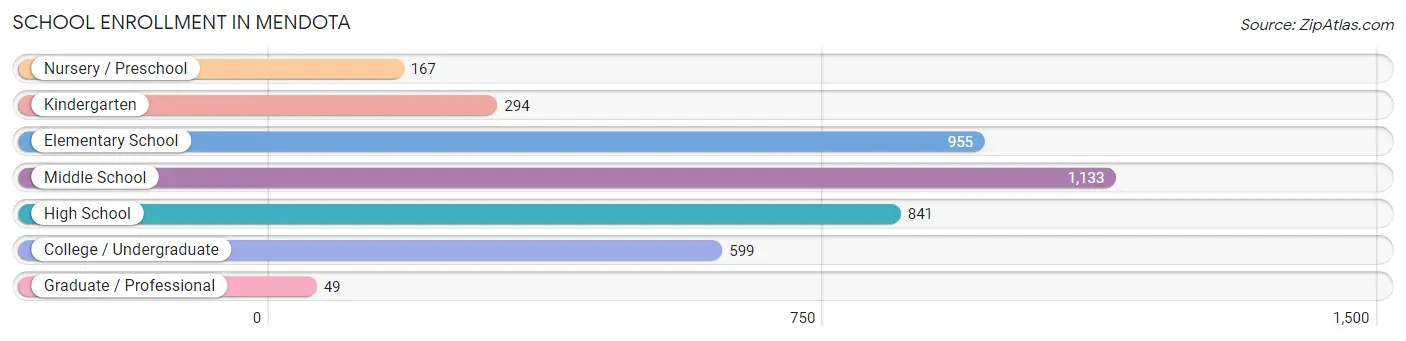
School Enrollment in Mendota
The most common levels of schooling among the 4,038 students in Mendota are middle school (1,133 | 28.1%), elementary school (955 | 23.6%), and high school (841 | 20.8%).
| School Level | # Students | % Students |
| Nursery / Preschool | 167 | 4.1% |
| Kindergarten | 294 | 7.3% |
| Elementary School | 955 | 23.6% |
| Middle School | 1,133 | 28.1% |
| High School | 841 | 20.8% |
| College / Undergraduate | 599 | 14.8% |
| Graduate / Professional | 49 | 1.2% |
| Total | 4,038 | 100.0% |
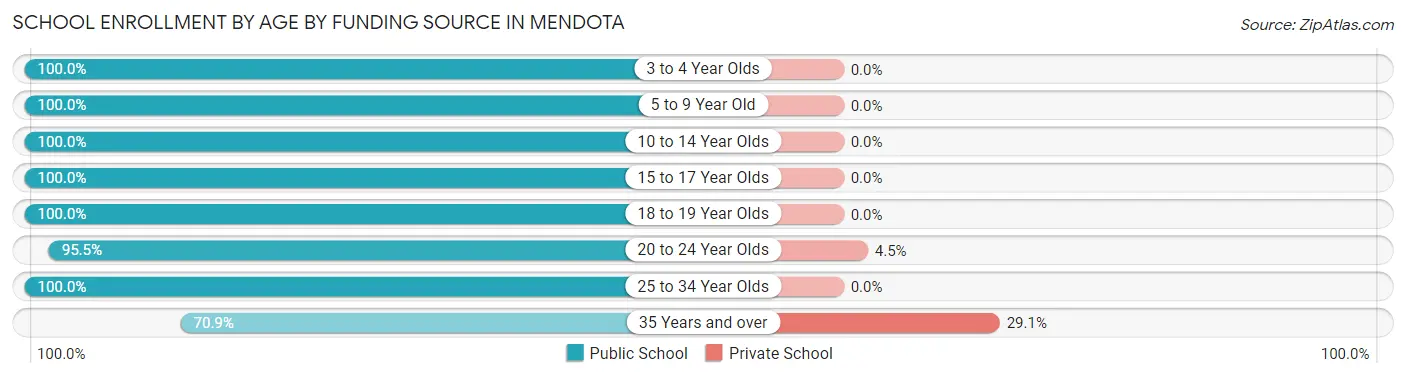
School Enrollment by Age by Funding Source in Mendota
Out of a total of 4,038 students who are enrolled in schools in Mendota, 36 (0.9%) attend a private institution, while the remaining 4,002 (99.1%) are enrolled in public schools. The age group of 35 years and over has the highest likelihood of being enrolled in private schools, with 25 (29.1% in the age bracket) enrolled. Conversely, the age group of 3 to 4 year olds has the lowest likelihood of being enrolled in a private school, with 123 (100.0% in the age bracket) attending a public institution.
| Age Bracket | Public School | Private School |
| 3 to 4 Year Olds | 123 (100.0%) | 0 (0.0%) |
| 5 to 9 Year Old | 1,189 (100.0%) | 0 (0.0%) |
| 10 to 14 Year Olds | 1,424 (100.0%) | 0 (0.0%) |
| 15 to 17 Year Olds | 548 (100.0%) | 0 (0.0%) |
| 18 to 19 Year Olds | 271 (100.0%) | 0 (0.0%) |
| 20 to 24 Year Olds | 275 (95.5%) | 13 (4.5%) |
| 25 to 34 Year Olds | 109 (100.0%) | 0 (0.0%) |
| 35 Years and over | 61 (70.9%) | 25 (29.1%) |
| Total | 4,002 (99.1%) | 36 (0.9%) |
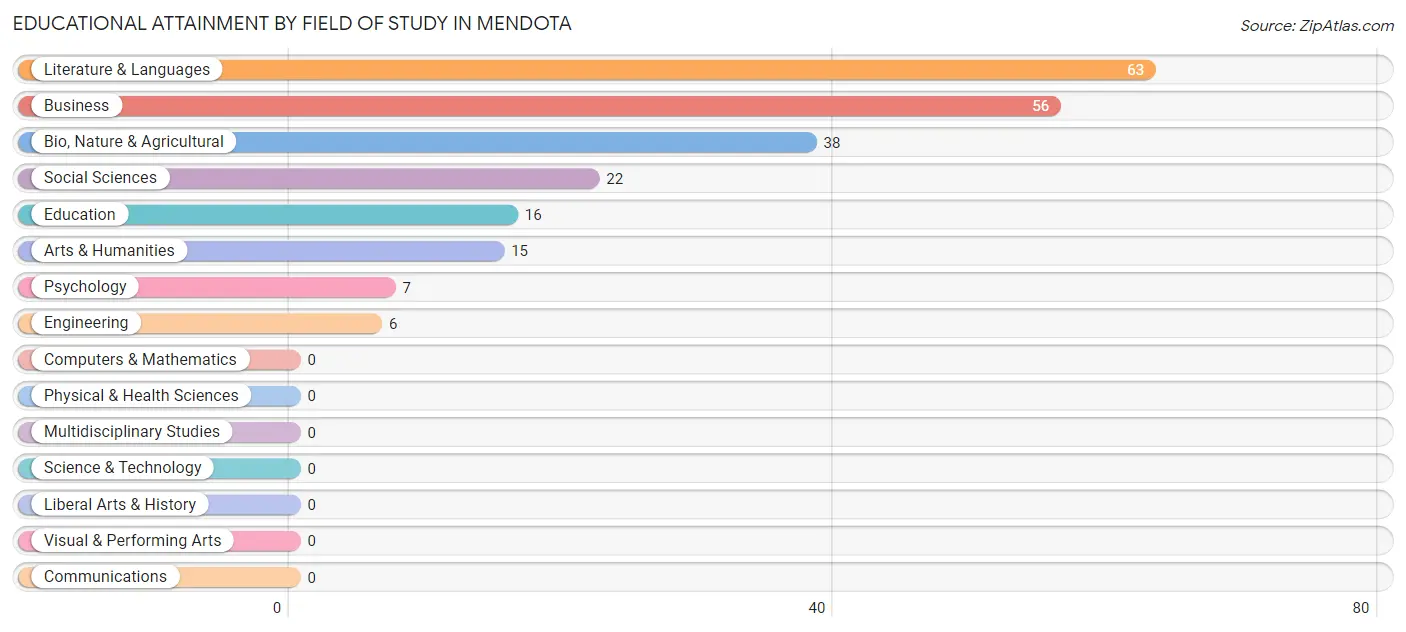
Educational Attainment by Field of Study in Mendota
Literature & languages (63 | 28.2%), business (56 | 25.1%), bio, nature & agricultural (38 | 17.0%), social sciences (22 | 9.9%), and education (16 | 7.2%) are the most common fields of study among 223 individuals in Mendota who have obtained a bachelor's degree or higher.
| Field of Study | # Graduates | % Graduates |
| Computers & Mathematics | 0 | 0.0% |
| Bio, Nature & Agricultural | 38 | 17.0% |
| Physical & Health Sciences | 0 | 0.0% |
| Psychology | 7 | 3.1% |
| Social Sciences | 22 | 9.9% |
| Engineering | 6 | 2.7% |
| Multidisciplinary Studies | 0 | 0.0% |
| Science & Technology | 0 | 0.0% |
| Business | 56 | 25.1% |
| Education | 16 | 7.2% |
| Literature & Languages | 63 | 28.2% |
| Liberal Arts & History | 0 | 0.0% |
| Visual & Performing Arts | 0 | 0.0% |
| Communications | 0 | 0.0% |
| Arts & Humanities | 15 | 6.7% |
| Total | 223 | 100.0% |
Transportation & Commute in Mendota
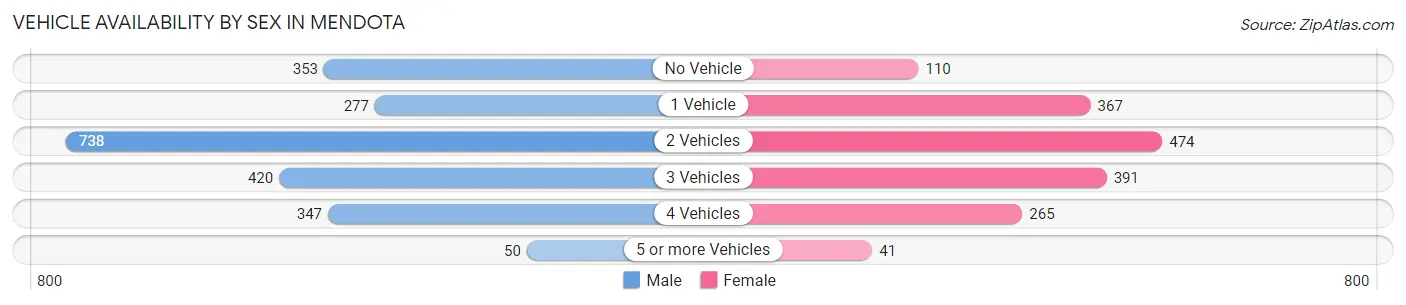
Vehicle Availability by Sex in Mendota
The most prevalent vehicle ownership categories in Mendota are males with 2 vehicles (738, accounting for 33.8%) and females with 2 vehicles (474, making up 44.8%).
| Vehicles Available | Male | Female |
| No Vehicle | 353 (16.2%) | 110 (6.7%) |
| 1 Vehicle | 277 (12.7%) | 367 (22.3%) |
| 2 Vehicles | 738 (33.8%) | 474 (28.8%) |
| 3 Vehicles | 420 (19.2%) | 391 (23.7%) |
| 4 Vehicles | 347 (15.9%) | 265 (16.1%) |
| 5 or more Vehicles | 50 (2.3%) | 41 (2.5%) |
| Total | 2,185 (100.0%) | 1,648 (100.0%) |
Commute Time in Mendota
The most frequently occuring commute durations in Mendota are 30 to 34 minutes (722 commuters, 19.0%), 60 to 89 minutes (509 commuters, 13.4%), and 20 to 24 minutes (457 commuters, 12.0%).
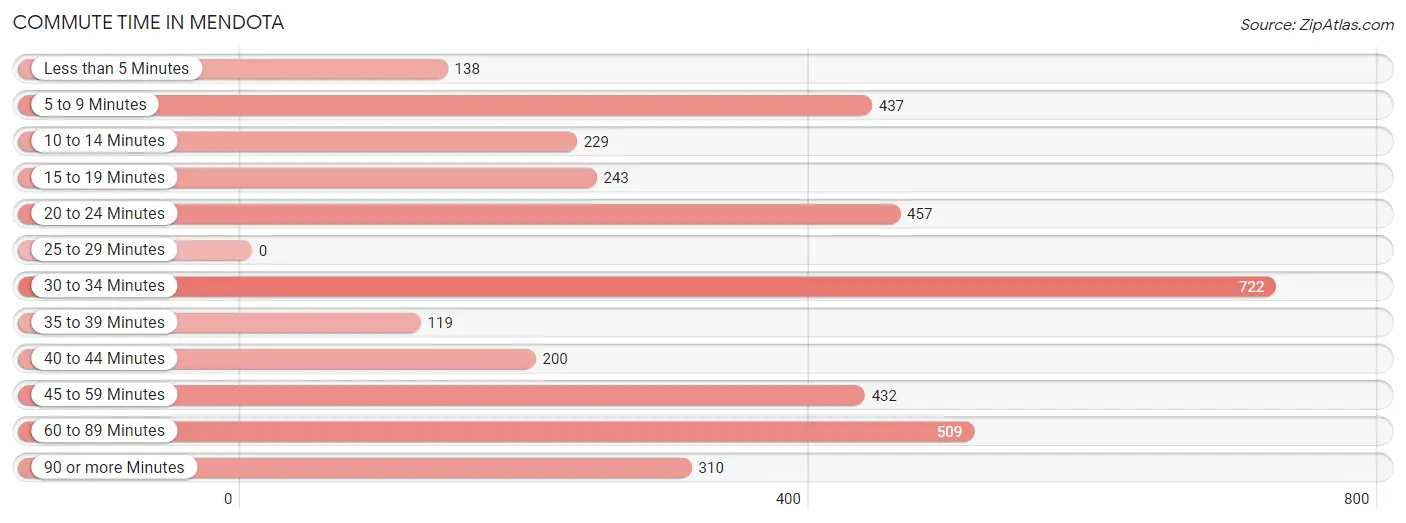
| Commute Time | # Commuters | % Commuters |
| Less than 5 Minutes | 138 | 3.6% |
| 5 to 9 Minutes | 437 | 11.5% |
| 10 to 14 Minutes | 229 | 6.0% |
| 15 to 19 Minutes | 243 | 6.4% |
| 20 to 24 Minutes | 457 | 12.0% |
| 25 to 29 Minutes | 0 | 0.0% |
| 30 to 34 Minutes | 722 | 19.0% |
| 35 to 39 Minutes | 119 | 3.1% |
| 40 to 44 Minutes | 200 | 5.3% |
| 45 to 59 Minutes | 432 | 11.4% |
| 60 to 89 Minutes | 509 | 13.4% |
| 90 or more Minutes | 310 | 8.2% |
Commute Time by Sex in Mendota
The most common commute times in Mendota are 30 to 34 minutes (454 commuters, 21.0%) for males and 30 to 34 minutes (268 commuters, 16.4%) for females.
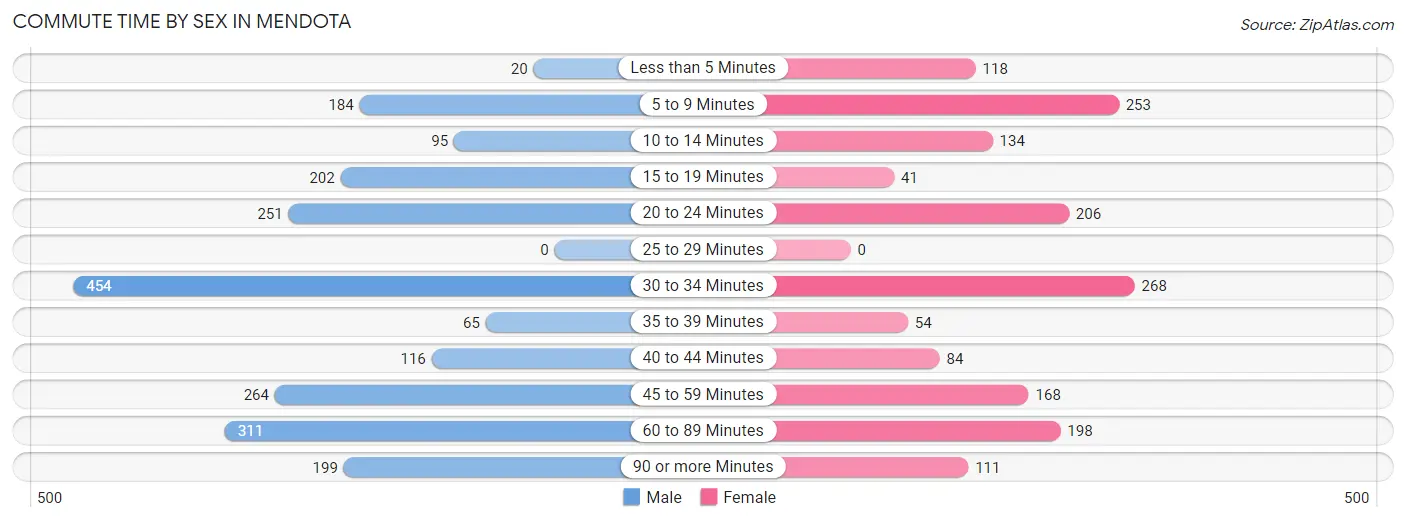
| Commute Time | Male | Female |
| Less than 5 Minutes | 20 (0.9%) | 118 (7.2%) |
| 5 to 9 Minutes | 184 (8.5%) | 253 (15.5%) |
| 10 to 14 Minutes | 95 (4.4%) | 134 (8.2%) |
| 15 to 19 Minutes | 202 (9.3%) | 41 (2.5%) |
| 20 to 24 Minutes | 251 (11.6%) | 206 (12.6%) |
| 25 to 29 Minutes | 0 (0.0%) | 0 (0.0%) |
| 30 to 34 Minutes | 454 (21.0%) | 268 (16.4%) |
| 35 to 39 Minutes | 65 (3.0%) | 54 (3.3%) |
| 40 to 44 Minutes | 116 (5.4%) | 84 (5.1%) |
| 45 to 59 Minutes | 264 (12.2%) | 168 (10.3%) |
| 60 to 89 Minutes | 311 (14.4%) | 198 (12.1%) |
| 90 or more Minutes | 199 (9.2%) | 111 (6.8%) |
Time of Departure to Work by Sex in Mendota
The most frequent times of departure to work in Mendota are 6:00 AM to 6:29 AM (491, 22.7%) for males and 12:00 AM to 4:59 AM (375, 22.9%) for females.
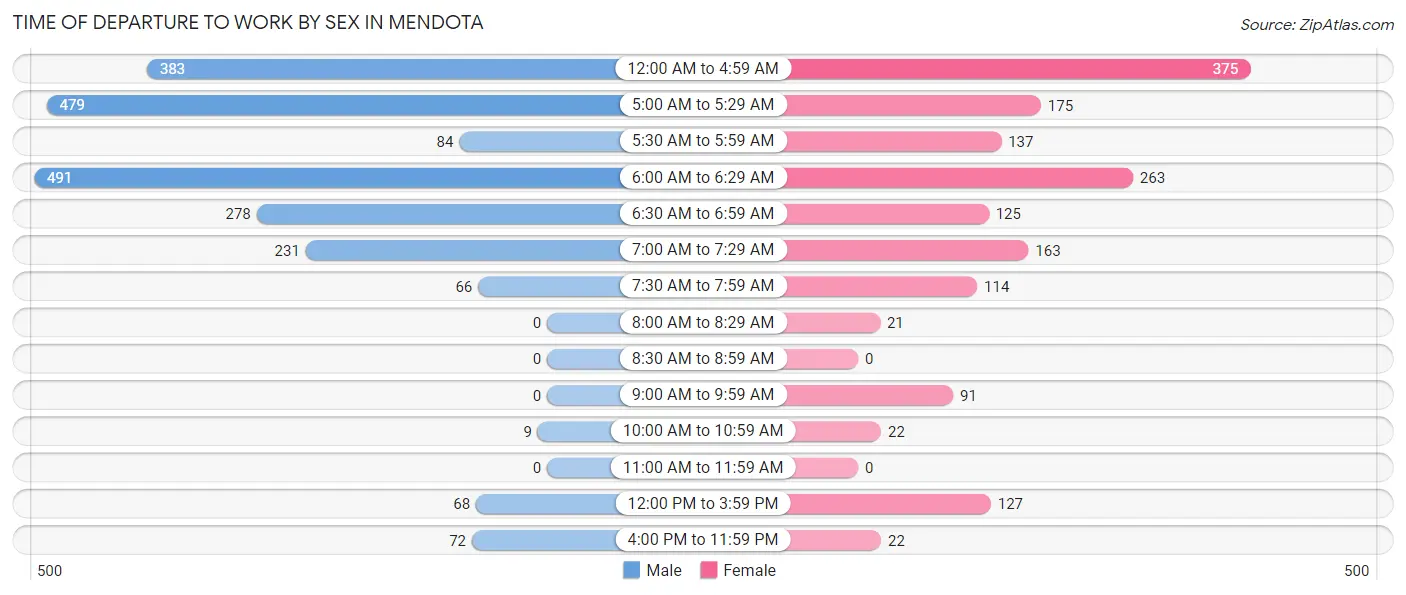
| Time of Departure | Male | Female |
| 12:00 AM to 4:59 AM | 383 (17.7%) | 375 (22.9%) |
| 5:00 AM to 5:29 AM | 479 (22.2%) | 175 (10.7%) |
| 5:30 AM to 5:59 AM | 84 (3.9%) | 137 (8.4%) |
| 6:00 AM to 6:29 AM | 491 (22.7%) | 263 (16.1%) |
| 6:30 AM to 6:59 AM | 278 (12.9%) | 125 (7.6%) |
| 7:00 AM to 7:29 AM | 231 (10.7%) | 163 (10.0%) |
| 7:30 AM to 7:59 AM | 66 (3.0%) | 114 (7.0%) |
| 8:00 AM to 8:29 AM | 0 (0.0%) | 21 (1.3%) |
| 8:30 AM to 8:59 AM | 0 (0.0%) | 0 (0.0%) |
| 9:00 AM to 9:59 AM | 0 (0.0%) | 91 (5.6%) |
| 10:00 AM to 10:59 AM | 9 (0.4%) | 22 (1.3%) |
| 11:00 AM to 11:59 AM | 0 (0.0%) | 0 (0.0%) |
| 12:00 PM to 3:59 PM | 68 (3.2%) | 127 (7.8%) |
| 4:00 PM to 11:59 PM | 72 (3.3%) | 22 (1.3%) |
| Total | 2,161 (100.0%) | 1,635 (100.0%) |
Housing Occupancy in Mendota
Occupancy by Ownership in Mendota
Of the total 3,068 dwellings in Mendota, owner-occupied units account for 1,399 (45.6%), while renter-occupied units make up 1,669 (54.4%).
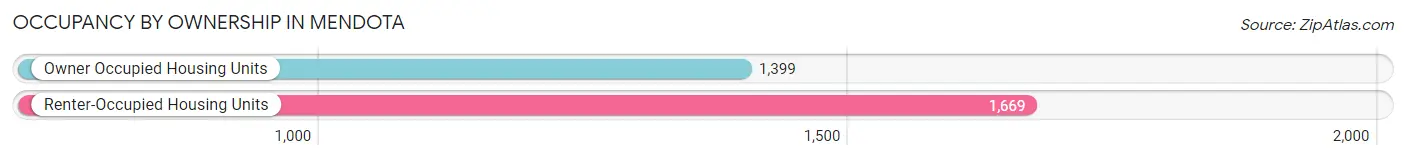
| Occupancy | # Housing Units | % Housing Units |
| Owner Occupied Housing Units | 1,399 | 45.6% |
| Renter-Occupied Housing Units | 1,669 | 54.4% |
| Total Occupied Housing Units | 3,068 | 100.0% |
Occupancy by Household Size in Mendota
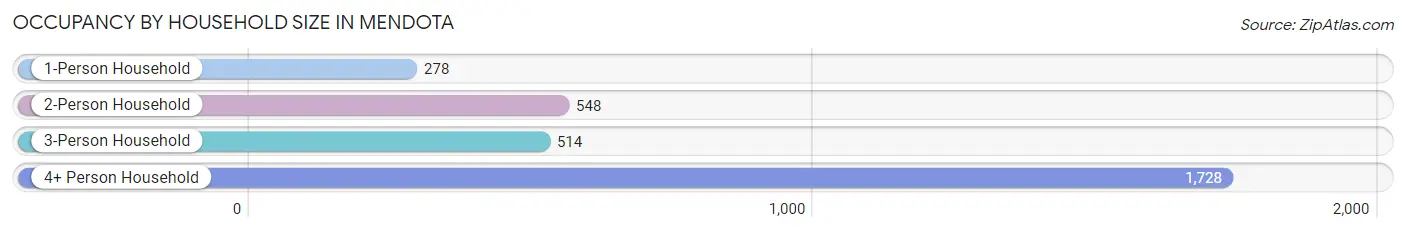
| Household Size | # Housing Units | % Housing Units |
| 1-Person Household | 278 | 9.1% |
| 2-Person Household | 548 | 17.9% |
| 3-Person Household | 514 | 16.8% |
| 4+ Person Household | 1,728 | 56.3% |
| Total Housing Units | 3,068 | 100.0% |
Occupancy by Ownership by Household Size in Mendota
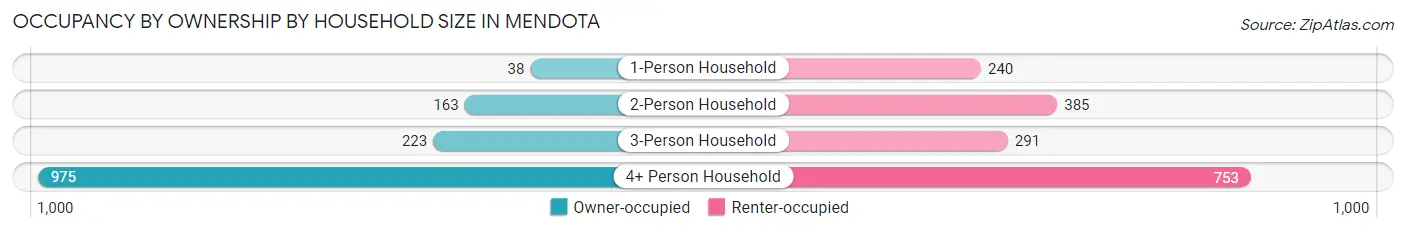
| Household Size | Owner-occupied | Renter-occupied |
| 1-Person Household | 38 (13.7%) | 240 (86.3%) |
| 2-Person Household | 163 (29.7%) | 385 (70.3%) |
| 3-Person Household | 223 (43.4%) | 291 (56.6%) |
| 4+ Person Household | 975 (56.4%) | 753 (43.6%) |
| Total Housing Units | 1,399 (45.6%) | 1,669 (54.4%) |
Occupancy by Educational Attainment in Mendota
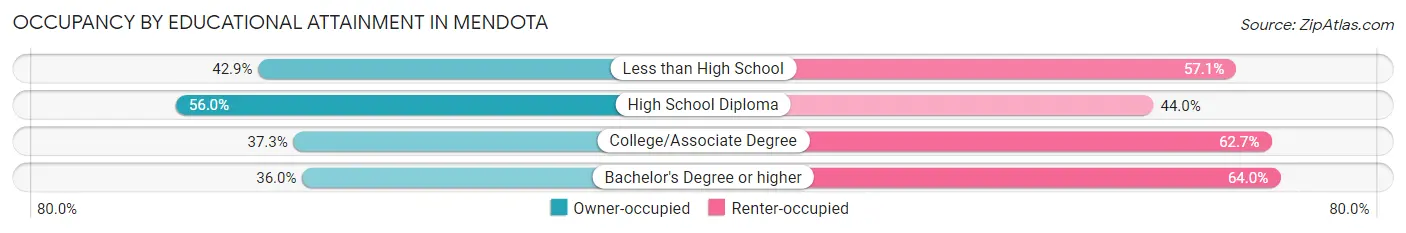
| Household Size | Owner-occupied | Renter-occupied |
| Less than High School | 796 (42.9%) | 1,058 (57.1%) |
| High School Diploma | 453 (56.0%) | 356 (44.0%) |
| College/Associate Degree | 118 (37.3%) | 198 (62.7%) |
| Bachelor's Degree or higher | 32 (36.0%) | 57 (64.0%) |
Occupancy by Age of Householder in Mendota
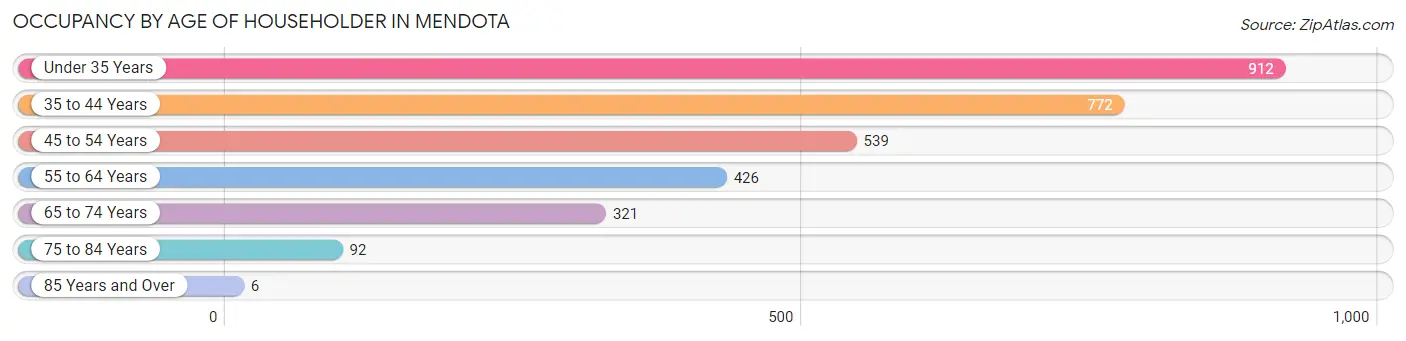
| Age Bracket | # Households | % Households |
| Under 35 Years | 912 | 29.7% |
| 35 to 44 Years | 772 | 25.2% |
| 45 to 54 Years | 539 | 17.6% |
| 55 to 64 Years | 426 | 13.9% |
| 65 to 74 Years | 321 | 10.5% |
| 75 to 84 Years | 92 | 3.0% |
| 85 Years and Over | 6 | 0.2% |
| Total | 3,068 | 100.0% |
Housing Finances in Mendota
Median Income by Occupancy in Mendota
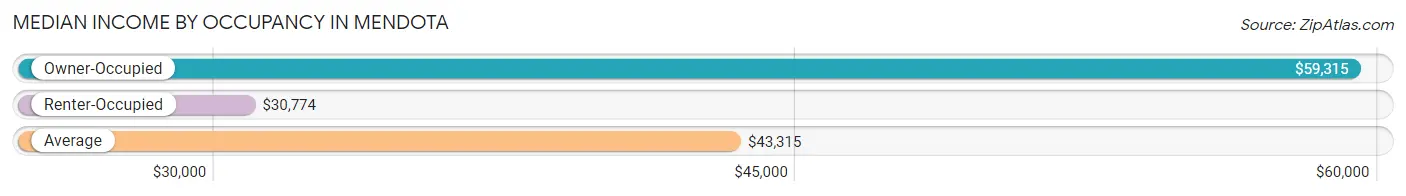
| Occupancy Type | # Households | Median Income |
| Owner-Occupied | 1,399 (45.6%) | $59,315 |
| Renter-Occupied | 1,669 (54.4%) | $30,774 |
| Average | 3,068 (100.0%) | $43,315 |
Occupancy by Householder Income Bracket in Mendota
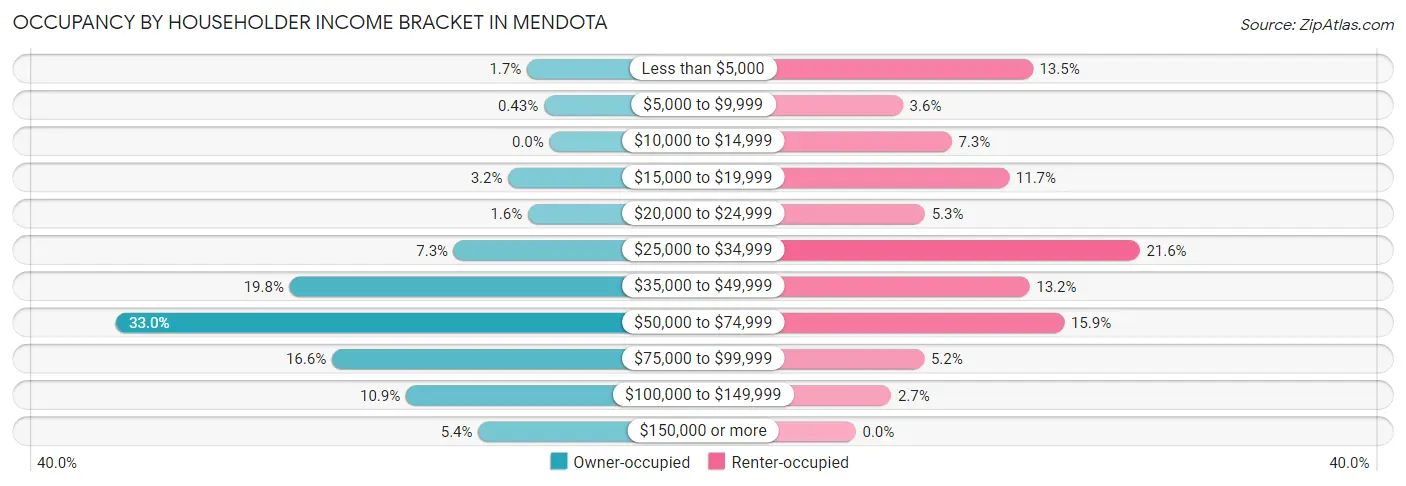
| Income Bracket | Owner-occupied | Renter-occupied |
| Less than $5,000 | 24 (1.7%) | 225 (13.5%) |
| $5,000 to $9,999 | 6 (0.4%) | 60 (3.6%) |
| $10,000 to $14,999 | 0 (0.0%) | 122 (7.3%) |
| $15,000 to $19,999 | 44 (3.2%) | 195 (11.7%) |
| $20,000 to $24,999 | 23 (1.6%) | 88 (5.3%) |
| $25,000 to $34,999 | 102 (7.3%) | 361 (21.6%) |
| $35,000 to $49,999 | 277 (19.8%) | 221 (13.2%) |
| $50,000 to $74,999 | 462 (33.0%) | 265 (15.9%) |
| $75,000 to $99,999 | 232 (16.6%) | 87 (5.2%) |
| $100,000 to $149,999 | 153 (10.9%) | 45 (2.7%) |
| $150,000 or more | 76 (5.4%) | 0 (0.0%) |
| Total | 1,399 (100.0%) | 1,669 (100.0%) |
Monthly Housing Cost Tiers in Mendota
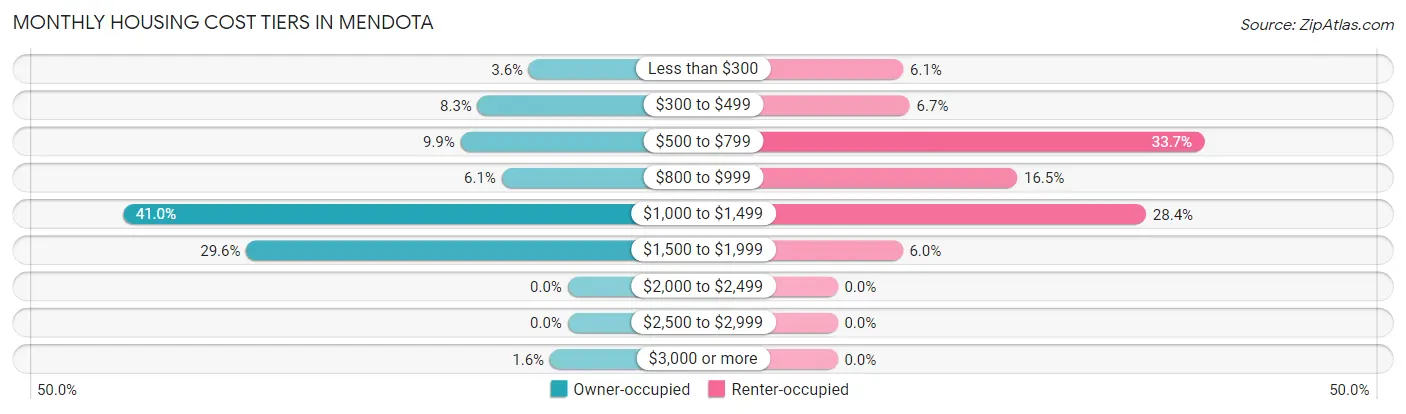
| Monthly Cost | Owner-occupied | Renter-occupied |
| Less than $300 | 50 (3.6%) | 101 (6.0%) |
| $300 to $499 | 116 (8.3%) | 111 (6.7%) |
| $500 to $799 | 138 (9.9%) | 563 (33.7%) |
| $800 to $999 | 85 (6.1%) | 276 (16.5%) |
| $1,000 to $1,499 | 573 (41.0%) | 474 (28.4%) |
| $1,500 to $1,999 | 414 (29.6%) | 100 (6.0%) |
| $2,000 to $2,499 | 0 (0.0%) | 0 (0.0%) |
| $2,500 to $2,999 | 0 (0.0%) | 0 (0.0%) |
| $3,000 or more | 23 (1.6%) | 0 (0.0%) |
| Total | 1,399 (100.0%) | 1,669 (100.0%) |
Physical Housing Characteristics in Mendota
Housing Structures in Mendota
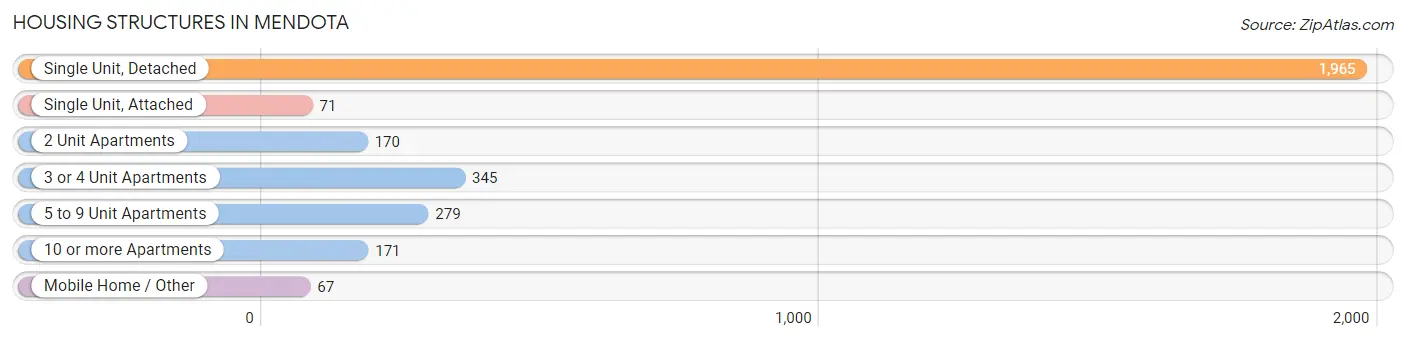
| Structure Type | # Housing Units | % Housing Units |
| Single Unit, Detached | 1,965 | 64.0% |
| Single Unit, Attached | 71 | 2.3% |
| 2 Unit Apartments | 170 | 5.5% |
| 3 or 4 Unit Apartments | 345 | 11.3% |
| 5 to 9 Unit Apartments | 279 | 9.1% |
| 10 or more Apartments | 171 | 5.6% |
| Mobile Home / Other | 67 | 2.2% |
| Total | 3,068 | 100.0% |
Housing Structures by Occupancy in Mendota
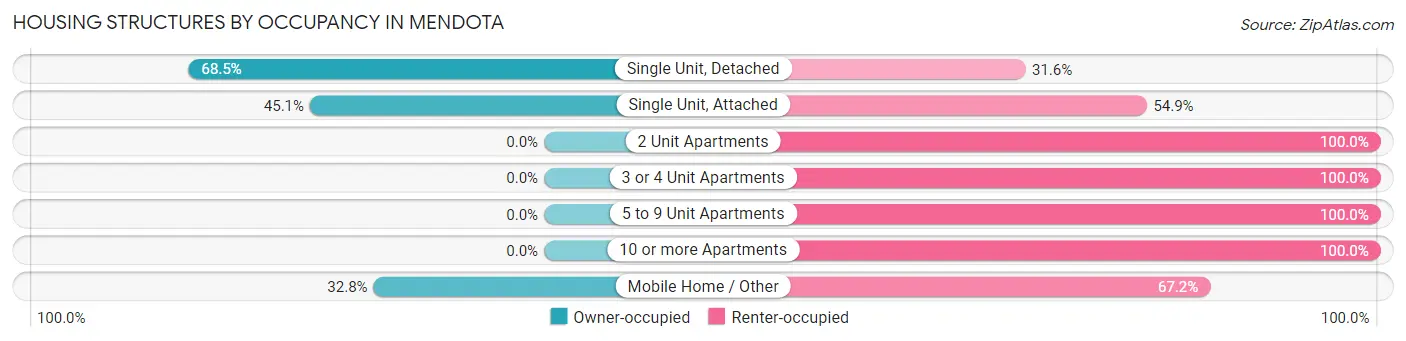
| Structure Type | Owner-occupied | Renter-occupied |
| Single Unit, Detached | 1,345 (68.4%) | 620 (31.6%) |
| Single Unit, Attached | 32 (45.1%) | 39 (54.9%) |
| 2 Unit Apartments | 0 (0.0%) | 170 (100.0%) |
| 3 or 4 Unit Apartments | 0 (0.0%) | 345 (100.0%) |
| 5 to 9 Unit Apartments | 0 (0.0%) | 279 (100.0%) |
| 10 or more Apartments | 0 (0.0%) | 171 (100.0%) |
| Mobile Home / Other | 22 (32.8%) | 45 (67.2%) |
| Total | 1,399 (45.6%) | 1,669 (54.4%) |
Housing Structures by Number of Rooms in Mendota
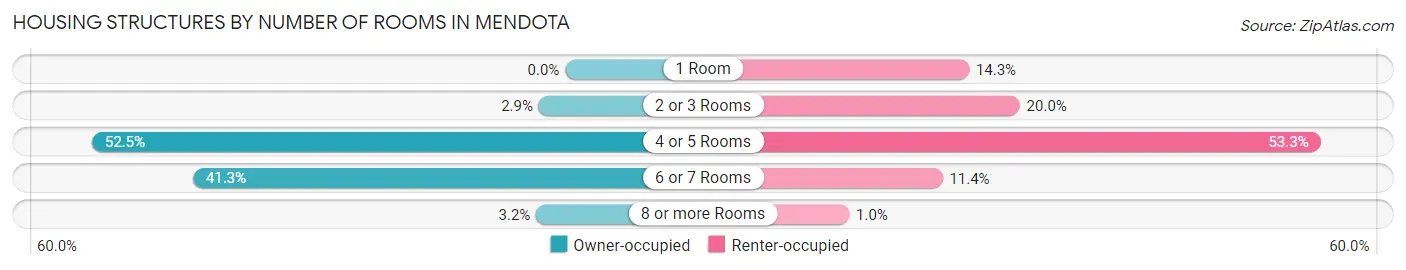
| Number of Rooms | Owner-occupied | Renter-occupied |
| 1 Room | 0 (0.0%) | 239 (14.3%) |
| 2 or 3 Rooms | 41 (2.9%) | 333 (20.0%) |
| 4 or 5 Rooms | 735 (52.5%) | 890 (53.3%) |
| 6 or 7 Rooms | 578 (41.3%) | 190 (11.4%) |
| 8 or more Rooms | 45 (3.2%) | 17 (1.0%) |
| Total | 1,399 (100.0%) | 1,669 (100.0%) |
Housing Structure by Heating Type in Mendota
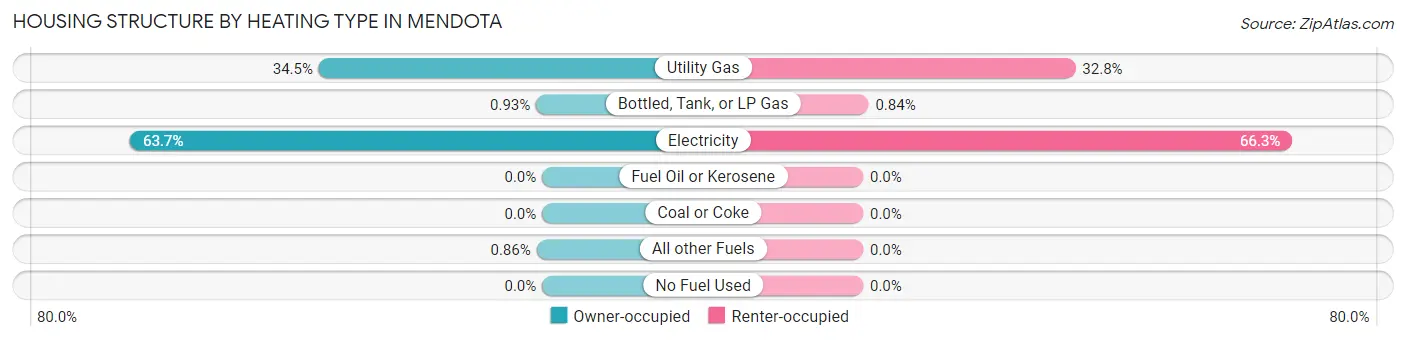
| Heating Type | Owner-occupied | Renter-occupied |
| Utility Gas | 483 (34.5%) | 548 (32.8%) |
| Bottled, Tank, or LP Gas | 13 (0.9%) | 14 (0.8%) |
| Electricity | 891 (63.7%) | 1,107 (66.3%) |
| Fuel Oil or Kerosene | 0 (0.0%) | 0 (0.0%) |
| Coal or Coke | 0 (0.0%) | 0 (0.0%) |
| All other Fuels | 12 (0.9%) | 0 (0.0%) |
| No Fuel Used | 0 (0.0%) | 0 (0.0%) |
| Total | 1,399 (100.0%) | 1,669 (100.0%) |
Household Vehicle Usage in Mendota
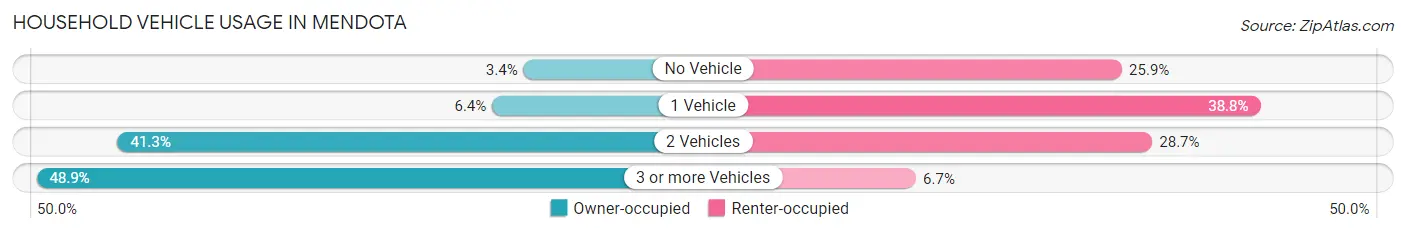
| Vehicles per Household | Owner-occupied | Renter-occupied |
| No Vehicle | 48 (3.4%) | 432 (25.9%) |
| 1 Vehicle | 89 (6.4%) | 647 (38.8%) |
| 2 Vehicles | 578 (41.3%) | 479 (28.7%) |
| 3 or more Vehicles | 684 (48.9%) | 111 (6.7%) |
| Total | 1,399 (100.0%) | 1,669 (100.0%) |
Real Estate & Mortgages in Mendota
Real Estate and Mortgage Overview in Mendota
| Characteristic | Without Mortgage | With Mortgage |
| Housing Units | 280 | 1,119 |
| Median Property Value | $207,900 | $240,400 |
| Median Household Income | $65,750 | $69 |
| Monthly Housing Costs | $456 | $23 |
| Real Estate Taxes | $1,021 | $15 |
Property Value by Mortgage Status in Mendota
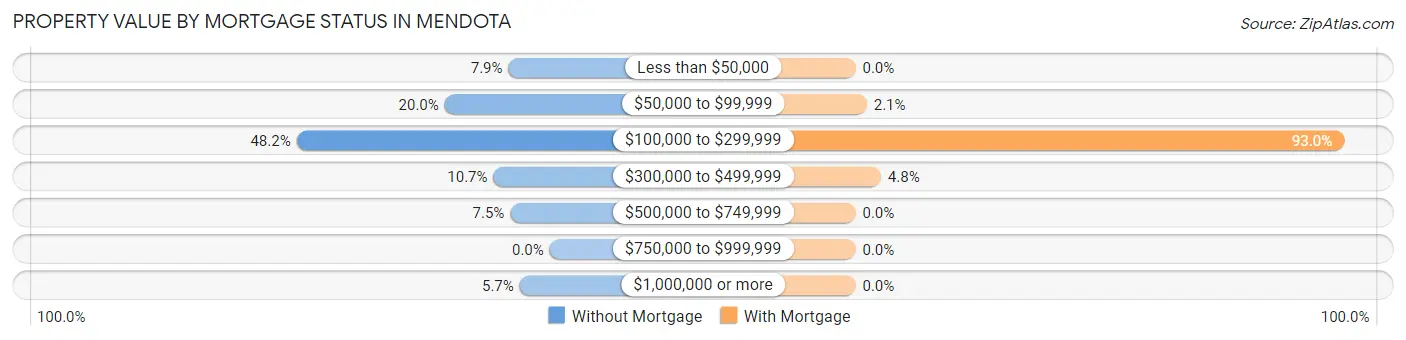
| Property Value | Without Mortgage | With Mortgage |
| Less than $50,000 | 22 (7.9%) | 0 (0.0%) |
| $50,000 to $99,999 | 56 (20.0%) | 24 (2.1%) |
| $100,000 to $299,999 | 135 (48.2%) | 1,041 (93.0%) |
| $300,000 to $499,999 | 30 (10.7%) | 54 (4.8%) |
| $500,000 to $749,999 | 21 (7.5%) | 0 (0.0%) |
| $750,000 to $999,999 | 0 (0.0%) | 0 (0.0%) |
| $1,000,000 or more | 16 (5.7%) | 0 (0.0%) |
| Total | 280 (100.0%) | 1,119 (100.0%) |
Household Income by Mortgage Status in Mendota
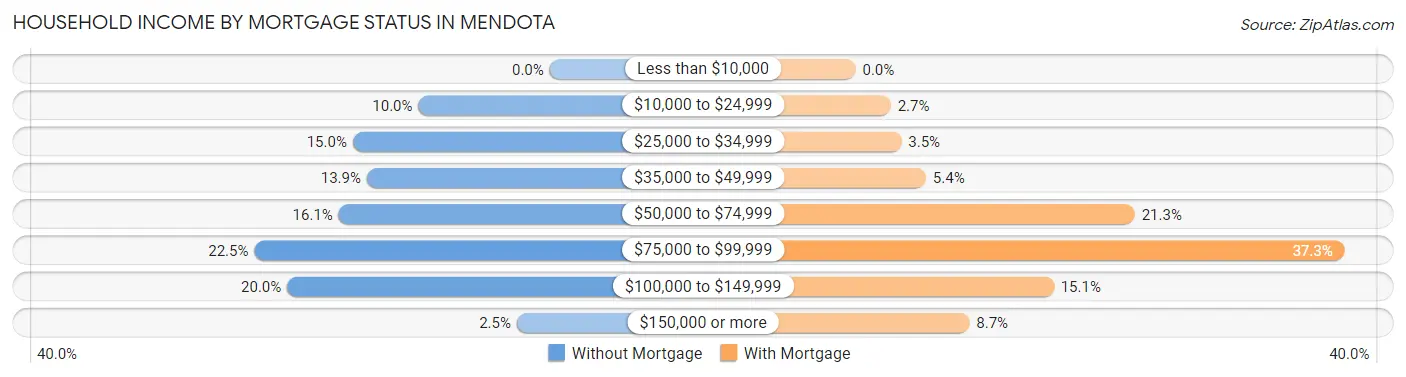
| Household Income | Without Mortgage | With Mortgage |
| Less than $10,000 | 0 (0.0%) | 0 (0.0%) |
| $10,000 to $24,999 | 28 (10.0%) | 30 (2.7%) |
| $25,000 to $34,999 | 42 (15.0%) | 39 (3.5%) |
| $35,000 to $49,999 | 39 (13.9%) | 60 (5.4%) |
| $50,000 to $74,999 | 45 (16.1%) | 238 (21.3%) |
| $75,000 to $99,999 | 63 (22.5%) | 417 (37.3%) |
| $100,000 to $149,999 | 56 (20.0%) | 169 (15.1%) |
| $150,000 or more | 7 (2.5%) | 97 (8.7%) |
| Total | 280 (100.0%) | 1,119 (100.0%) |
Property Value to Household Income Ratio in Mendota
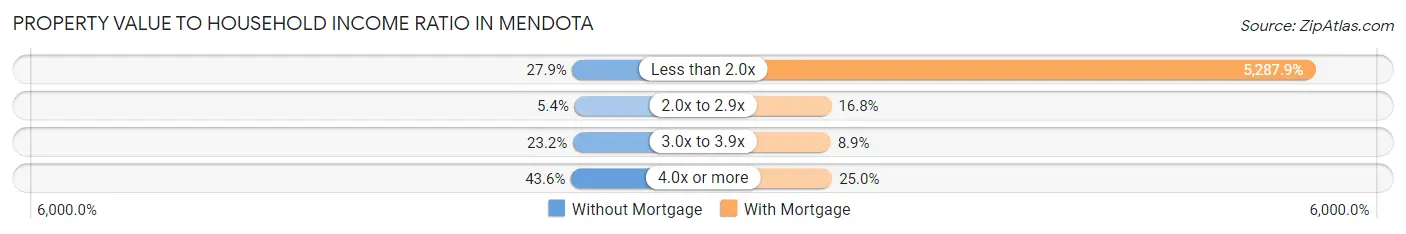
| Value-to-Income Ratio | Without Mortgage | With Mortgage |
| Less than 2.0x | 78 (27.9%) | 59,171 (5,287.9%) |
| 2.0x to 2.9x | 15 (5.4%) | 188 (16.8%) |
| 3.0x to 3.9x | 65 (23.2%) | 99 (8.8%) |
| 4.0x or more | 122 (43.6%) | 280 (25.0%) |
| Total | 280 (100.0%) | 1,119 (100.0%) |
Real Estate Taxes by Mortgage Status in Mendota
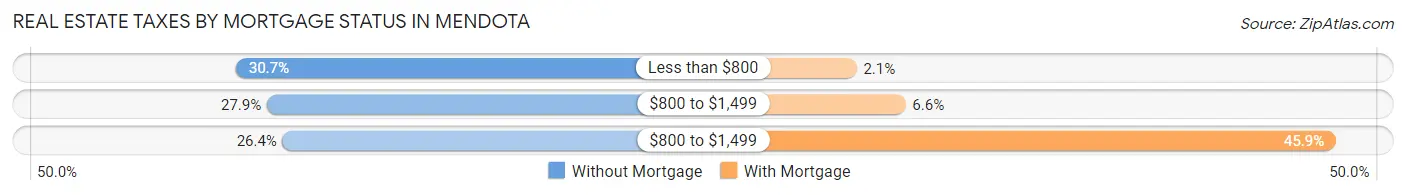
| Property Taxes | Without Mortgage | With Mortgage |
| Less than $800 | 86 (30.7%) | 24 (2.1%) |
| $800 to $1,499 | 78 (27.9%) | 74 (6.6%) |
| $800 to $1,499 | 74 (26.4%) | 514 (45.9%) |
| Total | 280 (100.0%) | 1,119 (100.0%) |
Health & Disability in Mendota
Health Insurance Coverage by Age in Mendota
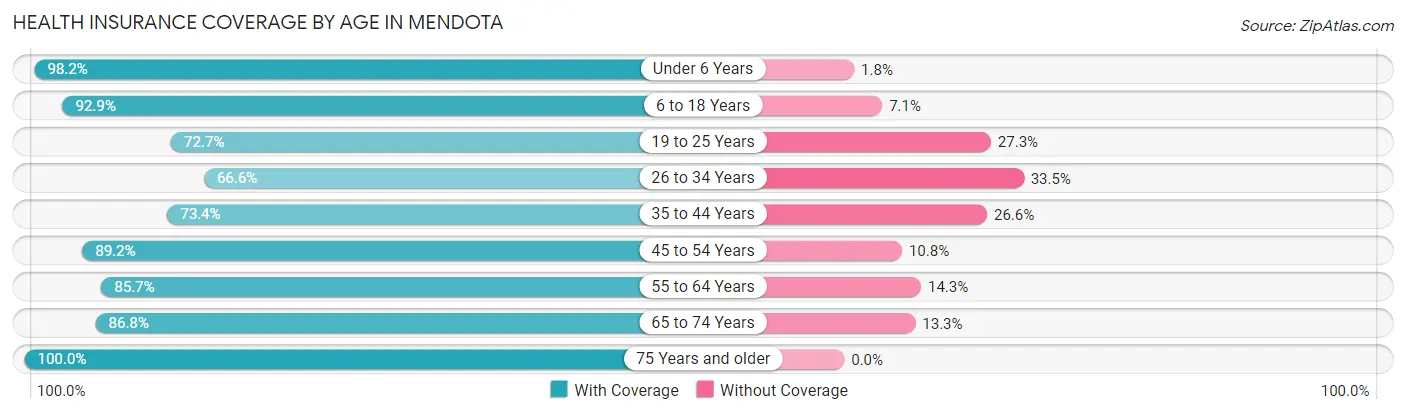
| Age Bracket | With Coverage | Without Coverage |
| Under 6 Years | 1,543 (98.2%) | 29 (1.8%) |
| 6 to 18 Years | 3,350 (92.9%) | 255 (7.1%) |
| 19 to 25 Years | 930 (72.7%) | 350 (27.3%) |
| 26 to 34 Years | 1,106 (66.5%) | 556 (33.5%) |
| 35 to 44 Years | 1,144 (73.4%) | 415 (26.6%) |
| 45 to 54 Years | 1,020 (89.2%) | 123 (10.8%) |
| 55 to 64 Years | 820 (85.7%) | 137 (14.3%) |
| 65 to 74 Years | 504 (86.8%) | 77 (13.3%) |
| 75 Years and older | 244 (100.0%) | 0 (0.0%) |
| Total | 10,661 (84.6%) | 1,942 (15.4%) |
Health Insurance Coverage by Citizenship Status in Mendota
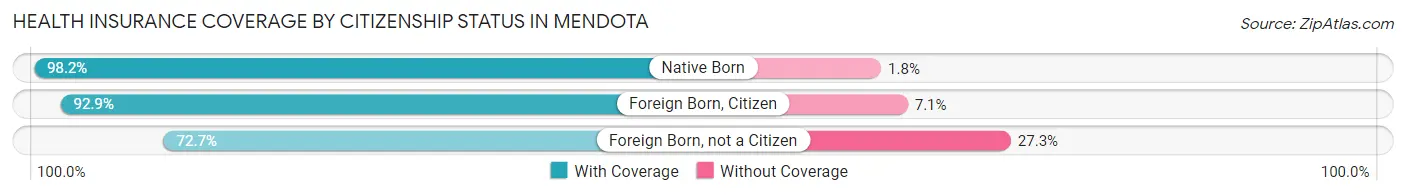
| Citizenship Status | With Coverage | Without Coverage |
| Native Born | 1,543 (98.2%) | 29 (1.8%) |
| Foreign Born, Citizen | 3,350 (92.9%) | 255 (7.1%) |
| Foreign Born, not a Citizen | 930 (72.7%) | 350 (27.3%) |
Health Insurance Coverage by Household Income in Mendota
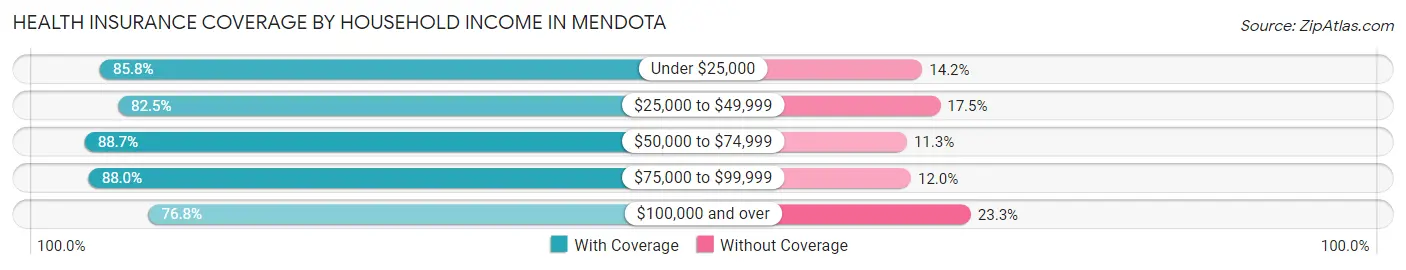
| Household Income | With Coverage | Without Coverage |
| Under $25,000 | 1,952 (85.8%) | 322 (14.2%) |
| $25,000 to $49,999 | 3,305 (82.5%) | 702 (17.5%) |
| $50,000 to $74,999 | 2,973 (88.7%) | 378 (11.3%) |
| $75,000 to $99,999 | 1,183 (88.0%) | 162 (12.0%) |
| $100,000 and over | 1,248 (76.7%) | 378 (23.3%) |
Public vs Private Health Insurance Coverage by Age in Mendota
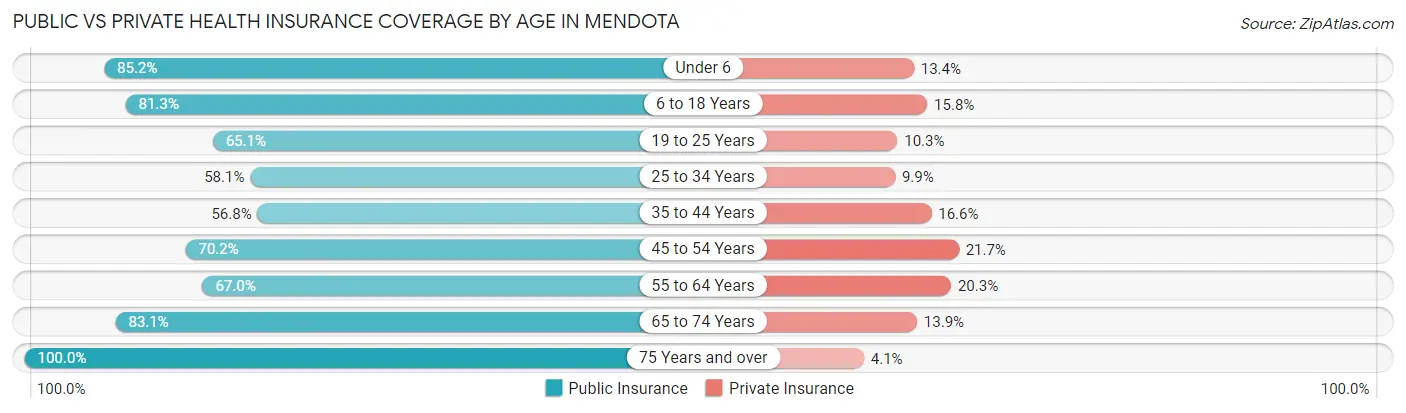
| Age Bracket | Public Insurance | Private Insurance |
| Under 6 | 1,340 (85.2%) | 210 (13.4%) |
| 6 to 18 Years | 2,929 (81.2%) | 571 (15.8%) |
| 19 to 25 Years | 833 (65.1%) | 132 (10.3%) |
| 25 to 34 Years | 966 (58.1%) | 164 (9.9%) |
| 35 to 44 Years | 885 (56.8%) | 259 (16.6%) |
| 45 to 54 Years | 802 (70.2%) | 248 (21.7%) |
| 55 to 64 Years | 641 (67.0%) | 194 (20.3%) |
| 65 to 74 Years | 483 (83.1%) | 81 (13.9%) |
| 75 Years and over | 244 (100.0%) | 10 (4.1%) |
| Total | 9,123 (72.4%) | 1,869 (14.8%) |
Disability Status by Sex by Age in Mendota
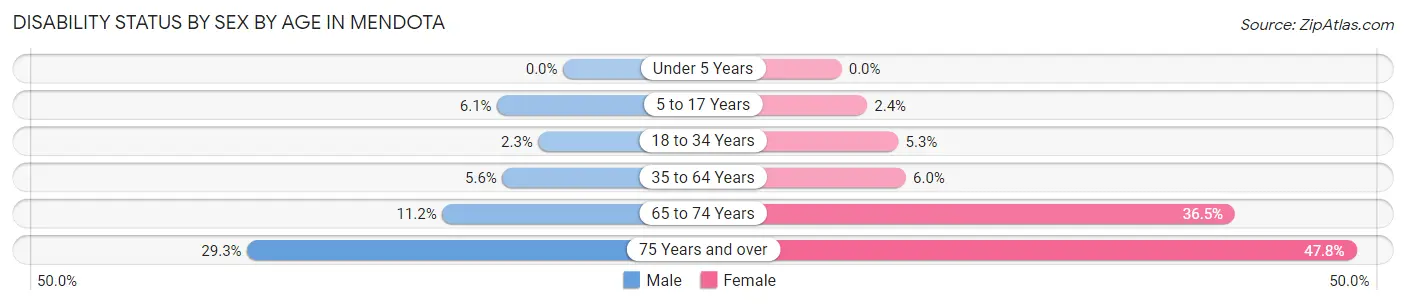
| Age Bracket | Male | Female |
| Under 5 Years | 0 (0.0%) | 0 (0.0%) |
| 5 to 17 Years | 128 (6.1%) | 36 (2.4%) |
| 18 to 34 Years | 34 (2.3%) | 94 (5.3%) |
| 35 to 64 Years | 105 (5.6%) | 107 (6.0%) |
| 65 to 74 Years | 39 (11.2%) | 85 (36.5%) |
| 75 Years and over | 39 (29.3%) | 53 (47.7%) |
Disability Class by Sex by Age in Mendota
Disability Class: Hearing Difficulty
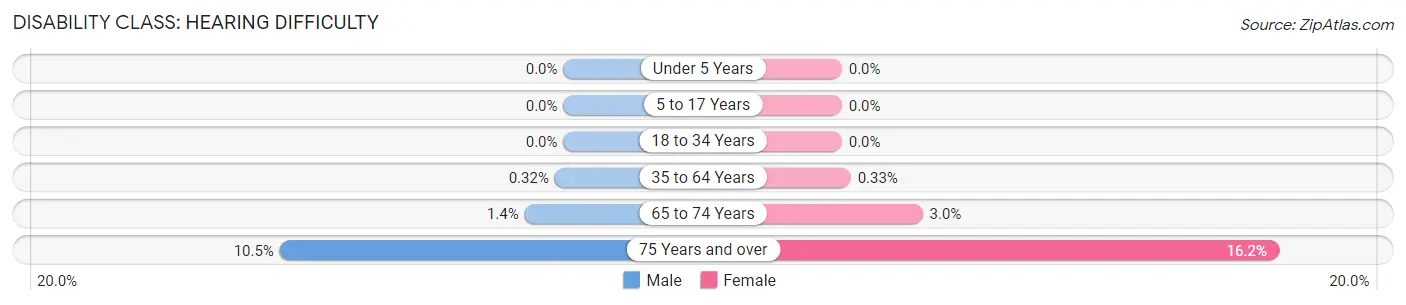
| Age Bracket | Male | Female |
| Under 5 Years | 0 (0.0%) | 0 (0.0%) |
| 5 to 17 Years | 0 (0.0%) | 0 (0.0%) |
| 18 to 34 Years | 0 (0.0%) | 0 (0.0%) |
| 35 to 64 Years | 6 (0.3%) | 6 (0.3%) |
| 65 to 74 Years | 5 (1.4%) | 7 (3.0%) |
| 75 Years and over | 14 (10.5%) | 18 (16.2%) |
Disability Class: Vision Difficulty
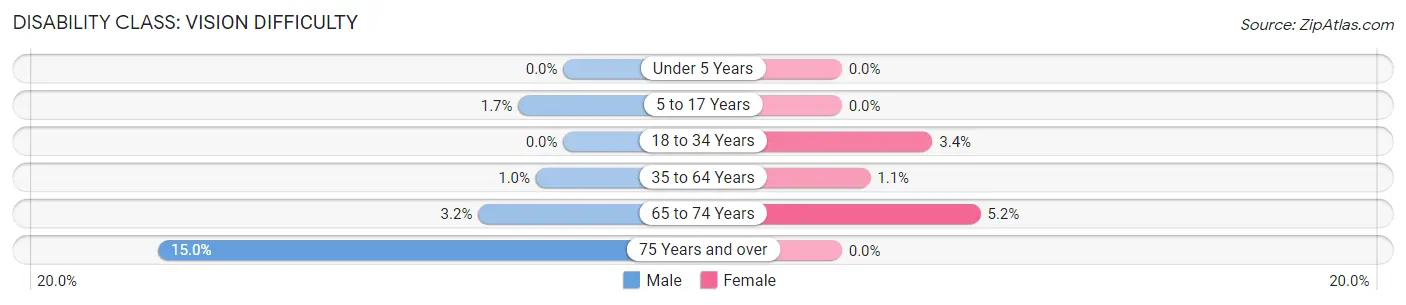
| Age Bracket | Male | Female |
| Under 5 Years | 0 (0.0%) | 0 (0.0%) |
| 5 to 17 Years | 35 (1.7%) | 0 (0.0%) |
| 18 to 34 Years | 0 (0.0%) | 60 (3.4%) |
| 35 to 64 Years | 19 (1.0%) | 19 (1.1%) |
| 65 to 74 Years | 11 (3.2%) | 12 (5.1%) |
| 75 Years and over | 20 (15.0%) | 0 (0.0%) |
Disability Class: Cognitive Difficulty
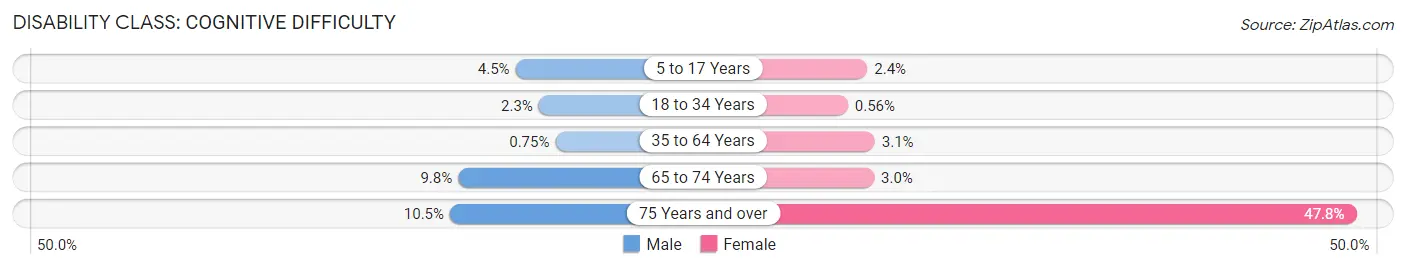
| Age Bracket | Male | Female |
| 5 to 17 Years | 93 (4.4%) | 36 (2.4%) |
| 18 to 34 Years | 34 (2.3%) | 10 (0.6%) |
| 35 to 64 Years | 14 (0.7%) | 55 (3.1%) |
| 65 to 74 Years | 34 (9.8%) | 7 (3.0%) |
| 75 Years and over | 14 (10.5%) | 53 (47.7%) |
Disability Class: Ambulatory Difficulty
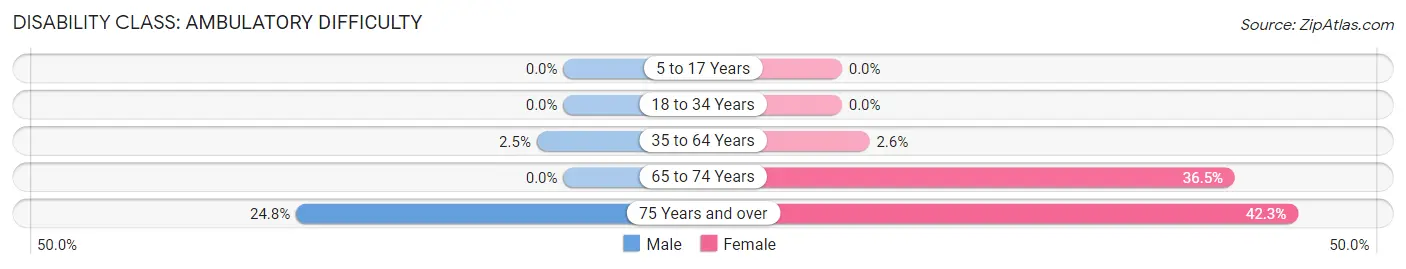
| Age Bracket | Male | Female |
| 5 to 17 Years | 0 (0.0%) | 0 (0.0%) |
| 18 to 34 Years | 0 (0.0%) | 0 (0.0%) |
| 35 to 64 Years | 46 (2.5%) | 46 (2.6%) |
| 65 to 74 Years | 0 (0.0%) | 85 (36.5%) |
| 75 Years and over | 33 (24.8%) | 47 (42.3%) |
Disability Class: Self-Care Difficulty
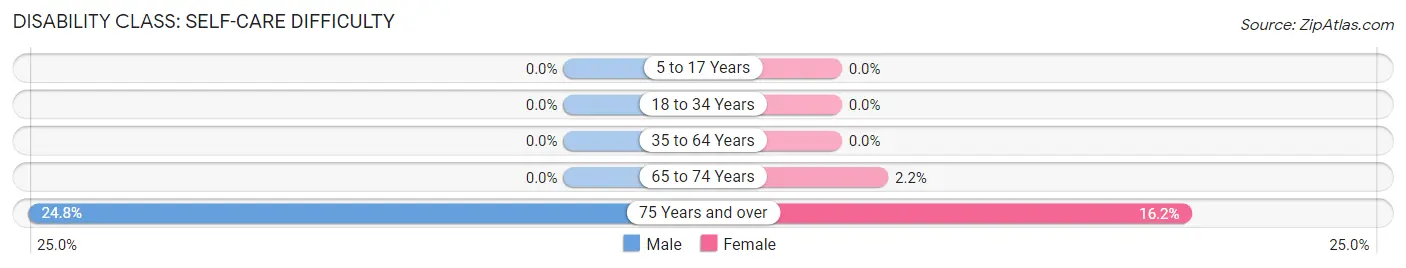
| Age Bracket | Male | Female |
| 5 to 17 Years | 0 (0.0%) | 0 (0.0%) |
| 18 to 34 Years | 0 (0.0%) | 0 (0.0%) |
| 35 to 64 Years | 0 (0.0%) | 0 (0.0%) |
| 65 to 74 Years | 0 (0.0%) | 5 (2.1%) |
| 75 Years and over | 33 (24.8%) | 18 (16.2%) |
Technology Access in Mendota
Computing Device Access in Mendota
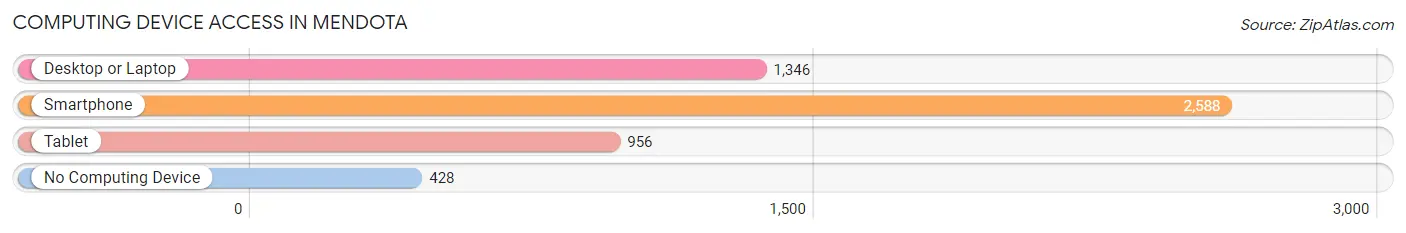
| Device Type | # Households | % Households |
| Desktop or Laptop | 1,346 | 43.9% |
| Smartphone | 2,588 | 84.4% |
| Tablet | 956 | 31.2% |
| No Computing Device | 428 | 14.0% |
| Total | 3,068 | 100.0% |
Internet Access in Mendota
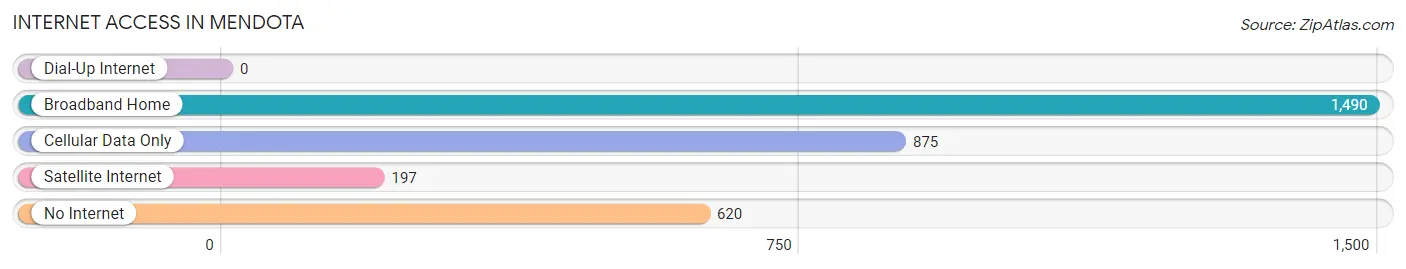
| Internet Type | # Households | % Households |
| Dial-Up Internet | 0 | 0.0% |
| Broadband Home | 1,490 | 48.6% |
| Cellular Data Only | 875 | 28.5% |
| Satellite Internet | 197 | 6.4% |
| No Internet | 620 | 20.2% |
| Total | 3,068 | 100.0% |
Mendota Summary
Mendota is a small city located in Fresno County, California, United States. It is situated in the San Joaquin Valley, approximately 30 miles west of Fresno. The city has a population of 11,014 as of the 2010 census, making it the largest city in Fresno County.
History
Mendota was founded in 1891 by the Southern Pacific Railroad. The city was named after the Mendota Indian tribe, which had inhabited the area for centuries. The city was originally a farming community, and the main crops grown were cotton, corn, and wheat. In the early 1900s, the city began to grow as a center for the agricultural industry.
In the 1950s, the city began to experience a population boom as the agricultural industry continued to expand. This growth was further fueled by the construction of the Mendota Dam in the 1960s, which provided irrigation water for the surrounding area.
Geography
Mendota is located in the San Joaquin Valley, approximately 30 miles west of Fresno. The city is situated at an elevation of approximately 200 feet above sea level. The city covers an area of 4.3 square miles, and is bordered by the cities of Firebaugh, San Joaquin, and Tranquillity.
The climate in Mendota is hot and dry, with temperatures ranging from the mid-90s in the summer to the mid-50s in the winter. The city receives an average of 8 inches of precipitation per year.
Economy
Mendota’s economy is largely based on agriculture. The city is home to a number of large agricultural companies, including Foster Farms, Grimmway Farms, and Sun-Maid Raisins. The city is also home to a number of food processing plants, including a cannery and a frozen food plant.
In addition to agriculture, Mendota is home to a number of other businesses, including retail stores, restaurants, and hotels. The city is also home to a number of government offices, including the Fresno County Sheriff’s Office and the Mendota Unified School District.
Demographics
As of the 2010 census, Mendota had a population of 11,014. The racial makeup of the city was 64.3% Hispanic or Latino, 25.2% White, 5.2% African American, and 5.3% other.
The median household income in Mendota was $31,945, and the median family income was $37,945. The per capita income in the city was $14,845. Approximately 24.3% of the population was below the poverty line.
Mendota is served by the Mendota Unified School District, which includes four elementary schools, one middle school, and one high school. The city is also home to a number of private schools, including a Catholic school and a Christian school.
Common Questions
What is Per Capita Income in Mendota?
Per Capita income in Mendota is $12,850.
What is the Median Family Income in Mendota?
Median Family Income in Mendota is $43,301.
What is the Median Household income in Mendota?
Median Household Income in Mendota is $43,315.
What is Income or Wage Gap in Mendota?
Income or Wage Gap in Mendota is 40.5%.
Women in Mendota earn 59.5 cents for every dollar earned by a man.
What is Family Income Deficit in Mendota?
Family Income Deficit in Mendota is $13,445.
Families that are below poverty line in Mendota earn $13,445 less on average than the poverty threshold level.
What is Inequality or Gini Index in Mendota?
Inequality or Gini Index in Mendota is 0.41.
What is the Total Population of Mendota?
Total Population of Mendota is 12,603.
What is the Total Male Population of Mendota?
Total Male Population of Mendota is 6,510.
What is the Total Female Population of Mendota?
Total Female Population of Mendota is 6,093.
What is the Ratio of Males per 100 Females in Mendota?
There are 106.84 Males per 100 Females in Mendota.
What is the Ratio of Females per 100 Males in Mendota?
There are 93.59 Females per 100 Males in Mendota.
What is the Median Population Age in Mendota?
Median Population Age in Mendota is 24.3 Years.
What is the Average Family Size in Mendota
Average Family Size in Mendota is 4.3 People.
What is the Average Household Size in Mendota
Average Household Size in Mendota is 4.1 People.
How Large is the Labor Force in Mendota?
There are 5,077 People in the Labor Forcein in Mendota.
What is the Percentage of People in the Labor Force in Mendota?
63.5% of People are in the Labor Force in Mendota.
What is the Unemployment Rate in Mendota?
Unemployment Rate in Mendota is 11.4%.