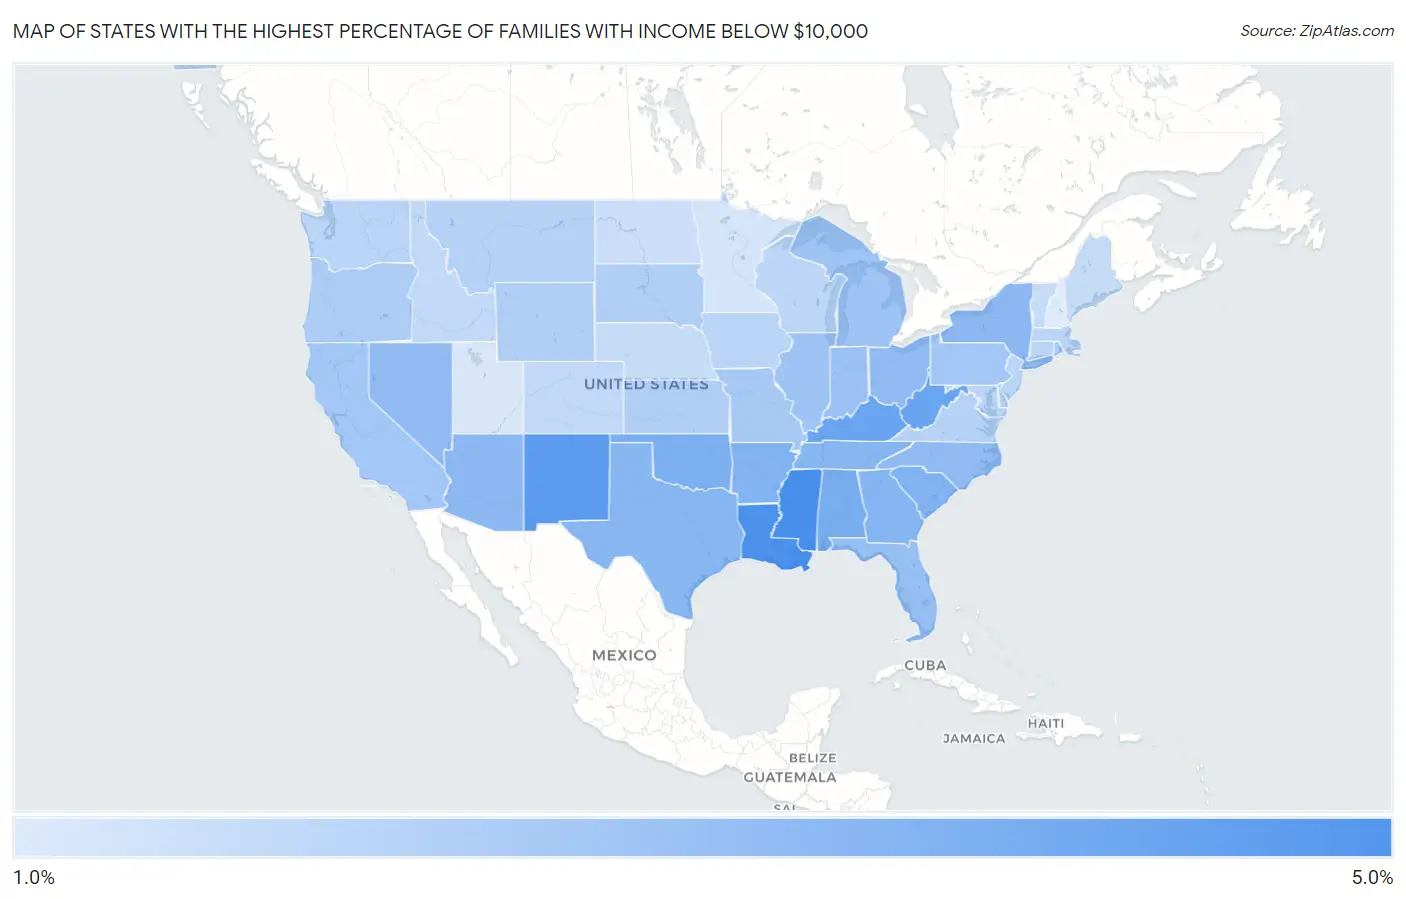
States with the Highest Percentage of Families with Income Below $10,000
RELATED REPORTS & OPTIONS
Family Income | $0-10k
United States
Compare States
Map of States with the Highest Percentage of Families with Income Below $10,000
1.0%
5.0%
States with the Highest Percentage of Families with Income Below $10,000 in the United States
| State | Families with Income < $10k | vs State Median | vs National | |
| 1. | Mississippi | 5.0% | 2.7% (+2.30) | 3.1%(+1.90) |
| 2. | Louisiana | 4.9% | 2.7% (+2.20) | 3.1%(+1.80) |
| 3. | New Mexico | 4.6% | 2.7% (+1.90) | 3.1%(+1.50) |
| 4. | Kentucky | 4.2% | 2.7% (+1.50) | 3.1%(+1.10) |
| 5. | West Virginia | 4.2% | 2.7% (+1.50) | 3.1%(+1.10) |
| 6. | Alabama | 3.9% | 2.7% (+1.20) | 3.1%(+0.800) |
| 7. | Oklahoma | 3.8% | 2.7% (+1.10) | 3.1%(+0.700) |
| 8. | South Carolina | 3.7% | 2.7% (+1.00) | 3.1%(+0.600) |
| 9. | Arkansas | 3.7% | 2.7% (+1.00) | 3.1%(+0.600) |
| 10. | Georgia | 3.6% | 2.7% (+0.900) | 3.1%(+0.500) |
| 11. | Texas | 3.5% | 2.7% (+0.800) | 3.1%(+0.400) |
| 12. | Tennessee | 3.5% | 2.7% (+0.800) | 3.1%(+0.400) |
| 13. | New York | 3.4% | 2.7% (+0.700) | 3.1%(+0.300) |
| 14. | Arizona | 3.4% | 2.7% (+0.700) | 3.1%(+0.300) |
| 15. | Ohio | 3.3% | 2.7% (+0.600) | 3.1%(+0.200) |
| 16. | North Carolina | 3.3% | 2.7% (+0.600) | 3.1%(+0.200) |
| 17. | Nevada | 3.3% | 2.7% (+0.600) | 3.1%(+0.200) |
| 18. | Florida | 3.2% | 2.7% (+0.500) | 3.1%(+0.100) |
| 19. | Indiana | 3.1% | 2.7% (+0.400) | 3.1%(=0.000) |
| 20. | Illinois | 3.0% | 2.7% (+0.300) | 3.1%(-0.100) |
| 21. | Michigan | 3.0% | 2.7% (+0.300) | 3.1%(-0.100) |
| 22. | California | 2.9% | 2.7% (+0.200) | 3.1%(-0.200) |
| 23. | Pennsylvania | 2.9% | 2.7% (+0.200) | 3.1%(-0.200) |
| 24. | Missouri | 2.8% | 2.7% (+0.100) | 3.1%(-0.300) |
| 25. | Oregon | 2.7% | 2.7% (=0.000) | 3.1%(-0.400) |
| 26. | Rhode Island | 2.7% | 2.7% (=0.000) | 3.1%(-0.400) |
| 27. | Kansas | 2.6% | 2.7% (-0.100) | 3.1%(-0.500) |
| 28. | Delaware | 2.6% | 2.7% (-0.100) | 3.1%(-0.500) |
| 29. | South Dakota | 2.6% | 2.7% (-0.100) | 3.1%(-0.500) |
| 30. | Wyoming | 2.6% | 2.7% (-0.100) | 3.1%(-0.500) |
| 31. | Virginia | 2.5% | 2.7% (-0.200) | 3.1%(-0.600) |
| 32. | Hawaii | 2.5% | 2.7% (-0.200) | 3.1%(-0.600) |
| 33. | Montana | 2.5% | 2.7% (-0.200) | 3.1%(-0.600) |
| 34. | New Jersey | 2.4% | 2.7% (-0.300) | 3.1%(-0.700) |
| 35. | Washington | 2.4% | 2.7% (-0.300) | 3.1%(-0.700) |
| 36. | Massachusetts | 2.4% | 2.7% (-0.300) | 3.1%(-0.700) |
| 37. | Maryland | 2.4% | 2.7% (-0.300) | 3.1%(-0.700) |
| 38. | Connecticut | 2.4% | 2.7% (-0.300) | 3.1%(-0.700) |
| 39. | Iowa | 2.4% | 2.7% (-0.300) | 3.1%(-0.700) |
| 40. | Wisconsin | 2.3% | 2.7% (-0.400) | 3.1%(-0.800) |
| 41. | Alaska | 2.3% | 2.7% (-0.400) | 3.1%(-0.800) |
| 42. | Colorado | 2.2% | 2.7% (-0.500) | 3.1%(-0.900) |
| 43. | Idaho | 2.2% | 2.7% (-0.500) | 3.1%(-0.900) |
| 44. | Nebraska | 2.1% | 2.7% (-0.600) | 3.1%(-1.000) |
| 45. | Maine | 2.1% | 2.7% (-0.600) | 3.1%(-1.000) |
| 46. | Vermont | 2.1% | 2.7% (-0.600) | 3.1%(-1.000) |
| 47. | North Dakota | 2.0% | 2.7% (-0.700) | 3.1%(-1.10) |
| 48. | Minnesota | 1.8% | 2.7% (-0.900) | 3.1%(-1.30) |
| 49. | Utah | 1.7% | 2.7% (-1.00) | 3.1%(-1.40) |
| 50. | New Hampshire | 1.6% | 2.7% (-1.10) | 3.1%(-1.50) |
1
Common Questions
What are the Top 10 States with the Highest Percentage of Families with Income Below $10,000 in the United States?
Top 10 States with the Highest Percentage of Families with Income Below $10,000 in the United States are:
#1
5.0%
#2
4.9%
#3
4.6%
#4
4.2%
#5
4.2%
#6
3.9%
#7
3.8%
#8
3.7%
#9
3.7%
#10
3.6%
What state has the Highest Percentage of Families with Income Below $10,000 in the United States?
Mississippi has the Highest Percentage of Families with Income Below $10,000 in the United States with 5.0%.
What is the Percentage of Families with Income Below $10,000 in the United States?
Percentage of Families with Income Below $10,000 in the United States is 3.1%.