Cities with the Highest Percentage of Families with Income Below $10,000 in Georgia
RELATED REPORTS & OPTIONS
Family Income | $0-10k
Georgia
Compare Cities
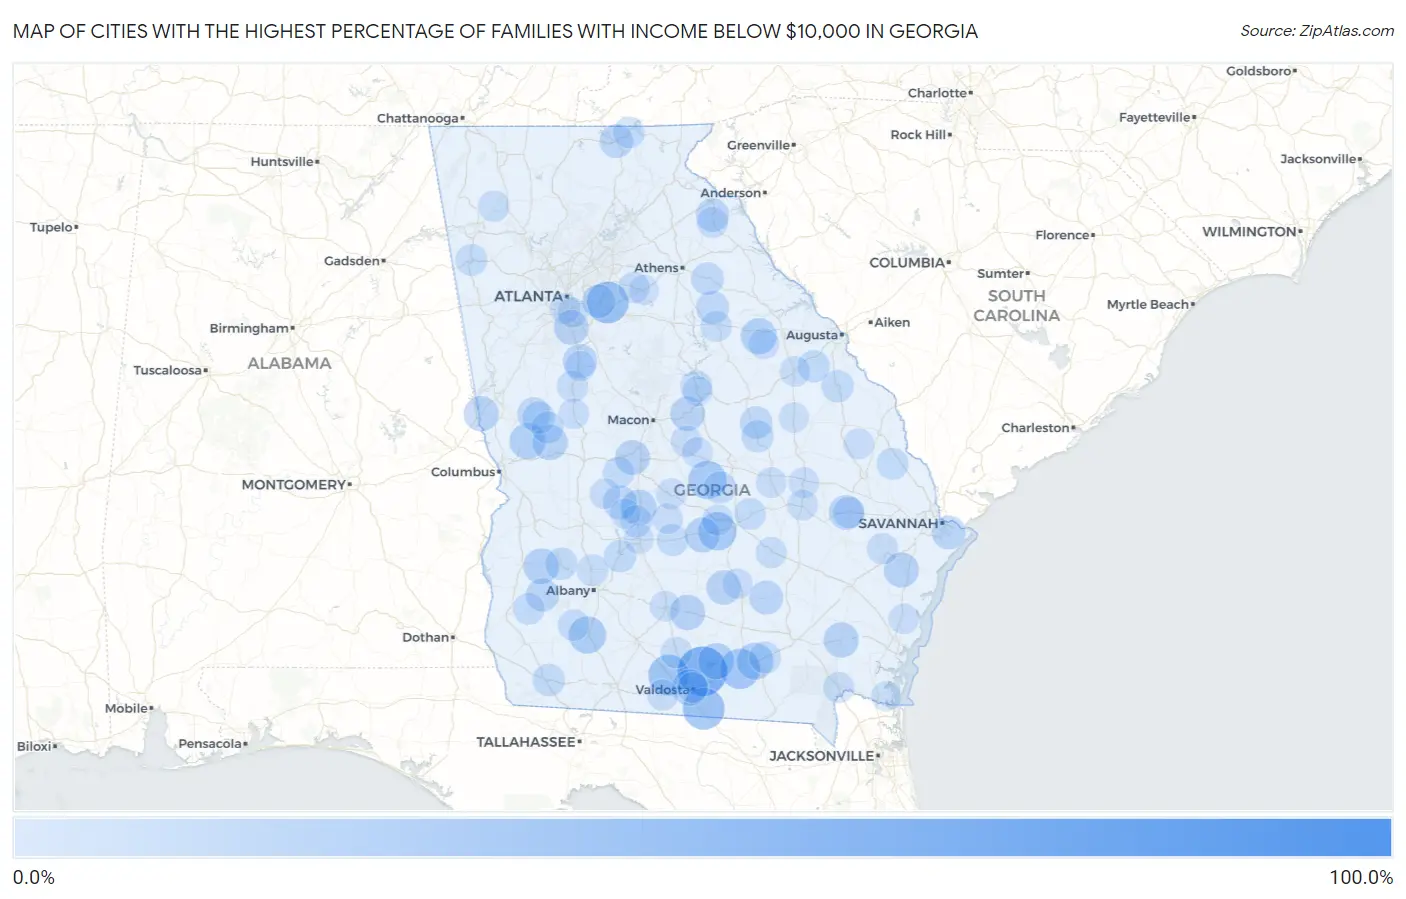
Map of Cities with the Highest Percentage of Families with Income Below $10,000 in Georgia
0.0%
100.0%
Cities with the Highest Percentage of Families with Income Below $10,000 in Georgia
| City | Families with Income < $10k | vs State | vs National | |
| 1. | Warthen | 95.1% | 3.6%(+91.5)#1 | 3.1%(+92.0)#40 |
| 2. | Juliette | 64.3% | 3.6%(+60.7)#2 | 3.1%(+61.2)#74 |
| 3. | Moody Afb | 60.3% | 3.6%(+56.7)#3 | 3.1%(+57.2)#83 |
| 4. | Lakeview Estates | 39.9% | 3.6%(+36.3)#4 | 3.1%(+36.8)#218 |
| 5. | Lake Park | 39.9% | 3.6%(+36.3)#5 | 3.1%(+36.8)#220 |
| 6. | Morven | 36.9% | 3.6%(+33.3)#6 | 3.1%(+33.8)#262 |
| 7. | Du Pont | 36.1% | 3.6%(+32.5)#7 | 3.1%(+33.0)#276 |
| 8. | Chester | 31.0% | 3.6%(+27.4)#8 | 3.1%(+27.9)#378 |
| 9. | Milan | 30.8% | 3.6%(+27.2)#9 | 3.1%(+27.7)#386 |
| 10. | Camilla | 28.0% | 3.6%(+24.4)#10 | 3.1%(+24.9)#466 |
| 11. | Faceville | 28.0% | 3.6%(+24.4)#11 | 3.1%(+24.9)#469 |
| 12. | Homerville | 26.9% | 3.6%(+23.3)#12 | 3.1%(+23.8)#508 |
| 13. | Remerton | 25.9% | 3.6%(+22.3)#13 | 3.1%(+22.8)#549 |
| 14. | Lakeland | 25.4% | 3.6%(+21.8)#14 | 3.1%(+22.3)#570 |
| 15. | Waverly Hall | 25.3% | 3.6%(+21.7)#15 | 3.1%(+22.2)#575 |
| 16. | Norwood | 25.0% | 3.6%(+21.4)#16 | 3.1%(+21.9)#592 |
| 17. | Pinehurst | 23.9% | 3.6%(+20.3)#17 | 3.1%(+20.8)#654 |
| 18. | Shellman | 23.8% | 3.6%(+20.2)#18 | 3.1%(+20.7)#658 |
| 19. | Enigma | 23.1% | 3.6%(+19.5)#19 | 3.1%(+20.0)#694 |
| 20. | Talbotton | 23.1% | 3.6%(+19.5)#20 | 3.1%(+20.0)#697 |
| 21. | Nahunta | 22.7% | 3.6%(+19.1)#21 | 3.1%(+19.6)#715 |
| 22. | Riceboro | 22.3% | 3.6%(+18.7)#22 | 3.1%(+19.2)#741 |
| 23. | Rhine | 22.1% | 3.6%(+18.5)#23 | 3.1%(+19.0)#758 |
| 24. | West Point | 22.0% | 3.6%(+18.4)#24 | 3.1%(+18.9)#761 |
| 25. | Fort Valley | 21.9% | 3.6%(+18.3)#25 | 3.1%(+18.8)#765 |
| 26. | Hagan | 21.9% | 3.6%(+18.3)#26 | 3.1%(+18.8)#766 |
| 27. | Jonesboro | 21.2% | 3.6%(+17.6)#27 | 3.1%(+18.1)#807 |
| 28. | Gordon | 21.2% | 3.6%(+17.6)#28 | 3.1%(+18.1)#810 |
| 29. | Ambrose | 21.2% | 3.6%(+17.6)#29 | 3.1%(+18.1)#812 |
| 30. | Experiment | 20.6% | 3.6%(+17.0)#30 | 3.1%(+17.5)#845 |
| 31. | Dooling | 20.0% | 3.6%(+16.4)#31 | 3.1%(+16.9)#912 |
| 32. | Nicholls | 19.3% | 3.6%(+15.7)#32 | 3.1%(+16.2)#969 |
| 33. | Dutch Island | 19.3% | 3.6%(+15.7)#33 | 3.1%(+16.2)#972 |
| 34. | Blairsville | 18.5% | 3.6%(+14.9)#34 | 3.1%(+15.4)#1,047 |
| 35. | Lithonia | 18.3% | 3.6%(+14.7)#35 | 3.1%(+15.2)#1,058 |
| 36. | Canon | 17.9% | 3.6%(+14.3)#36 | 3.1%(+14.8)#1,115 |
| 37. | Morgan | 17.8% | 3.6%(+14.2)#37 | 3.1%(+14.7)#1,126 |
| 38. | Woodville | 17.6% | 3.6%(+14.0)#38 | 3.1%(+14.5)#1,144 |
| 39. | Warm Springs | 17.5% | 3.6%(+13.9)#39 | 3.1%(+14.4)#1,158 |
| 40. | Crawford | 16.8% | 3.6%(+13.2)#40 | 3.1%(+13.7)#1,230 |
| 41. | Harrison | 16.7% | 3.6%(+13.1)#41 | 3.1%(+13.6)#1,237 |
| 42. | Bainbridge | 16.1% | 3.6%(+12.5)#42 | 3.1%(+13.0)#1,301 |
| 43. | Manchester | 15.9% | 3.6%(+12.3)#43 | 3.1%(+12.8)#1,328 |
| 44. | Warwick | 15.8% | 3.6%(+12.2)#44 | 3.1%(+12.7)#1,348 |
| 45. | Dawson | 15.6% | 3.6%(+12.0)#45 | 3.1%(+12.5)#1,363 |
| 46. | Wrightsville | 15.4% | 3.6%(+11.8)#46 | 3.1%(+12.3)#1,398 |
| 47. | Cadwell | 15.4% | 3.6%(+11.8)#47 | 3.1%(+12.3)#1,407 |
| 48. | Waynesboro | 15.3% | 3.6%(+11.7)#48 | 3.1%(+12.2)#1,421 |
| 49. | Keysville | 15.2% | 3.6%(+11.6)#49 | 3.1%(+12.1)#1,443 |
| 50. | Woodland | 15.2% | 3.6%(+11.6)#50 | 3.1%(+12.1)#1,446 |
| 51. | Rochelle | 14.9% | 3.6%(+11.3)#51 | 3.1%(+11.8)#1,476 |
| 52. | Vienna | 14.7% | 3.6%(+11.1)#52 | 3.1%(+11.6)#1,508 |
| 53. | Milledgeville | 14.6% | 3.6%(+11.0)#53 | 3.1%(+11.5)#1,527 |
| 54. | Argyle | 14.6% | 3.6%(+11.0)#54 | 3.1%(+11.5)#1,542 |
| 55. | Alamo | 14.5% | 3.6%(+10.9)#55 | 3.1%(+11.4)#1,547 |
| 56. | Arlington | 14.4% | 3.6%(+10.8)#56 | 3.1%(+11.3)#1,569 |
| 57. | Oliver | 14.3% | 3.6%(+10.7)#57 | 3.1%(+11.2)#1,596 |
| 58. | Cedartown | 14.1% | 3.6%(+10.5)#58 | 3.1%(+11.0)#1,639 |
| 59. | Claxton | 13.7% | 3.6%(+10.1)#59 | 3.1%(+10.6)#1,720 |
| 60. | Marshallville | 13.7% | 3.6%(+10.1)#60 | 3.1%(+10.6)#1,722 |
| 61. | Young Harris | 13.6% | 3.6%(+10.00)#61 | 3.1%(+10.5)#1,740 |
| 62. | Newton | 13.6% | 3.6%(+10.00)#62 | 3.1%(+10.5)#1,748 |
| 63. | Adel | 13.3% | 3.6%(+9.70)#63 | 3.1%(+10.2)#1,802 |
| 64. | Leesburg | 13.3% | 3.6%(+9.70)#64 | 3.1%(+10.2)#1,805 |
| 65. | Zebulon | 13.3% | 3.6%(+9.70)#65 | 3.1%(+10.2)#1,810 |
| 66. | Plainville | 13.2% | 3.6%(+9.60)#66 | 3.1%(+10.1)#1,845 |
| 67. | Between | 13.0% | 3.6%(+9.40)#67 | 3.1%(+9.90)#1,882 |
| 68. | Fort Stewart | 12.8% | 3.6%(+9.20)#68 | 3.1%(+9.70)#1,909 |
| 69. | Hazlehurst | 12.8% | 3.6%(+9.20)#69 | 3.1%(+9.70)#1,910 |
| 70. | Royston | 12.8% | 3.6%(+9.20)#70 | 3.1%(+9.70)#1,912 |
| 71. | Jeffersonville | 12.8% | 3.6%(+9.20)#71 | 3.1%(+9.70)#1,918 |
| 72. | Chauncey | 12.7% | 3.6%(+9.10)#72 | 3.1%(+9.60)#1,959 |
| 73. | Folkston | 12.6% | 3.6%(+9.00)#73 | 3.1%(+9.50)#1,968 |
| 74. | Quitman | 12.6% | 3.6%(+9.00)#74 | 3.1%(+9.50)#1,969 |
| 75. | Siloam | 12.5% | 3.6%(+8.90)#75 | 3.1%(+9.40)#1,995 |
| 76. | Hawkinsville | 11.9% | 3.6%(+8.30)#76 | 3.1%(+8.80)#2,147 |
| 77. | Warrenton | 11.9% | 3.6%(+8.30)#77 | 3.1%(+8.80)#2,154 |
| 78. | Oak Park | 11.9% | 3.6%(+8.30)#78 | 3.1%(+8.80)#2,163 |
| 79. | Lyons | 11.8% | 3.6%(+8.20)#79 | 3.1%(+8.70)#2,180 |
| 80. | Rocky Ford | 11.8% | 3.6%(+8.20)#80 | 3.1%(+8.70)#2,202 |
| 81. | Pineview | 11.7% | 3.6%(+8.10)#81 | 3.1%(+8.60)#2,227 |
| 82. | Wrens | 11.6% | 3.6%(+8.00)#82 | 3.1%(+8.50)#2,242 |
| 83. | Valdosta | 11.5% | 3.6%(+7.90)#83 | 3.1%(+8.40)#2,267 |
| 84. | Soperton | 11.5% | 3.6%(+7.90)#84 | 3.1%(+8.40)#2,279 |
| 85. | Tifton | 11.4% | 3.6%(+7.80)#85 | 3.1%(+8.30)#2,314 |
| 86. | Danville | 11.4% | 3.6%(+7.80)#86 | 3.1%(+8.30)#2,344 |
| 87. | Oglethorpe | 11.3% | 3.6%(+7.70)#87 | 3.1%(+8.20)#2,360 |
| 88. | Hapeville | 11.2% | 3.6%(+7.60)#88 | 3.1%(+8.10)#2,381 |
| 89. | Broxton | 11.2% | 3.6%(+7.60)#89 | 3.1%(+8.10)#2,393 |
| 90. | Thomaston | 10.9% | 3.6%(+7.30)#90 | 3.1%(+7.80)#2,484 |
| 91. | Darien | 10.8% | 3.6%(+7.20)#91 | 3.1%(+7.70)#2,523 |
| 92. | Cusseta Chattahoochee County Unified Government | 10.7% | 3.6%(+7.10)#92 | 3.1%(+7.60)#2,547 |
| 93. | Monroe | 10.6% | 3.6%(+7.00)#93 | 3.1%(+7.50)#2,588 |
| 94. | Griffin | 10.5% | 3.6%(+6.90)#94 | 3.1%(+7.40)#2,627 |
| 95. | Conley | 10.5% | 3.6%(+6.90)#95 | 3.1%(+7.40)#2,633 |
| 96. | Wadley | 10.5% | 3.6%(+6.90)#96 | 3.1%(+7.40)#2,645 |
| 97. | Lilly | 10.4% | 3.6%(+6.80)#97 | 3.1%(+7.30)#2,698 |
| 98. | Cordele | 10.2% | 3.6%(+6.60)#98 | 3.1%(+7.10)#2,751 |
| 99. | Hardwick | 10.2% | 3.6%(+6.60)#99 | 3.1%(+7.10)#2,762 |
| 100. | St Marys | 10.0% | 3.6%(+6.40)#100 | 3.1%(+6.90)#2,821 |
Common Questions
What are the Top 10 Cities with the Highest Percentage of Families with Income Below $10,000 in Georgia?
Top 10 Cities with the Highest Percentage of Families with Income Below $10,000 in Georgia are:
#1
60.3%
#2
39.9%
#3
39.9%
#4
36.9%
#5
36.1%
#6
31.0%
#7
30.8%
#8
28.0%
#9
26.9%
#10
25.9%
What city has the Highest Percentage of Families with Income Below $10,000 in Georgia?
Moody AFB has the Highest Percentage of Families with Income Below $10,000 in Georgia with 60.3%.
What is the Percentage of Families with Income Below $10,000 in the State of Georgia?
Percentage of Families with Income Below $10,000 in Georgia is 3.6%.
What is the Percentage of Families with Income Below $10,000 in the United States?
Percentage of Families with Income Below $10,000 in the United States is 3.1%.