Cities with the Highest Percentage of Families with Income Below $10,000 in New Jersey
RELATED REPORTS & OPTIONS
Family Income | $0-10k
New Jersey
Compare Cities
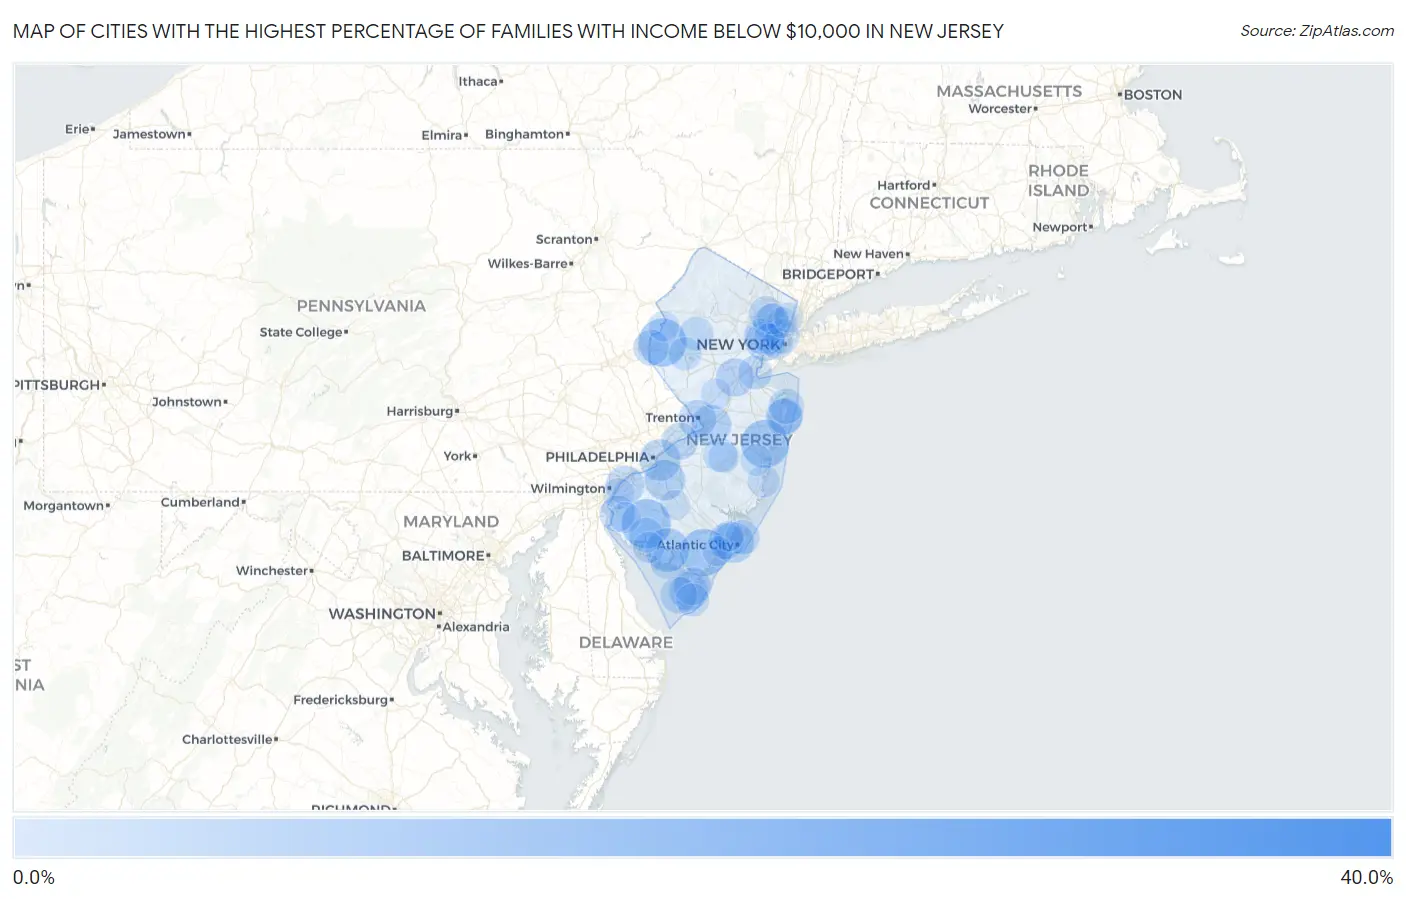
Map of Cities with the Highest Percentage of Families with Income Below $10,000 in New Jersey
0.0%
40.0%
Cities with the Highest Percentage of Families with Income Below $10,000 in New Jersey
| City | Families with Income < $10k | vs State | vs National | |
| 1. | Seaside Heights Borough | 36.9% | 2.4%(+34.5)#1 | 3.1%(+33.8)#260 |
| 2. | Rutgers University-Busch Campus | 26.0% | 2.4%(+23.6)#2 | 3.1%(+22.9)#545 |
| 3. | Penns Grove Borough | 17.5% | 2.4%(+15.1)#3 | 3.1%(+14.4)#1,150 |
| 4. | Laurel Heights | 17.5% | 2.4%(+15.1)#4 | 3.1%(+14.4)#1,159 |
| 5. | Seabrook Farms | 14.2% | 2.4%(+11.8)#5 | 3.1%(+11.1)#1,633 |
| 6. | Keasbey | 13.8% | 2.4%(+11.4)#6 | 3.1%(+10.7)#1,699 |
| 7. | New Village | 13.6% | 2.4%(+11.2)#7 | 3.1%(+10.5)#1,750 |
| 8. | Clearbrook | 13.5% | 2.4%(+11.1)#8 | 3.1%(+10.4)#1,764 |
| 9. | Leisure Village | 13.4% | 2.4%(+11.0)#9 | 3.1%(+10.3)#1,782 |
| 10. | Corbin City | 13.2% | 2.4%(+10.8)#10 | 3.1%(+10.1)#1,839 |
| 11. | Dividing Creek | 12.4% | 2.4%(+10.00)#11 | 3.1%(+9.30)#2,042 |
| 12. | Keansburg Borough | 11.2% | 2.4%(+8.80)#12 | 3.1%(+8.10)#2,377 |
| 13. | Dunellen Borough | 11.1% | 2.4%(+8.70)#13 | 3.1%(+8.00)#2,405 |
| 14. | Laurel Lake | 11.1% | 2.4%(+8.70)#14 | 3.1%(+8.00)#2,418 |
| 15. | Delmont | 10.9% | 2.4%(+8.50)#15 | 3.1%(+7.80)#2,504 |
| 16. | Wrightstown Borough | 10.3% | 2.4%(+7.90)#16 | 3.1%(+7.20)#2,727 |
| 17. | Camden | 9.8% | 2.4%(+7.40)#17 | 3.1%(+6.70)#2,926 |
| 18. | Atlantic City | 9.4% | 2.4%(+7.00)#18 | 3.1%(+6.30)#3,118 |
| 19. | Blackwood | 9.4% | 2.4%(+7.00)#19 | 3.1%(+6.30)#3,124 |
| 20. | Carlstadt Borough | 9.2% | 2.4%(+6.80)#20 | 3.1%(+6.10)#3,221 |
| 21. | Groveville | 9.2% | 2.4%(+6.80)#21 | 3.1%(+6.10)#3,227 |
| 22. | Prospect Park Borough | 9.1% | 2.4%(+6.70)#22 | 3.1%(+6.00)#3,277 |
| 23. | Lakehurst Borough | 9.1% | 2.4%(+6.70)#23 | 3.1%(+6.00)#3,286 |
| 24. | Newark | 8.7% | 2.4%(+6.30)#24 | 3.1%(+5.60)#3,490 |
| 25. | Neptune City Borough | 8.3% | 2.4%(+5.90)#25 | 3.1%(+5.20)#3,710 |
| 26. | Burleigh | 8.3% | 2.4%(+5.90)#26 | 3.1%(+5.20)#3,738 |
| 27. | Pedricktown | 8.2% | 2.4%(+5.80)#27 | 3.1%(+5.10)#3,815 |
| 28. | New Brunswick | 8.0% | 2.4%(+5.60)#28 | 3.1%(+4.90)#3,877 |
| 29. | Trenton | 7.9% | 2.4%(+5.50)#29 | 3.1%(+4.80)#3,939 |
| 30. | Cape May Court House | 7.8% | 2.4%(+5.40)#30 | 3.1%(+4.70)#4,023 |
| 31. | Villas | 7.4% | 2.4%(+5.00)#31 | 3.1%(+4.30)#4,296 |
| 32. | Beverly | 7.4% | 2.4%(+5.00)#32 | 3.1%(+4.30)#4,305 |
| 33. | Asbury Park | 7.2% | 2.4%(+4.80)#33 | 3.1%(+4.10)#4,448 |
| 34. | Woodbine Borough | 7.2% | 2.4%(+4.80)#34 | 3.1%(+4.10)#4,476 |
| 35. | Passaic | 7.1% | 2.4%(+4.70)#35 | 3.1%(+4.00)#4,509 |
| 36. | Pleasantville | 7.0% | 2.4%(+4.60)#36 | 3.1%(+3.90)#4,610 |
| 37. | Salem | 7.0% | 2.4%(+4.60)#37 | 3.1%(+3.90)#4,626 |
| 38. | Silver Lake Cdp Essex County | 7.0% | 2.4%(+4.60)#38 | 3.1%(+3.90)#4,632 |
| 39. | Brooklawn Borough | 7.0% | 2.4%(+4.60)#39 | 3.1%(+3.90)#4,646 |
| 40. | Somerdale Borough | 6.9% | 2.4%(+4.50)#40 | 3.1%(+3.80)#4,710 |
| 41. | Deal Borough | 6.9% | 2.4%(+4.50)#41 | 3.1%(+3.80)#4,761 |
| 42. | Loch Arbour | 6.8% | 2.4%(+4.40)#42 | 3.1%(+3.70)#4,859 |
| 43. | Phillipsburg | 6.7% | 2.4%(+4.30)#43 | 3.1%(+3.60)#4,874 |
| 44. | Thorofare | 6.7% | 2.4%(+4.30)#44 | 3.1%(+3.60)#4,897 |
| 45. | Long Branch | 6.6% | 2.4%(+4.20)#45 | 3.1%(+3.50)#4,958 |
| 46. | East Orange | 6.5% | 2.4%(+4.10)#46 | 3.1%(+3.40)#5,051 |
| 47. | West Park | 6.5% | 2.4%(+4.10)#47 | 3.1%(+3.40)#5,103 |
| 48. | Paterson | 6.4% | 2.4%(+4.00)#48 | 3.1%(+3.30)#5,157 |
| 49. | Westville Borough | 6.4% | 2.4%(+4.00)#49 | 3.1%(+3.30)#5,198 |
| 50. | Sussex Borough | 6.3% | 2.4%(+3.90)#50 | 3.1%(+3.20)#5,292 |
| 51. | Bridgeton | 6.2% | 2.4%(+3.80)#51 | 3.1%(+3.10)#5,379 |
| 52. | Landing | 6.2% | 2.4%(+3.80)#52 | 3.1%(+3.10)#5,405 |
| 53. | Brigantine | 6.1% | 2.4%(+3.70)#53 | 3.1%(+3.00)#5,500 |
| 54. | Union City | 6.0% | 2.4%(+3.60)#54 | 3.1%(+2.90)#5,588 |
| 55. | Browns Mills | 5.9% | 2.4%(+3.50)#55 | 3.1%(+2.80)#5,735 |
| 56. | Woodlynne Borough | 5.9% | 2.4%(+3.50)#56 | 3.1%(+2.80)#5,755 |
| 57. | Long Valley | 5.9% | 2.4%(+3.50)#57 | 3.1%(+2.80)#5,765 |
| 58. | Perth Amboy | 5.7% | 2.4%(+3.30)#58 | 3.1%(+2.60)#5,948 |
| 59. | Port Norris | 5.7% | 2.4%(+3.30)#59 | 3.1%(+2.60)#6,001 |
| 60. | Atco | 5.5% | 2.4%(+3.10)#60 | 3.1%(+2.40)#6,237 |
| 61. | Wildwood | 5.4% | 2.4%(+3.00)#61 | 3.1%(+2.30)#6,364 |
| 62. | Annandale | 5.4% | 2.4%(+3.00)#62 | 3.1%(+2.30)#6,384 |
| 63. | Jobstown | 5.3% | 2.4%(+2.90)#63 | 3.1%(+2.20)#6,587 |
| 64. | Wharton Borough | 5.2% | 2.4%(+2.80)#64 | 3.1%(+2.10)#6,650 |
| 65. | East Newark Borough | 5.2% | 2.4%(+2.80)#65 | 3.1%(+2.10)#6,673 |
| 66. | Elmwood Park Borough | 5.0% | 2.4%(+2.60)#66 | 3.1%(+1.90)#6,891 |
| 67. | Longport Borough | 5.0% | 2.4%(+2.60)#67 | 3.1%(+1.90)#6,989 |
| 68. | Runnemede Borough | 4.9% | 2.4%(+2.50)#68 | 3.1%(+1.80)#7,079 |
| 69. | Hamburg Borough | 4.9% | 2.4%(+2.50)#69 | 3.1%(+1.80)#7,104 |
| 70. | Waretown | 4.9% | 2.4%(+2.50)#70 | 3.1%(+1.80)#7,122 |
| 71. | Haledon Borough | 4.8% | 2.4%(+2.40)#71 | 3.1%(+1.70)#7,233 |
| 72. | New Vernon | 4.7% | 2.4%(+2.30)#72 | 3.1%(+1.60)#7,451 |
| 73. | Washington Borough | 4.6% | 2.4%(+2.20)#73 | 3.1%(+1.50)#7,526 |
| 74. | Holiday Heights | 4.5% | 2.4%(+2.10)#74 | 3.1%(+1.40)#7,706 |
| 75. | Bedminster | 4.5% | 2.4%(+2.10)#75 | 3.1%(+1.40)#7,724 |
| 76. | Cedarville | 4.5% | 2.4%(+2.10)#76 | 3.1%(+1.40)#7,768 |
| 77. | Jersey City | 4.4% | 2.4%(+2.00)#77 | 3.1%(+1.30)#7,811 |
| 78. | Manville Borough | 4.4% | 2.4%(+2.00)#78 | 3.1%(+1.30)#7,845 |
| 79. | Carneys Point | 4.4% | 2.4%(+2.00)#79 | 3.1%(+1.30)#7,854 |
| 80. | Wood Ridge Borough | 4.3% | 2.4%(+1.90)#80 | 3.1%(+1.20)#7,997 |
| 81. | Oradell Borough | 4.3% | 2.4%(+1.90)#81 | 3.1%(+1.20)#8,005 |
| 82. | Frenchtown Borough | 4.3% | 2.4%(+1.90)#82 | 3.1%(+1.20)#8,061 |
| 83. | Garfield | 4.2% | 2.4%(+1.80)#83 | 3.1%(+1.10)#8,182 |
| 84. | Eatontown Borough | 4.2% | 2.4%(+1.80)#84 | 3.1%(+1.10)#8,207 |
| 85. | Country Lake Estates | 4.2% | 2.4%(+1.80)#85 | 3.1%(+1.10)#8,232 |
| 86. | Englishtown Borough | 4.2% | 2.4%(+1.80)#86 | 3.1%(+1.10)#8,248 |
| 87. | Quinton | 4.2% | 2.4%(+1.80)#87 | 3.1%(+1.10)#8,306 |
| 88. | Harrison | 4.1% | 2.4%(+1.70)#88 | 3.1%(+1.000)#8,361 |
| 89. | Ridgefield Park | 4.1% | 2.4%(+1.70)#89 | 3.1%(+1.000)#8,370 |
| 90. | Kingston | 4.1% | 2.4%(+1.70)#90 | 3.1%(+1.000)#8,461 |
| 91. | Lodi Borough | 4.0% | 2.4%(+1.60)#91 | 3.1%(+0.900)#8,567 |
| 92. | Palisades Park Borough | 4.0% | 2.4%(+1.60)#92 | 3.1%(+0.900)#8,570 |
| 93. | Belvidere | 4.0% | 2.4%(+1.60)#93 | 3.1%(+0.900)#8,633 |
| 94. | Montvale Borough | 3.9% | 2.4%(+1.50)#94 | 3.1%(+0.800)#8,780 |
| 95. | Cliffside Park Borough | 3.8% | 2.4%(+1.40)#95 | 3.1%(+0.700)#8,936 |
| 96. | Absecon | 3.8% | 2.4%(+1.40)#96 | 3.1%(+0.700)#8,968 |
| 97. | Englewood | 3.7% | 2.4%(+1.30)#97 | 3.1%(+0.600)#9,142 |
| 98. | Somers Point | 3.7% | 2.4%(+1.30)#98 | 3.1%(+0.600)#9,166 |
| 99. | Victory Lakes | 3.7% | 2.4%(+1.30)#99 | 3.1%(+0.600)#9,243 |
| 100. | Woodland Park Borough | 3.6% | 2.4%(+1.20)#100 | 3.1%(+0.500)#9,357 |
Common Questions
What are the Top 10 Cities with the Highest Percentage of Families with Income Below $10,000 in New Jersey?
Top 10 Cities with the Highest Percentage of Families with Income Below $10,000 in New Jersey are:
#1
14.2%
#2
13.6%
#3
13.4%
#4
13.2%
#5
11.1%
#6
9.8%
#7
9.4%
#8
9.4%
#9
9.2%
#10
8.7%
What city has the Highest Percentage of Families with Income Below $10,000 in New Jersey?
Seabrook Farms has the Highest Percentage of Families with Income Below $10,000 in New Jersey with 14.2%.
What is the Percentage of Families with Income Below $10,000 in the State of New Jersey?
Percentage of Families with Income Below $10,000 in New Jersey is 2.4%.
What is the Percentage of Families with Income Below $10,000 in the United States?
Percentage of Families with Income Below $10,000 in the United States is 3.1%.