Stratford, CA Map & Demographics
Stratford Map
Stratford Overview
$18,674
PER CAPITA INCOME
7.6%
WAGE / INCOME GAP [ % ]
92.4¢/ $1
WAGE / INCOME GAP [ $ ]
0.34
INEQUALITY / GINI INDEX
1,034
TOTAL POPULATION
534
MALE POPULATION
500
FEMALE POPULATION
106.80
MALES / 100 FEMALES
93.63
FEMALES / 100 MALES
22.7
MEDIAN AGE
5.5
AVG FAMILY SIZE
5.4
AVG HOUSEHOLD SIZE
398
LABOR FORCE [ PEOPLE ]
58.4%
PERCENT IN LABOR FORCE
3.5%
UNEMPLOYMENT RATE
Stratford Zip Codes
Stratford Area Codes
Income in Stratford
Income Overview in Stratford
| Characteristic | Number | Measure |
| Per Capita Income | 1,034 | $18,674 |
| Median Family Income | 168 | $0 |
| Mean Family Income | 168 | $98,545 |
| Median Household Income | 191 | $0 |
| Mean Household Income | 191 | $96,579 |
| Income Deficit | 168 | $0 |
| Wage / Income Gap (%) | 1,034 | 7.64% |
| Wage / Income Gap ($) | 1,034 | 92.36¢ per $1 |
| Gini / Inequality Index | 1,034 | 0.34 |
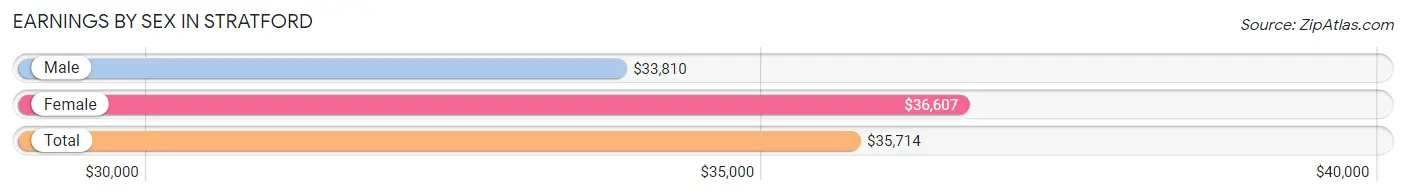
Earnings by Sex in Stratford
Average Earnings in Stratford are $35,714, $33,810 for men and $36,607 for women, a difference of 7.6%.
| Sex | Number | Average Earnings |
| Male | 240 (62.5%) | $33,810 |
| Female | 144 (37.5%) | $36,607 |
| Total | 384 (100.0%) | $35,714 |
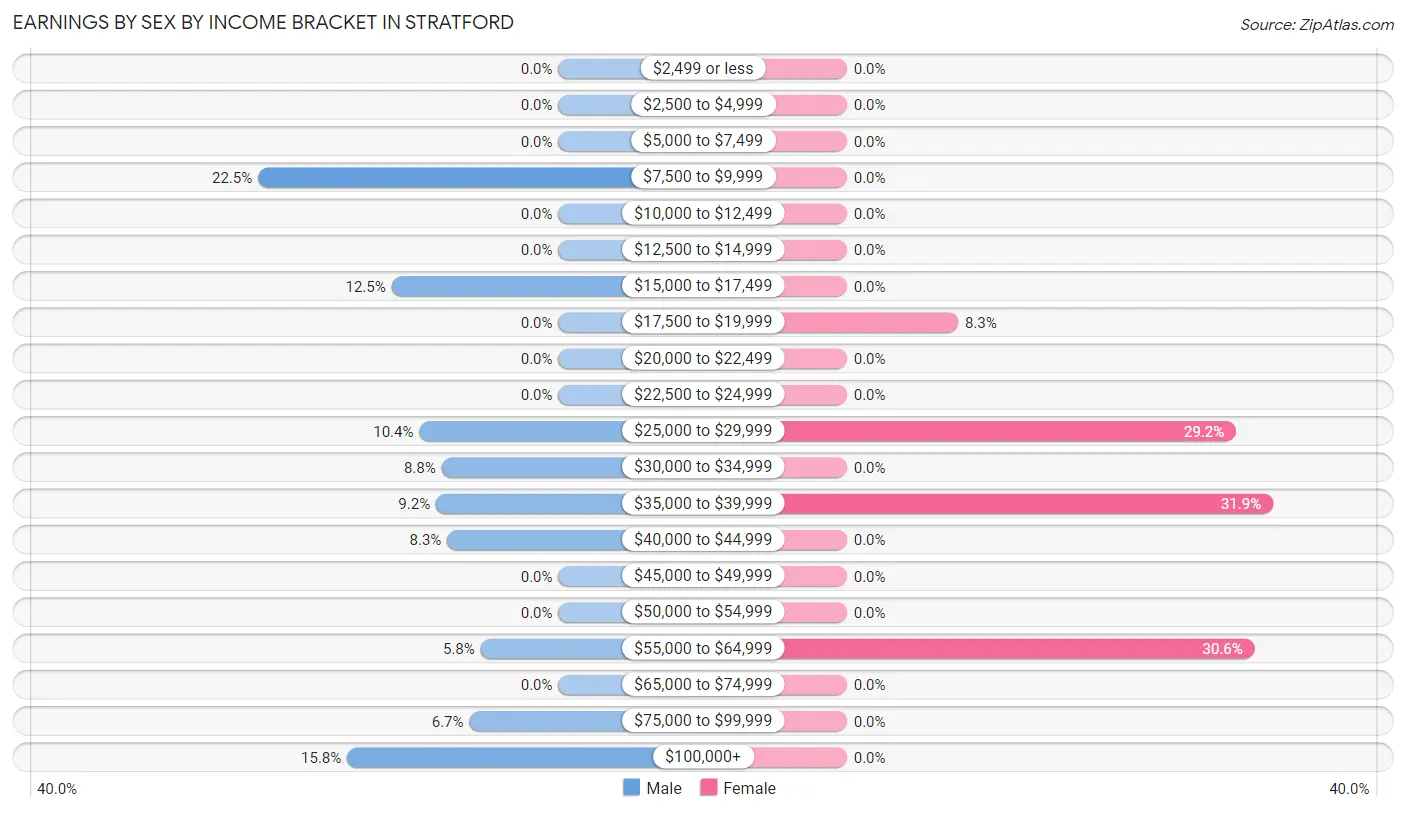
Earnings by Sex by Income Bracket in Stratford
The most common earnings brackets in Stratford are $7,500 to $9,999 for men (54 | 22.5%) and $35,000 to $39,999 for women (46 | 31.9%).
| Income | Male | Female |
| $2,499 or less | 0 (0.0%) | 0 (0.0%) |
| $2,500 to $4,999 | 0 (0.0%) | 0 (0.0%) |
| $5,000 to $7,499 | 0 (0.0%) | 0 (0.0%) |
| $7,500 to $9,999 | 54 (22.5%) | 0 (0.0%) |
| $10,000 to $12,499 | 0 (0.0%) | 0 (0.0%) |
| $12,500 to $14,999 | 0 (0.0%) | 0 (0.0%) |
| $15,000 to $17,499 | 30 (12.5%) | 0 (0.0%) |
| $17,500 to $19,999 | 0 (0.0%) | 12 (8.3%) |
| $20,000 to $22,499 | 0 (0.0%) | 0 (0.0%) |
| $22,500 to $24,999 | 0 (0.0%) | 0 (0.0%) |
| $25,000 to $29,999 | 25 (10.4%) | 42 (29.2%) |
| $30,000 to $34,999 | 21 (8.7%) | 0 (0.0%) |
| $35,000 to $39,999 | 22 (9.2%) | 46 (31.9%) |
| $40,000 to $44,999 | 20 (8.3%) | 0 (0.0%) |
| $45,000 to $49,999 | 0 (0.0%) | 0 (0.0%) |
| $50,000 to $54,999 | 0 (0.0%) | 0 (0.0%) |
| $55,000 to $64,999 | 14 (5.8%) | 44 (30.6%) |
| $65,000 to $74,999 | 0 (0.0%) | 0 (0.0%) |
| $75,000 to $99,999 | 16 (6.7%) | 0 (0.0%) |
| $100,000+ | 38 (15.8%) | 0 (0.0%) |
| Total | 240 (100.0%) | 144 (100.0%) |
Earnings by Sex by Educational Attainment in Stratford
| Educational Attainment | Male Income | Female Income |
| Less than High School | - | - |
| High School Diploma | - | - |
| College or Associate's Degree | - | - |
| Bachelor's Degree | - | - |
| Graduate Degree | - | - |
| Total | $37,784 | $27,351 |
Family Income in Stratford
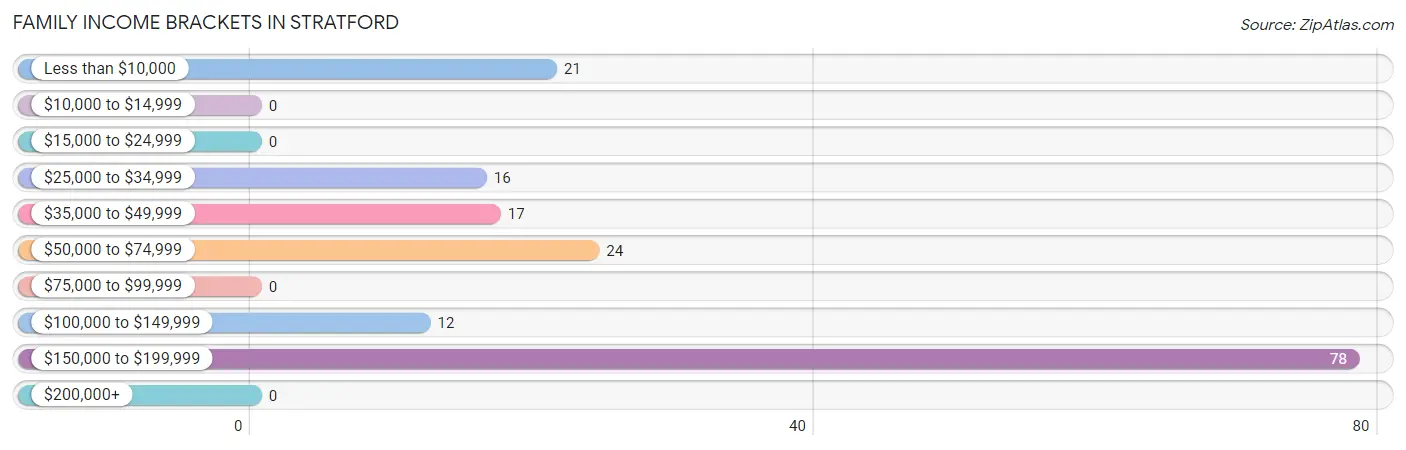
Family Income Brackets in Stratford
According to the Stratford family income data, there are 78 families falling into the $150,000 to $199,999 income range, which is the most common income bracket and makes up 46.4% of all families.
| Income Bracket | # Families | % Families |
| Less than $10,000 | 21 | 12.5% |
| $10,000 to $14,999 | 0 | 0.0% |
| $15,000 to $24,999 | 0 | 0.0% |
| $25,000 to $34,999 | 16 | 9.5% |
| $35,000 to $49,999 | 17 | 10.1% |
| $50,000 to $74,999 | 24 | 14.3% |
| $75,000 to $99,999 | 0 | 0.0% |
| $100,000 to $149,999 | 12 | 7.1% |
| $150,000 to $199,999 | 78 | 46.4% |
| $200,000+ | 0 | 0.0% |
Family Income by Famaliy Size in Stratford
| Income Bracket | # Families | Median Income |
| 2-Person Families | 17 (10.1%) | $0 |
| 3-Person Families | 0 (0.0%) | $0 |
| 4-Person Families | 38 (22.6%) | $0 |
| 5-Person Families | 61 (36.3%) | $0 |
| 6-Person Families | 0 (0.0%) | $0 |
| 7+ Person Families | 52 (30.9%) | $0 |
| Total | 168 (100.0%) | $0 |
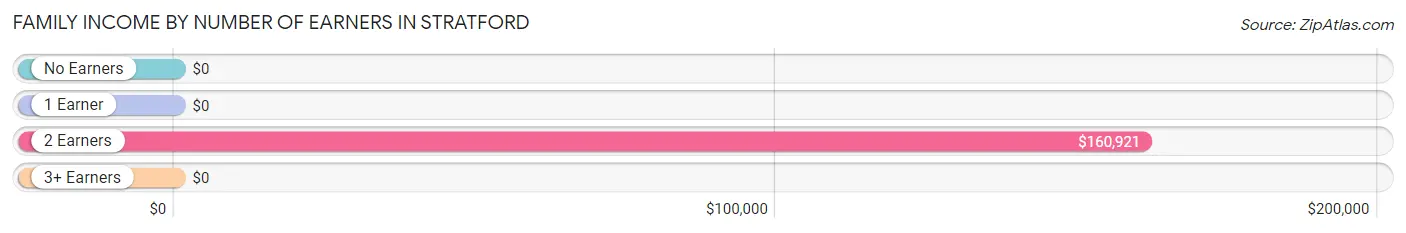
Family Income by Number of Earners in Stratford
| Number of Earners | # Families | Median Income |
| No Earners | 21 (12.5%) | $0 |
| 1 Earner | 33 (19.6%) | $0 |
| 2 Earners | 100 (59.5%) | $160,921 |
| 3+ Earners | 14 (8.3%) | $0 |
| Total | 168 (100.0%) | $0 |
Household Income in Stratford
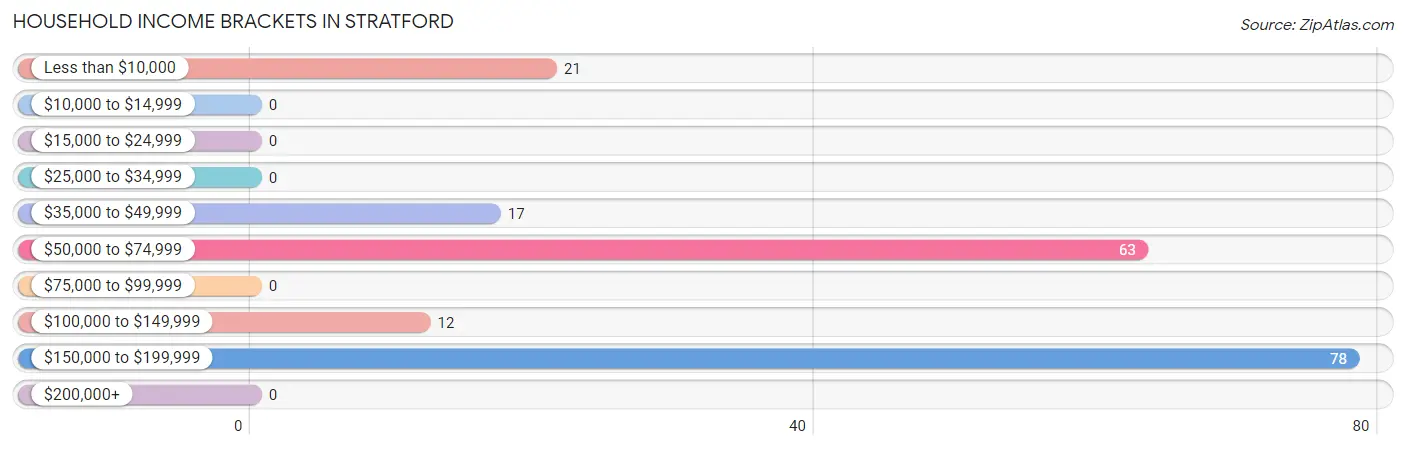
Household Income Brackets in Stratford
With 78 households falling in the category, the $150,000 to $199,999 income range is the most frequent in Stratford, accounting for 40.8% of all households.
| Income Bracket | # Households | % Households |
| Less than $10,000 | 21 | 11.0% |
| $10,000 to $14,999 | 0 | 0.0% |
| $15,000 to $24,999 | 0 | 0.0% |
| $25,000 to $34,999 | 0 | 0.0% |
| $35,000 to $49,999 | 17 | 8.9% |
| $50,000 to $74,999 | 63 | 33.0% |
| $75,000 to $99,999 | 0 | 0.0% |
| $100,000 to $149,999 | 12 | 6.3% |
| $150,000 to $199,999 | 78 | 40.8% |
| $200,000+ | 0 | 0.0% |
Household Income by Householder Age in Stratford
| Income Bracket | # Households | Median Income |
| 15 to 24 Years | 0 (0.0%) | $0 |
| 25 to 44 Years | 28 (14.7%) | $0 |
| 45 to 64 Years | 137 (71.7%) | $0 |
| 65+ Years | 26 (13.6%) | $0 |
| Total | 191 (100.0%) | $0 |
Poverty in Stratford
Income Below Poverty by Sex and Age in Stratford
With 13.5% poverty level for males and 31.0% for females among the residents of Stratford, 12 to 14 year old males and 18 to 24 year old females are the most vulnerable to poverty, with 17 males (100.0%) and 54 females (56.8%) in their respective age groups living below the poverty level.
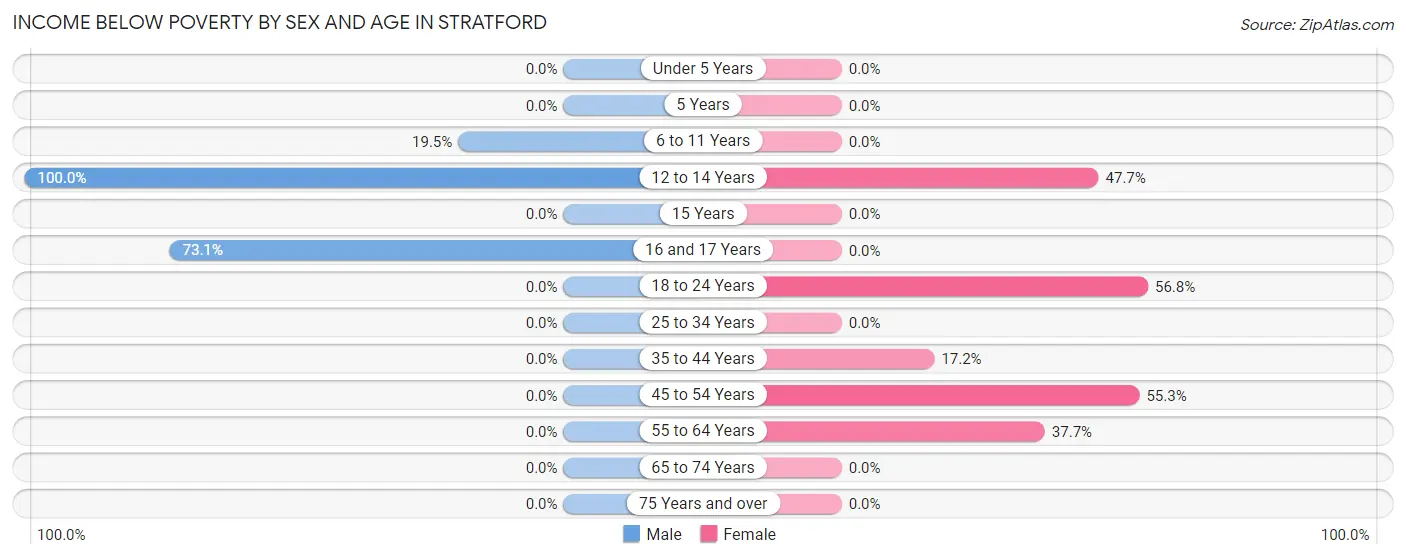
| Age Bracket | Male | Female |
| Under 5 Years | 0 (0.0%) | 0 (0.0%) |
| 5 Years | 0 (0.0%) | 0 (0.0%) |
| 6 to 11 Years | 17 (19.5%) | 0 (0.0%) |
| 12 to 14 Years | 17 (100.0%) | 41 (47.7%) |
| 15 Years | 0 (0.0%) | 0 (0.0%) |
| 16 and 17 Years | 38 (73.1%) | 0 (0.0%) |
| 18 to 24 Years | 0 (0.0%) | 54 (56.8%) |
| 25 to 34 Years | 0 (0.0%) | 0 (0.0%) |
| 35 to 44 Years | 0 (0.0%) | 16 (17.2%) |
| 45 to 54 Years | 0 (0.0%) | 21 (55.3%) |
| 55 to 64 Years | 0 (0.0%) | 23 (37.7%) |
| 65 to 74 Years | 0 (0.0%) | 0 (0.0%) |
| 75 Years and over | 0 (0.0%) | 0 (0.0%) |
| Total | 72 (13.5%) | 155 (31.0%) |
Income Above Poverty by Sex and Age in Stratford
According to the poverty statistics in Stratford, males aged under 5 years and females aged under 5 years are the age groups that are most secure financially, with 100.0% of males and 100.0% of females in these age groups living above the poverty line.
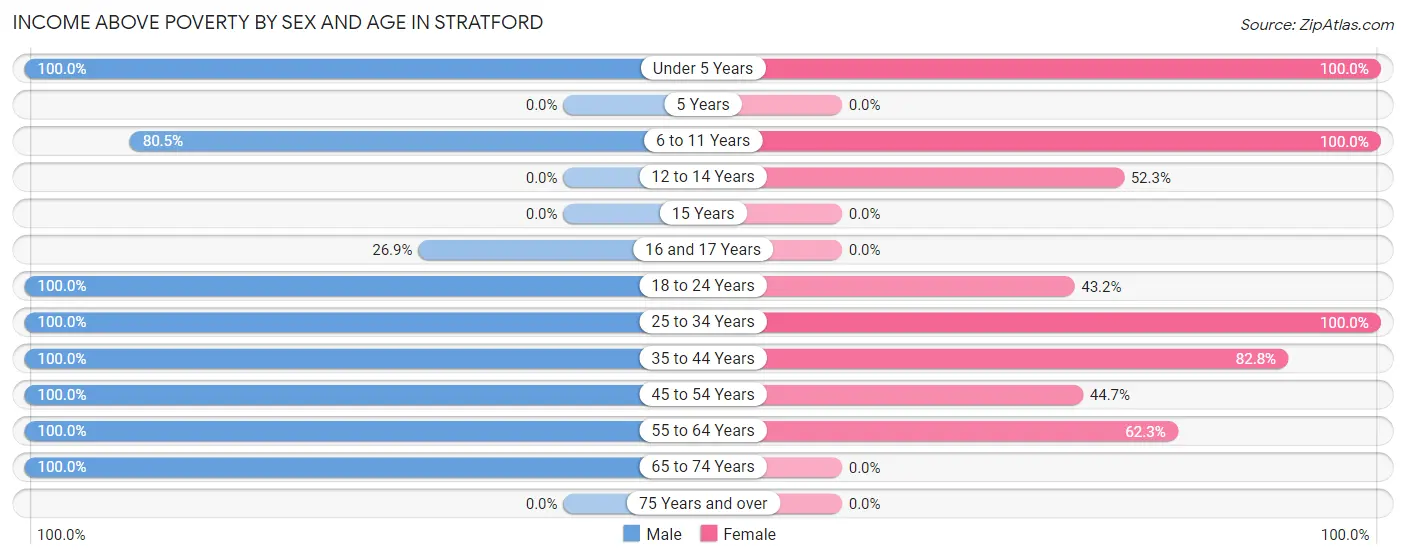
| Age Bracket | Male | Female |
| Under 5 Years | 61 (100.0%) | 15 (100.0%) |
| 5 Years | 0 (0.0%) | 0 (0.0%) |
| 6 to 11 Years | 70 (80.5%) | 86 (100.0%) |
| 12 to 14 Years | 0 (0.0%) | 45 (52.3%) |
| 15 Years | 0 (0.0%) | 0 (0.0%) |
| 16 and 17 Years | 14 (26.9%) | 0 (0.0%) |
| 18 to 24 Years | 54 (100.0%) | 41 (43.2%) |
| 25 to 34 Years | 52 (100.0%) | 26 (100.0%) |
| 35 to 44 Years | 113 (100.0%) | 77 (82.8%) |
| 45 to 54 Years | 38 (100.0%) | 17 (44.7%) |
| 55 to 64 Years | 34 (100.0%) | 38 (62.3%) |
| 65 to 74 Years | 26 (100.0%) | 0 (0.0%) |
| 75 Years and over | 0 (0.0%) | 0 (0.0%) |
| Total | 462 (86.5%) | 345 (69.0%) |
Income Below Poverty Among Married-Couple Families in Stratford
| Children | Above Poverty | Below Poverty |
| No Children | 0 (0.0%) | 0 (0.0%) |
| 1 or 2 Children | 26 (100.0%) | 0 (0.0%) |
| 3 or 4 Children | 0 (0.0%) | 0 (0.0%) |
| 5 or more Children | 38 (100.0%) | 0 (0.0%) |
| Total | 64 (100.0%) | 0 (0.0%) |
Income Below Poverty Among Single-Parent Households in Stratford
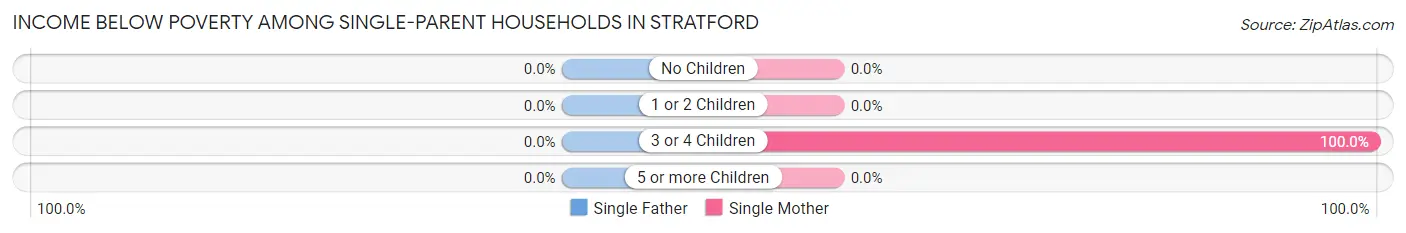
| Children | Single Father | Single Mother |
| No Children | 0 (0.0%) | 0 (0.0%) |
| 1 or 2 Children | 0 (0.0%) | 0 (0.0%) |
| 3 or 4 Children | 0 (0.0%) | 37 (100.0%) |
| 5 or more Children | 0 (0.0%) | 0 (0.0%) |
| Total | 0 (0.0%) | 37 (47.4%) |
Income Below Poverty Among Married-Couple vs Single-Parent Households in Stratford
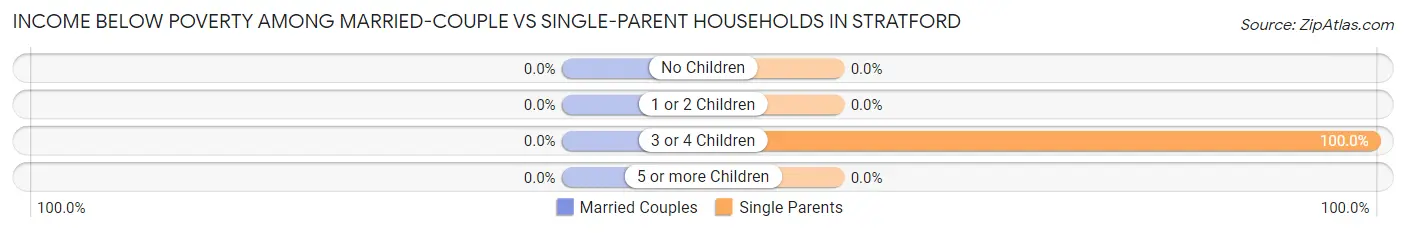
| Children | Married-Couple Families | Single-Parent Households |
| No Children | 0 (0.0%) | 0 (0.0%) |
| 1 or 2 Children | 0 (0.0%) | 0 (0.0%) |
| 3 or 4 Children | 0 (0.0%) | 37 (100.0%) |
| 5 or more Children | 0 (0.0%) | 0 (0.0%) |
| Total | 0 (0.0%) | 37 (35.6%) |
Race in Stratford
The most populous races in Stratford are Hispanic or Latino (673 | 65.1%), White / Caucasian (634 | 61.3%), and Some other Race (400 | 38.7%).
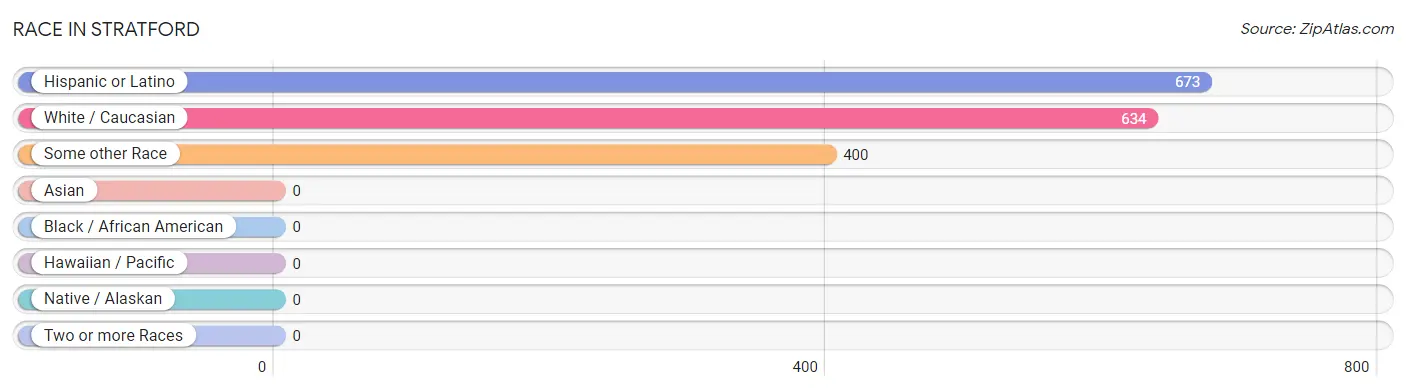
| Race | # Population | % Population |
| Asian | 0 | 0.0% |
| Black / African American | 0 | 0.0% |
| Hawaiian / Pacific | 0 | 0.0% |
| Hispanic or Latino | 673 | 65.1% |
| Native / Alaskan | 0 | 0.0% |
| White / Caucasian | 634 | 61.3% |
| Two or more Races | 0 | 0.0% |
| Some other Race | 400 | 38.7% |
| Total | 1,034 | 100.0% |
Ancestry in Stratford
The most populous ancestries reported in Stratford are Mexican (631 | 61.0%), Portuguese (264 | 25.5%), and Irish (54 | 5.2%), together accounting for 91.8% of all Stratford residents.
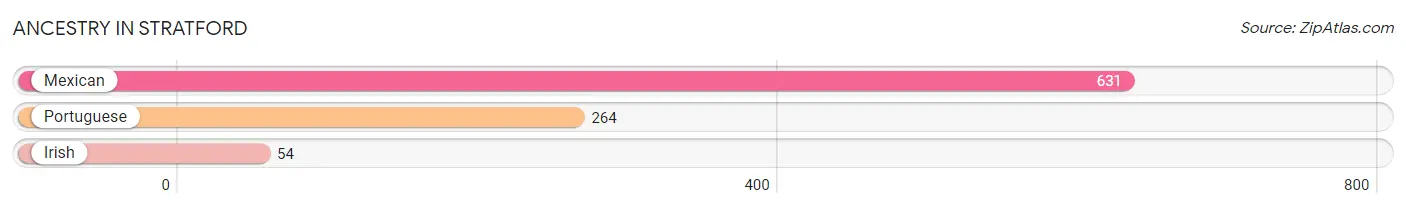
| Ancestry | # Population | % Population |
| Irish | 54 | 5.2% |
| Mexican | 631 | 61.0% |
| Portuguese | 264 | 25.5% | View All 3 Rows |
Immigrants in Stratford
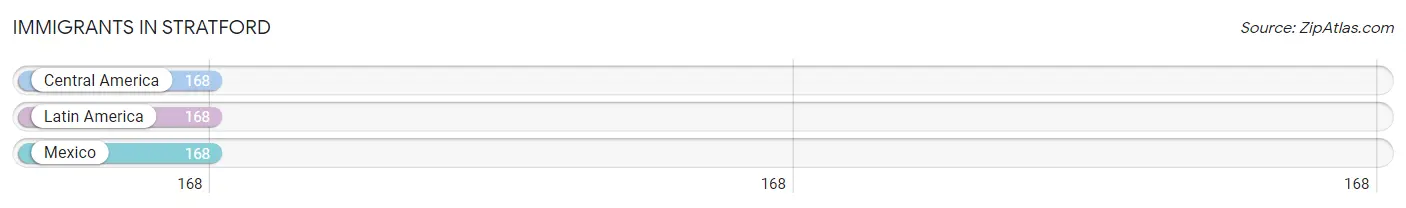
The most numerous immigrant groups reported in Stratford came from Central America (168 | 16.3%), Latin America (168 | 16.3%), and Mexico (168 | 16.3%), together accounting for 48.8% of all Stratford residents.
| Immigration Origin | # Population | % Population |
| Central America | 168 | 16.3% |
| Latin America | 168 | 16.3% |
| Mexico | 168 | 16.3% | View All 3 Rows |
Sex and Age in Stratford
Sex and Age in Stratford
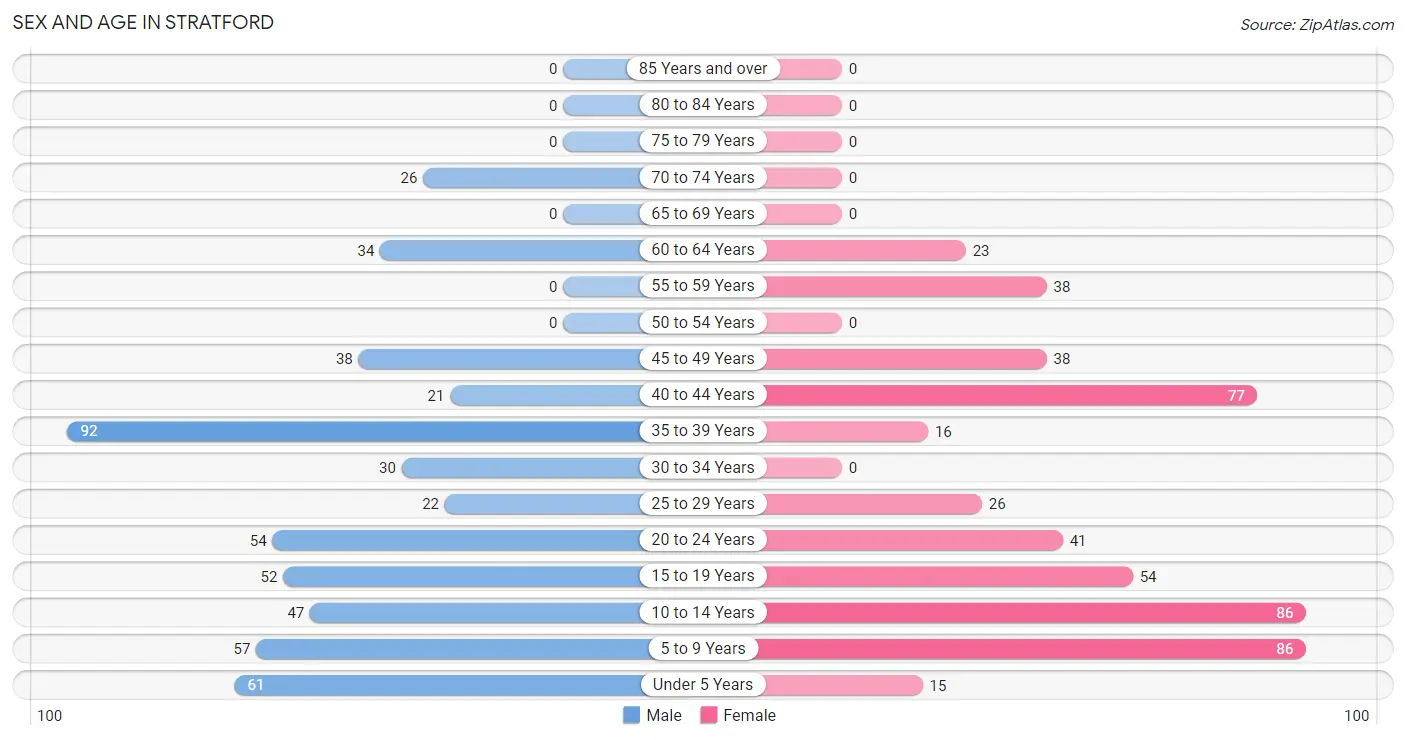
The most populous age groups in Stratford are 35 to 39 Years (92 | 17.2%) for men and 5 to 9 Years (86 | 17.2%) for women.
| Age Bracket | Male | Female |
| Under 5 Years | 61 (11.4%) | 15 (3.0%) |
| 5 to 9 Years | 57 (10.7%) | 86 (17.2%) |
| 10 to 14 Years | 47 (8.8%) | 86 (17.2%) |
| 15 to 19 Years | 52 (9.7%) | 54 (10.8%) |
| 20 to 24 Years | 54 (10.1%) | 41 (8.2%) |
| 25 to 29 Years | 22 (4.1%) | 26 (5.2%) |
| 30 to 34 Years | 30 (5.6%) | 0 (0.0%) |
| 35 to 39 Years | 92 (17.2%) | 16 (3.2%) |
| 40 to 44 Years | 21 (3.9%) | 77 (15.4%) |
| 45 to 49 Years | 38 (7.1%) | 38 (7.6%) |
| 50 to 54 Years | 0 (0.0%) | 0 (0.0%) |
| 55 to 59 Years | 0 (0.0%) | 38 (7.6%) |
| 60 to 64 Years | 34 (6.4%) | 23 (4.6%) |
| 65 to 69 Years | 0 (0.0%) | 0 (0.0%) |
| 70 to 74 Years | 26 (4.9%) | 0 (0.0%) |
| 75 to 79 Years | 0 (0.0%) | 0 (0.0%) |
| 80 to 84 Years | 0 (0.0%) | 0 (0.0%) |
| 85 Years and over | 0 (0.0%) | 0 (0.0%) |
| Total | 534 (100.0%) | 500 (100.0%) |
Families and Households in Stratford
Median Family Size in Stratford
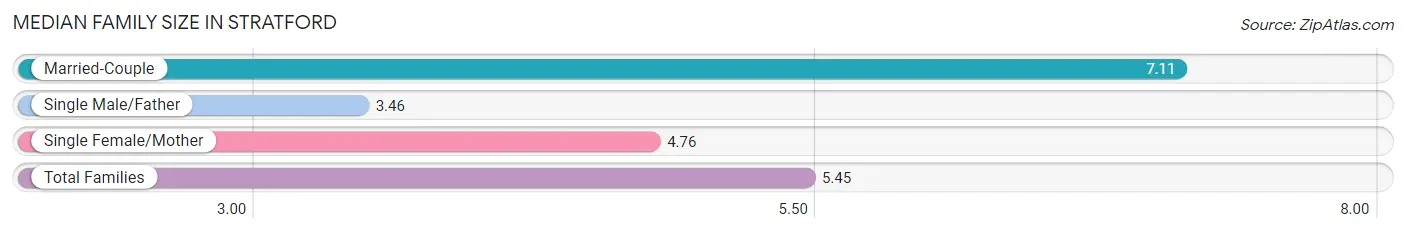
The median family size in Stratford is 5.45 persons per family, with married-couple families (64 | 38.1%) accounting for the largest median family size of 7.11 persons per family. On the other hand, single male/father families (26 | 15.5%) represent the smallest median family size with 3.46 persons per family.
| Family Type | # Families | Family Size |
| Married-Couple | 64 (38.1%) | 7.11 |
| Single Male/Father | 26 (15.5%) | 3.46 |
| Single Female/Mother | 78 (46.4%) | 4.76 |
| Total Families | 168 (100.0%) | 5.45 |
Median Household Size in Stratford
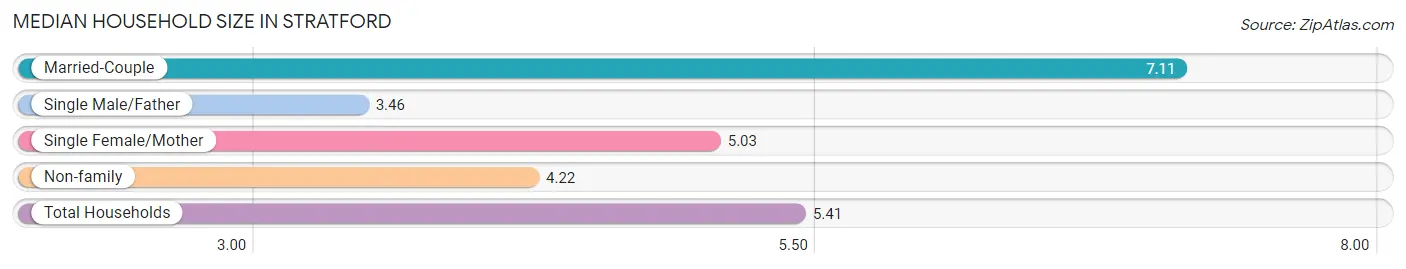
The median household size in Stratford is 5.41 persons per household, with married-couple households (64 | 33.5%) accounting for the largest median household size of 7.11 persons per household. single male/father households (26 | 13.6%) represent the smallest median household size with 3.46 persons per household.
| Household Type | # Households | Household Size |
| Married-Couple | 64 (33.5%) | 7.11 |
| Single Male/Father | 26 (13.6%) | 3.46 |
| Single Female/Mother | 78 (40.8%) | 5.03 |
| Non-family | 23 (12.0%) | 4.22 |
| Total Households | 191 (100.0%) | 5.41 |
Household Size by Marriage Status in Stratford
Out of a total of 191 households in Stratford, 168 (88.0%) are family households, while 23 (12.0%) are nonfamily households. The most numerous type of family households are 7+ person households, comprising 52, and the most common type of nonfamily households are 3-person households, comprising 23.
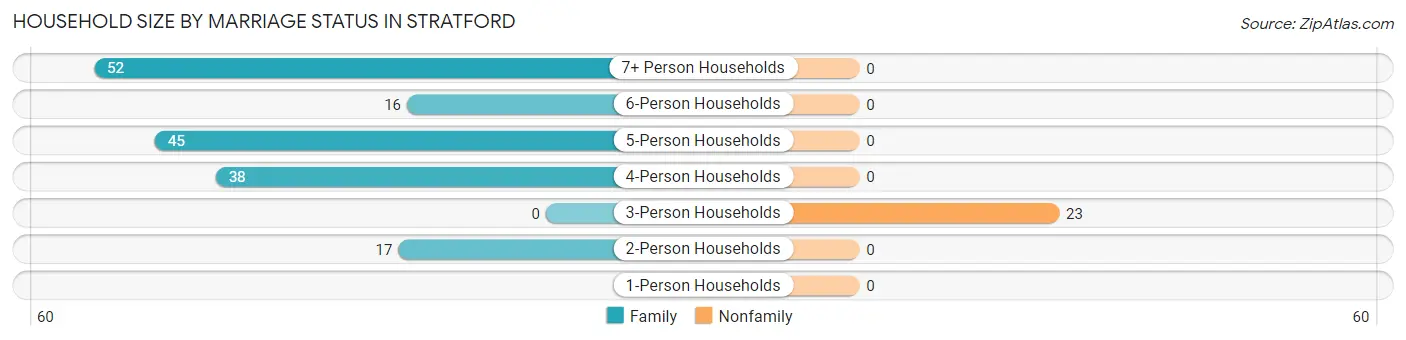
| Household Size | Family Households | Nonfamily Households |
| 1-Person Households | - | 0 (0.0%) |
| 2-Person Households | 17 (8.9%) | 0 (0.0%) |
| 3-Person Households | 0 (0.0%) | 23 (12.0%) |
| 4-Person Households | 38 (19.9%) | 0 (0.0%) |
| 5-Person Households | 45 (23.6%) | 0 (0.0%) |
| 6-Person Households | 16 (8.4%) | 0 (0.0%) |
| 7+ Person Households | 52 (27.2%) | 0 (0.0%) |
| Total | 168 (88.0%) | 23 (12.0%) |
Female Fertility in Stratford
Fertility by Age in Stratford
| Age Bracket | Women with Births | Births / 1,000 Women |
| 15 to 19 years | 0 (0.0%) | 0.0 |
| 20 to 34 years | 0 (0.0%) | 0.0 |
| 35 to 50 years | 0 (0.0%) | 0.0 |
| Total | 0 (0.0%) | 0.0 |
Fertility by Age by Marriage Status in Stratford
| Age Bracket | Married | Unmarried |
| 15 to 19 years | 0 (0.0%) | 0 (0.0%) |
| 20 to 34 years | 0 (0.0%) | 0 (0.0%) |
| 35 to 50 years | 0 (0.0%) | 0 (0.0%) |
| Total | 0 (0.0%) | 0 (0.0%) |
Fertility by Education in Stratford
| Educational Attainment | Women with Births | Births / 1,000 Women |
| Less than High School | 0 (0.0%) | 0.0 |
| High School Diploma | 0 (0.0%) | 0.0 |
| College or Associate's Degree | 0 (0.0%) | 0.0 |
| Bachelor's Degree | 0 (0.0%) | 0.0 |
| Graduate Degree | 0 (0.0%) | 0.0 |
| Total | 0 (0.0%) | 0.0 |
Fertility by Education by Marriage Status in Stratford
| Educational Attainment | Married | Unmarried |
| Less than High School | 0 (0.0%) | 0 (0.0%) |
| High School Diploma | 0 (0.0%) | 0 (0.0%) |
| College or Associate's Degree | 0 (0.0%) | 0 (0.0%) |
| Bachelor's Degree | 0 (0.0%) | 0 (0.0%) |
| Graduate Degree | 0 (0.0%) | 0 (0.0%) |
| Total | 0 (0.0%) | 0 (0.0%) |
Employment Characteristics in Stratford
Employment by Class of Employer in Stratford
Among the 346 employed individuals in Stratford, private company employees (275 | 79.5%), local government employees (51 | 14.7%), and state government employees (20 | 5.8%) make up the most common classes of employment.
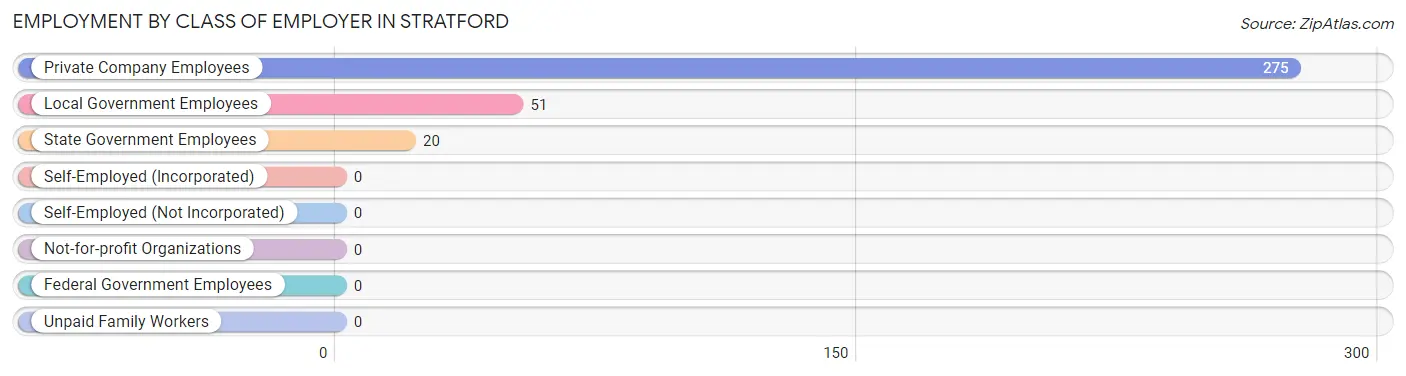
| Employer Class | # Employees | % Employees |
| Private Company Employees | 275 | 79.5% |
| Self-Employed (Incorporated) | 0 | 0.0% |
| Self-Employed (Not Incorporated) | 0 | 0.0% |
| Not-for-profit Organizations | 0 | 0.0% |
| Local Government Employees | 51 | 14.7% |
| State Government Employees | 20 | 5.8% |
| Federal Government Employees | 0 | 0.0% |
| Unpaid Family Workers | 0 | 0.0% |
| Total | 346 | 100.0% |
Employment Status by Age in Stratford
According to the labor force statistics for Stratford, out of the total population over 16 years of age (682), 58.4% or 398 individuals are in the labor force, with 3.5% or 14 of them unemployed. The age group with the highest labor force participation rate is 30 to 34 years, with 100.0% or 30 individuals in the labor force. Within the labor force, the 55 to 59 years age range has the highest percentage of unemployed individuals, with 100.0% or 14 of them being unemployed.
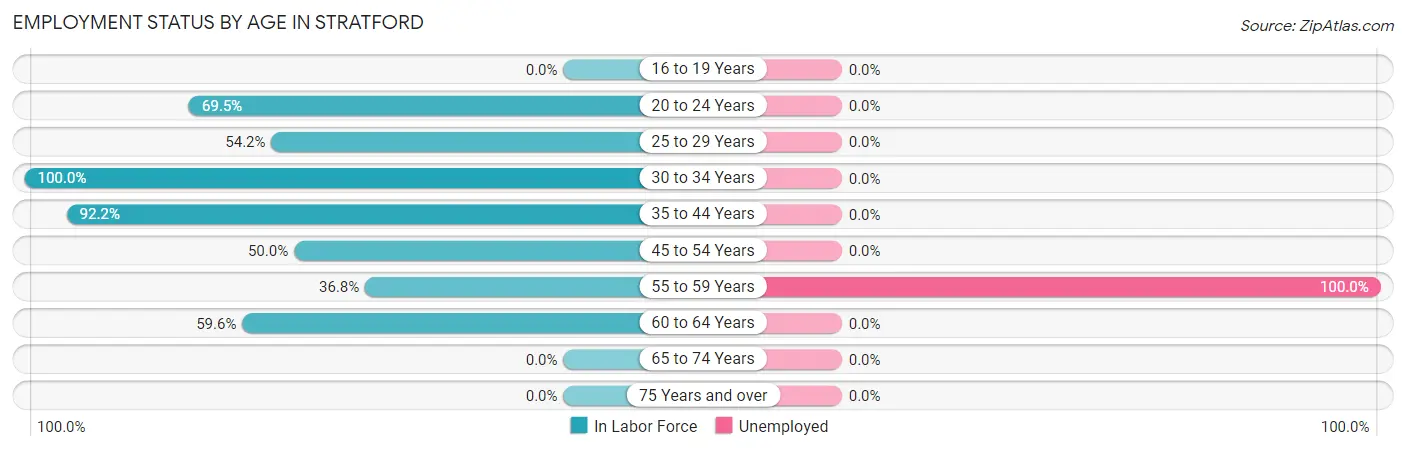
| Age Bracket | In Labor Force | Unemployed |
| 16 to 19 Years | 0 (0.0%) | 0 (0.0%) |
| 20 to 24 Years | 66 (69.5%) | 0 (0.0%) |
| 25 to 29 Years | 26 (54.2%) | 0 (0.0%) |
| 30 to 34 Years | 30 (100.0%) | 0 (0.0%) |
| 35 to 44 Years | 190 (92.2%) | 0 (0.0%) |
| 45 to 54 Years | 38 (50.0%) | 0 (0.0%) |
| 55 to 59 Years | 14 (36.8%) | 14 (100.0%) |
| 60 to 64 Years | 34 (59.6%) | 0 (0.0%) |
| 65 to 74 Years | 0 (0.0%) | 0 (0.0%) |
| 75 Years and over | 0 (0.0%) | 0 (0.0%) |
| Total | 398 (58.4%) | 14 (3.5%) |
Employment Status by Educational Attainment in Stratford
According to labor force statistics for Stratford, 73.0% of individuals (332) out of the total population between 25 and 64 years of age (455) are in the labor force, with 4.2% or 14 of them being unemployed. The group with the highest labor force participation rate are those with the educational attainment of high school diploma, with 100.0% or 175 individuals in the labor force. Within the labor force, individuals with less than high school education have the highest percentage of unemployment, with 11.7% or 14 of them being unemployed.
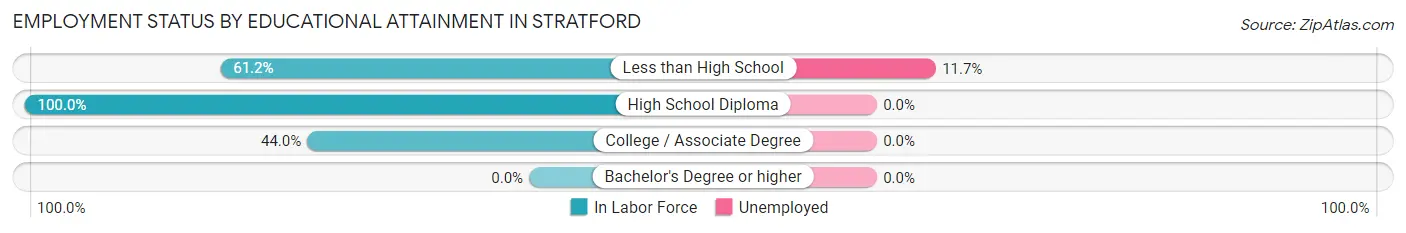
| Educational Attainment | In Labor Force | Unemployed |
| Less than High School | 120 (61.2%) | 23 (11.7%) |
| High School Diploma | 175 (100.0%) | 0 (0.0%) |
| College / Associate Degree | 37 (44.0%) | 0 (0.0%) |
| Bachelor's Degree or higher | 0 (0.0%) | 0 (0.0%) |
| Total | 332 (73.0%) | 19 (4.2%) |
Employment Occupations by Sex in Stratford
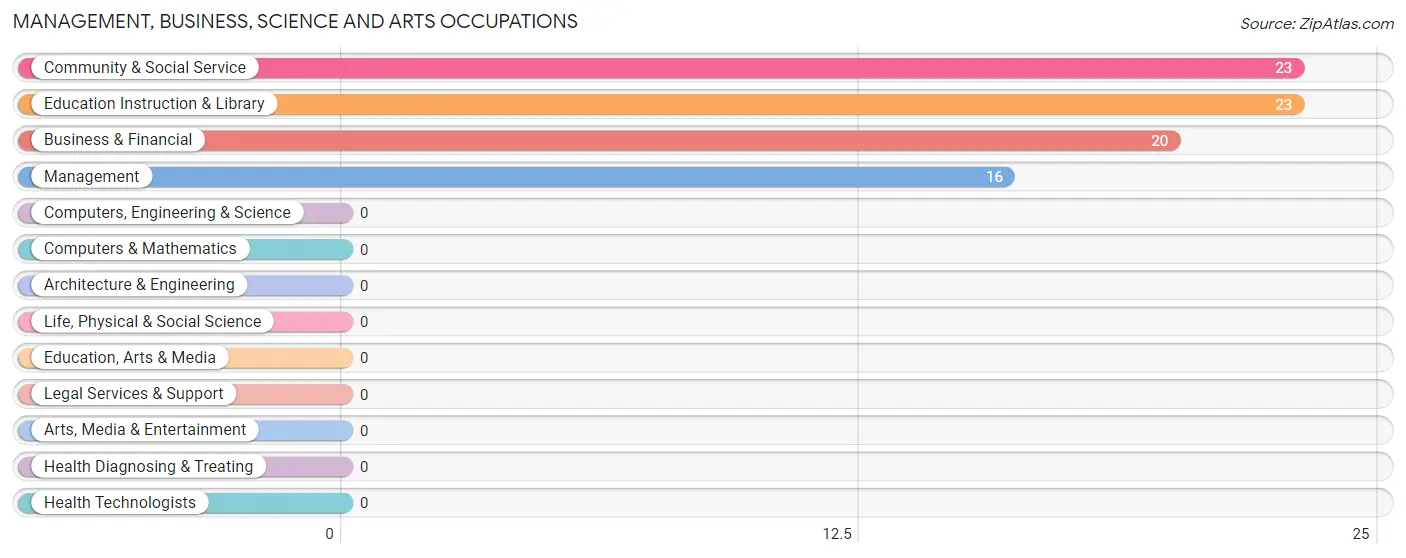
Management, Business, Science and Arts Occupations
The most common Management, Business, Science and Arts occupations in Stratford are Community & Social Service (23 | 6.0%), Education Instruction & Library (23 | 6.0%), Business & Financial (20 | 5.2%), and Management (16 | 4.2%).
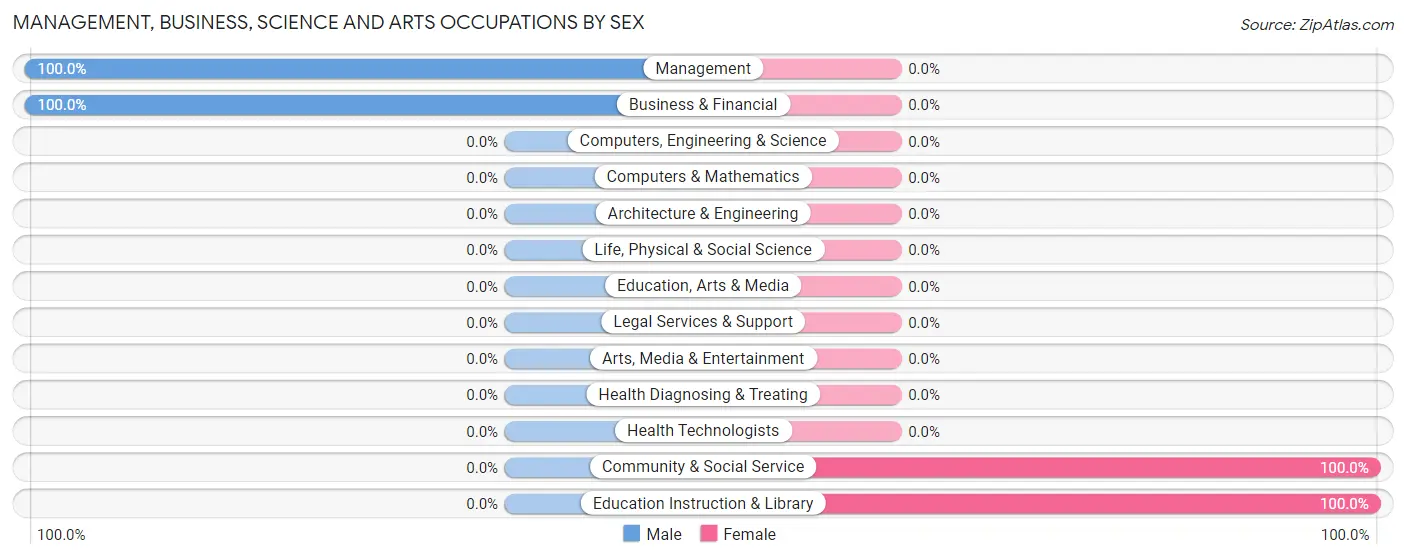
Management, Business, Science and Arts Occupations by Sex
Within the Management, Business, Science and Arts occupations in Stratford, the most male-oriented occupations are Management (100.0%), and Business & Financial (100.0%), while the most female-oriented occupations are Community & Social Service (100.0%), and Education Instruction & Library (100.0%).
| Occupation | Male | Female |
| Management | 16 (100.0%) | 0 (0.0%) |
| Business & Financial | 20 (100.0%) | 0 (0.0%) |
| Computers, Engineering & Science | 0 (0.0%) | 0 (0.0%) |
| Computers & Mathematics | 0 (0.0%) | 0 (0.0%) |
| Architecture & Engineering | 0 (0.0%) | 0 (0.0%) |
| Life, Physical & Social Science | 0 (0.0%) | 0 (0.0%) |
| Community & Social Service | 0 (0.0%) | 23 (100.0%) |
| Education, Arts & Media | 0 (0.0%) | 0 (0.0%) |
| Legal Services & Support | 0 (0.0%) | 0 (0.0%) |
| Education Instruction & Library | 0 (0.0%) | 23 (100.0%) |
| Arts, Media & Entertainment | 0 (0.0%) | 0 (0.0%) |
| Health Diagnosing & Treating | 0 (0.0%) | 0 (0.0%) |
| Health Technologists | 0 (0.0%) | 0 (0.0%) |
| Total (Category) | 36 (61.0%) | 23 (39.0%) |
| Total (Overall) | 240 (62.5%) | 144 (37.5%) |
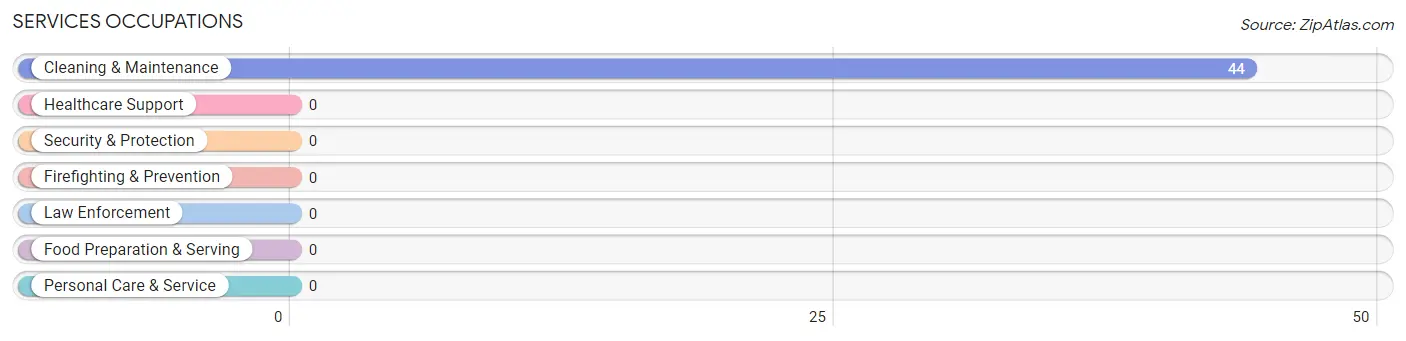
Services Occupations
The most common Services occupations in Stratford are , and Cleaning & Maintenance (44 | 11.5%).
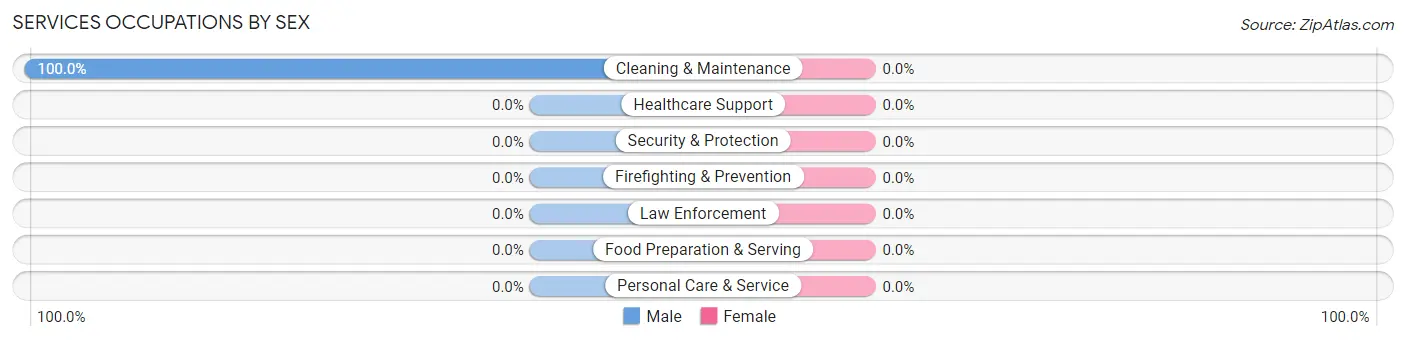
Services Occupations by Sex
| Occupation | Male | Female |
| Healthcare Support | 0 (0.0%) | 0 (0.0%) |
| Security & Protection | 0 (0.0%) | 0 (0.0%) |
| Firefighting & Prevention | 0 (0.0%) | 0 (0.0%) |
| Law Enforcement | 0 (0.0%) | 0 (0.0%) |
| Food Preparation & Serving | 0 (0.0%) | 0 (0.0%) |
| Cleaning & Maintenance | 44 (100.0%) | 0 (0.0%) |
| Personal Care & Service | 0 (0.0%) | 0 (0.0%) |
| Total (Category) | 44 (100.0%) | 0 (0.0%) |
| Total (Overall) | 240 (62.5%) | 144 (37.5%) |
Sales and Office Occupations
The most common Sales and Office occupations in Stratford are Sales & Related (59 | 15.4%), and Office & Administration (28 | 7.3%).
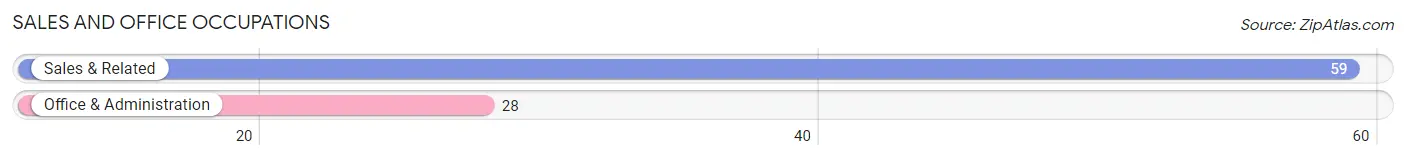
Sales and Office Occupations by Sex
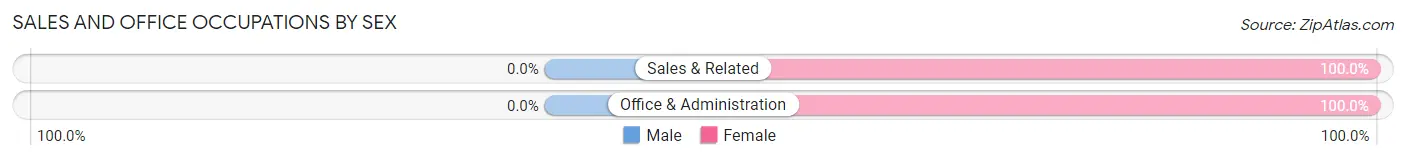
| Occupation | Male | Female |
| Sales & Related | 0 (0.0%) | 59 (100.0%) |
| Office & Administration | 0 (0.0%) | 28 (100.0%) |
| Total (Category) | 0 (0.0%) | 87 (100.0%) |
| Total (Overall) | 240 (62.5%) | 144 (37.5%) |
Natural Resources, Construction and Maintenance Occupations
The most common Natural Resources, Construction and Maintenance occupations in Stratford are , and Farming, Fishing & Forestry (77 | 20.1%).
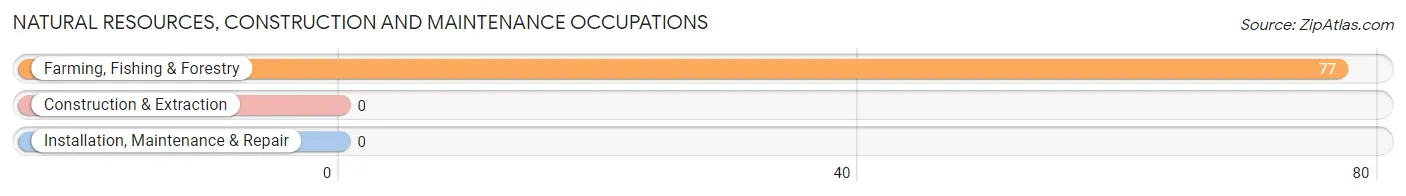
Natural Resources, Construction and Maintenance Occupations by Sex
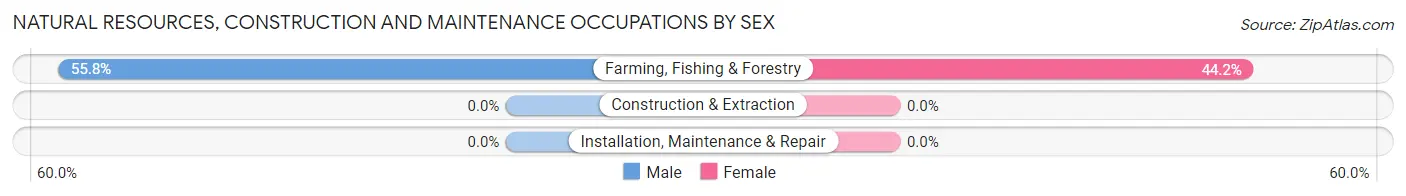
| Occupation | Male | Female |
| Farming, Fishing & Forestry | 43 (55.8%) | 34 (44.2%) |
| Construction & Extraction | 0 (0.0%) | 0 (0.0%) |
| Installation, Maintenance & Repair | 0 (0.0%) | 0 (0.0%) |
| Total (Category) | 43 (55.8%) | 34 (44.2%) |
| Total (Overall) | 240 (62.5%) | 144 (37.5%) |
Production, Transportation and Moving Occupations
The most common Production, Transportation and Moving occupations in Stratford are , and Production (117 | 30.5%).
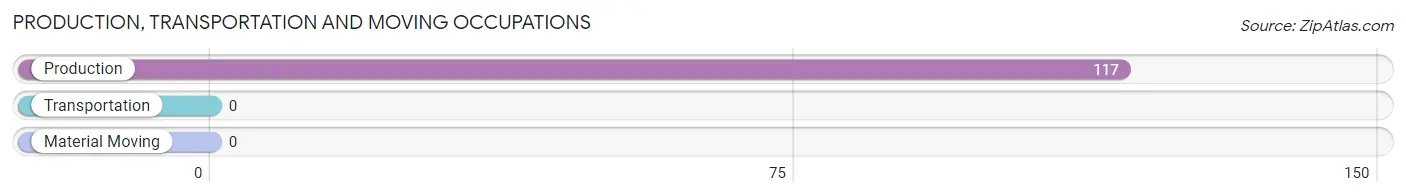
Production, Transportation and Moving Occupations by Sex
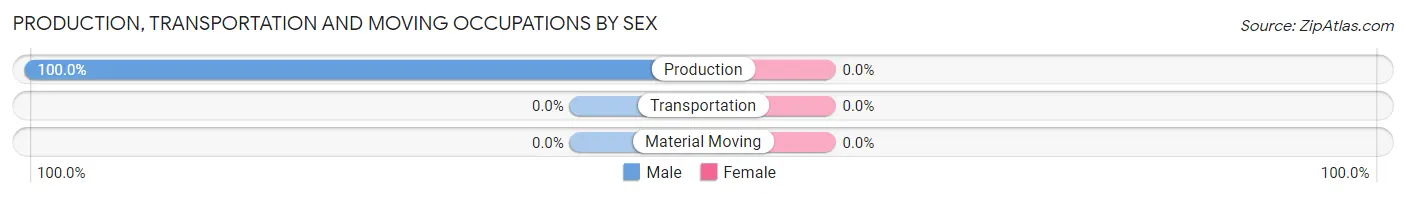
| Occupation | Male | Female |
| Production | 117 (100.0%) | 0 (0.0%) |
| Transportation | 0 (0.0%) | 0 (0.0%) |
| Material Moving | 0 (0.0%) | 0 (0.0%) |
| Total (Category) | 117 (100.0%) | 0 (0.0%) |
| Total (Overall) | 240 (62.5%) | 144 (37.5%) |
Employment Industries by Sex in Stratford
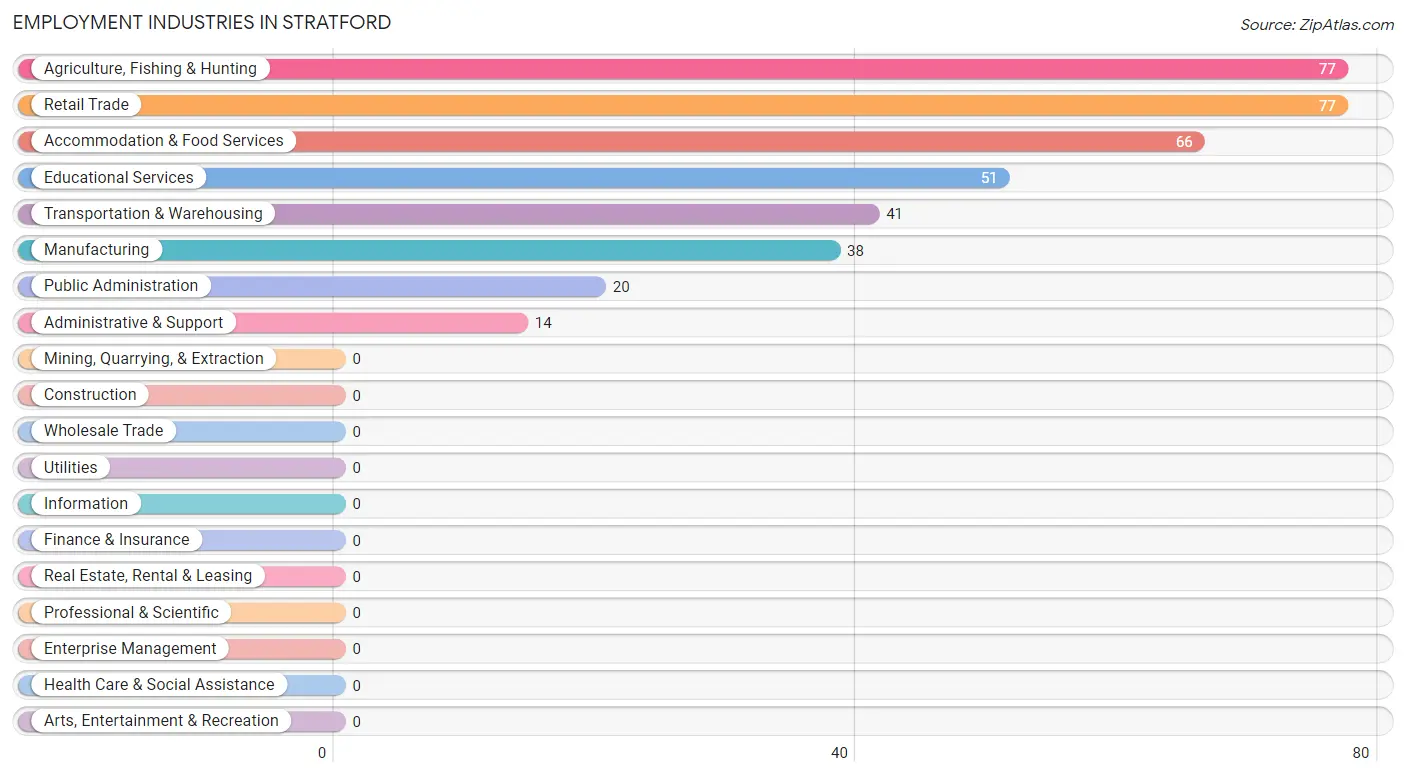
Employment Industries in Stratford
The major employment industries in Stratford include Agriculture, Fishing & Hunting (77 | 20.1%), Retail Trade (77 | 20.1%), Accommodation & Food Services (66 | 17.2%), Educational Services (51 | 13.3%), and Transportation & Warehousing (41 | 10.7%).
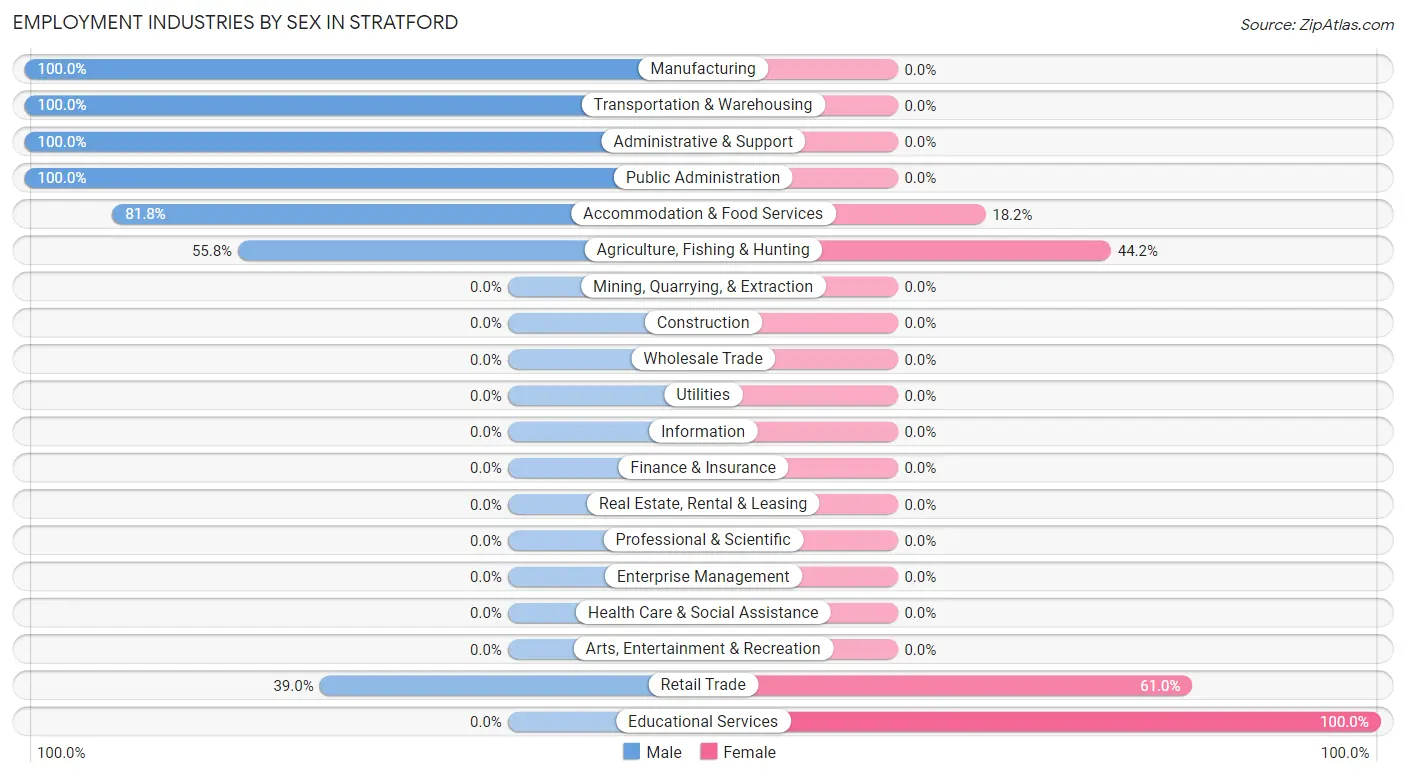
Employment Industries by Sex in Stratford
The Stratford industries that see more men than women are Manufacturing (100.0%), Transportation & Warehousing (100.0%), and Administrative & Support (100.0%), whereas the industries that tend to have a higher number of women are Educational Services (100.0%), Retail Trade (61.0%), and Agriculture, Fishing & Hunting (44.2%).
| Industry | Male | Female |
| Agriculture, Fishing & Hunting | 43 (55.8%) | 34 (44.2%) |
| Mining, Quarrying, & Extraction | 0 (0.0%) | 0 (0.0%) |
| Construction | 0 (0.0%) | 0 (0.0%) |
| Manufacturing | 38 (100.0%) | 0 (0.0%) |
| Wholesale Trade | 0 (0.0%) | 0 (0.0%) |
| Retail Trade | 30 (39.0%) | 47 (61.0%) |
| Transportation & Warehousing | 41 (100.0%) | 0 (0.0%) |
| Utilities | 0 (0.0%) | 0 (0.0%) |
| Information | 0 (0.0%) | 0 (0.0%) |
| Finance & Insurance | 0 (0.0%) | 0 (0.0%) |
| Real Estate, Rental & Leasing | 0 (0.0%) | 0 (0.0%) |
| Professional & Scientific | 0 (0.0%) | 0 (0.0%) |
| Enterprise Management | 0 (0.0%) | 0 (0.0%) |
| Administrative & Support | 14 (100.0%) | 0 (0.0%) |
| Educational Services | 0 (0.0%) | 51 (100.0%) |
| Health Care & Social Assistance | 0 (0.0%) | 0 (0.0%) |
| Arts, Entertainment & Recreation | 0 (0.0%) | 0 (0.0%) |
| Accommodation & Food Services | 54 (81.8%) | 12 (18.2%) |
| Public Administration | 20 (100.0%) | 0 (0.0%) |
| Total | 240 (62.5%) | 144 (37.5%) |
Education in Stratford
School Enrollment in Stratford
The most common levels of schooling among the 382 students in Stratford are elementary school (119 | 31.1%), middle school (98 | 25.7%), and high school (73 | 19.1%).
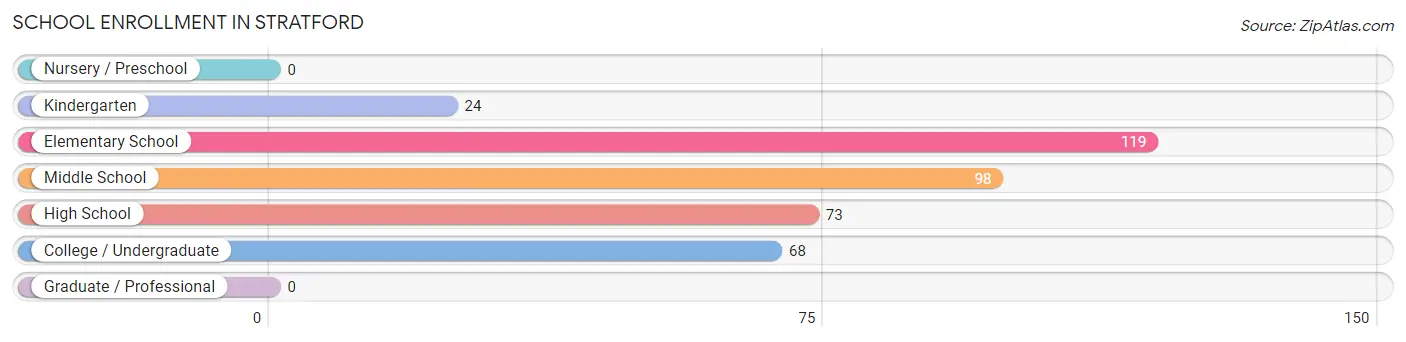
| School Level | # Students | % Students |
| Nursery / Preschool | 0 | 0.0% |
| Kindergarten | 24 | 6.3% |
| Elementary School | 119 | 31.1% |
| Middle School | 98 | 25.7% |
| High School | 73 | 19.1% |
| College / Undergraduate | 68 | 17.8% |
| Graduate / Professional | 0 | 0.0% |
| Total | 382 | 100.0% |
School Enrollment by Age by Funding Source in Stratford
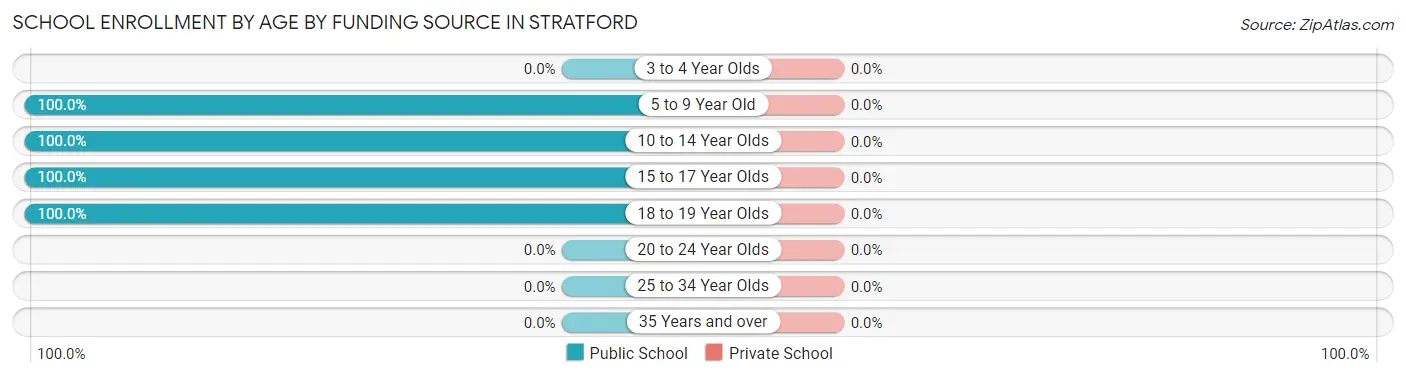
| Age Bracket | Public School | Private School |
| 3 to 4 Year Olds | 0 (0.0%) | 0 (0.0%) |
| 5 to 9 Year Old | 143 (100.0%) | 0 (0.0%) |
| 10 to 14 Year Olds | 133 (100.0%) | 0 (0.0%) |
| 15 to 17 Year Olds | 52 (100.0%) | 0 (0.0%) |
| 18 to 19 Year Olds | 54 (100.0%) | 0 (0.0%) |
| 20 to 24 Year Olds | 0 (0.0%) | 0 (0.0%) |
| 25 to 34 Year Olds | 0 (0.0%) | 0 (0.0%) |
| 35 Years and over | 0 (0.0%) | 0 (0.0%) |
| Total | 382 (100.0%) | 0 (0.0%) |
Educational Attainment by Field of Study in Stratford
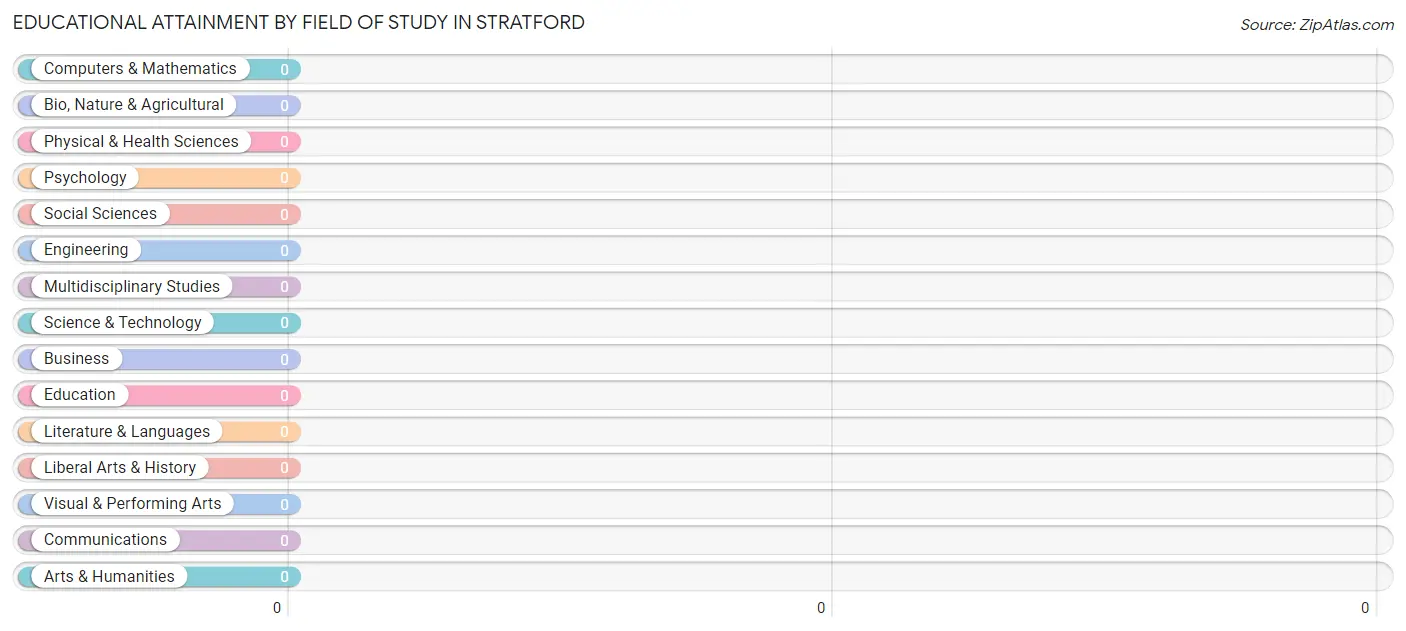
| Field of Study | # Graduates | % Graduates |
| Computers & Mathematics | 0 | 0.0% |
| Bio, Nature & Agricultural | 0 | 0.0% |
| Physical & Health Sciences | 0 | 0.0% |
| Psychology | 0 | 0.0% |
| Social Sciences | 0 | 0.0% |
| Engineering | 0 | 0.0% |
| Multidisciplinary Studies | 0 | 0.0% |
| Science & Technology | 0 | 0.0% |
| Business | 0 | 0.0% |
| Education | 0 | 0.0% |
| Literature & Languages | 0 | 0.0% |
| Liberal Arts & History | 0 | 0.0% |
| Visual & Performing Arts | 0 | 0.0% |
| Communications | 0 | 0.0% |
| Arts & Humanities | 0 | 0.0% |
| Total | 0 | 0.0% |
Transportation & Commute in Stratford
Vehicle Availability by Sex in Stratford
The most prevalent vehicle ownership categories in Stratford are males with 4 vehicles (110, accounting for 54.5%) and females with 4 vehicles (18, making up 76.4%).
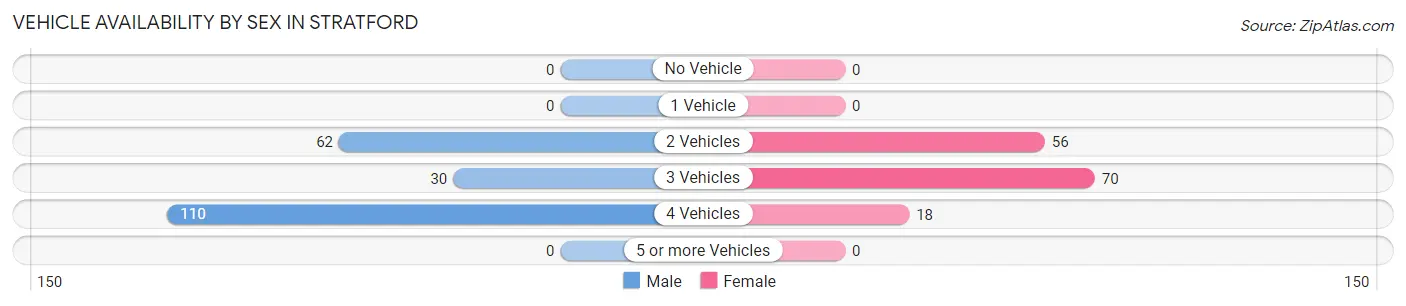
| Vehicles Available | Male | Female |
| No Vehicle | 0 (0.0%) | 0 (0.0%) |
| 1 Vehicle | 0 (0.0%) | 0 (0.0%) |
| 2 Vehicles | 62 (30.7%) | 56 (38.9%) |
| 3 Vehicles | 30 (14.8%) | 70 (48.6%) |
| 4 Vehicles | 110 (54.5%) | 18 (12.5%) |
| 5 or more Vehicles | 0 (0.0%) | 0 (0.0%) |
| Total | 202 (100.0%) | 144 (100.0%) |
Commute Time in Stratford
The most frequently occuring commute durations in Stratford are 15 to 19 minutes (91 commuters, 26.3%), 10 to 14 minutes (68 commuters, 19.7%), and 20 to 24 minutes (56 commuters, 16.2%).
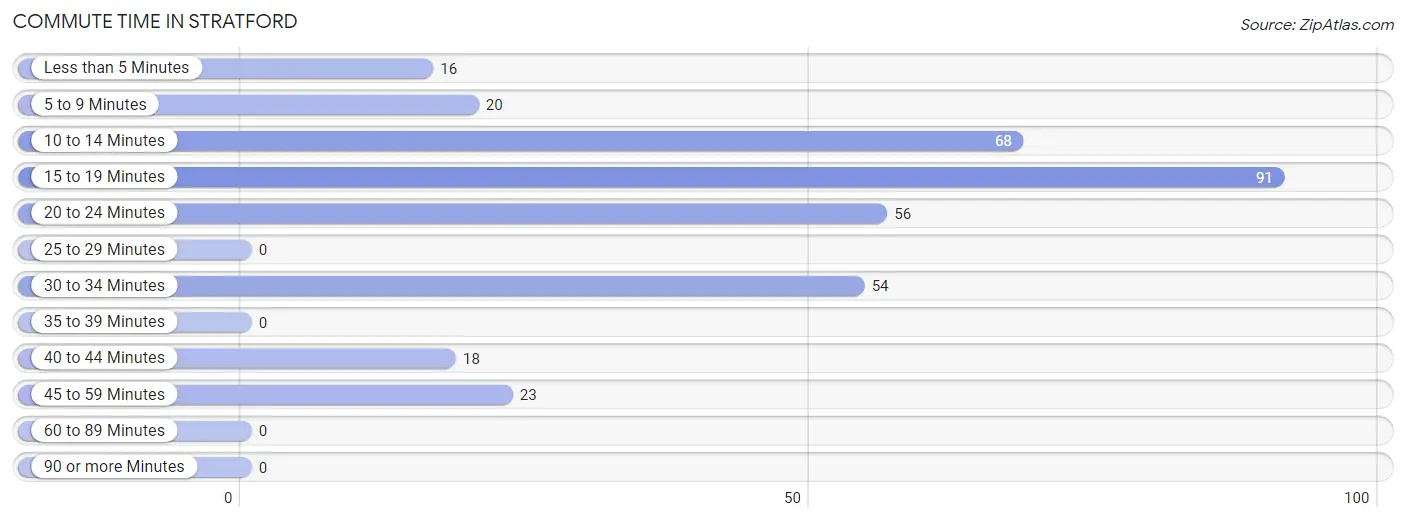
| Commute Time | # Commuters | % Commuters |
| Less than 5 Minutes | 16 | 4.6% |
| 5 to 9 Minutes | 20 | 5.8% |
| 10 to 14 Minutes | 68 | 19.7% |
| 15 to 19 Minutes | 91 | 26.3% |
| 20 to 24 Minutes | 56 | 16.2% |
| 25 to 29 Minutes | 0 | 0.0% |
| 30 to 34 Minutes | 54 | 15.6% |
| 35 to 39 Minutes | 0 | 0.0% |
| 40 to 44 Minutes | 18 | 5.2% |
| 45 to 59 Minutes | 23 | 6.7% |
| 60 to 89 Minutes | 0 | 0.0% |
| 90 or more Minutes | 0 | 0.0% |
Commute Time by Sex in Stratford
The most common commute times in Stratford are 30 to 34 minutes (54 commuters, 26.7%) for males and 15 to 19 minutes (56 commuters, 38.9%) for females.
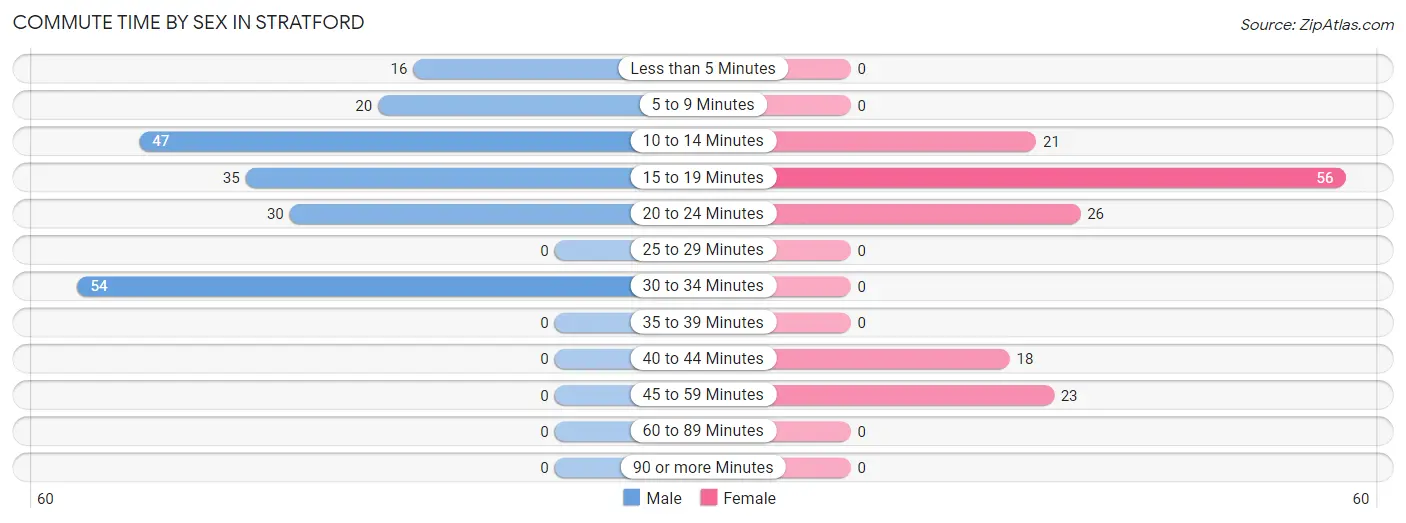
| Commute Time | Male | Female |
| Less than 5 Minutes | 16 (7.9%) | 0 (0.0%) |
| 5 to 9 Minutes | 20 (9.9%) | 0 (0.0%) |
| 10 to 14 Minutes | 47 (23.3%) | 21 (14.6%) |
| 15 to 19 Minutes | 35 (17.3%) | 56 (38.9%) |
| 20 to 24 Minutes | 30 (14.8%) | 26 (18.1%) |
| 25 to 29 Minutes | 0 (0.0%) | 0 (0.0%) |
| 30 to 34 Minutes | 54 (26.7%) | 0 (0.0%) |
| 35 to 39 Minutes | 0 (0.0%) | 0 (0.0%) |
| 40 to 44 Minutes | 0 (0.0%) | 18 (12.5%) |
| 45 to 59 Minutes | 0 (0.0%) | 23 (16.0%) |
| 60 to 89 Minutes | 0 (0.0%) | 0 (0.0%) |
| 90 or more Minutes | 0 (0.0%) | 0 (0.0%) |
Time of Departure to Work by Sex in Stratford
The most frequent times of departure to work in Stratford are 4:00 PM to 11:59 PM (84, 41.6%) for males and 11:00 AM to 11:59 AM (40, 27.8%) for females.
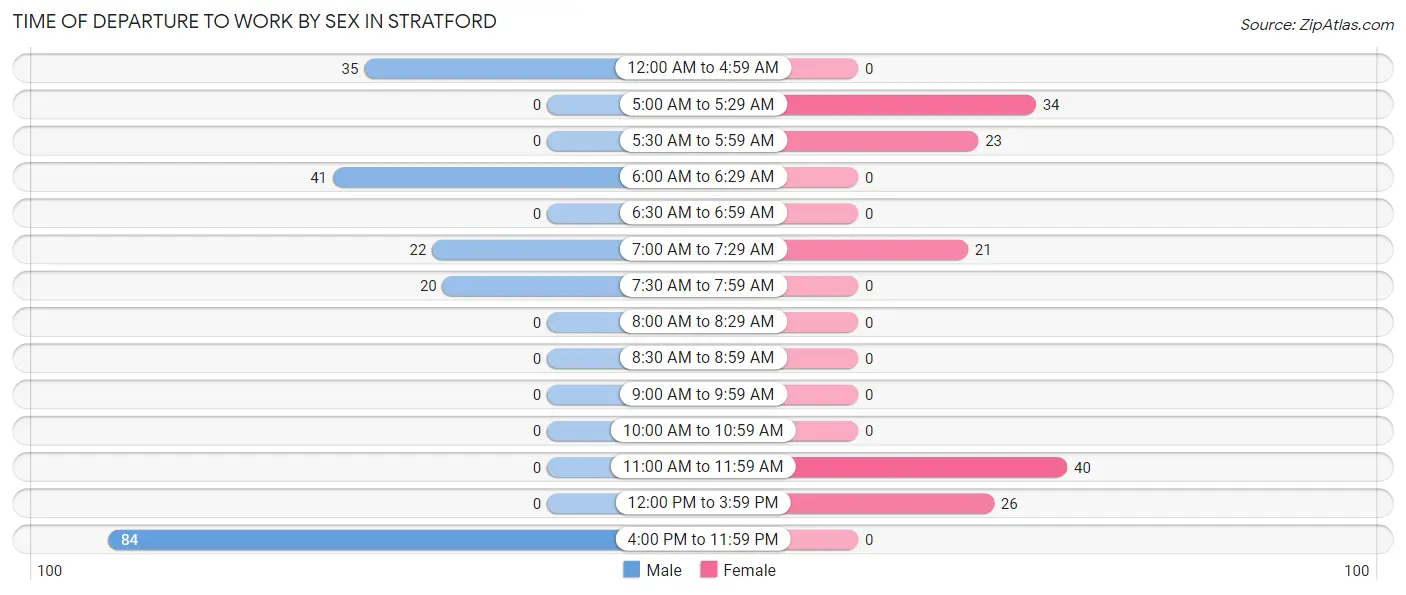
| Time of Departure | Male | Female |
| 12:00 AM to 4:59 AM | 35 (17.3%) | 0 (0.0%) |
| 5:00 AM to 5:29 AM | 0 (0.0%) | 34 (23.6%) |
| 5:30 AM to 5:59 AM | 0 (0.0%) | 23 (16.0%) |
| 6:00 AM to 6:29 AM | 41 (20.3%) | 0 (0.0%) |
| 6:30 AM to 6:59 AM | 0 (0.0%) | 0 (0.0%) |
| 7:00 AM to 7:29 AM | 22 (10.9%) | 21 (14.6%) |
| 7:30 AM to 7:59 AM | 20 (9.9%) | 0 (0.0%) |
| 8:00 AM to 8:29 AM | 0 (0.0%) | 0 (0.0%) |
| 8:30 AM to 8:59 AM | 0 (0.0%) | 0 (0.0%) |
| 9:00 AM to 9:59 AM | 0 (0.0%) | 0 (0.0%) |
| 10:00 AM to 10:59 AM | 0 (0.0%) | 0 (0.0%) |
| 11:00 AM to 11:59 AM | 0 (0.0%) | 40 (27.8%) |
| 12:00 PM to 3:59 PM | 0 (0.0%) | 26 (18.1%) |
| 4:00 PM to 11:59 PM | 84 (41.6%) | 0 (0.0%) |
| Total | 202 (100.0%) | 144 (100.0%) |
Housing Occupancy in Stratford
Occupancy by Ownership in Stratford
Of the total 191 dwellings in Stratford, owner-occupied units account for 104 (54.4%), while renter-occupied units make up 87 (45.6%).
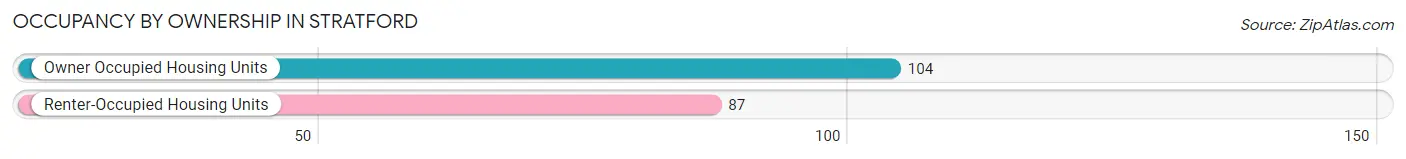
| Occupancy | # Housing Units | % Housing Units |
| Owner Occupied Housing Units | 104 | 54.4% |
| Renter-Occupied Housing Units | 87 | 45.6% |
| Total Occupied Housing Units | 191 | 100.0% |
Occupancy by Household Size in Stratford
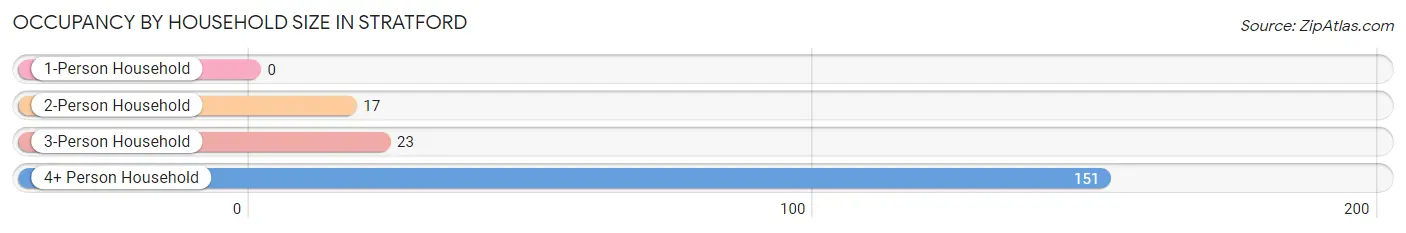
| Household Size | # Housing Units | % Housing Units |
| 1-Person Household | 0 | 0.0% |
| 2-Person Household | 17 | 8.9% |
| 3-Person Household | 23 | 12.0% |
| 4+ Person Household | 151 | 79.1% |
| Total Housing Units | 191 | 100.0% |
Occupancy by Ownership by Household Size in Stratford
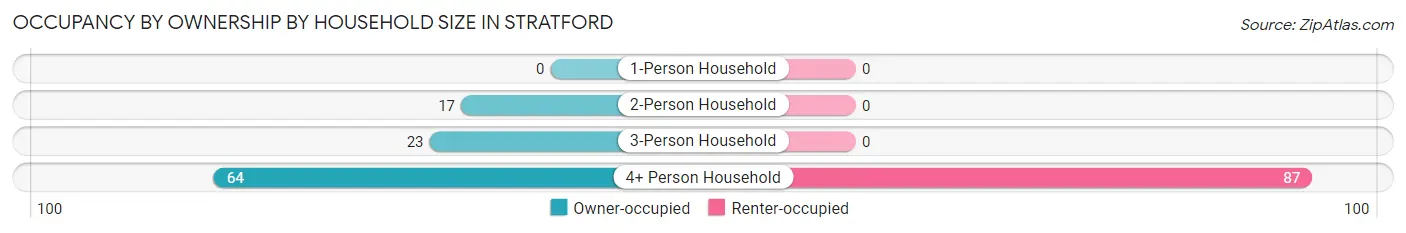
| Household Size | Owner-occupied | Renter-occupied |
| 1-Person Household | 0 (0.0%) | 0 (0.0%) |
| 2-Person Household | 17 (100.0%) | 0 (0.0%) |
| 3-Person Household | 23 (100.0%) | 0 (0.0%) |
| 4+ Person Household | 64 (42.4%) | 87 (57.6%) |
| Total Housing Units | 104 (54.4%) | 87 (45.6%) |
Occupancy by Educational Attainment in Stratford
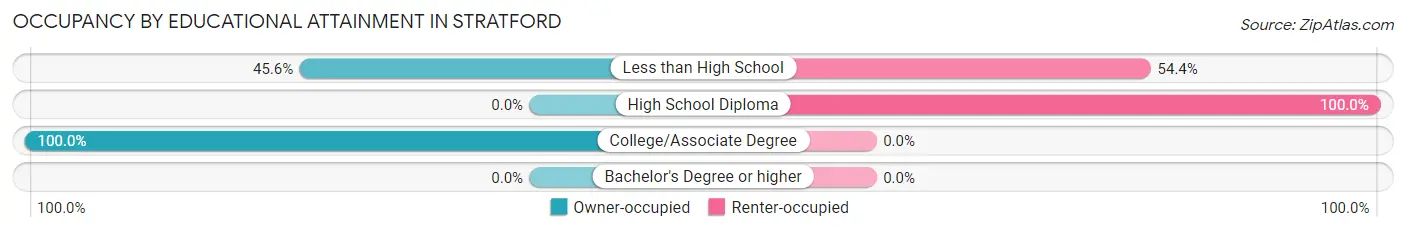
| Household Size | Owner-occupied | Renter-occupied |
| Less than High School | 31 (45.6%) | 37 (54.4%) |
| High School Diploma | 0 (0.0%) | 50 (100.0%) |
| College/Associate Degree | 73 (100.0%) | 0 (0.0%) |
| Bachelor's Degree or higher | 0 (0.0%) | 0 (0.0%) |
Occupancy by Age of Householder in Stratford
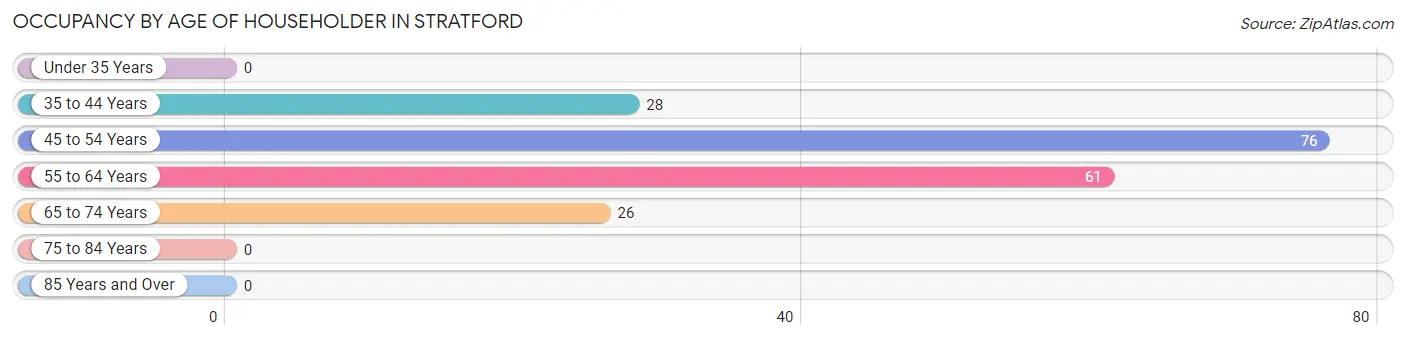
| Age Bracket | # Households | % Households |
| Under 35 Years | 0 | 0.0% |
| 35 to 44 Years | 28 | 14.7% |
| 45 to 54 Years | 76 | 39.8% |
| 55 to 64 Years | 61 | 31.9% |
| 65 to 74 Years | 26 | 13.6% |
| 75 to 84 Years | 0 | 0.0% |
| 85 Years and Over | 0 | 0.0% |
| Total | 191 | 100.0% |
Housing Finances in Stratford
Median Income by Occupancy in Stratford
| Occupancy Type | # Households | Median Income |
| Owner-Occupied | 104 (54.4%) | $0 |
| Renter-Occupied | 87 (45.6%) | $0 |
| Average | 191 (100.0%) | $0 |
Occupancy by Householder Income Bracket in Stratford
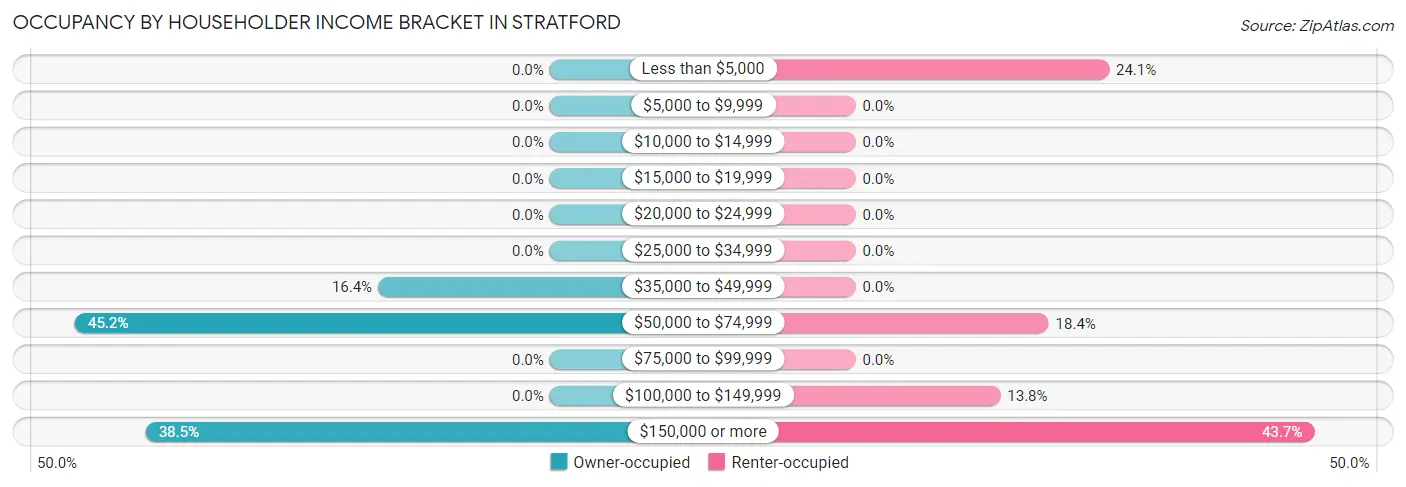
| Income Bracket | Owner-occupied | Renter-occupied |
| Less than $5,000 | 0 (0.0%) | 21 (24.1%) |
| $5,000 to $9,999 | 0 (0.0%) | 0 (0.0%) |
| $10,000 to $14,999 | 0 (0.0%) | 0 (0.0%) |
| $15,000 to $19,999 | 0 (0.0%) | 0 (0.0%) |
| $20,000 to $24,999 | 0 (0.0%) | 0 (0.0%) |
| $25,000 to $34,999 | 0 (0.0%) | 0 (0.0%) |
| $35,000 to $49,999 | 17 (16.4%) | 0 (0.0%) |
| $50,000 to $74,999 | 47 (45.2%) | 16 (18.4%) |
| $75,000 to $99,999 | 0 (0.0%) | 0 (0.0%) |
| $100,000 to $149,999 | 0 (0.0%) | 12 (13.8%) |
| $150,000 or more | 40 (38.5%) | 38 (43.7%) |
| Total | 104 (100.0%) | 87 (100.0%) |
Monthly Housing Cost Tiers in Stratford
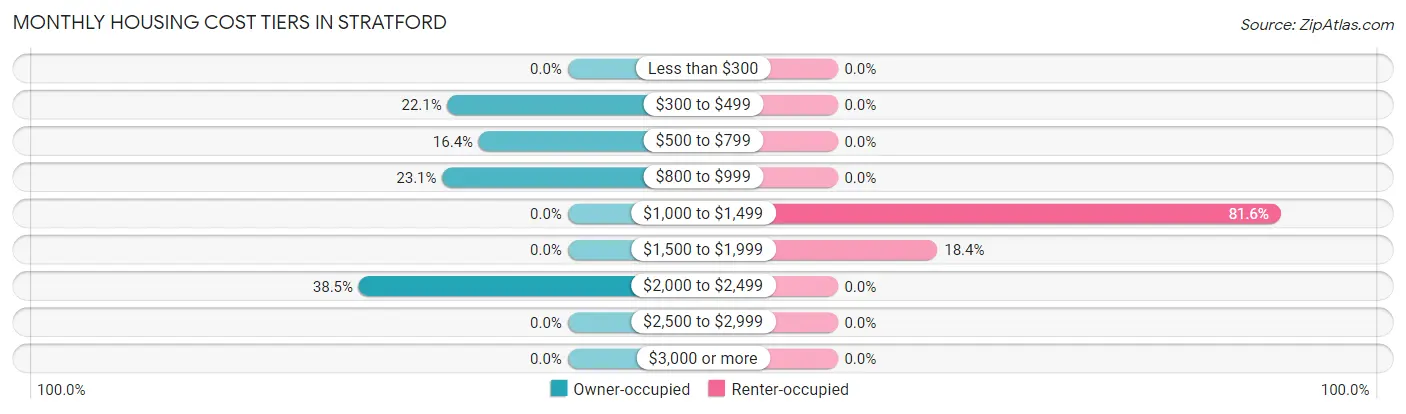
| Monthly Cost | Owner-occupied | Renter-occupied |
| Less than $300 | 0 (0.0%) | 0 (0.0%) |
| $300 to $499 | 23 (22.1%) | 0 (0.0%) |
| $500 to $799 | 17 (16.4%) | 0 (0.0%) |
| $800 to $999 | 24 (23.1%) | 0 (0.0%) |
| $1,000 to $1,499 | 0 (0.0%) | 71 (81.6%) |
| $1,500 to $1,999 | 0 (0.0%) | 16 (18.4%) |
| $2,000 to $2,499 | 40 (38.5%) | 0 (0.0%) |
| $2,500 to $2,999 | 0 (0.0%) | 0 (0.0%) |
| $3,000 or more | 0 (0.0%) | 0 (0.0%) |
| Total | 104 (100.0%) | 87 (100.0%) |
Physical Housing Characteristics in Stratford
Housing Structures in Stratford
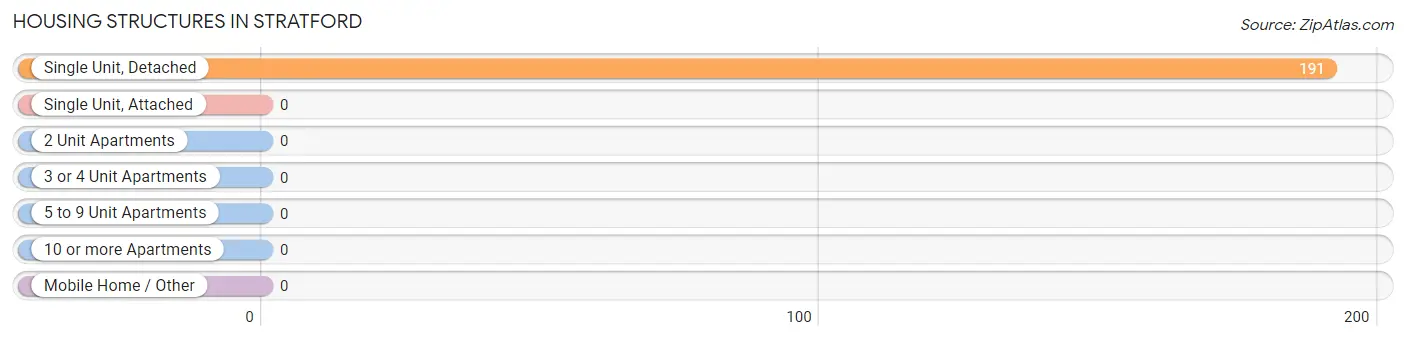
| Structure Type | # Housing Units | % Housing Units |
| Single Unit, Detached | 191 | 100.0% |
| Single Unit, Attached | 0 | 0.0% |
| 2 Unit Apartments | 0 | 0.0% |
| 3 or 4 Unit Apartments | 0 | 0.0% |
| 5 to 9 Unit Apartments | 0 | 0.0% |
| 10 or more Apartments | 0 | 0.0% |
| Mobile Home / Other | 0 | 0.0% |
| Total | 191 | 100.0% |
Housing Structures by Occupancy in Stratford
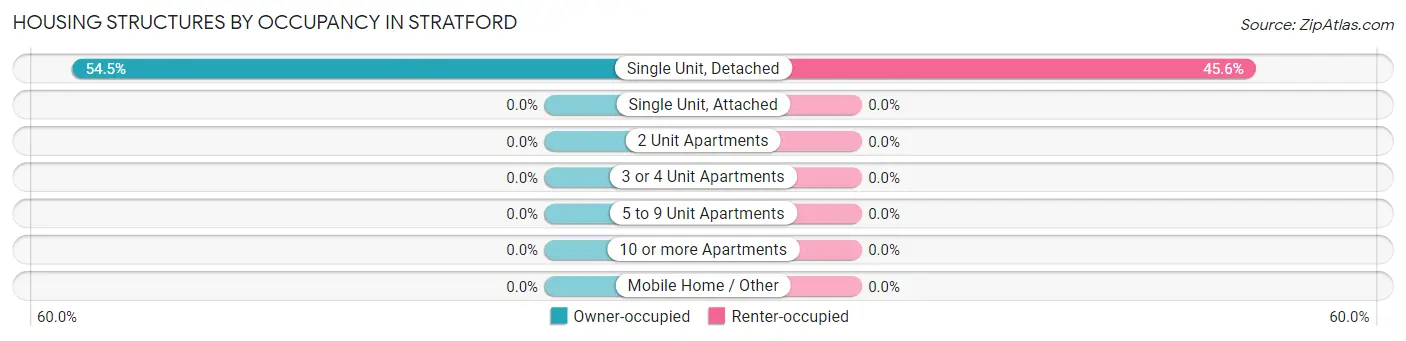
| Structure Type | Owner-occupied | Renter-occupied |
| Single Unit, Detached | 104 (54.4%) | 87 (45.6%) |
| Single Unit, Attached | 0 (0.0%) | 0 (0.0%) |
| 2 Unit Apartments | 0 (0.0%) | 0 (0.0%) |
| 3 or 4 Unit Apartments | 0 (0.0%) | 0 (0.0%) |
| 5 to 9 Unit Apartments | 0 (0.0%) | 0 (0.0%) |
| 10 or more Apartments | 0 (0.0%) | 0 (0.0%) |
| Mobile Home / Other | 0 (0.0%) | 0 (0.0%) |
| Total | 104 (54.4%) | 87 (45.6%) |
Housing Structures by Number of Rooms in Stratford
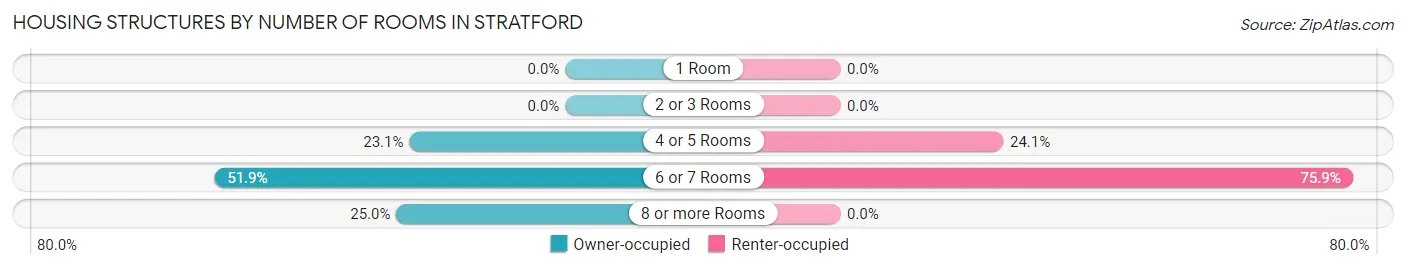
| Number of Rooms | Owner-occupied | Renter-occupied |
| 1 Room | 0 (0.0%) | 0 (0.0%) |
| 2 or 3 Rooms | 0 (0.0%) | 0 (0.0%) |
| 4 or 5 Rooms | 24 (23.1%) | 21 (24.1%) |
| 6 or 7 Rooms | 54 (51.9%) | 66 (75.9%) |
| 8 or more Rooms | 26 (25.0%) | 0 (0.0%) |
| Total | 104 (100.0%) | 87 (100.0%) |
Housing Structure by Heating Type in Stratford
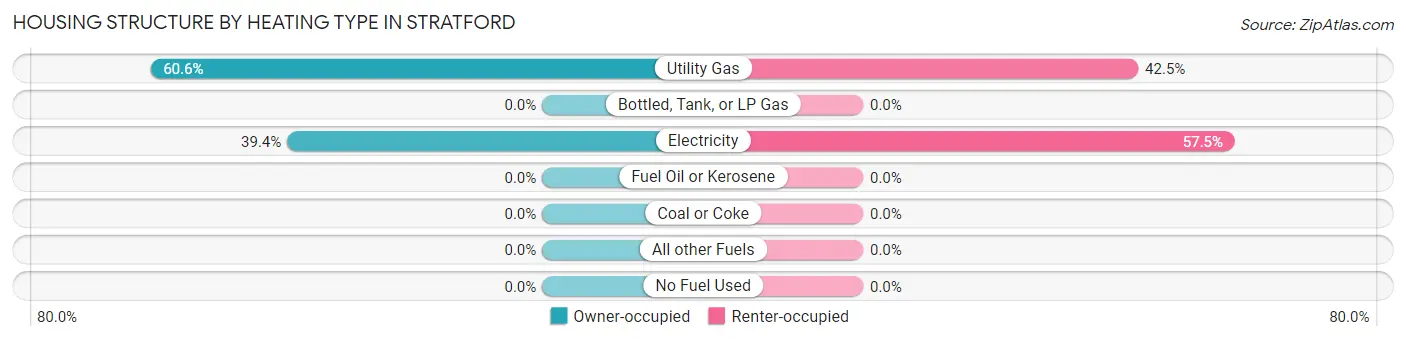
| Heating Type | Owner-occupied | Renter-occupied |
| Utility Gas | 63 (60.6%) | 37 (42.5%) |
| Bottled, Tank, or LP Gas | 0 (0.0%) | 0 (0.0%) |
| Electricity | 41 (39.4%) | 50 (57.5%) |
| Fuel Oil or Kerosene | 0 (0.0%) | 0 (0.0%) |
| Coal or Coke | 0 (0.0%) | 0 (0.0%) |
| All other Fuels | 0 (0.0%) | 0 (0.0%) |
| No Fuel Used | 0 (0.0%) | 0 (0.0%) |
| Total | 104 (100.0%) | 87 (100.0%) |
Household Vehicle Usage in Stratford
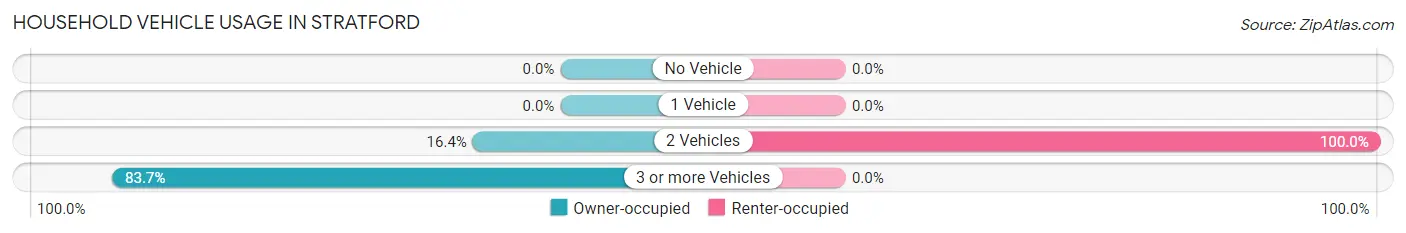
| Vehicles per Household | Owner-occupied | Renter-occupied |
| No Vehicle | 0 (0.0%) | 0 (0.0%) |
| 1 Vehicle | 0 (0.0%) | 0 (0.0%) |
| 2 Vehicles | 17 (16.4%) | 87 (100.0%) |
| 3 or more Vehicles | 87 (83.7%) | 0 (0.0%) |
| Total | 104 (100.0%) | 87 (100.0%) |
Real Estate & Mortgages in Stratford
Real Estate and Mortgage Overview in Stratford
| Characteristic | Without Mortgage | With Mortgage |
| Housing Units | 23 | 81 |
| Median Property Value | - | - |
| Median Household Income | - | - |
| Monthly Housing Costs | - | - |
| Real Estate Taxes | - | - |
Property Value by Mortgage Status in Stratford
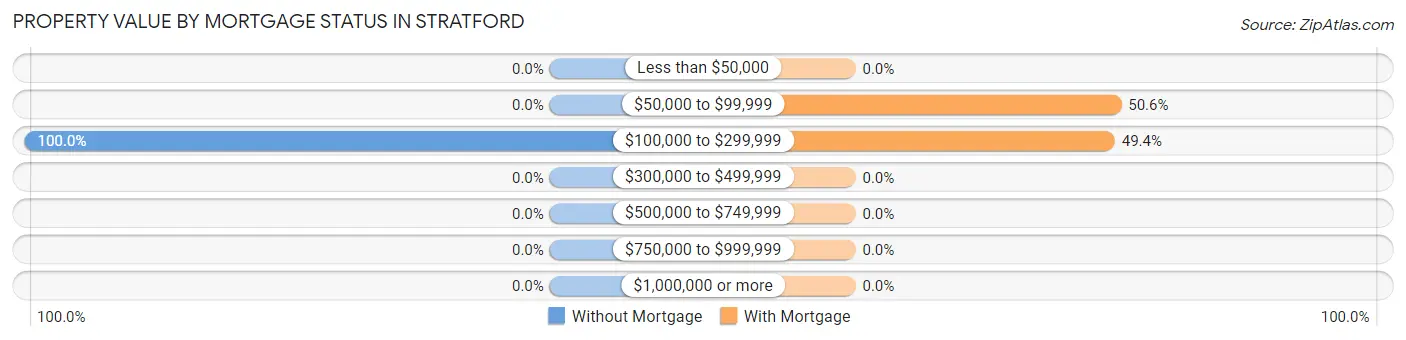
| Property Value | Without Mortgage | With Mortgage |
| Less than $50,000 | 0 (0.0%) | 0 (0.0%) |
| $50,000 to $99,999 | 0 (0.0%) | 41 (50.6%) |
| $100,000 to $299,999 | 23 (100.0%) | 40 (49.4%) |
| $300,000 to $499,999 | 0 (0.0%) | 0 (0.0%) |
| $500,000 to $749,999 | 0 (0.0%) | 0 (0.0%) |
| $750,000 to $999,999 | 0 (0.0%) | 0 (0.0%) |
| $1,000,000 or more | 0 (0.0%) | 0 (0.0%) |
| Total | 23 (100.0%) | 81 (100.0%) |
Household Income by Mortgage Status in Stratford
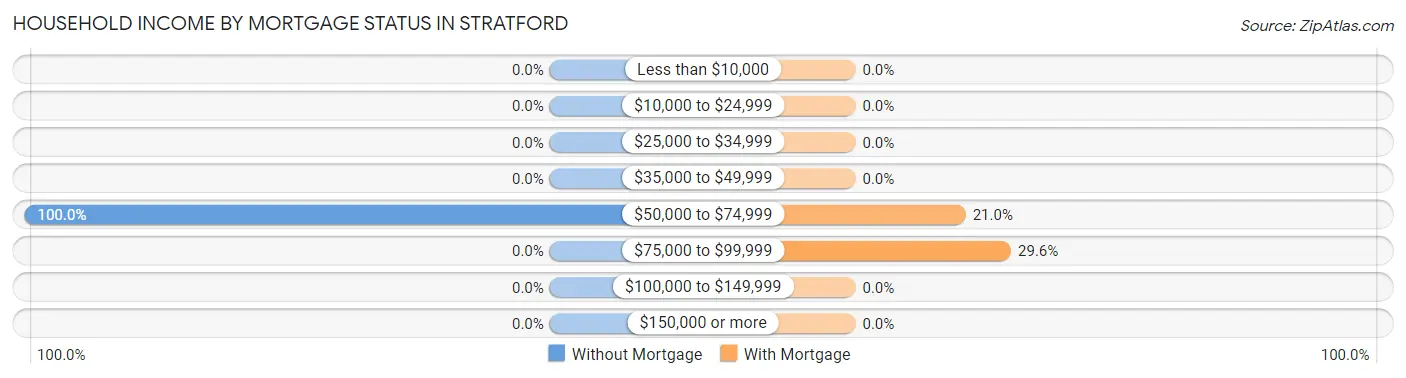
| Household Income | Without Mortgage | With Mortgage |
| Less than $10,000 | 0 (0.0%) | 0 (0.0%) |
| $10,000 to $24,999 | 0 (0.0%) | 0 (0.0%) |
| $25,000 to $34,999 | 0 (0.0%) | 0 (0.0%) |
| $35,000 to $49,999 | 0 (0.0%) | 0 (0.0%) |
| $50,000 to $74,999 | 23 (100.0%) | 17 (21.0%) |
| $75,000 to $99,999 | 0 (0.0%) | 24 (29.6%) |
| $100,000 to $149,999 | 0 (0.0%) | 0 (0.0%) |
| $150,000 or more | 0 (0.0%) | 0 (0.0%) |
| Total | 23 (100.0%) | 81 (100.0%) |
Property Value to Household Income Ratio in Stratford
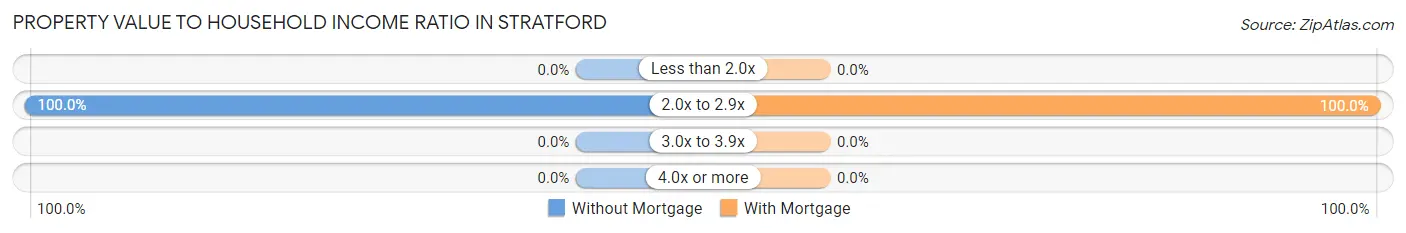
| Value-to-Income Ratio | Without Mortgage | With Mortgage |
| Less than 2.0x | 0 (0.0%) | 0 (0.0%) |
| 2.0x to 2.9x | 23 (100.0%) | 81 (100.0%) |
| 3.0x to 3.9x | 0 (0.0%) | 0 (0.0%) |
| 4.0x or more | 0 (0.0%) | 0 (0.0%) |
| Total | 23 (100.0%) | 81 (100.0%) |
Real Estate Taxes by Mortgage Status in Stratford
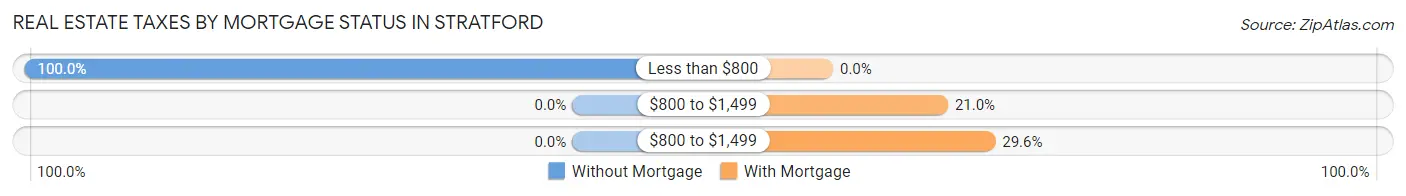
| Property Taxes | Without Mortgage | With Mortgage |
| Less than $800 | 23 (100.0%) | 0 (0.0%) |
| $800 to $1,499 | 0 (0.0%) | 17 (21.0%) |
| $800 to $1,499 | 0 (0.0%) | 24 (29.6%) |
| Total | 23 (100.0%) | 81 (100.0%) |
Health & Disability in Stratford
Health Insurance Coverage by Age in Stratford
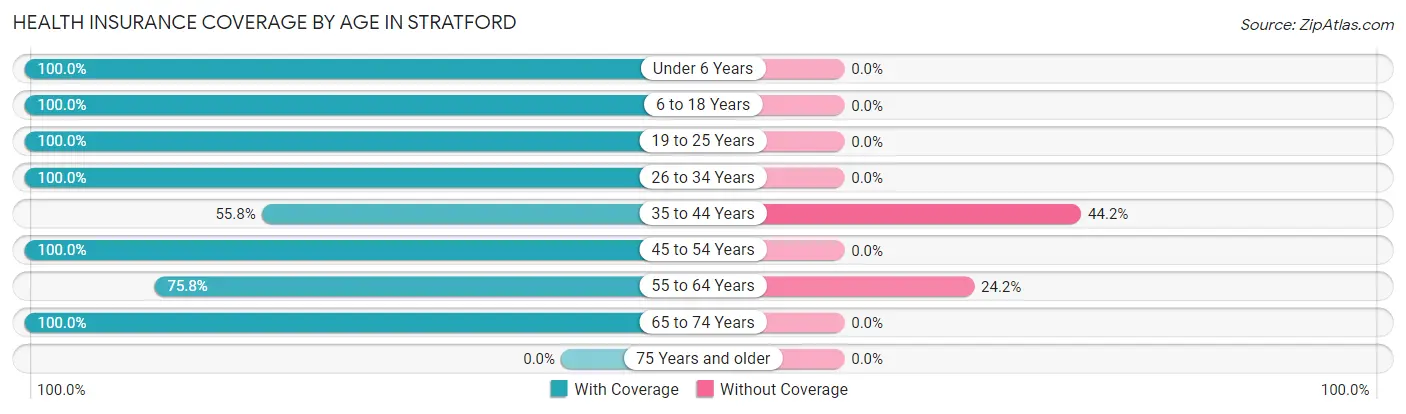
| Age Bracket | With Coverage | Without Coverage |
| Under 6 Years | 76 (100.0%) | 0 (0.0%) |
| 6 to 18 Years | 328 (100.0%) | 0 (0.0%) |
| 19 to 25 Years | 149 (100.0%) | 0 (0.0%) |
| 26 to 34 Years | 78 (100.0%) | 0 (0.0%) |
| 35 to 44 Years | 115 (55.8%) | 91 (44.2%) |
| 45 to 54 Years | 76 (100.0%) | 0 (0.0%) |
| 55 to 64 Years | 72 (75.8%) | 23 (24.2%) |
| 65 to 74 Years | 26 (100.0%) | 0 (0.0%) |
| 75 Years and older | 0 (0.0%) | 0 (0.0%) |
| Total | 920 (89.0%) | 114 (11.0%) |
Health Insurance Coverage by Citizenship Status in Stratford
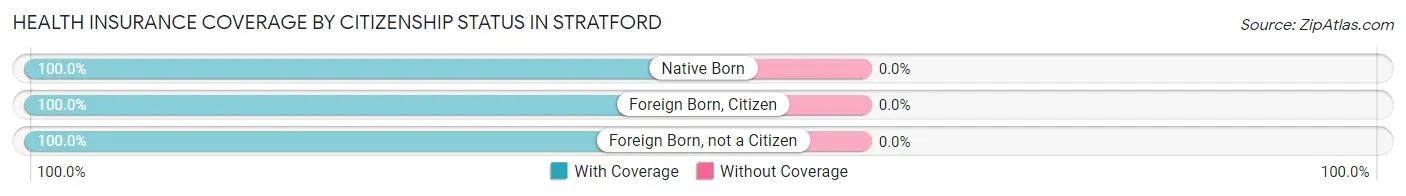
| Citizenship Status | With Coverage | Without Coverage |
| Native Born | 76 (100.0%) | 0 (0.0%) |
| Foreign Born, Citizen | 328 (100.0%) | 0 (0.0%) |
| Foreign Born, not a Citizen | 149 (100.0%) | 0 (0.0%) |
Health Insurance Coverage by Household Income in Stratford
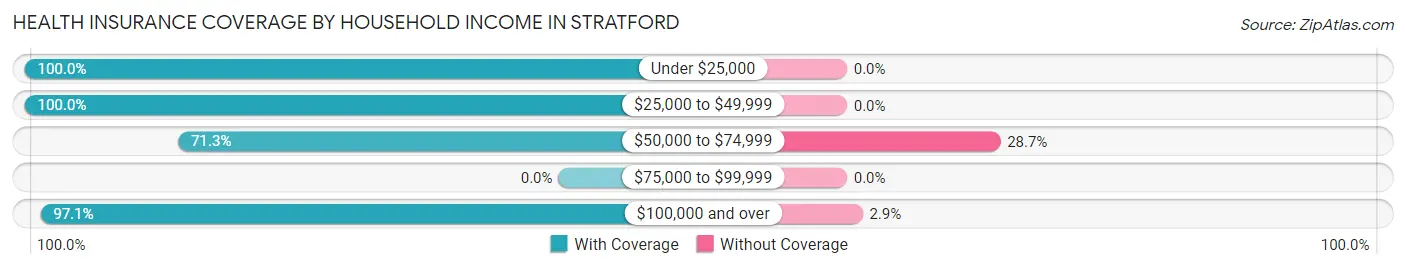
| Household Income | With Coverage | Without Coverage |
| Under $25,000 | 106 (100.0%) | 0 (0.0%) |
| $25,000 to $49,999 | 42 (100.0%) | 0 (0.0%) |
| $50,000 to $74,999 | 243 (71.3%) | 98 (28.7%) |
| $75,000 to $99,999 | 0 (0.0%) | 0 (0.0%) |
| $100,000 and over | 529 (97.1%) | 16 (2.9%) |
Public vs Private Health Insurance Coverage by Age in Stratford
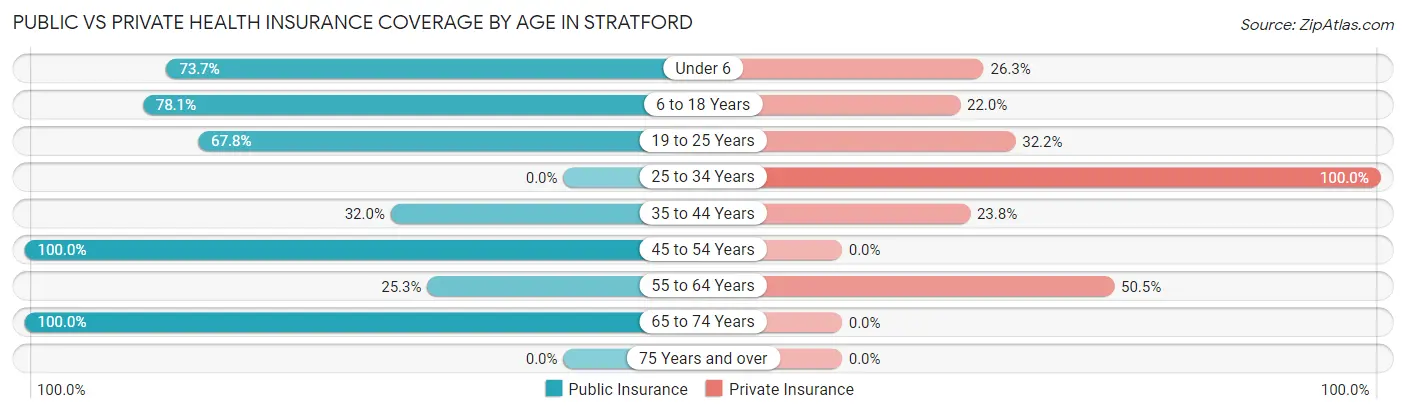
| Age Bracket | Public Insurance | Private Insurance |
| Under 6 | 56 (73.7%) | 20 (26.3%) |
| 6 to 18 Years | 256 (78.0%) | 72 (22.0%) |
| 19 to 25 Years | 101 (67.8%) | 48 (32.2%) |
| 25 to 34 Years | 0 (0.0%) | 78 (100.0%) |
| 35 to 44 Years | 66 (32.0%) | 49 (23.8%) |
| 45 to 54 Years | 76 (100.0%) | 0 (0.0%) |
| 55 to 64 Years | 24 (25.3%) | 48 (50.5%) |
| 65 to 74 Years | 26 (100.0%) | 0 (0.0%) |
| 75 Years and over | 0 (0.0%) | 0 (0.0%) |
| Total | 605 (58.5%) | 315 (30.5%) |
Disability Status by Sex by Age in Stratford
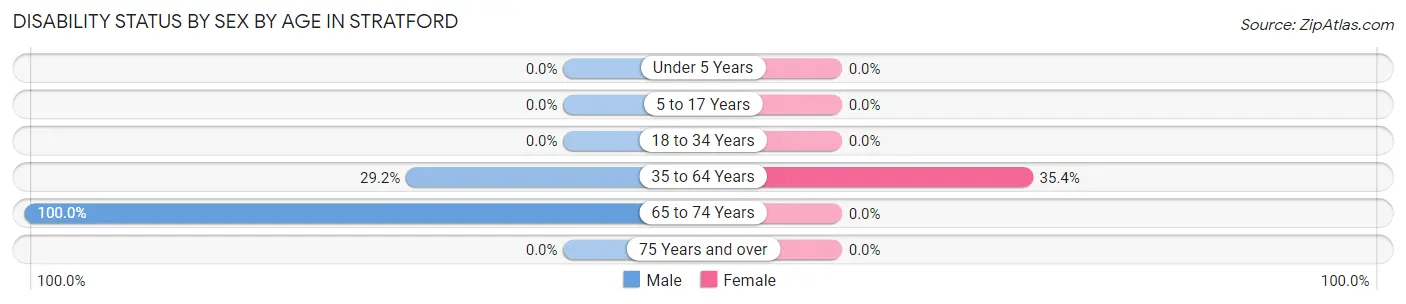
| Age Bracket | Male | Female |
| Under 5 Years | 0 (0.0%) | 0 (0.0%) |
| 5 to 17 Years | 0 (0.0%) | 0 (0.0%) |
| 18 to 34 Years | 0 (0.0%) | 0 (0.0%) |
| 35 to 64 Years | 54 (29.2%) | 68 (35.4%) |
| 65 to 74 Years | 26 (100.0%) | 0 (0.0%) |
| 75 Years and over | 0 (0.0%) | 0 (0.0%) |
Disability Class by Sex by Age in Stratford
Disability Class: Hearing Difficulty
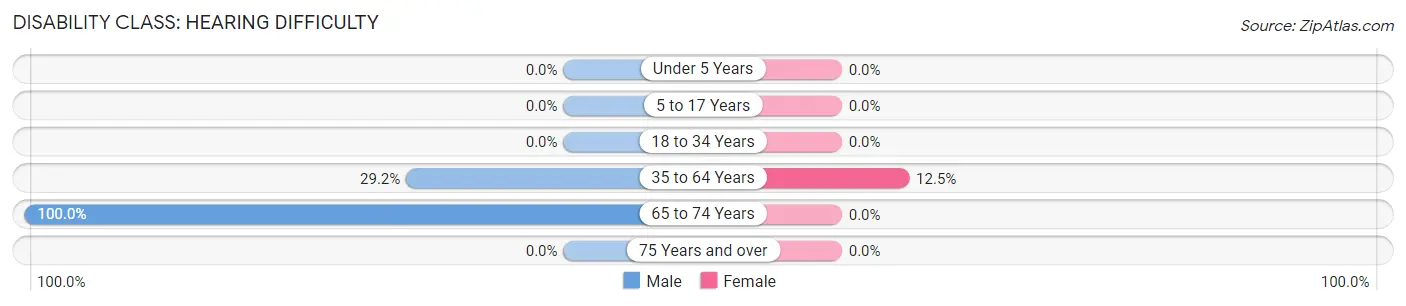
| Age Bracket | Male | Female |
| Under 5 Years | 0 (0.0%) | 0 (0.0%) |
| 5 to 17 Years | 0 (0.0%) | 0 (0.0%) |
| 18 to 34 Years | 0 (0.0%) | 0 (0.0%) |
| 35 to 64 Years | 54 (29.2%) | 24 (12.5%) |
| 65 to 74 Years | 26 (100.0%) | 0 (0.0%) |
| 75 Years and over | 0 (0.0%) | 0 (0.0%) |
Disability Class: Vision Difficulty
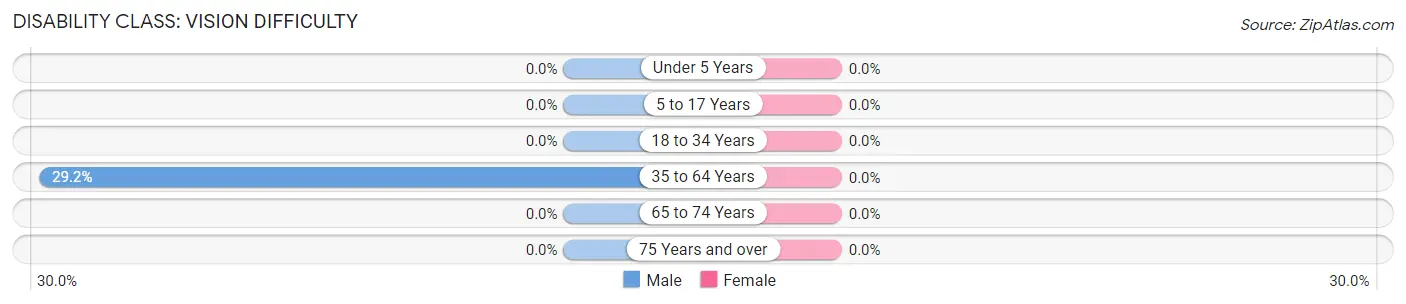
| Age Bracket | Male | Female |
| Under 5 Years | 0 (0.0%) | 0 (0.0%) |
| 5 to 17 Years | 0 (0.0%) | 0 (0.0%) |
| 18 to 34 Years | 0 (0.0%) | 0 (0.0%) |
| 35 to 64 Years | 54 (29.2%) | 0 (0.0%) |
| 65 to 74 Years | 0 (0.0%) | 0 (0.0%) |
| 75 Years and over | 0 (0.0%) | 0 (0.0%) |
Disability Class: Cognitive Difficulty
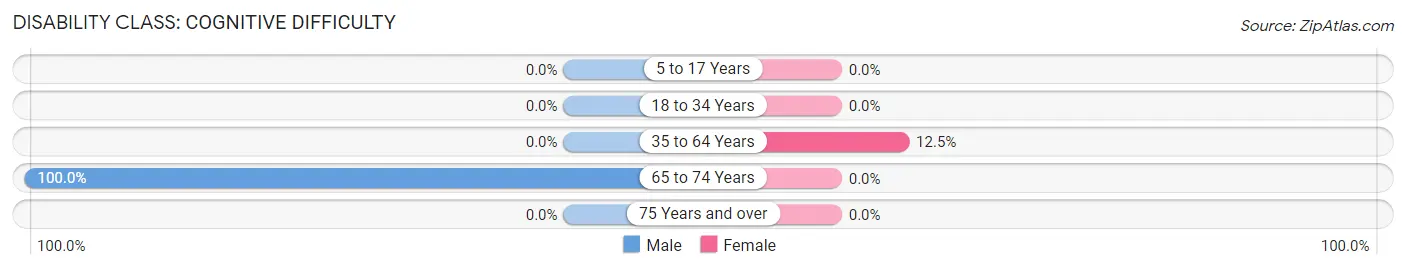
| Age Bracket | Male | Female |
| 5 to 17 Years | 0 (0.0%) | 0 (0.0%) |
| 18 to 34 Years | 0 (0.0%) | 0 (0.0%) |
| 35 to 64 Years | 0 (0.0%) | 24 (12.5%) |
| 65 to 74 Years | 26 (100.0%) | 0 (0.0%) |
| 75 Years and over | 0 (0.0%) | 0 (0.0%) |
Disability Class: Ambulatory Difficulty
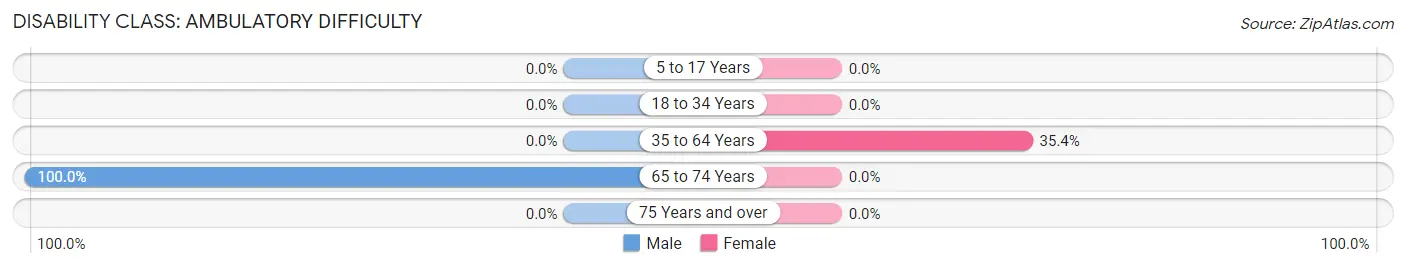
| Age Bracket | Male | Female |
| 5 to 17 Years | 0 (0.0%) | 0 (0.0%) |
| 18 to 34 Years | 0 (0.0%) | 0 (0.0%) |
| 35 to 64 Years | 0 (0.0%) | 68 (35.4%) |
| 65 to 74 Years | 26 (100.0%) | 0 (0.0%) |
| 75 Years and over | 0 (0.0%) | 0 (0.0%) |
Disability Class: Self-Care Difficulty
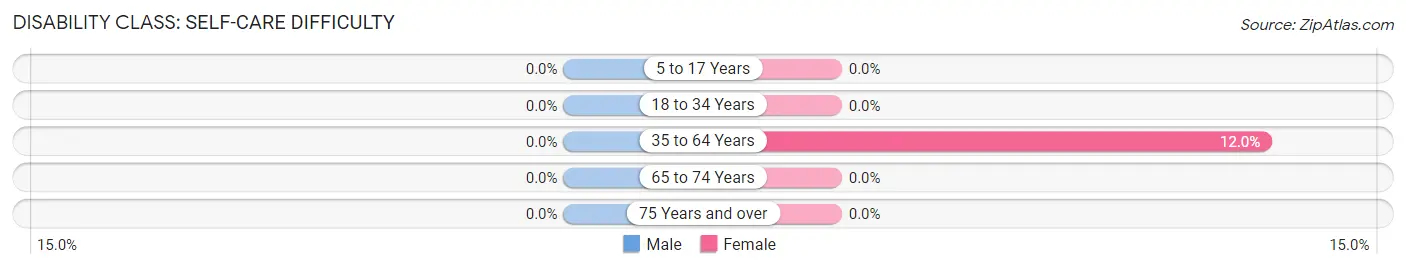
| Age Bracket | Male | Female |
| 5 to 17 Years | 0 (0.0%) | 0 (0.0%) |
| 18 to 34 Years | 0 (0.0%) | 0 (0.0%) |
| 35 to 64 Years | 0 (0.0%) | 23 (12.0%) |
| 65 to 74 Years | 0 (0.0%) | 0 (0.0%) |
| 75 Years and over | 0 (0.0%) | 0 (0.0%) |
Technology Access in Stratford
Computing Device Access in Stratford
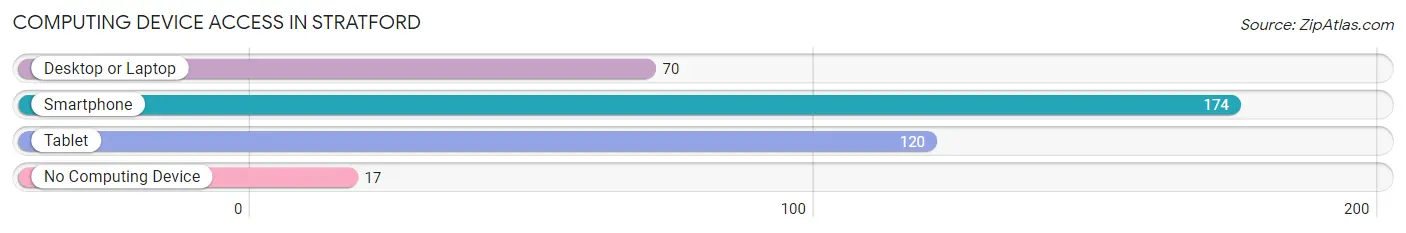
| Device Type | # Households | % Households |
| Desktop or Laptop | 70 | 36.6% |
| Smartphone | 174 | 91.1% |
| Tablet | 120 | 62.8% |
| No Computing Device | 17 | 8.9% |
| Total | 191 | 100.0% |
Internet Access in Stratford
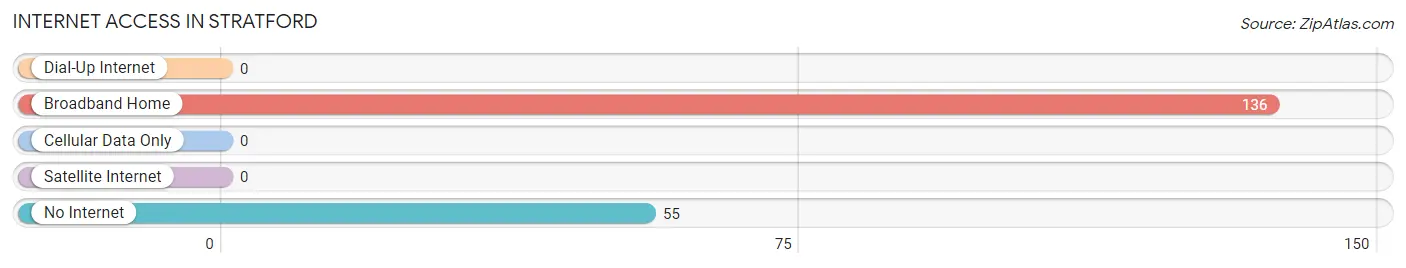
| Internet Type | # Households | % Households |
| Dial-Up Internet | 0 | 0.0% |
| Broadband Home | 136 | 71.2% |
| Cellular Data Only | 0 | 0.0% |
| Satellite Internet | 0 | 0.0% |
| No Internet | 55 | 28.8% |
| Total | 191 | 100.0% |
Stratford Summary
Stratford is a small town located in San Joaquin County, California. It is situated in the Central Valley, approximately 30 miles south of Stockton and 40 miles north of Modesto. The town was founded in 1871 and has a population of approximately 1,000 people.
History
Stratford was founded in 1871 by a group of settlers from the Midwest. The town was named after Stratford-upon-Avon, England, the birthplace of William Shakespeare. The settlers were attracted to the area due to its fertile soil and mild climate. The town quickly grew and by the early 1900s, it had become a thriving agricultural community.
The town was home to a variety of crops, including wheat, corn, alfalfa, and fruit. The town also had a thriving dairy industry. In the 1920s, the town was home to a number of canneries, which processed the local produce.
In the 1950s, the town began to decline as the agricultural industry shifted to other parts of the Central Valley. The town’s population decreased and many of the businesses closed. In the 1970s, the town began to experience a resurgence as new businesses opened and the population began to grow again.
Geography
Stratford is located in the Central Valley of California, approximately 30 miles south of Stockton and 40 miles north of Modesto. The town is situated on the banks of the San Joaquin River. The town is surrounded by rolling hills and farmland.
The climate in Stratford is mild and temperate. The average temperature in the summer is around 80 degrees Fahrenheit and in the winter it is around 50 degrees Fahrenheit. The town receives an average of 18 inches of rain per year.
Economy
Stratford’s economy is largely based on agriculture. The town is home to a variety of crops, including wheat, corn, alfalfa, and fruit. The town also has a thriving dairy industry. In addition, the town is home to a number of small businesses, including restaurants, shops, and services.
Demographics
As of the 2010 census, the population of Stratford was 1,000. The town is predominantly white, with approximately 75% of the population identifying as Caucasian. The remaining 25% of the population is made up of African Americans, Hispanics, and Asians. The median household income in Stratford is $45,000. The town has a low unemployment rate of 4.5%.
Common Questions
What is Per Capita Income in Stratford?
Per Capita income in Stratford is $18,674.
What is Income or Wage Gap in Stratford?
Income or Wage Gap in Stratford is 7.6%.
Women in Stratford earn 92.4 cents for every dollar earned by a man.
What is Inequality or Gini Index in Stratford?
Inequality or Gini Index in Stratford is 0.34.
What is the Total Population of Stratford?
Total Population of Stratford is 1,034.
What is the Total Male Population of Stratford?
Total Male Population of Stratford is 534.
What is the Total Female Population of Stratford?
Total Female Population of Stratford is 500.
What is the Ratio of Males per 100 Females in Stratford?
There are 106.80 Males per 100 Females in Stratford.
What is the Ratio of Females per 100 Males in Stratford?
There are 93.63 Females per 100 Males in Stratford.
What is the Median Population Age in Stratford?
Median Population Age in Stratford is 22.7 Years.
What is the Average Family Size in Stratford
Average Family Size in Stratford is 5.5 People.
What is the Average Household Size in Stratford
Average Household Size in Stratford is 5.4 People.
How Large is the Labor Force in Stratford?
There are 398 People in the Labor Forcein in Stratford.
What is the Percentage of People in the Labor Force in Stratford?
58.4% of People are in the Labor Force in Stratford.
What is the Unemployment Rate in Stratford?
Unemployment Rate in Stratford is 3.5%.