Cities with the Highest Percentage of Families with Income Below $10,000 in Florida
RELATED REPORTS & OPTIONS
Family Income | $0-10k
Florida
Compare Cities
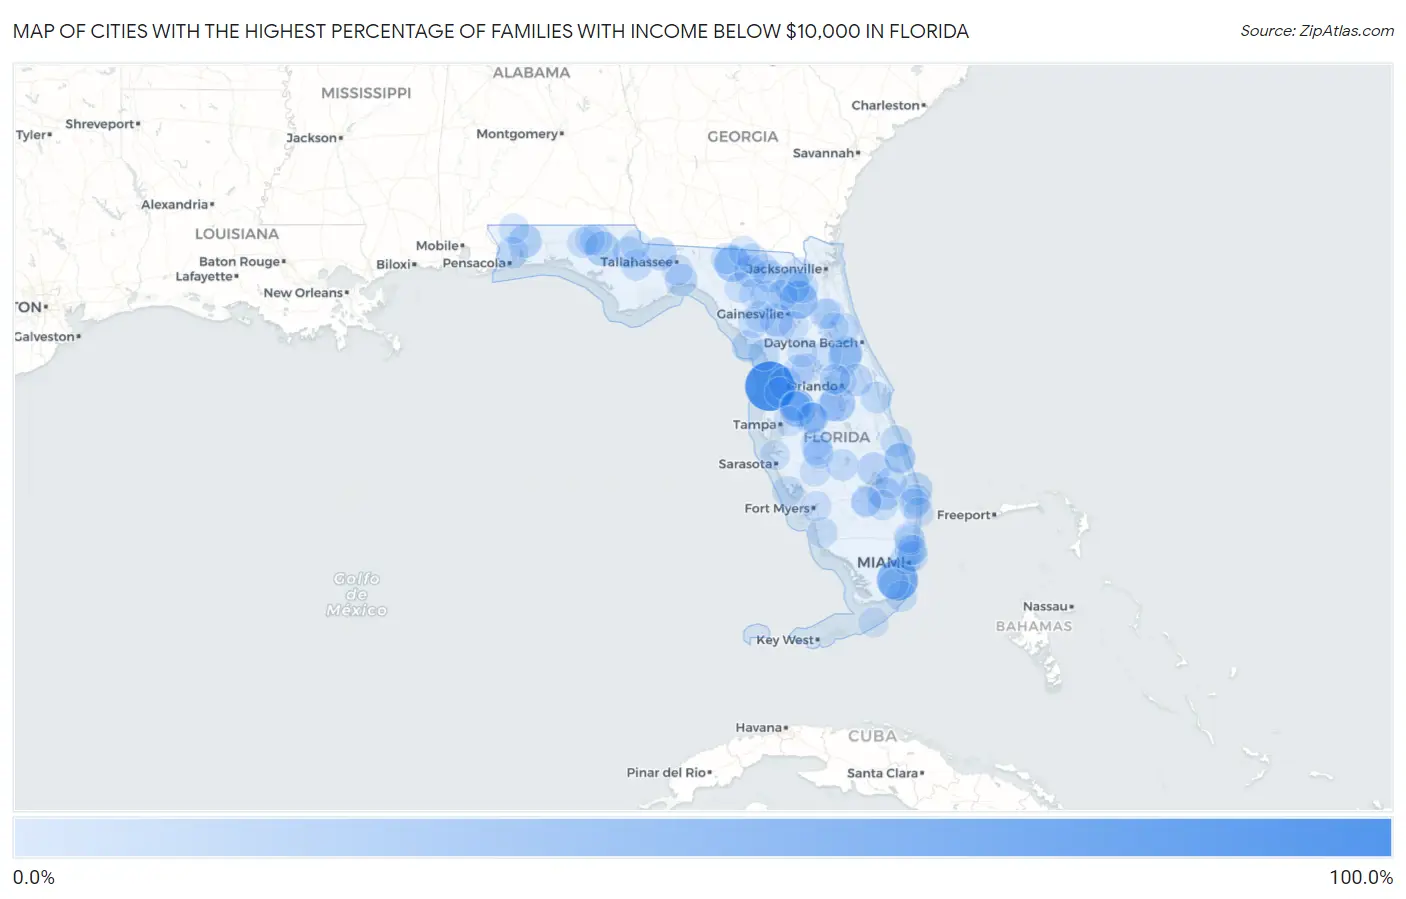
Map of Cities with the Highest Percentage of Families with Income Below $10,000 in Florida
0.0%
100.0%
Cities with the Highest Percentage of Families with Income Below $10,000 in Florida
| City | Families with Income < $10k | vs State | vs National | |
| 1. | Bayport | 100.0% | 3.2%(+96.8)#1 | 3.1%(+96.9)#10 |
| 2. | Homestead Base | 60.0% | 3.2%(+56.8)#2 | 3.1%(+56.9)#85 |
| 3. | Hampton | 42.9% | 3.2%(+39.7)#3 | 3.1%(+39.8)#181 |
| 4. | Crystal Springs | 36.7% | 3.2%(+33.5)#4 | 3.1%(+33.6)#264 |
| 5. | Lee | 36.0% | 3.2%(+32.8)#5 | 3.1%(+32.9)#277 |
| 6. | Campbell | 33.2% | 3.2%(+30.0)#6 | 3.1%(+30.1)#334 |
| 7. | Wausau | 28.9% | 3.2%(+25.7)#7 | 3.1%(+25.8)#436 |
| 8. | Raiford | 28.8% | 3.2%(+25.6)#8 | 3.1%(+25.7)#443 |
| 9. | Winding Cypress | 26.3% | 3.2%(+23.1)#9 | 3.1%(+23.2)#528 |
| 10. | Deland Southwest | 23.1% | 3.2%(+19.9)#10 | 3.1%(+20.0)#695 |
| 11. | Springhill | 23.1% | 3.2%(+19.9)#11 | 3.1%(+20.0)#700 |
| 12. | Quincy | 21.8% | 3.2%(+18.6)#12 | 3.1%(+18.7)#770 |
| 13. | Archer | 21.5% | 3.2%(+18.3)#13 | 3.1%(+18.4)#787 |
| 14. | Cypress Quarters | 21.0% | 3.2%(+17.8)#14 | 3.1%(+17.9)#821 |
| 15. | Canal Point | 20.2% | 3.2%(+17.0)#15 | 3.1%(+17.1)#882 |
| 16. | Jupiter Inlet Colony | 19.7% | 3.2%(+16.5)#16 | 3.1%(+16.6)#932 |
| 17. | North Brooksville | 19.6% | 3.2%(+16.4)#17 | 3.1%(+16.5)#935 |
| 18. | North Deland | 19.4% | 3.2%(+16.2)#18 | 3.1%(+16.3)#960 |
| 19. | Five Points | 18.5% | 3.2%(+15.3)#19 | 3.1%(+15.4)#1,043 |
| 20. | Chuluota | 18.4% | 3.2%(+15.2)#20 | 3.1%(+15.3)#1,053 |
| 21. | St Marks | 17.9% | 3.2%(+14.7)#21 | 3.1%(+14.8)#1,117 |
| 22. | Crystal Lake | 17.2% | 3.2%(+14.0)#22 | 3.1%(+14.1)#1,177 |
| 23. | Live Oak | 16.8% | 3.2%(+13.6)#23 | 3.1%(+13.7)#1,225 |
| 24. | Floridatown | 16.7% | 3.2%(+13.5)#24 | 3.1%(+13.6)#1,242 |
| 25. | Altha | 16.0% | 3.2%(+12.8)#25 | 3.1%(+12.9)#1,320 |
| 26. | Cedar Key | 15.9% | 3.2%(+12.7)#26 | 3.1%(+12.8)#1,335 |
| 27. | Zephyrhills North | 15.6% | 3.2%(+12.4)#27 | 3.1%(+12.5)#1,365 |
| 28. | Cocoa West | 15.2% | 3.2%(+12.0)#28 | 3.1%(+12.1)#1,433 |
| 29. | Gifford | 15.2% | 3.2%(+12.0)#29 | 3.1%(+12.1)#1,434 |
| 30. | Lake Placid | 15.2% | 3.2%(+12.0)#30 | 3.1%(+12.1)#1,435 |
| 31. | Bonifay | 15.0% | 3.2%(+11.8)#31 | 3.1%(+11.9)#1,454 |
| 32. | Fort White | 14.6% | 3.2%(+11.4)#32 | 3.1%(+11.5)#1,541 |
| 33. | Gladeview | 14.4% | 3.2%(+11.2)#33 | 3.1%(+11.3)#1,560 |
| 34. | Yankeetown | 14.2% | 3.2%(+11.0)#34 | 3.1%(+11.1)#1,638 |
| 35. | Indiantown | 14.1% | 3.2%(+10.9)#35 | 3.1%(+11.0)#1,640 |
| 36. | Bunnell | 14.1% | 3.2%(+10.9)#36 | 3.1%(+11.0)#1,643 |
| 37. | Mangonia Park | 14.1% | 3.2%(+10.9)#37 | 3.1%(+11.0)#1,646 |
| 38. | Pembroke Park | 13.9% | 3.2%(+10.7)#38 | 3.1%(+10.8)#1,684 |
| 39. | Zephyrhills South | 13.5% | 3.2%(+10.3)#39 | 3.1%(+10.4)#1,760 |
| 40. | Lawtey | 13.2% | 3.2%(+10.00)#40 | 3.1%(+10.1)#1,838 |
| 41. | Lake Mystic | 13.2% | 3.2%(+10.00)#41 | 3.1%(+10.1)#1,840 |
| 42. | Madison | 13.0% | 3.2%(+9.80)#42 | 3.1%(+9.90)#1,873 |
| 43. | Fort Pierce South | 12.7% | 3.2%(+9.50)#43 | 3.1%(+9.60)#1,937 |
| 44. | Bowling Green | 12.5% | 3.2%(+9.30)#44 | 3.1%(+9.40)#1,981 |
| 45. | North Key Largo | 12.2% | 3.2%(+9.00)#45 | 3.1%(+9.10)#2,070 |
| 46. | Trenton | 12.1% | 3.2%(+8.90)#46 | 3.1%(+9.00)#2,096 |
| 47. | Grove City | 12.1% | 3.2%(+8.90)#47 | 3.1%(+9.00)#2,097 |
| 48. | Manatee Road | 12.0% | 3.2%(+8.80)#48 | 3.1%(+8.90)#2,127 |
| 49. | Jennings | 11.9% | 3.2%(+8.70)#49 | 3.1%(+8.80)#2,159 |
| 50. | Masaryktown | 11.8% | 3.2%(+8.60)#50 | 3.1%(+8.70)#2,190 |
| 51. | Woodville | 11.6% | 3.2%(+8.40)#51 | 3.1%(+8.50)#2,238 |
| 52. | Jasper | 11.4% | 3.2%(+8.20)#52 | 3.1%(+8.30)#2,318 |
| 53. | Lake Panasoffkee | 11.3% | 3.2%(+8.10)#53 | 3.1%(+8.20)#2,351 |
| 54. | Worthington Springs | 11.1% | 3.2%(+7.90)#54 | 3.1%(+8.00)#2,436 |
| 55. | Surfside | 11.0% | 3.2%(+7.80)#55 | 3.1%(+7.90)#2,458 |
| 56. | Island Walk | 11.0% | 3.2%(+7.80)#56 | 3.1%(+7.90)#2,462 |
| 57. | Ponce De Leon | 11.0% | 3.2%(+7.80)#57 | 3.1%(+7.90)#2,474 |
| 58. | Schall Circle | 10.9% | 3.2%(+7.70)#58 | 3.1%(+7.80)#2,500 |
| 59. | Caryville | 10.9% | 3.2%(+7.70)#59 | 3.1%(+7.80)#2,505 |
| 60. | Raleigh | 10.6% | 3.2%(+7.40)#60 | 3.1%(+7.50)#2,606 |
| 61. | Arcadia | 10.4% | 3.2%(+7.20)#61 | 3.1%(+7.30)#2,668 |
| 62. | Eatonville | 10.3% | 3.2%(+7.10)#62 | 3.1%(+7.20)#2,713 |
| 63. | Fort Pierce | 10.2% | 3.2%(+7.00)#63 | 3.1%(+7.10)#2,746 |
| 64. | East Palatka | 10.2% | 3.2%(+7.00)#64 | 3.1%(+7.10)#2,773 |
| 65. | Wildwood | 10.1% | 3.2%(+6.90)#65 | 3.1%(+7.00)#2,791 |
| 66. | Mayo | 10.1% | 3.2%(+6.90)#66 | 3.1%(+7.00)#2,804 |
| 67. | Palatka | 10.0% | 3.2%(+6.80)#67 | 3.1%(+6.90)#2,825 |
| 68. | Zephyrhills West | 9.9% | 3.2%(+6.70)#68 | 3.1%(+6.80)#2,896 |
| 69. | Wauchula | 9.9% | 3.2%(+6.70)#69 | 3.1%(+6.80)#2,900 |
| 70. | Lauderdale Lakes | 9.8% | 3.2%(+6.60)#70 | 3.1%(+6.70)#2,929 |
| 71. | Loughman | 9.8% | 3.2%(+6.60)#71 | 3.1%(+6.70)#2,932 |
| 72. | Zolfo Springs | 9.8% | 3.2%(+6.60)#72 | 3.1%(+6.70)#2,948 |
| 73. | Tice | 9.7% | 3.2%(+6.50)#73 | 3.1%(+6.60)#2,983 |
| 74. | Harlem | 9.7% | 3.2%(+6.50)#74 | 3.1%(+6.60)#2,998 |
| 75. | Manalapan | 9.7% | 3.2%(+6.50)#75 | 3.1%(+6.60)#3,018 |
| 76. | Vero Lake Estates | 9.5% | 3.2%(+6.30)#76 | 3.1%(+6.40)#3,068 |
| 77. | Combee Settlement | 9.5% | 3.2%(+6.30)#77 | 3.1%(+6.40)#3,072 |
| 78. | Belle Glade | 9.4% | 3.2%(+6.20)#78 | 3.1%(+6.30)#3,120 |
| 79. | Washington Park | 9.3% | 3.2%(+6.10)#79 | 3.1%(+6.20)#3,182 |
| 80. | Jay | 9.3% | 3.2%(+6.10)#80 | 3.1%(+6.20)#3,198 |
| 81. | Branford | 9.1% | 3.2%(+5.90)#81 | 3.1%(+6.00)#3,299 |
| 82. | Hallandale Beach | 9.0% | 3.2%(+5.80)#82 | 3.1%(+5.90)#3,328 |
| 83. | Florida City | 9.0% | 3.2%(+5.80)#83 | 3.1%(+5.90)#3,337 |
| 84. | Gulf Gate | 9.0% | 3.2%(+5.80)#84 | 3.1%(+5.90)#3,341 |
| 85. | Clewiston | 9.0% | 3.2%(+5.80)#85 | 3.1%(+5.90)#3,343 |
| 86. | West Samoset | 8.9% | 3.2%(+5.70)#86 | 3.1%(+5.80)#3,388 |
| 87. | Fussels Corner | 8.9% | 3.2%(+5.70)#87 | 3.1%(+5.80)#3,390 |
| 88. | Clarcona | 8.9% | 3.2%(+5.70)#88 | 3.1%(+5.80)#3,391 |
| 89. | Crescent City | 8.9% | 3.2%(+5.70)#89 | 3.1%(+5.80)#3,402 |
| 90. | South Apopka | 8.8% | 3.2%(+5.60)#90 | 3.1%(+5.70)#3,439 |
| 91. | Pine Ridge Cdp Collier County | 8.8% | 3.2%(+5.60)#91 | 3.1%(+5.70)#3,457 |
| 92. | Mango | 8.7% | 3.2%(+5.50)#92 | 3.1%(+5.60)#3,498 |
| 93. | Macclenny | 8.7% | 3.2%(+5.50)#93 | 3.1%(+5.60)#3,503 |
| 94. | White Springs | 8.7% | 3.2%(+5.50)#94 | 3.1%(+5.60)#3,525 |
| 95. | University Cdp Hillsborough County | 8.6% | 3.2%(+5.40)#95 | 3.1%(+5.50)#3,549 |
| 96. | Mcintosh | 8.6% | 3.2%(+5.40)#96 | 3.1%(+5.50)#3,595 |
| 97. | Layton | 8.6% | 3.2%(+5.40)#97 | 3.1%(+5.50)#3,602 |
| 98. | Grand Ridge | 8.5% | 3.2%(+5.30)#98 | 3.1%(+5.40)#3,632 |
| 99. | Pittman | 8.5% | 3.2%(+5.30)#99 | 3.1%(+5.40)#3,646 |
| 100. | Belleview | 8.4% | 3.2%(+5.20)#100 | 3.1%(+5.30)#3,660 |
Common Questions
What are the Top 10 Cities with the Highest Percentage of Families with Income Below $10,000 in Florida?
Top 10 Cities with the Highest Percentage of Families with Income Below $10,000 in Florida are:
#1
100.0%
#2
60.0%
#3
42.9%
#4
36.7%
#5
36.0%
#6
33.2%
#7
28.9%
#8
28.8%
#9
23.1%
#10
23.1%
What city has the Highest Percentage of Families with Income Below $10,000 in Florida?
Bayport has the Highest Percentage of Families with Income Below $10,000 in Florida with 100.0%.
What is the Percentage of Families with Income Below $10,000 in the State of Florida?
Percentage of Families with Income Below $10,000 in Florida is 3.2%.
What is the Percentage of Families with Income Below $10,000 in the United States?
Percentage of Families with Income Below $10,000 in the United States is 3.1%.