El Nido, CA Map & Demographics
El Nido Map
El Nido Overview
$23,552
PER CAPITA INCOME
$53,276
AVG FAMILY INCOME
$52,716
AVG HOUSEHOLD INCOME
0.66
INEQUALITY / GINI INDEX
459
TOTAL POPULATION
256
MALE POPULATION
203
FEMALE POPULATION
126.11
MALES / 100 FEMALES
79.30
FEMALES / 100 MALES
22.2
MEDIAN AGE
4.2
AVG FAMILY SIZE
4.0
AVG HOUSEHOLD SIZE
148
LABOR FORCE [ PEOPLE ]
54.8%
PERCENT IN LABOR FORCE
4.1%
UNEMPLOYMENT RATE
El Nido Zip Codes
El Nido Area Codes
Income in El Nido
Income Overview in El Nido
Per Capita Income in El Nido is $23,552, while median incomes of families and households are $53,276 and $52,716 respectively.
| Characteristic | Number | Measure |
| Per Capita Income | 459 | $23,552 |
| Median Family Income | 102 | $53,276 |
| Mean Family Income | 102 | $102,861 |
| Median Household Income | 115 | $52,716 |
| Mean Household Income | 115 | $91,342 |
| Income Deficit | 102 | $0 |
| Wage / Income Gap (%) | 459 | 0.00% |
| Wage / Income Gap ($) | 459 | 100.00¢ per $1 |
| Gini / Inequality Index | 459 | 0.66 |
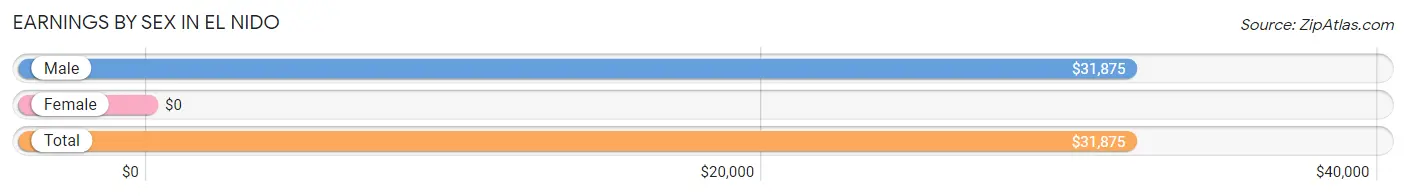
Earnings by Sex in El Nido
| Sex | Number | Average Earnings |
| Male | 141 (88.7%) | $31,875 |
| Female | 18 (11.3%) | $0 |
| Total | 159 (100.0%) | $31,875 |
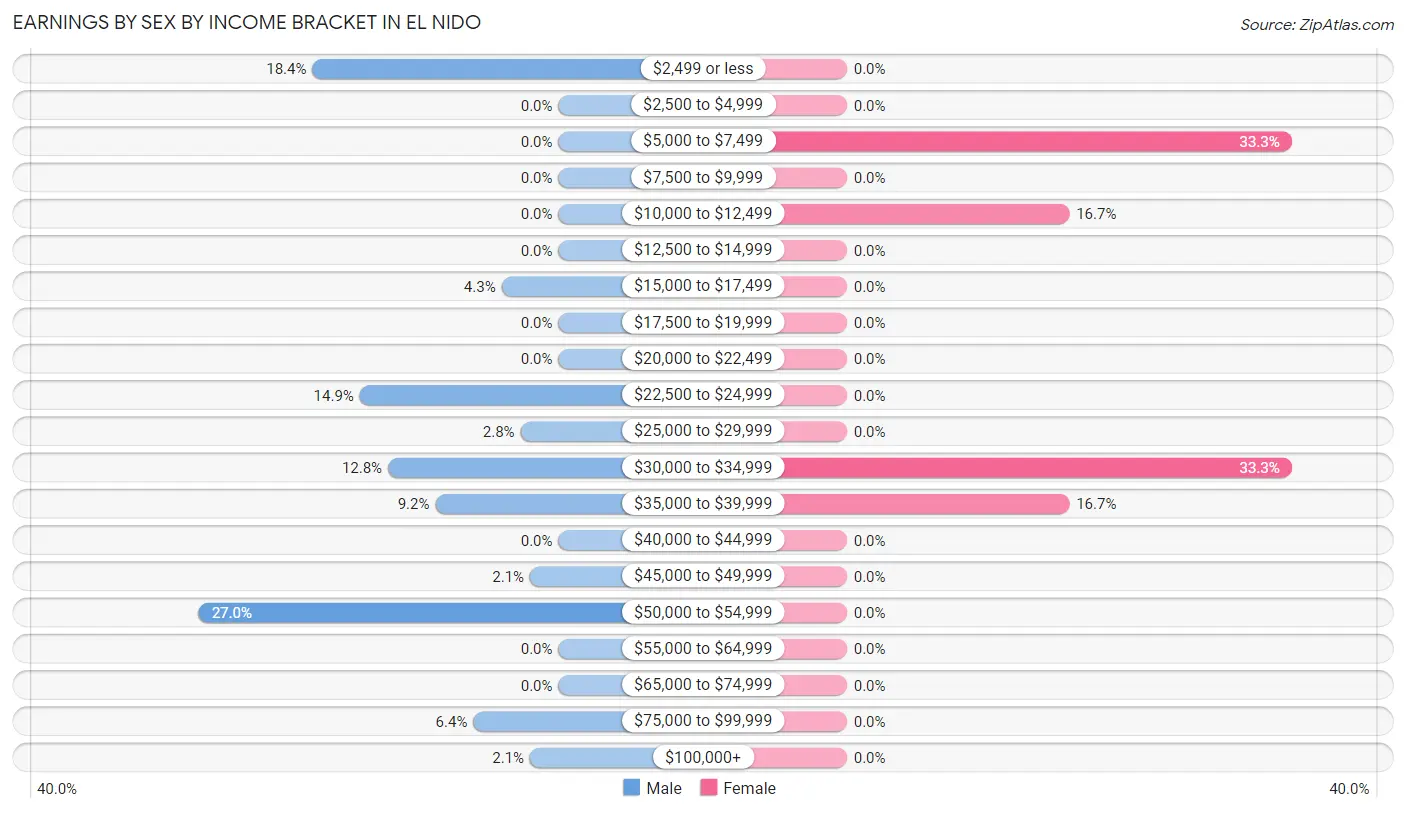
Earnings by Sex by Income Bracket in El Nido
The most common earnings brackets in El Nido are $50,000 to $54,999 for men (38 | 27.0%) and $5,000 to $7,499 for women (6 | 33.3%).
| Income | Male | Female |
| $2,499 or less | 26 (18.4%) | 0 (0.0%) |
| $2,500 to $4,999 | 0 (0.0%) | 0 (0.0%) |
| $5,000 to $7,499 | 0 (0.0%) | 6 (33.3%) |
| $7,500 to $9,999 | 0 (0.0%) | 0 (0.0%) |
| $10,000 to $12,499 | 0 (0.0%) | 3 (16.7%) |
| $12,500 to $14,999 | 0 (0.0%) | 0 (0.0%) |
| $15,000 to $17,499 | 6 (4.3%) | 0 (0.0%) |
| $17,500 to $19,999 | 0 (0.0%) | 0 (0.0%) |
| $20,000 to $22,499 | 0 (0.0%) | 0 (0.0%) |
| $22,500 to $24,999 | 21 (14.9%) | 0 (0.0%) |
| $25,000 to $29,999 | 4 (2.8%) | 0 (0.0%) |
| $30,000 to $34,999 | 18 (12.8%) | 6 (33.3%) |
| $35,000 to $39,999 | 13 (9.2%) | 3 (16.7%) |
| $40,000 to $44,999 | 0 (0.0%) | 0 (0.0%) |
| $45,000 to $49,999 | 3 (2.1%) | 0 (0.0%) |
| $50,000 to $54,999 | 38 (27.0%) | 0 (0.0%) |
| $55,000 to $64,999 | 0 (0.0%) | 0 (0.0%) |
| $65,000 to $74,999 | 0 (0.0%) | 0 (0.0%) |
| $75,000 to $99,999 | 9 (6.4%) | 0 (0.0%) |
| $100,000+ | 3 (2.1%) | 0 (0.0%) |
| Total | 141 (100.0%) | 18 (100.0%) |
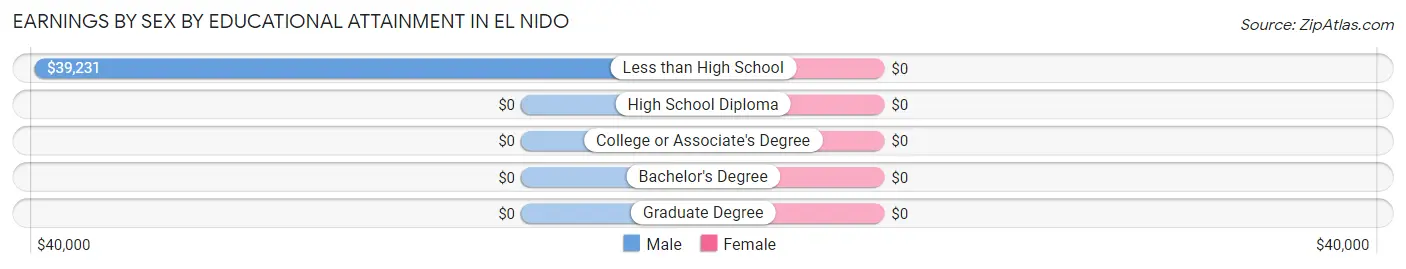
Earnings by Sex by Educational Attainment in El Nido
| Educational Attainment | Male Income | Female Income |
| Less than High School | $39,231 | $0 |
| High School Diploma | - | - |
| College or Associate's Degree | - | - |
| Bachelor's Degree | - | - |
| Graduate Degree | - | - |
| Total | $46,667 | $0 |
Family Income in El Nido
Family Income Brackets in El Nido
According to the El Nido family income data, there are 60 families falling into the $50,000 to $74,999 income range, which is the most common income bracket and makes up 58.8% of all families.
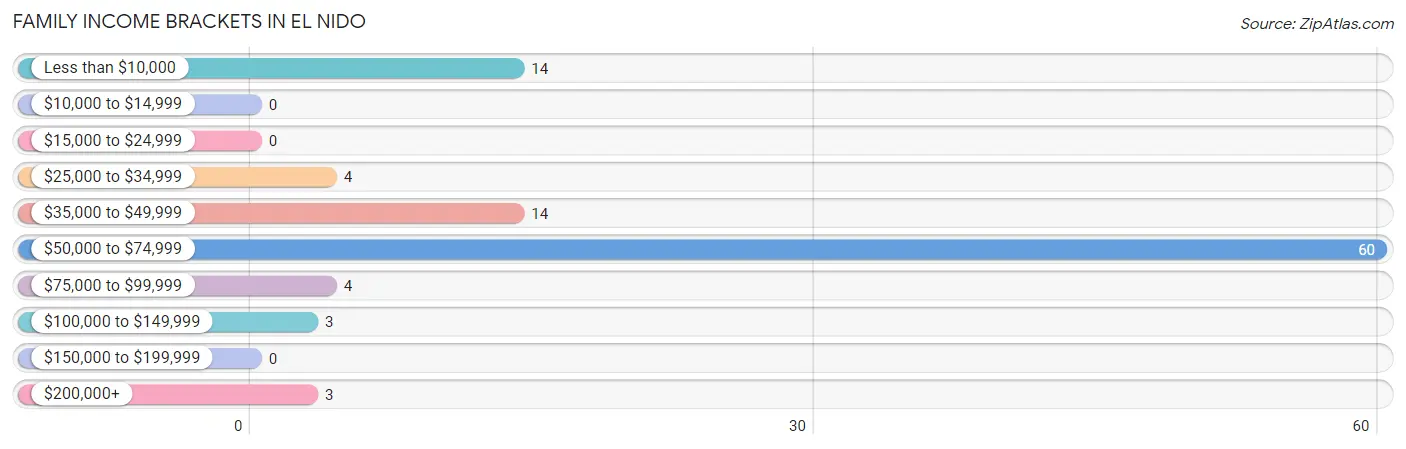
| Income Bracket | # Families | % Families |
| Less than $10,000 | 14 | 13.7% |
| $10,000 to $14,999 | 0 | 0.0% |
| $15,000 to $24,999 | 0 | 0.0% |
| $25,000 to $34,999 | 4 | 3.9% |
| $35,000 to $49,999 | 14 | 13.7% |
| $50,000 to $74,999 | 60 | 58.8% |
| $75,000 to $99,999 | 4 | 3.9% |
| $100,000 to $149,999 | 3 | 2.9% |
| $150,000 to $199,999 | 0 | 0.0% |
| $200,000+ | 3 | 2.9% |
Family Income by Famaliy Size in El Nido
6-person families (36 | 35.3%) account for the highest median family income in El Nido with $62,813 per family, while 3-person families (37 | 36.3%) have the highest median income of $17,917 per family member.
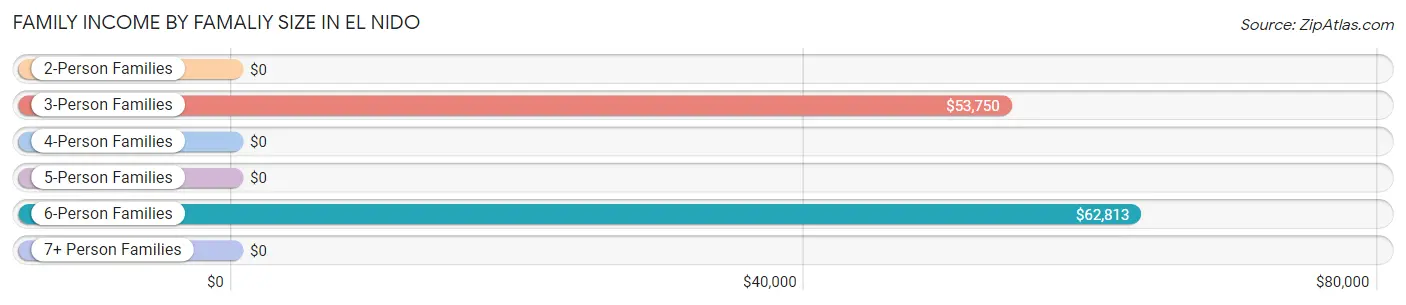
| Income Bracket | # Families | Median Income |
| 2-Person Families | 14 (13.7%) | $0 |
| 3-Person Families | 37 (36.3%) | $53,750 |
| 4-Person Families | 7 (6.9%) | $0 |
| 5-Person Families | 8 (7.8%) | $0 |
| 6-Person Families | 36 (35.3%) | $62,813 |
| 7+ Person Families | 0 (0.0%) | $0 |
| Total | 102 (100.0%) | $53,276 |
Family Income by Number of Earners in El Nido
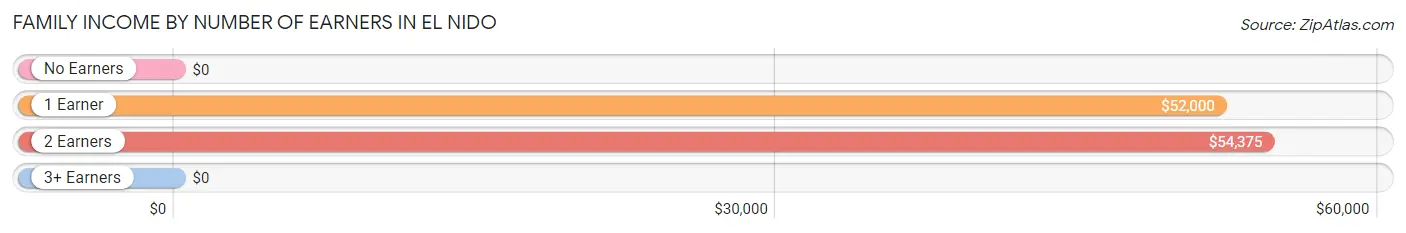
| Number of Earners | # Families | Median Income |
| No Earners | 11 (10.8%) | $0 |
| 1 Earner | 40 (39.2%) | $52,000 |
| 2 Earners | 45 (44.1%) | $54,375 |
| 3+ Earners | 6 (5.9%) | $0 |
| Total | 102 (100.0%) | $53,276 |
Household Income in El Nido
Household Income Brackets in El Nido
With 60 households falling in the category, the $50,000 to $74,999 income range is the most frequent in El Nido, accounting for 52.2% of all households.
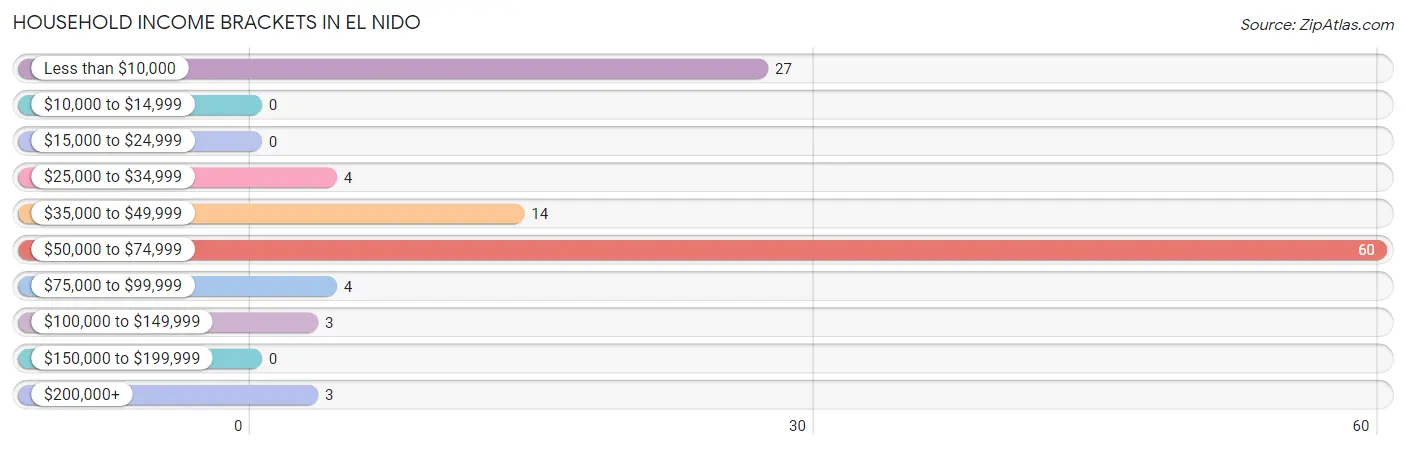
| Income Bracket | # Households | % Households |
| Less than $10,000 | 27 | 23.5% |
| $10,000 to $14,999 | 0 | 0.0% |
| $15,000 to $24,999 | 0 | 0.0% |
| $25,000 to $34,999 | 4 | 3.5% |
| $35,000 to $49,999 | 14 | 12.2% |
| $50,000 to $74,999 | 60 | 52.2% |
| $75,000 to $99,999 | 4 | 3.5% |
| $100,000 to $149,999 | 3 | 2.6% |
| $150,000 to $199,999 | 0 | 0.0% |
| $200,000+ | 3 | 2.6% |
Household Income by Householder Age in El Nido
The median household income in El Nido is $52,716, with the highest median household income of $53,060 found in the 25 to 44 years age bracket for the primary householder. A total of 89 households (77.4%) fall into this category.
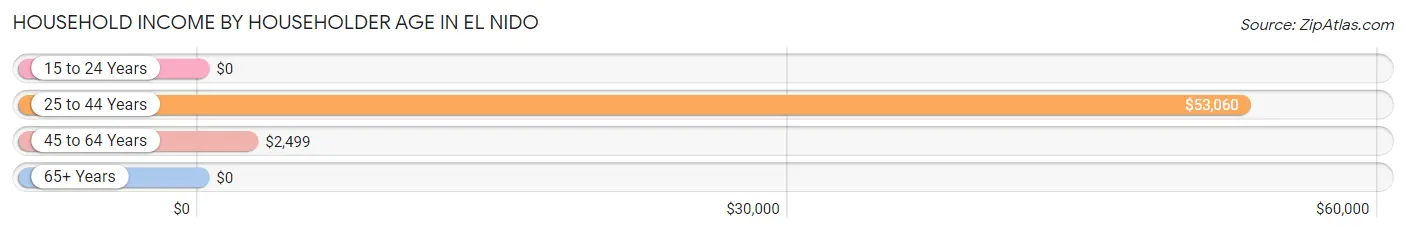
| Income Bracket | # Households | Median Income |
| 15 to 24 Years | 0 (0.0%) | $0 |
| 25 to 44 Years | 89 (77.4%) | $53,060 |
| 45 to 64 Years | 19 (16.5%) | $2,499 |
| 65+ Years | 7 (6.1%) | $0 |
| Total | 115 (100.0%) | $52,716 |
Poverty in El Nido
Income Below Poverty by Sex and Age in El Nido
With 16.4% poverty level for males and 20.2% for females among the residents of El Nido, 55 to 64 year old males and 18 to 24 year old females are the most vulnerable to poverty, with 7 males (100.0%) and 6 females (100.0%) in their respective age groups living below the poverty level.
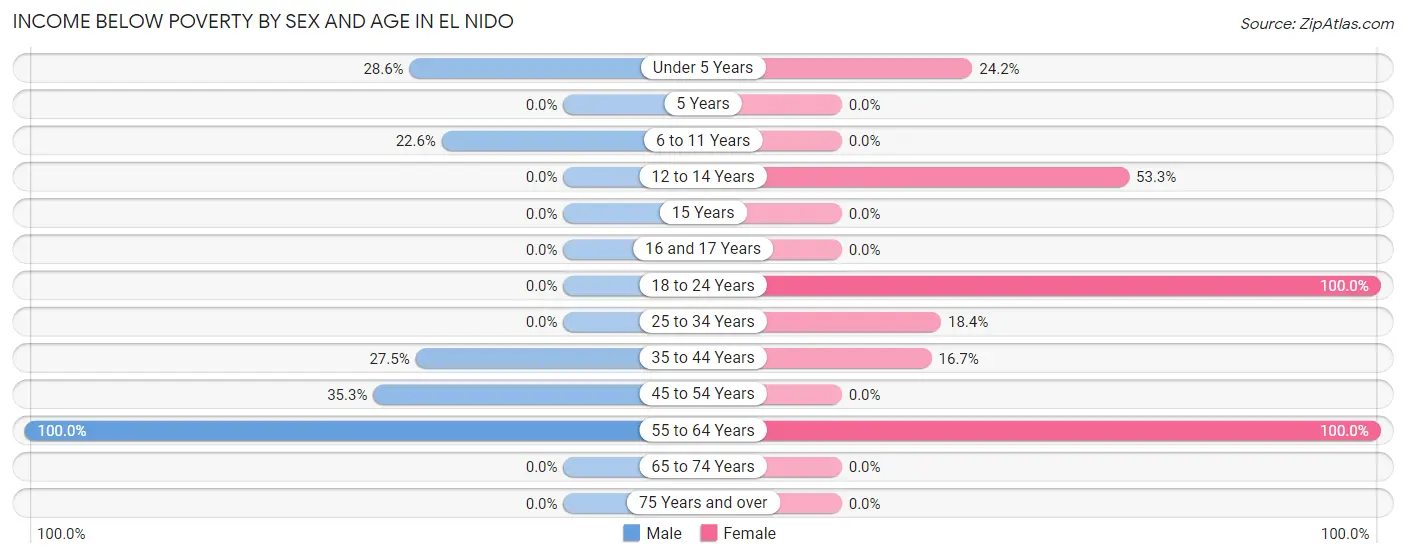
| Age Bracket | Male | Female |
| Under 5 Years | 8 (28.6%) | 8 (24.2%) |
| 5 Years | 0 (0.0%) | 0 (0.0%) |
| 6 to 11 Years | 7 (22.6%) | 0 (0.0%) |
| 12 to 14 Years | 0 (0.0%) | 8 (53.3%) |
| 15 Years | 0 (0.0%) | 0 (0.0%) |
| 16 and 17 Years | 0 (0.0%) | 0 (0.0%) |
| 18 to 24 Years | 0 (0.0%) | 6 (100.0%) |
| 25 to 34 Years | 0 (0.0%) | 7 (18.4%) |
| 35 to 44 Years | 14 (27.5%) | 7 (16.7%) |
| 45 to 54 Years | 6 (35.3%) | 0 (0.0%) |
| 55 to 64 Years | 7 (100.0%) | 5 (100.0%) |
| 65 to 74 Years | 0 (0.0%) | 0 (0.0%) |
| 75 Years and over | 0 (0.0%) | 0 (0.0%) |
| Total | 42 (16.4%) | 41 (20.2%) |
Income Above Poverty by Sex and Age in El Nido
According to the poverty statistics in El Nido, males aged 5 years and females aged 5 years are the age groups that are most secure financially, with 100.0% of males and 100.0% of females in these age groups living above the poverty line.
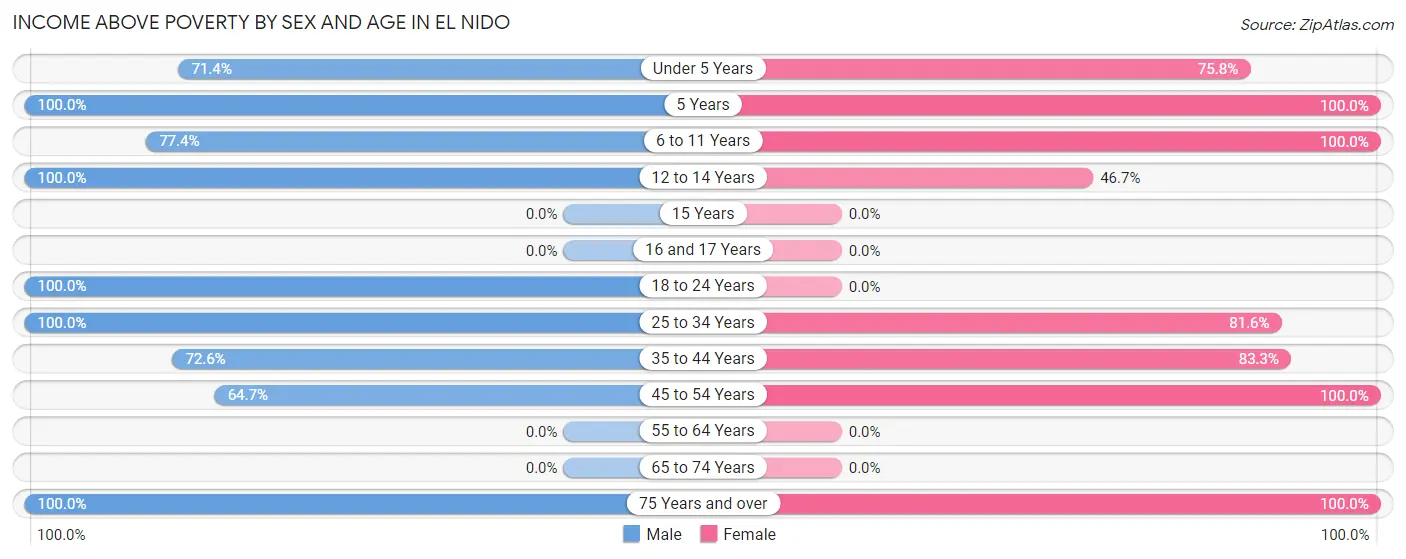
| Age Bracket | Male | Female |
| Under 5 Years | 20 (71.4%) | 25 (75.8%) |
| 5 Years | 10 (100.0%) | 16 (100.0%) |
| 6 to 11 Years | 24 (77.4%) | 35 (100.0%) |
| 12 to 14 Years | 21 (100.0%) | 7 (46.7%) |
| 15 Years | 0 (0.0%) | 0 (0.0%) |
| 16 and 17 Years | 0 (0.0%) | 0 (0.0%) |
| 18 to 24 Years | 47 (100.0%) | 0 (0.0%) |
| 25 to 34 Years | 37 (100.0%) | 31 (81.6%) |
| 35 to 44 Years | 37 (72.6%) | 35 (83.3%) |
| 45 to 54 Years | 11 (64.7%) | 6 (100.0%) |
| 55 to 64 Years | 0 (0.0%) | 0 (0.0%) |
| 65 to 74 Years | 0 (0.0%) | 0 (0.0%) |
| 75 Years and over | 7 (100.0%) | 7 (100.0%) |
| Total | 214 (83.6%) | 162 (79.8%) |
Income Below Poverty Among Married-Couple Families in El Nido
The poverty statistics for married-couple families in El Nido show that 14.7% or 14 of the total 95 families live below the poverty line. Families with 3 or 4 children have the highest poverty rate of 18.9%, comprising of 7 families. On the other hand, families with 1 or 2 children have the lowest poverty rate of 0.0%, which includes 0 families.
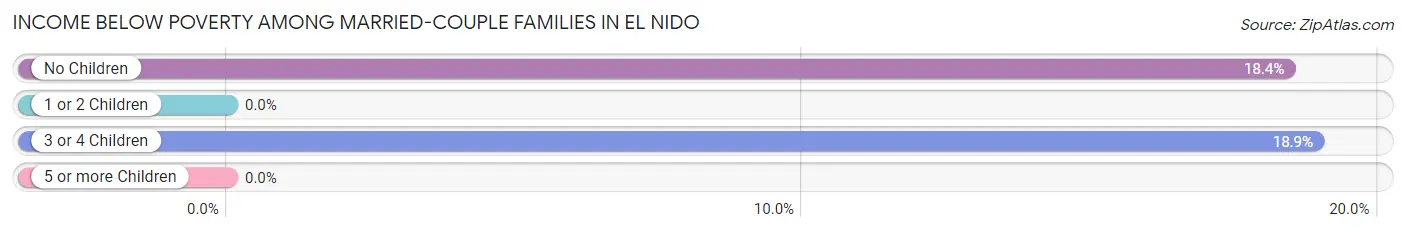
| Children | Above Poverty | Below Poverty |
| No Children | 31 (81.6%) | 7 (18.4%) |
| 1 or 2 Children | 20 (100.0%) | 0 (0.0%) |
| 3 or 4 Children | 30 (81.1%) | 7 (18.9%) |
| 5 or more Children | 0 (0.0%) | 0 (0.0%) |
| Total | 81 (85.3%) | 14 (14.7%) |
Income Below Poverty Among Single-Parent Households in El Nido
| Children | Single Father | Single Mother |
| No Children | 0 (0.0%) | 0 (0.0%) |
| 1 or 2 Children | 0 (0.0%) | 0 (0.0%) |
| 3 or 4 Children | 0 (0.0%) | 0 (0.0%) |
| 5 or more Children | 0 (0.0%) | 0 (0.0%) |
| Total | 0 (0.0%) | 0 (0.0%) |
Income Below Poverty Among Married-Couple vs Single-Parent Households in El Nido
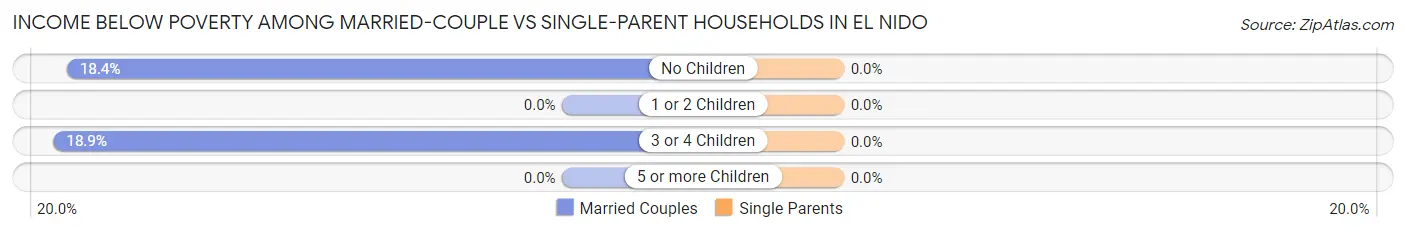
| Children | Married-Couple Families | Single-Parent Households |
| No Children | 7 (18.4%) | 0 (0.0%) |
| 1 or 2 Children | 0 (0.0%) | 0 (0.0%) |
| 3 or 4 Children | 7 (18.9%) | 0 (0.0%) |
| 5 or more Children | 0 (0.0%) | 0 (0.0%) |
| Total | 14 (14.7%) | 0 (0.0%) |
Race in El Nido
The most populous races in El Nido are Hispanic or Latino (428 | 93.2%), Some other Race (257 | 56.0%), and White / Caucasian (132 | 28.8%).
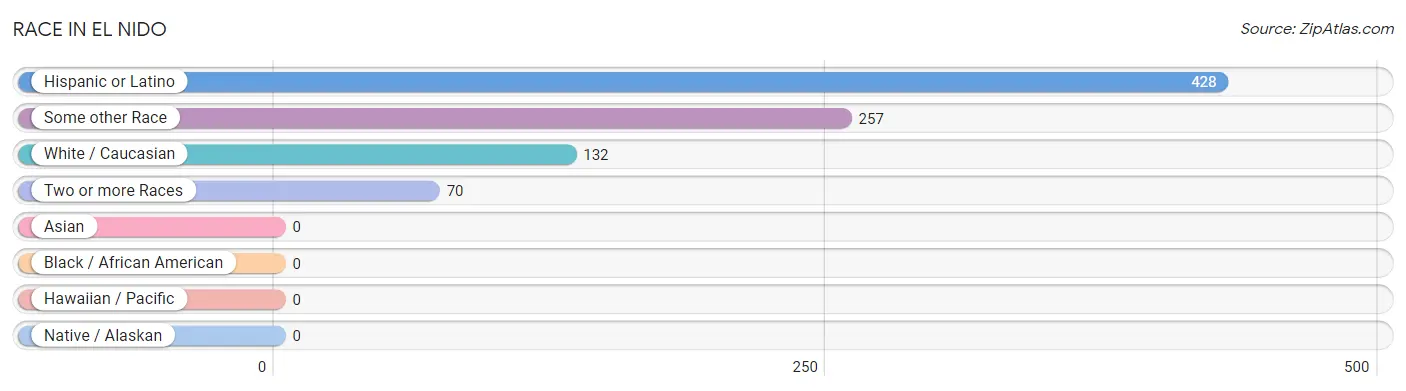
| Race | # Population | % Population |
| Asian | 0 | 0.0% |
| Black / African American | 0 | 0.0% |
| Hawaiian / Pacific | 0 | 0.0% |
| Hispanic or Latino | 428 | 93.2% |
| Native / Alaskan | 0 | 0.0% |
| White / Caucasian | 132 | 28.8% |
| Two or more Races | 70 | 15.2% |
| Some other Race | 257 | 56.0% |
| Total | 459 | 100.0% |
Ancestry in El Nido
The most populous ancestries reported in El Nido are Mexican (428 | 93.2%), English (6 | 1.3%), Irish (6 | 1.3%), German (4 | 0.9%), and Polish (4 | 0.9%), together accounting for 97.6% of all El Nido residents.
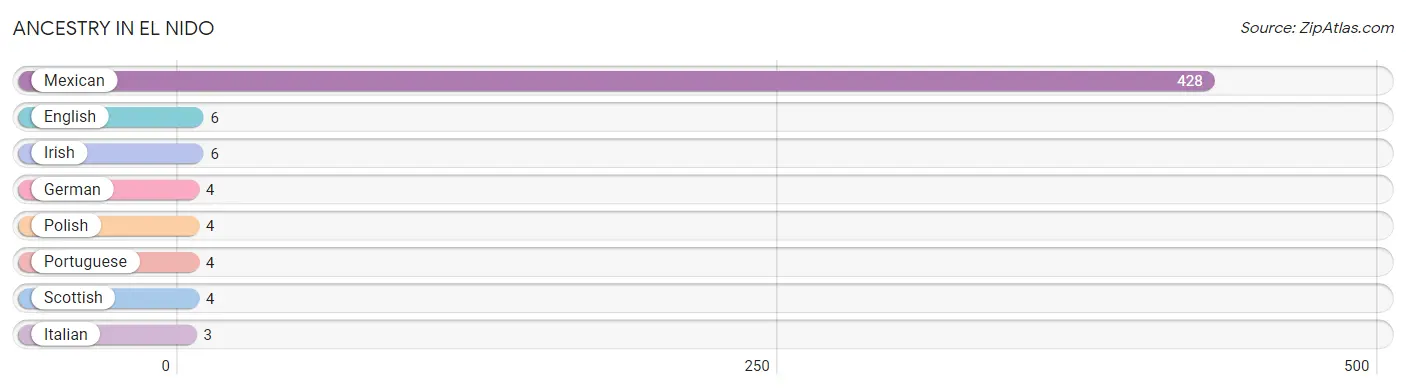
| Ancestry | # Population | % Population |
| English | 6 | 1.3% |
| German | 4 | 0.9% |
| Irish | 6 | 1.3% |
| Italian | 3 | 0.6% |
| Mexican | 428 | 93.2% |
| Polish | 4 | 0.9% |
| Portuguese | 4 | 0.9% |
| Scottish | 4 | 0.9% | View All 8 Rows |
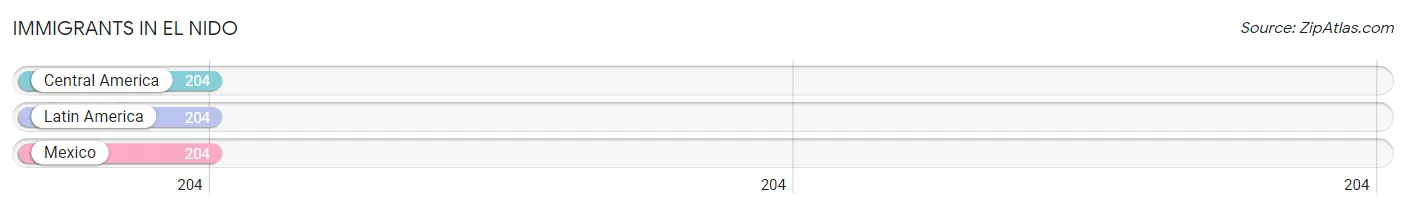
Immigrants in El Nido
The most numerous immigrant groups reported in El Nido came from Central America (204 | 44.4%), Latin America (204 | 44.4%), and Mexico (204 | 44.4%), together accounting for 133.3% of all El Nido residents.
| Immigration Origin | # Population | % Population |
| Central America | 204 | 44.4% |
| Latin America | 204 | 44.4% |
| Mexico | 204 | 44.4% | View All 3 Rows |
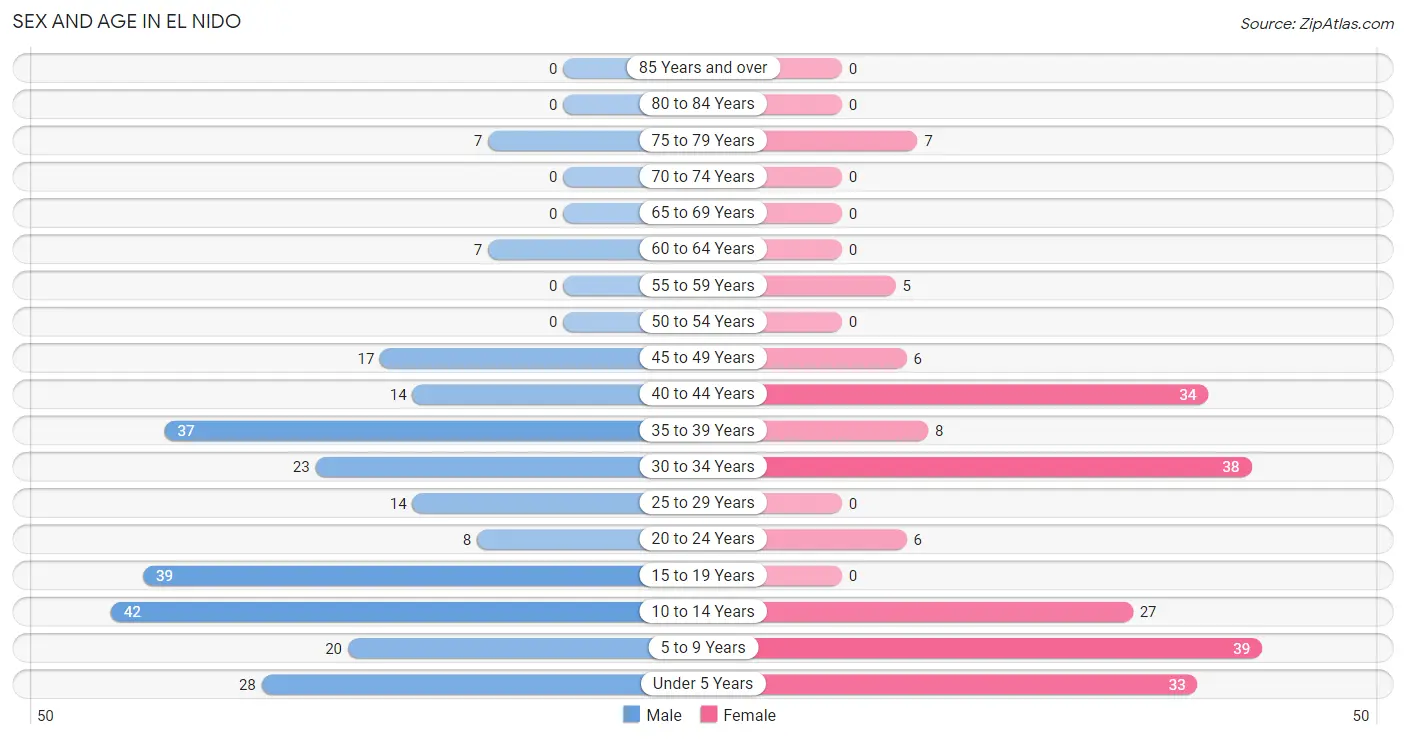
Sex and Age in El Nido
Sex and Age in El Nido
The most populous age groups in El Nido are 10 to 14 Years (42 | 16.4%) for men and 5 to 9 Years (39 | 19.2%) for women.
| Age Bracket | Male | Female |
| Under 5 Years | 28 (10.9%) | 33 (16.3%) |
| 5 to 9 Years | 20 (7.8%) | 39 (19.2%) |
| 10 to 14 Years | 42 (16.4%) | 27 (13.3%) |
| 15 to 19 Years | 39 (15.2%) | 0 (0.0%) |
| 20 to 24 Years | 8 (3.1%) | 6 (3.0%) |
| 25 to 29 Years | 14 (5.5%) | 0 (0.0%) |
| 30 to 34 Years | 23 (9.0%) | 38 (18.7%) |
| 35 to 39 Years | 37 (14.4%) | 8 (3.9%) |
| 40 to 44 Years | 14 (5.5%) | 34 (16.8%) |
| 45 to 49 Years | 17 (6.6%) | 6 (3.0%) |
| 50 to 54 Years | 0 (0.0%) | 0 (0.0%) |
| 55 to 59 Years | 0 (0.0%) | 5 (2.5%) |
| 60 to 64 Years | 7 (2.7%) | 0 (0.0%) |
| 65 to 69 Years | 0 (0.0%) | 0 (0.0%) |
| 70 to 74 Years | 0 (0.0%) | 0 (0.0%) |
| 75 to 79 Years | 7 (2.7%) | 7 (3.5%) |
| 80 to 84 Years | 0 (0.0%) | 0 (0.0%) |
| 85 Years and over | 0 (0.0%) | 0 (0.0%) |
| Total | 256 (100.0%) | 203 (100.0%) |
Families and Households in El Nido
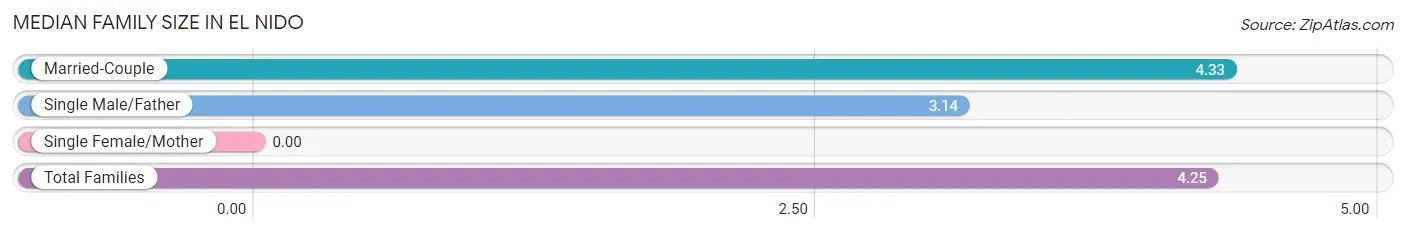
Median Family Size in El Nido
| Family Type | # Families | Family Size |
| Married-Couple | 95 (93.1%) | 4.33 |
| Single Male/Father | 7 (6.9%) | 3.14 |
| Single Female/Mother | 0 (0.0%) | - |
| Total Families | 102 (100.0%) | 4.25 |
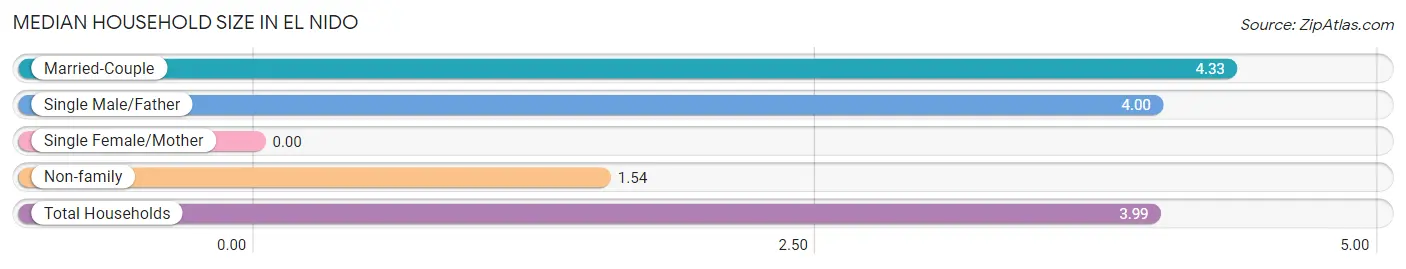
Median Household Size in El Nido
| Household Type | # Households | Household Size |
| Married-Couple | 95 (82.6%) | 4.33 |
| Single Male/Father | 7 (6.1%) | 4.00 |
| Single Female/Mother | 0 (0.0%) | - |
| Non-family | 13 (11.3%) | 1.54 |
| Total Households | 115 (100.0%) | 3.99 |
Household Size by Marriage Status in El Nido
Out of a total of 115 households in El Nido, 102 (88.7%) are family households, while 13 (11.3%) are nonfamily households. The most numerous type of family households are 6-person households, comprising 36, and the most common type of nonfamily households are 1-person households, comprising 7.
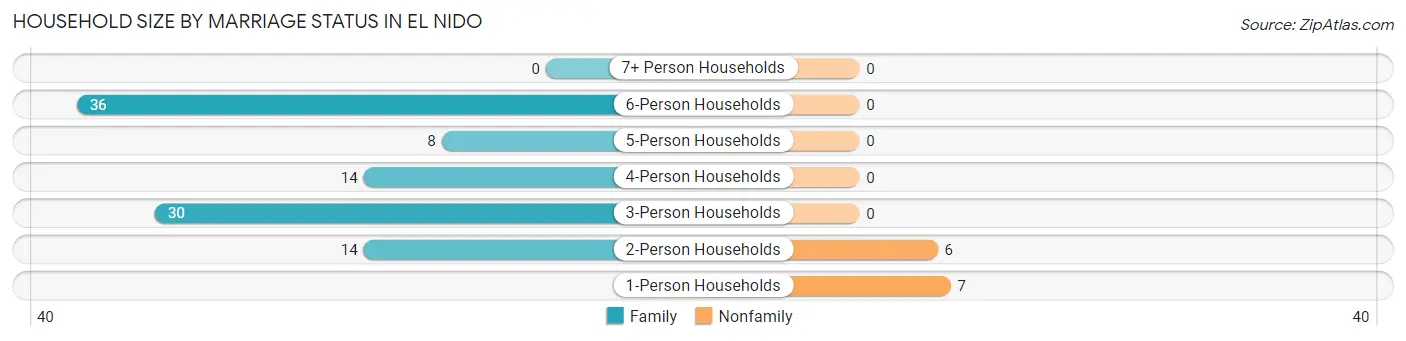
| Household Size | Family Households | Nonfamily Households |
| 1-Person Households | - | 7 (6.1%) |
| 2-Person Households | 14 (12.2%) | 6 (5.2%) |
| 3-Person Households | 30 (26.1%) | 0 (0.0%) |
| 4-Person Households | 14 (12.2%) | 0 (0.0%) |
| 5-Person Households | 8 (7.0%) | 0 (0.0%) |
| 6-Person Households | 36 (31.3%) | 0 (0.0%) |
| 7+ Person Households | 0 (0.0%) | 0 (0.0%) |
| Total | 102 (88.7%) | 13 (11.3%) |
Female Fertility in El Nido
Fertility by Age in El Nido
Average fertility rate in El Nido is 120.0 births per 1,000 women. Women in the age bracket of 20 to 34 years have the highest fertility rate with 250.0 births per 1,000 women. Women in the age bracket of 20 to 34 years acount for 100.0% of all women with births.
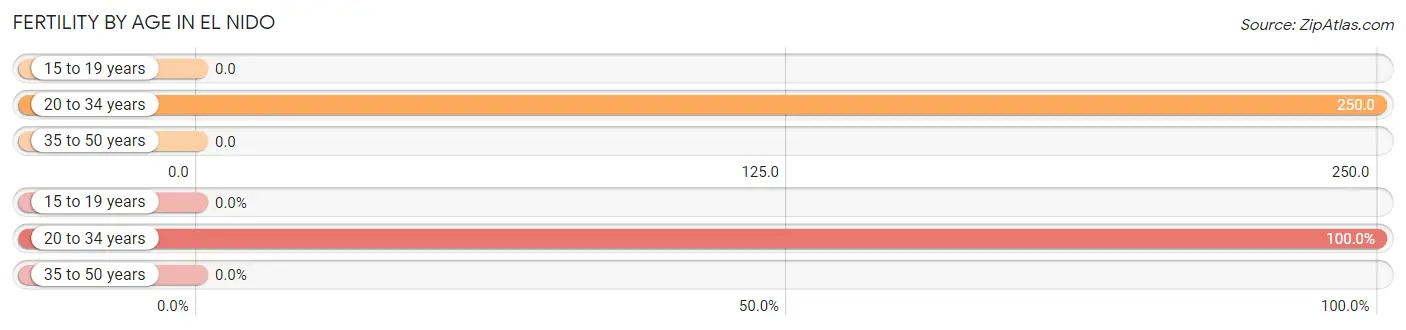
| Age Bracket | Women with Births | Births / 1,000 Women |
| 15 to 19 years | 0 (0.0%) | 0.0 |
| 20 to 34 years | 11 (100.0%) | 250.0 |
| 35 to 50 years | 0 (0.0%) | 0.0 |
| Total | 11 (100.0%) | 120.0 |
Fertility by Age by Marriage Status in El Nido
45.5% of women with births (11) in El Nido are married. The highest percentage of unmarried women with births falls into 20 to 34 years age bracket with 54.5% of them unmarried at the time of birth, while the lowest percentage of unmarried women with births belong to 20 to 34 years age bracket with 54.5% of them unmarried.
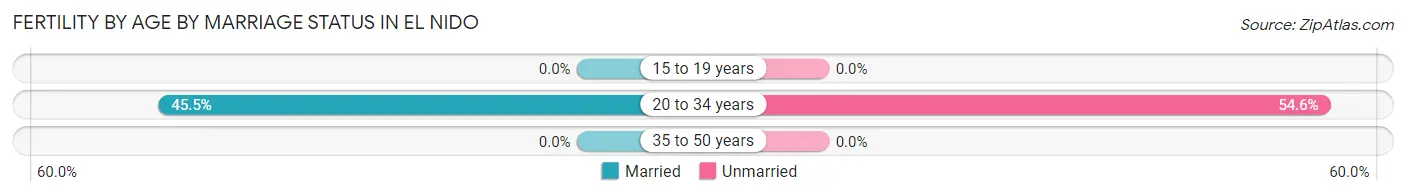
| Age Bracket | Married | Unmarried |
| 15 to 19 years | 0 (0.0%) | 0 (0.0%) |
| 20 to 34 years | 5 (45.5%) | 6 (54.5%) |
| 35 to 50 years | 0 (0.0%) | 0 (0.0%) |
| Total | 5 (45.5%) | 6 (54.5%) |
Fertility by Education in El Nido
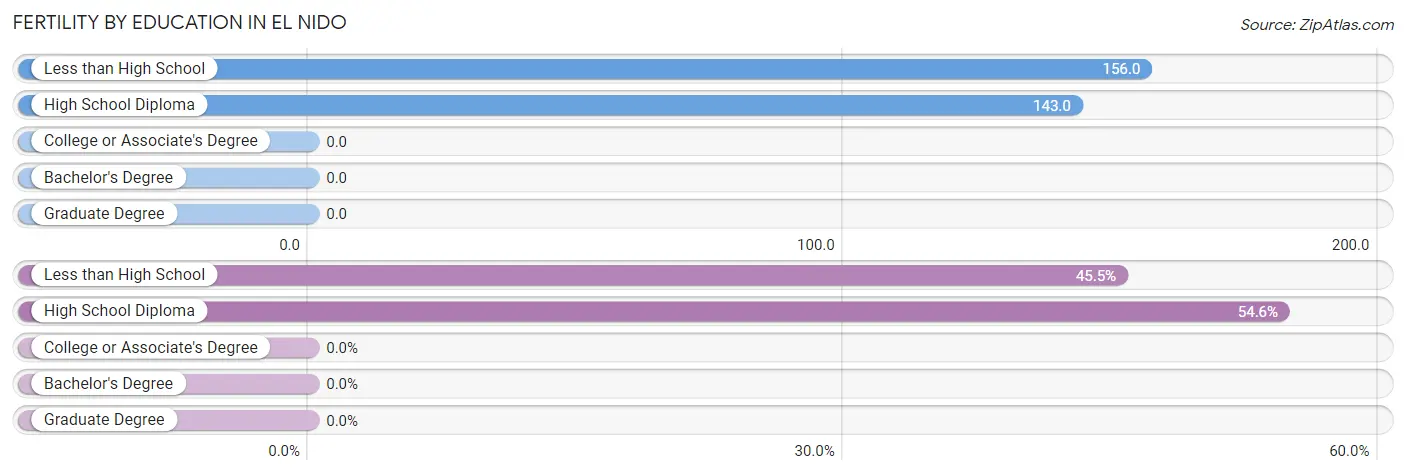
| Educational Attainment | Women with Births | Births / 1,000 Women |
| Less than High School | 5 (45.5%) | 156.0 |
| High School Diploma | 6 (54.5%) | 143.0 |
| College or Associate's Degree | 0 (0.0%) | 0.0 |
| Bachelor's Degree | 0 (0.0%) | 0.0 |
| Graduate Degree | 0 (0.0%) | 0.0 |
| Total | 11 (100.0%) | 120.0 |
Fertility by Education by Marriage Status in El Nido
54.5% of women with births in El Nido are unmarried. Women with the educational attainment of less than high school are most likely to be married with 100.0% of them married at childbirth, while women with the educational attainment of high school diploma are least likely to be married with 100.0% of them unmarried at childbirth.
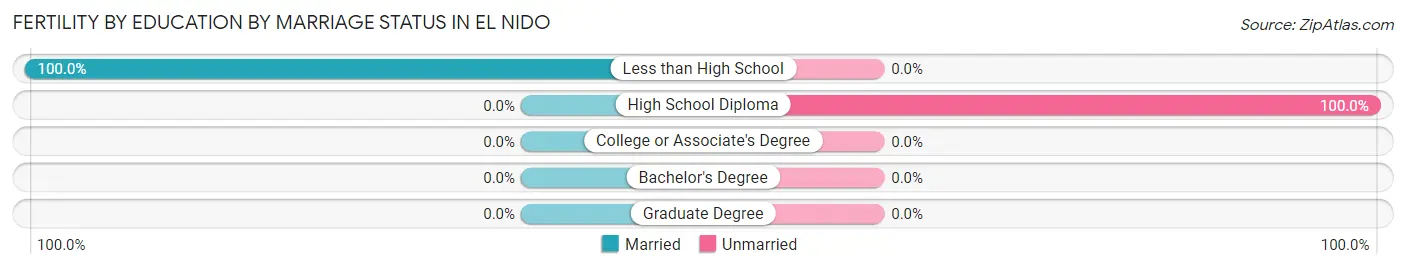
| Educational Attainment | Married | Unmarried |
| Less than High School | 5 (100.0%) | 0 (0.0%) |
| High School Diploma | 0 (0.0%) | 6 (100.0%) |
| College or Associate's Degree | 0 (0.0%) | 0 (0.0%) |
| Bachelor's Degree | 0 (0.0%) | 0 (0.0%) |
| Graduate Degree | 0 (0.0%) | 0 (0.0%) |
| Total | 5 (45.5%) | 6 (54.5%) |
Employment Characteristics in El Nido
Employment by Class of Employer in El Nido
Among the 139 employed individuals in El Nido, private company employees (124 | 89.2%), self-employed (not incorporated) (10 | 7.2%), and state government employees (5 | 3.6%) make up the most common classes of employment.
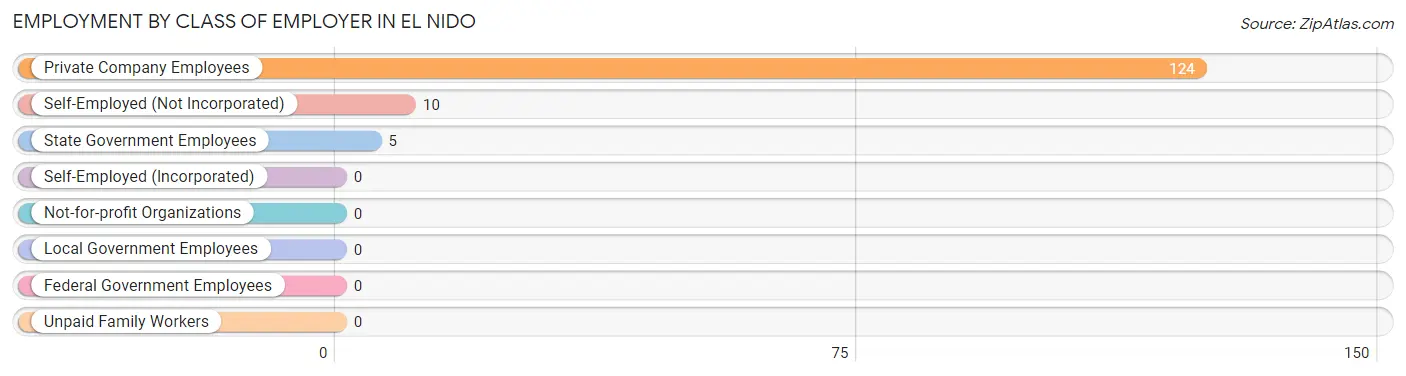
| Employer Class | # Employees | % Employees |
| Private Company Employees | 124 | 89.2% |
| Self-Employed (Incorporated) | 0 | 0.0% |
| Self-Employed (Not Incorporated) | 10 | 7.2% |
| Not-for-profit Organizations | 0 | 0.0% |
| Local Government Employees | 0 | 0.0% |
| State Government Employees | 5 | 3.6% |
| Federal Government Employees | 0 | 0.0% |
| Unpaid Family Workers | 0 | 0.0% |
| Total | 139 | 100.0% |
Employment Status by Age in El Nido
According to the labor force statistics for El Nido, out of the total population over 16 years of age (270), 54.8% or 148 individuals are in the labor force, with 4.1% or 6 of them unemployed. The age group with the highest labor force participation rate is 25 to 29 years, with 100.0% or 14 individuals in the labor force. Within the labor force, the 45 to 54 years age range has the highest percentage of unemployed individuals, with 35.3% or 6 of them being unemployed.
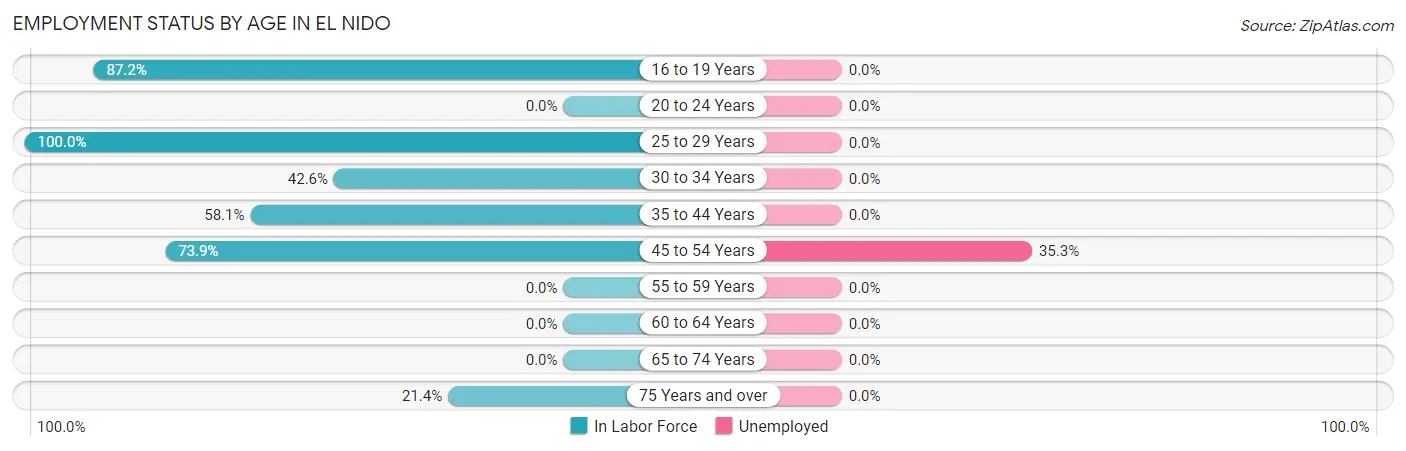
| Age Bracket | In Labor Force | Unemployed |
| 16 to 19 Years | 34 (87.2%) | 0 (0.0%) |
| 20 to 24 Years | 0 (0.0%) | 0 (0.0%) |
| 25 to 29 Years | 14 (100.0%) | 0 (0.0%) |
| 30 to 34 Years | 26 (42.6%) | 0 (0.0%) |
| 35 to 44 Years | 54 (58.1%) | 0 (0.0%) |
| 45 to 54 Years | 17 (73.9%) | 6 (35.3%) |
| 55 to 59 Years | 0 (0.0%) | 0 (0.0%) |
| 60 to 64 Years | 0 (0.0%) | 0 (0.0%) |
| 65 to 74 Years | 0 (0.0%) | 0 (0.0%) |
| 75 Years and over | 3 (21.4%) | 0 (0.0%) |
| Total | 148 (54.8%) | 6 (4.1%) |
Employment Status by Educational Attainment in El Nido
According to labor force statistics for El Nido, 54.7% of individuals (111) out of the total population between 25 and 64 years of age (203) are in the labor force, with 5.4% or 6 of them being unemployed. The group with the highest labor force participation rate are those with the educational attainment of bachelor's degree or higher, with 100.0% or 3 individuals in the labor force. Within the labor force, individuals with college / associate degree education have the highest percentage of unemployment, with 66.7% or 6 of them being unemployed.
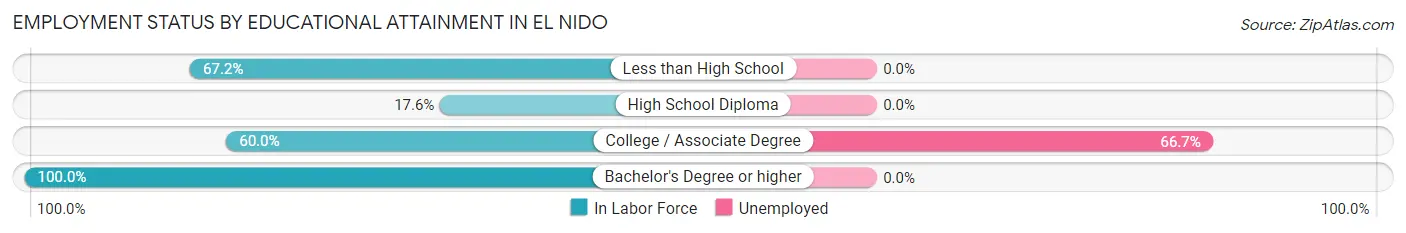
| Educational Attainment | In Labor Force | Unemployed |
| Less than High School | 90 (67.2%) | 0 (0.0%) |
| High School Diploma | 9 (17.6%) | 0 (0.0%) |
| College / Associate Degree | 9 (60.0%) | 10 (66.7%) |
| Bachelor's Degree or higher | 3 (100.0%) | 0 (0.0%) |
| Total | 111 (54.7%) | 11 (5.4%) |
Employment Occupations by Sex in El Nido
Management, Business, Science and Arts Occupations
The most common Management, Business, Science and Arts occupations in El Nido are Management (12 | 8.5%), and Business & Financial (3 | 2.1%).
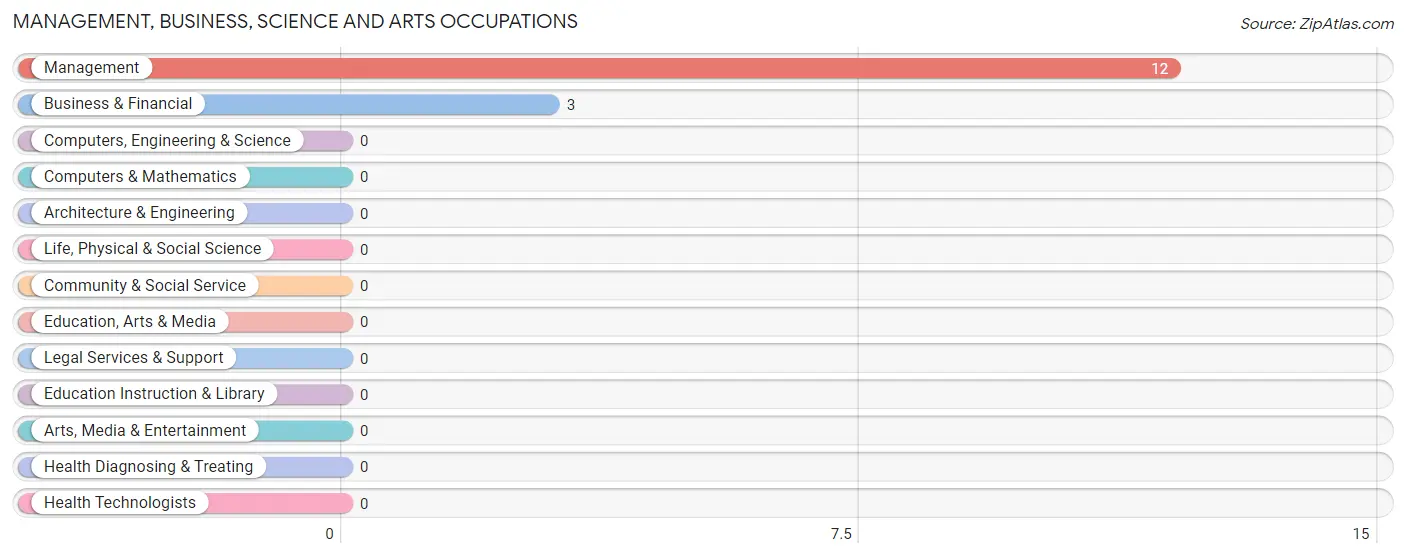
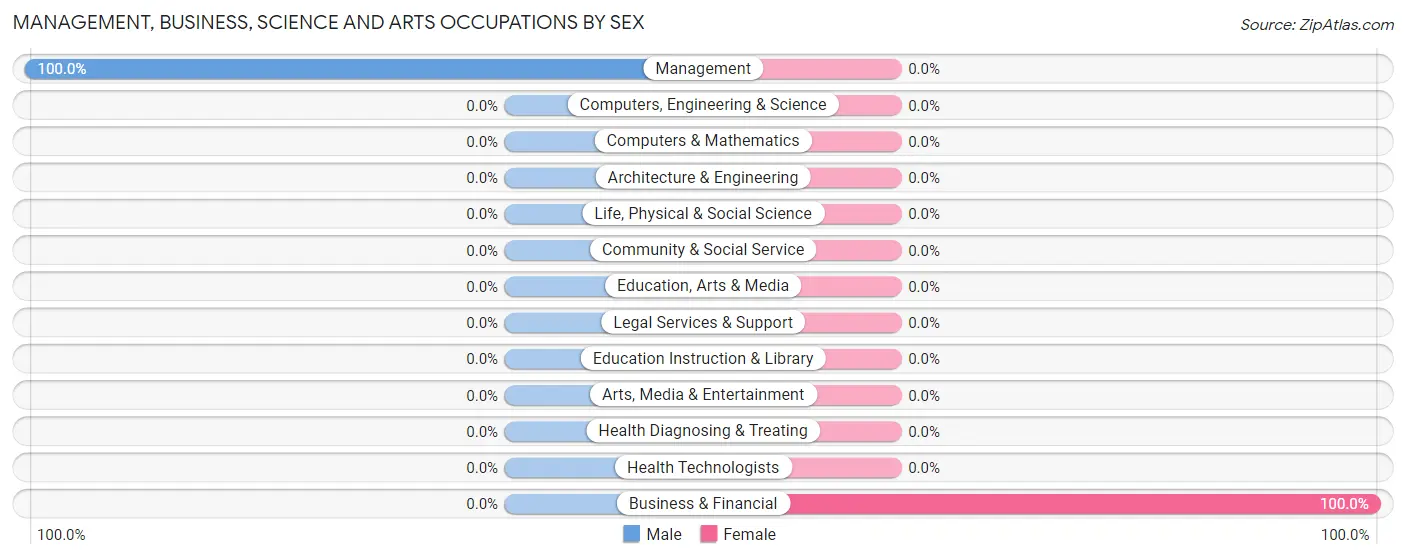
Management, Business, Science and Arts Occupations by Sex
| Occupation | Male | Female |
| Management | 12 (100.0%) | 0 (0.0%) |
| Business & Financial | 0 (0.0%) | 3 (100.0%) |
| Computers, Engineering & Science | 0 (0.0%) | 0 (0.0%) |
| Computers & Mathematics | 0 (0.0%) | 0 (0.0%) |
| Architecture & Engineering | 0 (0.0%) | 0 (0.0%) |
| Life, Physical & Social Science | 0 (0.0%) | 0 (0.0%) |
| Community & Social Service | 0 (0.0%) | 0 (0.0%) |
| Education, Arts & Media | 0 (0.0%) | 0 (0.0%) |
| Legal Services & Support | 0 (0.0%) | 0 (0.0%) |
| Education Instruction & Library | 0 (0.0%) | 0 (0.0%) |
| Arts, Media & Entertainment | 0 (0.0%) | 0 (0.0%) |
| Health Diagnosing & Treating | 0 (0.0%) | 0 (0.0%) |
| Health Technologists | 0 (0.0%) | 0 (0.0%) |
| Total (Category) | 12 (80.0%) | 3 (20.0%) |
| Total (Overall) | 136 (95.8%) | 6 (4.2%) |
Services Occupations
The most common Services occupations in El Nido are , and Personal Care & Service (3 | 2.1%).
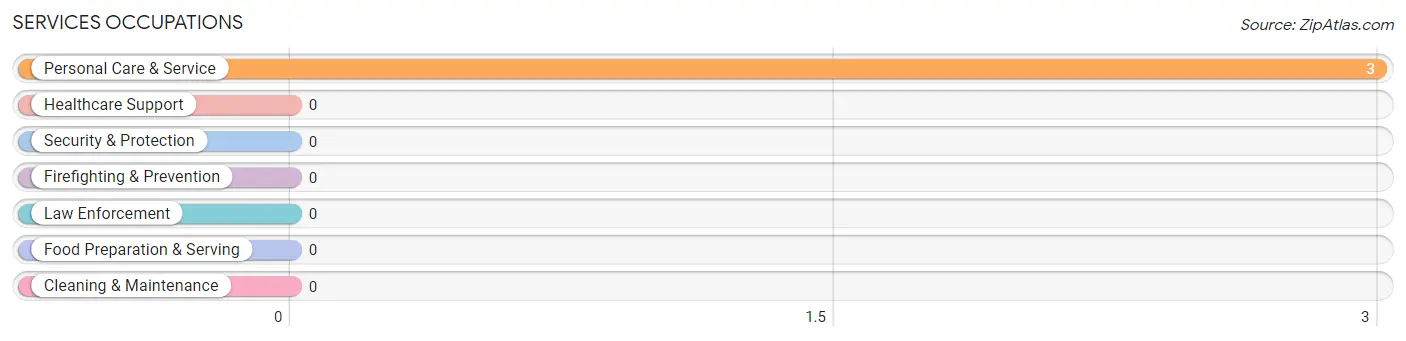
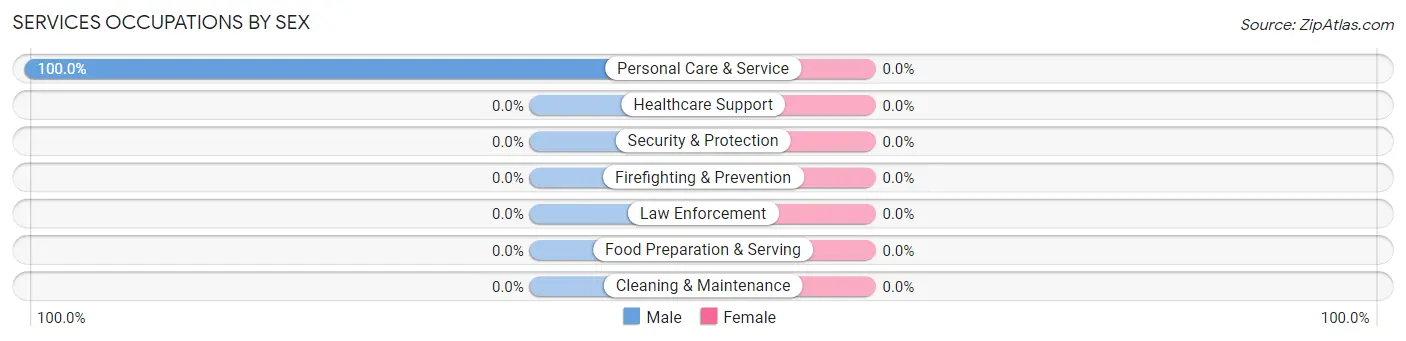
Services Occupations by Sex
| Occupation | Male | Female |
| Healthcare Support | 0 (0.0%) | 0 (0.0%) |
| Security & Protection | 0 (0.0%) | 0 (0.0%) |
| Firefighting & Prevention | 0 (0.0%) | 0 (0.0%) |
| Law Enforcement | 0 (0.0%) | 0 (0.0%) |
| Food Preparation & Serving | 0 (0.0%) | 0 (0.0%) |
| Cleaning & Maintenance | 0 (0.0%) | 0 (0.0%) |
| Personal Care & Service | 3 (100.0%) | 0 (0.0%) |
| Total (Category) | 3 (100.0%) | 0 (0.0%) |
| Total (Overall) | 136 (95.8%) | 6 (4.2%) |
Sales and Office Occupations
The most common Sales and Office occupations in El Nido are , and Sales & Related (9 | 6.3%).
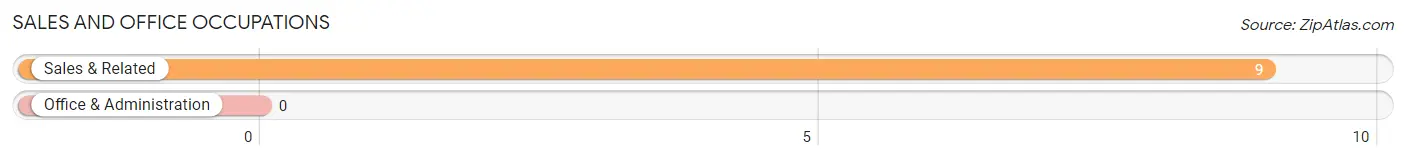
Sales and Office Occupations by Sex

| Occupation | Male | Female |
| Sales & Related | 6 (66.7%) | 3 (33.3%) |
| Office & Administration | 0 (0.0%) | 0 (0.0%) |
| Total (Category) | 6 (66.7%) | 3 (33.3%) |
| Total (Overall) | 136 (95.8%) | 6 (4.2%) |
Natural Resources, Construction and Maintenance Occupations
The most common Natural Resources, Construction and Maintenance occupations in El Nido are Farming, Fishing & Forestry (89 | 62.7%), and Construction & Extraction (12 | 8.5%).
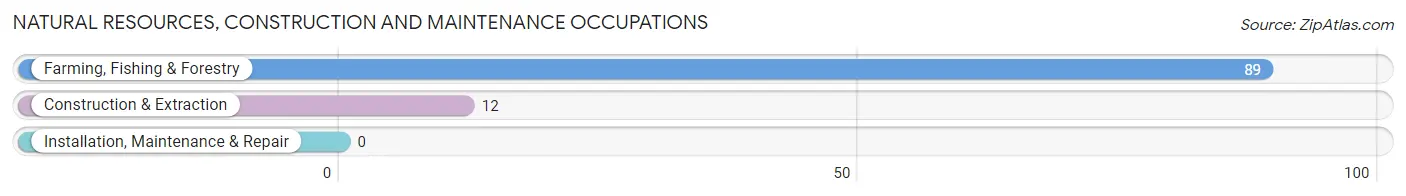
Natural Resources, Construction and Maintenance Occupations by Sex

| Occupation | Male | Female |
| Farming, Fishing & Forestry | 89 (100.0%) | 0 (0.0%) |
| Construction & Extraction | 12 (100.0%) | 0 (0.0%) |
| Installation, Maintenance & Repair | 0 (0.0%) | 0 (0.0%) |
| Total (Category) | 101 (100.0%) | 0 (0.0%) |
| Total (Overall) | 136 (95.8%) | 6 (4.2%) |
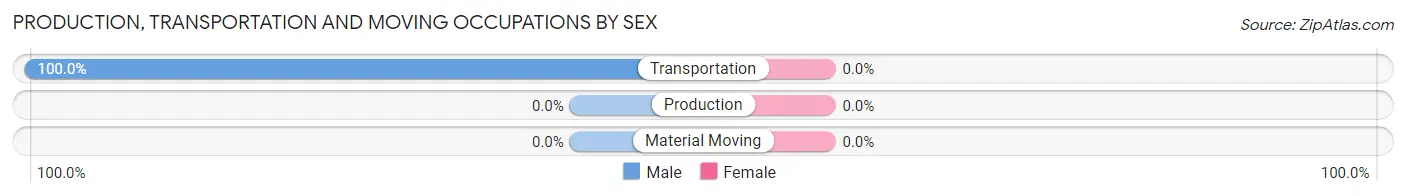
Production, Transportation and Moving Occupations
The most common Production, Transportation and Moving occupations in El Nido are , and Transportation (14 | 9.9%).
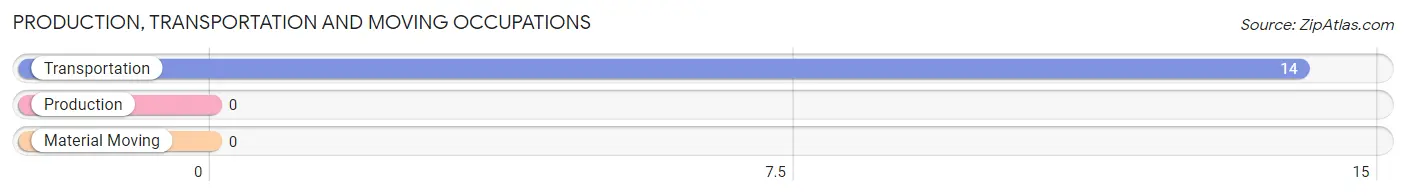
Production, Transportation and Moving Occupations by Sex
| Occupation | Male | Female |
| Production | 0 (0.0%) | 0 (0.0%) |
| Transportation | 14 (100.0%) | 0 (0.0%) |
| Material Moving | 0 (0.0%) | 0 (0.0%) |
| Total (Category) | 14 (100.0%) | 0 (0.0%) |
| Total (Overall) | 136 (95.8%) | 6 (4.2%) |
Employment Industries by Sex in El Nido
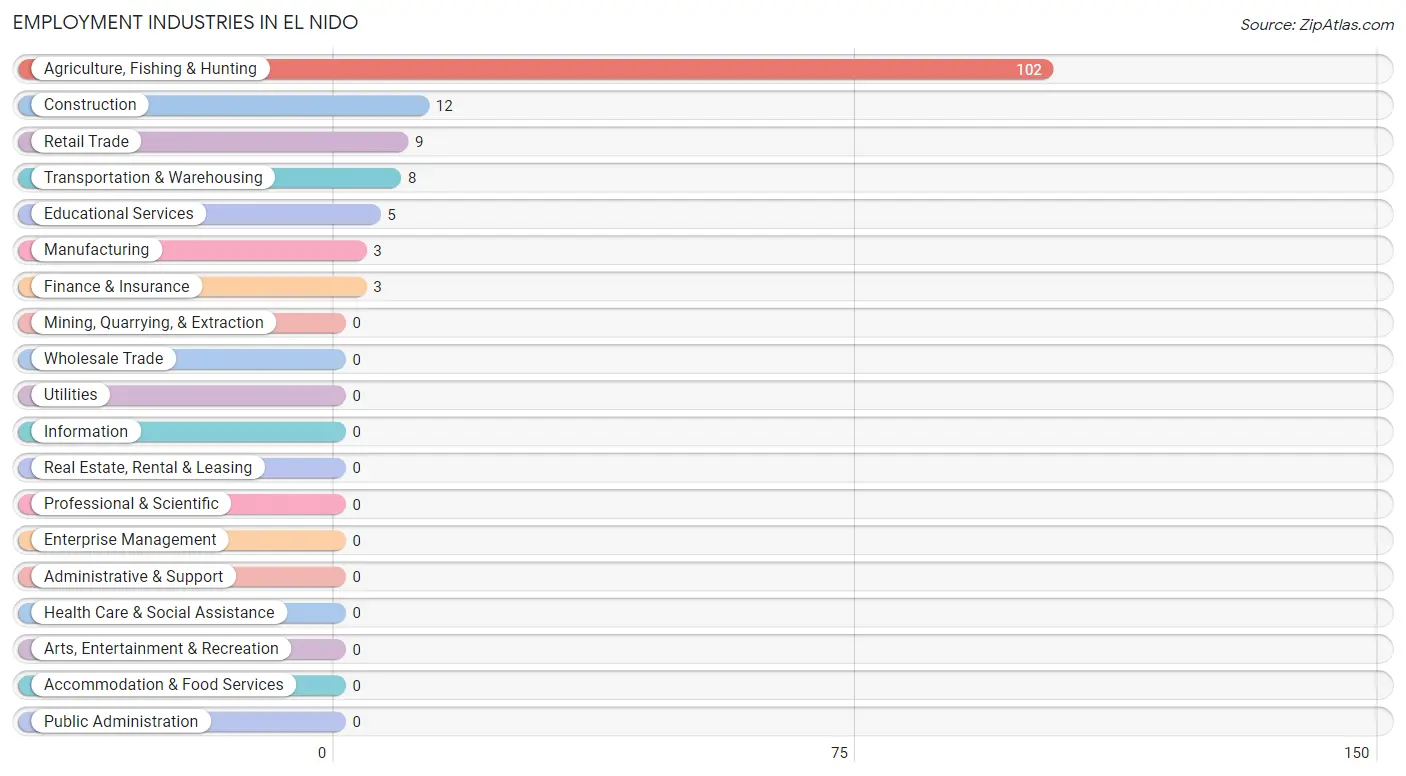
Employment Industries in El Nido
The major employment industries in El Nido include Agriculture, Fishing & Hunting (102 | 71.8%), Construction (12 | 8.5%), Retail Trade (9 | 6.3%), Transportation & Warehousing (8 | 5.6%), and Educational Services (5 | 3.5%).
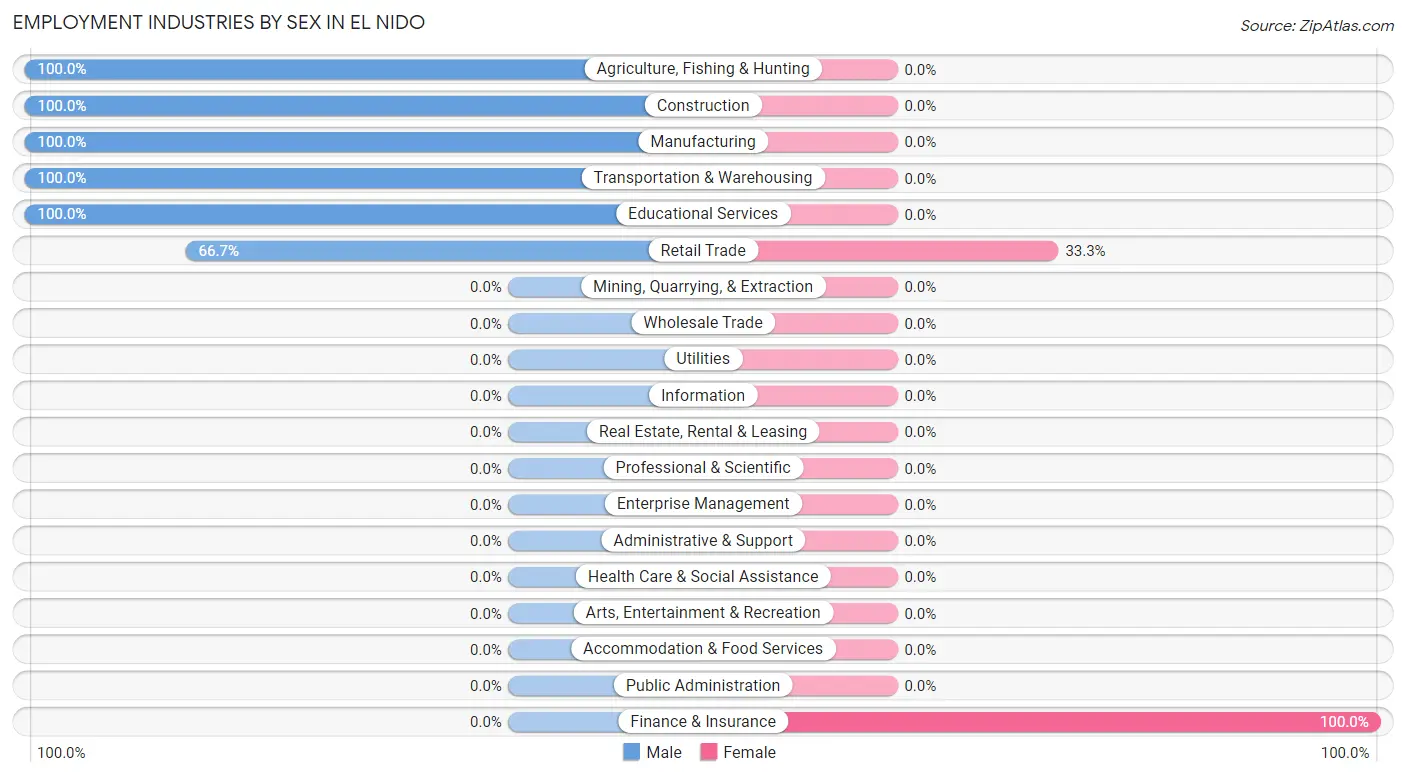
Employment Industries by Sex in El Nido
The El Nido industries that see more men than women are Agriculture, Fishing & Hunting (100.0%), Construction (100.0%), and Manufacturing (100.0%), whereas the industries that tend to have a higher number of women are Finance & Insurance (100.0%), and Retail Trade (33.3%).
| Industry | Male | Female |
| Agriculture, Fishing & Hunting | 102 (100.0%) | 0 (0.0%) |
| Mining, Quarrying, & Extraction | 0 (0.0%) | 0 (0.0%) |
| Construction | 12 (100.0%) | 0 (0.0%) |
| Manufacturing | 3 (100.0%) | 0 (0.0%) |
| Wholesale Trade | 0 (0.0%) | 0 (0.0%) |
| Retail Trade | 6 (66.7%) | 3 (33.3%) |
| Transportation & Warehousing | 8 (100.0%) | 0 (0.0%) |
| Utilities | 0 (0.0%) | 0 (0.0%) |
| Information | 0 (0.0%) | 0 (0.0%) |
| Finance & Insurance | 0 (0.0%) | 3 (100.0%) |
| Real Estate, Rental & Leasing | 0 (0.0%) | 0 (0.0%) |
| Professional & Scientific | 0 (0.0%) | 0 (0.0%) |
| Enterprise Management | 0 (0.0%) | 0 (0.0%) |
| Administrative & Support | 0 (0.0%) | 0 (0.0%) |
| Educational Services | 5 (100.0%) | 0 (0.0%) |
| Health Care & Social Assistance | 0 (0.0%) | 0 (0.0%) |
| Arts, Entertainment & Recreation | 0 (0.0%) | 0 (0.0%) |
| Accommodation & Food Services | 0 (0.0%) | 0 (0.0%) |
| Public Administration | 0 (0.0%) | 0 (0.0%) |
| Total | 136 (95.8%) | 6 (4.2%) |
Education in El Nido
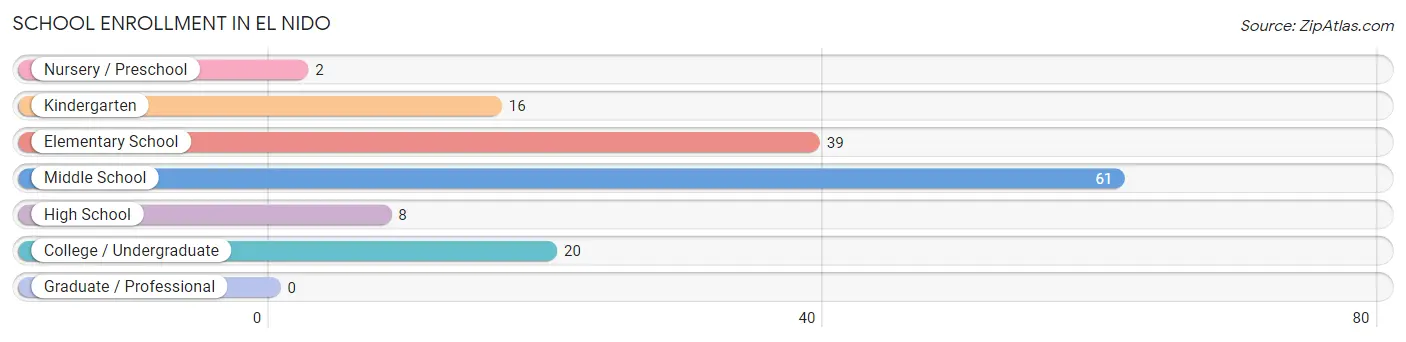
School Enrollment in El Nido
The most common levels of schooling among the 146 students in El Nido are middle school (61 | 41.8%), elementary school (39 | 26.7%), and college / undergraduate (20 | 13.7%).
| School Level | # Students | % Students |
| Nursery / Preschool | 2 | 1.4% |
| Kindergarten | 16 | 11.0% |
| Elementary School | 39 | 26.7% |
| Middle School | 61 | 41.8% |
| High School | 8 | 5.5% |
| College / Undergraduate | 20 | 13.7% |
| Graduate / Professional | 0 | 0.0% |
| Total | 146 | 100.0% |
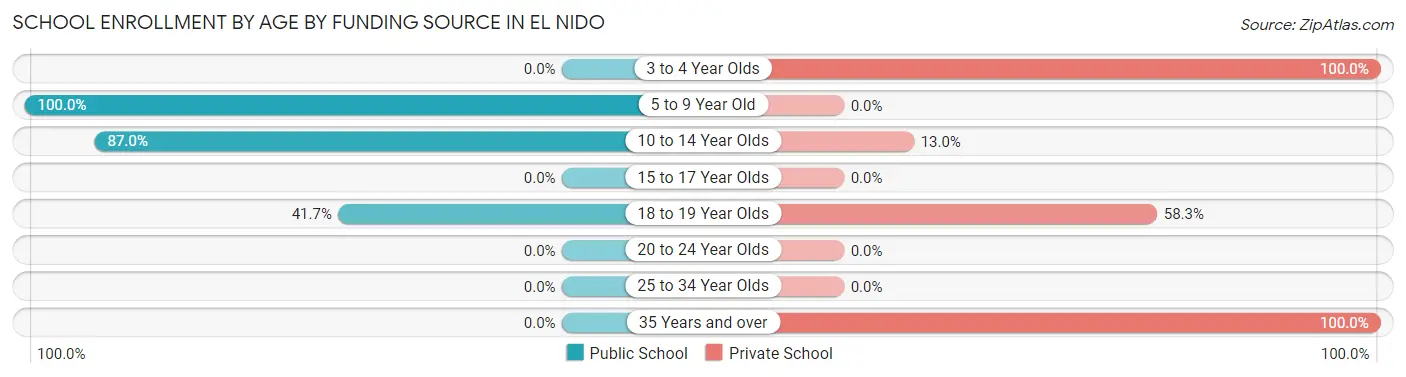
School Enrollment by Age by Funding Source in El Nido
Out of a total of 146 students who are enrolled in schools in El Nido, 26 (17.8%) attend a private institution, while the remaining 120 (82.2%) are enrolled in public schools. The age group of 3 to 4 year olds has the highest likelihood of being enrolled in private schools, with 2 (100.0% in the age bracket) enrolled. Conversely, the age group of 5 to 9 year old has the lowest likelihood of being enrolled in a private school, with 55 (100.0% in the age bracket) attending a public institution.
| Age Bracket | Public School | Private School |
| 3 to 4 Year Olds | 0 (0.0%) | 2 (100.0%) |
| 5 to 9 Year Old | 55 (100.0%) | 0 (0.0%) |
| 10 to 14 Year Olds | 60 (87.0%) | 9 (13.0%) |
| 15 to 17 Year Olds | 0 (0.0%) | 0 (0.0%) |
| 18 to 19 Year Olds | 5 (41.7%) | 7 (58.3%) |
| 20 to 24 Year Olds | 0 (0.0%) | 0 (0.0%) |
| 25 to 34 Year Olds | 0 (0.0%) | 0 (0.0%) |
| 35 Years and over | 0 (0.0%) | 8 (100.0%) |
| Total | 120 (82.2%) | 26 (17.8%) |
Educational Attainment by Field of Study in El Nido
Bio, nature & agricultural (3 | 50.0%), and social sciences (3 | 50.0%) are the most common fields of study among 6 individuals in El Nido who have obtained a bachelor's degree or higher.
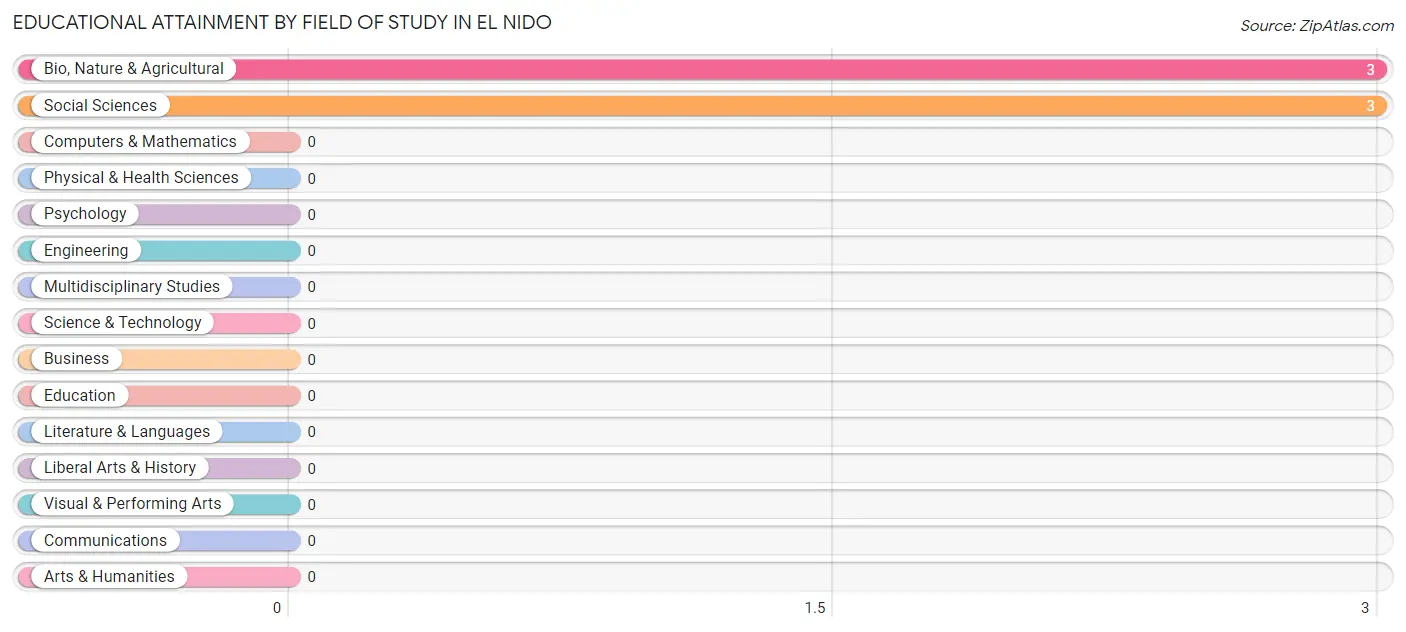
| Field of Study | # Graduates | % Graduates |
| Computers & Mathematics | 0 | 0.0% |
| Bio, Nature & Agricultural | 3 | 50.0% |
| Physical & Health Sciences | 0 | 0.0% |
| Psychology | 0 | 0.0% |
| Social Sciences | 3 | 50.0% |
| Engineering | 0 | 0.0% |
| Multidisciplinary Studies | 0 | 0.0% |
| Science & Technology | 0 | 0.0% |
| Business | 0 | 0.0% |
| Education | 0 | 0.0% |
| Literature & Languages | 0 | 0.0% |
| Liberal Arts & History | 0 | 0.0% |
| Visual & Performing Arts | 0 | 0.0% |
| Communications | 0 | 0.0% |
| Arts & Humanities | 0 | 0.0% |
| Total | 6 | 100.0% |
Transportation & Commute in El Nido
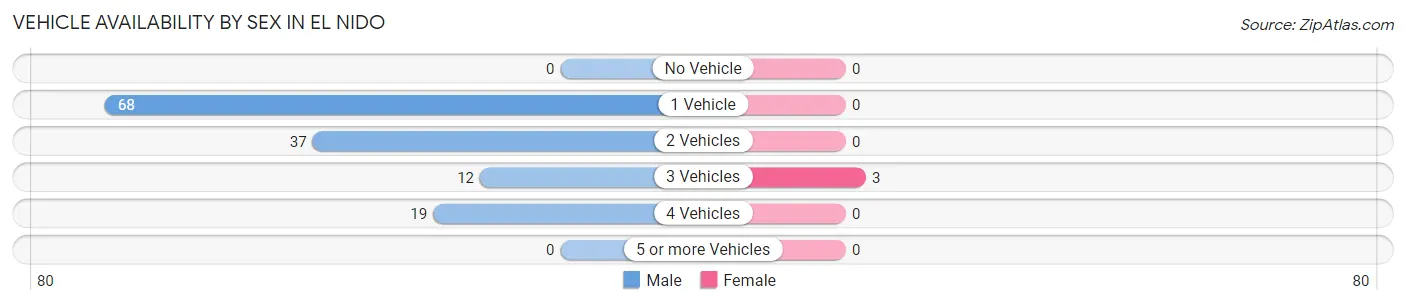
Vehicle Availability by Sex in El Nido
The most prevalent vehicle ownership categories in El Nido are males with 1 vehicle (68, accounting for 50.0%) and females with 1 vehicle (0, making up 2,266.7%).
| Vehicles Available | Male | Female |
| No Vehicle | 0 (0.0%) | 0 (0.0%) |
| 1 Vehicle | 68 (50.0%) | 0 (0.0%) |
| 2 Vehicles | 37 (27.2%) | 0 (0.0%) |
| 3 Vehicles | 12 (8.8%) | 3 (100.0%) |
| 4 Vehicles | 19 (14.0%) | 0 (0.0%) |
| 5 or more Vehicles | 0 (0.0%) | 0 (0.0%) |
| Total | 136 (100.0%) | 3 (100.0%) |
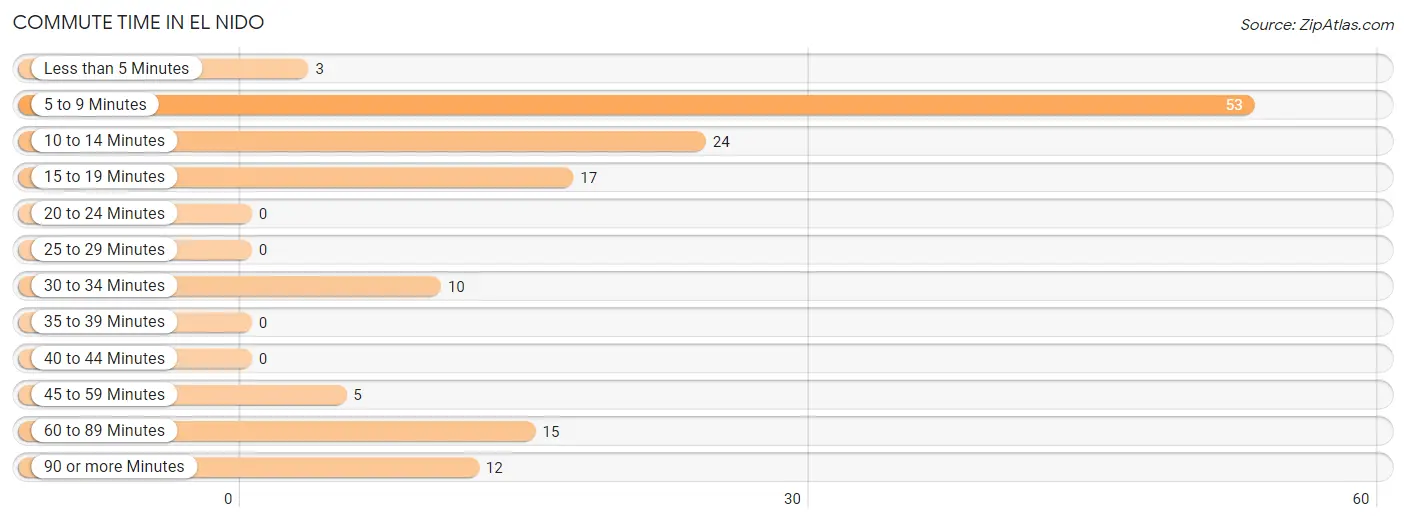
Commute Time in El Nido
The most frequently occuring commute durations in El Nido are 5 to 9 minutes (53 commuters, 38.1%), 10 to 14 minutes (24 commuters, 17.3%), and 15 to 19 minutes (17 commuters, 12.2%).
| Commute Time | # Commuters | % Commuters |
| Less than 5 Minutes | 3 | 2.2% |
| 5 to 9 Minutes | 53 | 38.1% |
| 10 to 14 Minutes | 24 | 17.3% |
| 15 to 19 Minutes | 17 | 12.2% |
| 20 to 24 Minutes | 0 | 0.0% |
| 25 to 29 Minutes | 0 | 0.0% |
| 30 to 34 Minutes | 10 | 7.2% |
| 35 to 39 Minutes | 0 | 0.0% |
| 40 to 44 Minutes | 0 | 0.0% |
| 45 to 59 Minutes | 5 | 3.6% |
| 60 to 89 Minutes | 15 | 10.8% |
| 90 or more Minutes | 12 | 8.6% |
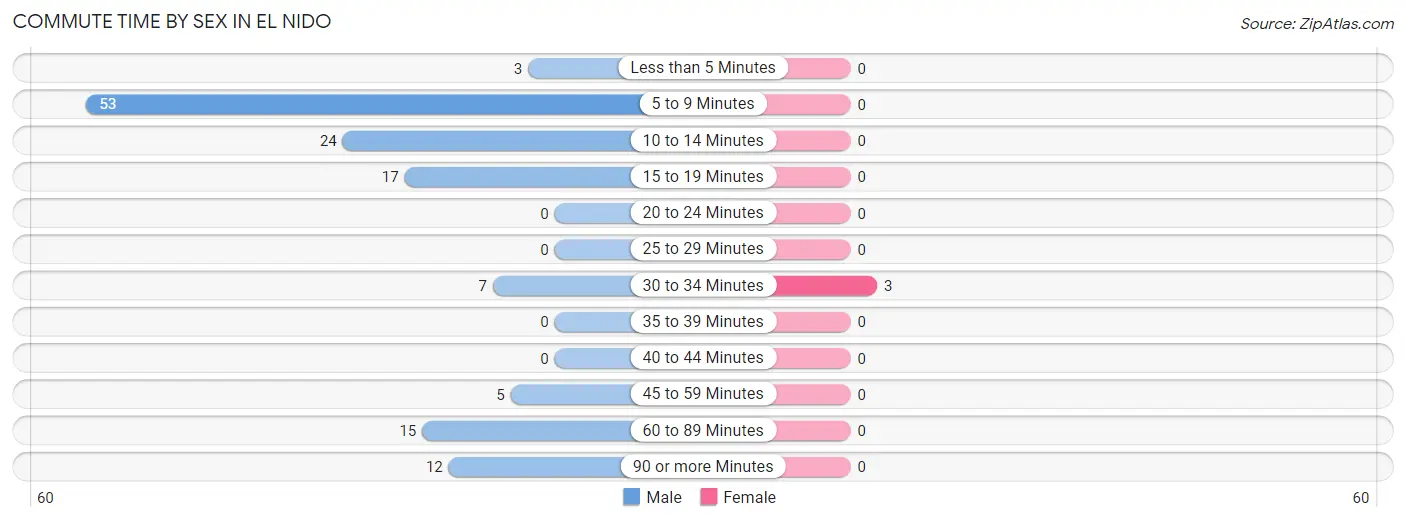
Commute Time by Sex in El Nido
The most common commute times in El Nido are 5 to 9 minutes (53 commuters, 39.0%) for males and 30 to 34 minutes (3 commuters, 100.0%) for females.
| Commute Time | Male | Female |
| Less than 5 Minutes | 3 (2.2%) | 0 (0.0%) |
| 5 to 9 Minutes | 53 (39.0%) | 0 (0.0%) |
| 10 to 14 Minutes | 24 (17.6%) | 0 (0.0%) |
| 15 to 19 Minutes | 17 (12.5%) | 0 (0.0%) |
| 20 to 24 Minutes | 0 (0.0%) | 0 (0.0%) |
| 25 to 29 Minutes | 0 (0.0%) | 0 (0.0%) |
| 30 to 34 Minutes | 7 (5.1%) | 3 (100.0%) |
| 35 to 39 Minutes | 0 (0.0%) | 0 (0.0%) |
| 40 to 44 Minutes | 0 (0.0%) | 0 (0.0%) |
| 45 to 59 Minutes | 5 (3.7%) | 0 (0.0%) |
| 60 to 89 Minutes | 15 (11.0%) | 0 (0.0%) |
| 90 or more Minutes | 12 (8.8%) | 0 (0.0%) |
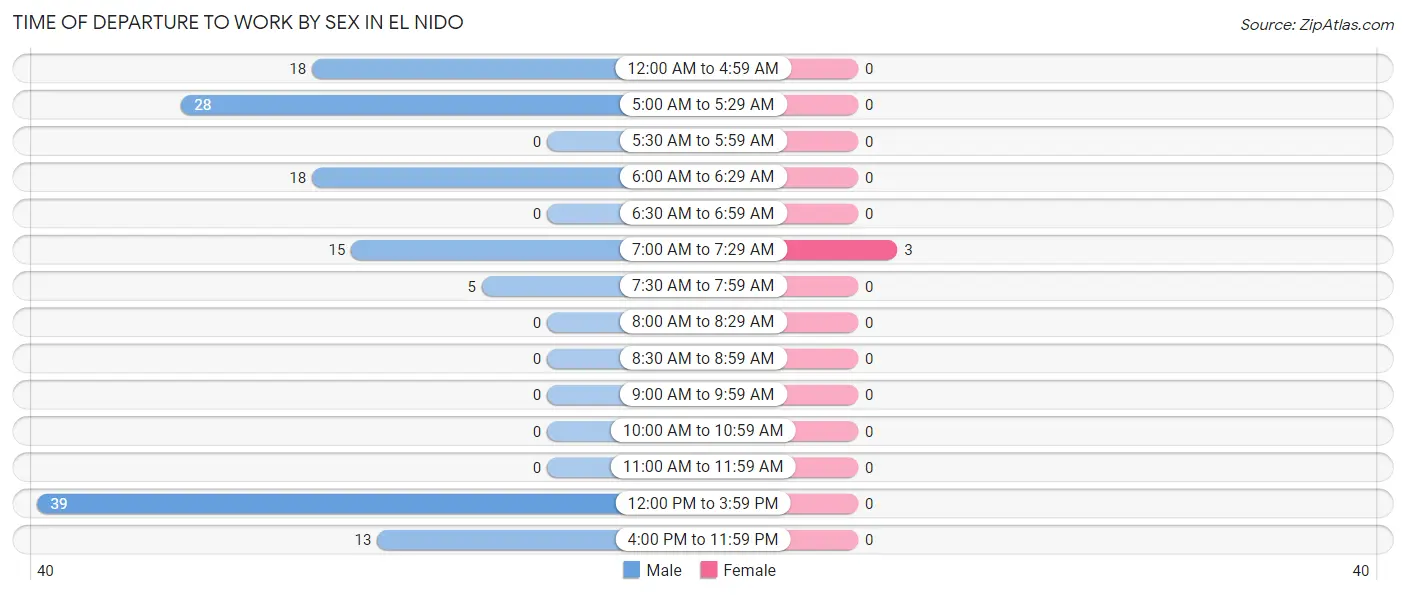
Time of Departure to Work by Sex in El Nido
The most frequent times of departure to work in El Nido are 12:00 PM to 3:59 PM (39, 28.7%) for males and 7:00 AM to 7:29 AM (3, 100.0%) for females.
| Time of Departure | Male | Female |
| 12:00 AM to 4:59 AM | 18 (13.2%) | 0 (0.0%) |
| 5:00 AM to 5:29 AM | 28 (20.6%) | 0 (0.0%) |
| 5:30 AM to 5:59 AM | 0 (0.0%) | 0 (0.0%) |
| 6:00 AM to 6:29 AM | 18 (13.2%) | 0 (0.0%) |
| 6:30 AM to 6:59 AM | 0 (0.0%) | 0 (0.0%) |
| 7:00 AM to 7:29 AM | 15 (11.0%) | 3 (100.0%) |
| 7:30 AM to 7:59 AM | 5 (3.7%) | 0 (0.0%) |
| 8:00 AM to 8:29 AM | 0 (0.0%) | 0 (0.0%) |
| 8:30 AM to 8:59 AM | 0 (0.0%) | 0 (0.0%) |
| 9:00 AM to 9:59 AM | 0 (0.0%) | 0 (0.0%) |
| 10:00 AM to 10:59 AM | 0 (0.0%) | 0 (0.0%) |
| 11:00 AM to 11:59 AM | 0 (0.0%) | 0 (0.0%) |
| 12:00 PM to 3:59 PM | 39 (28.7%) | 0 (0.0%) |
| 4:00 PM to 11:59 PM | 13 (9.6%) | 0 (0.0%) |
| Total | 136 (100.0%) | 3 (100.0%) |
Housing Occupancy in El Nido
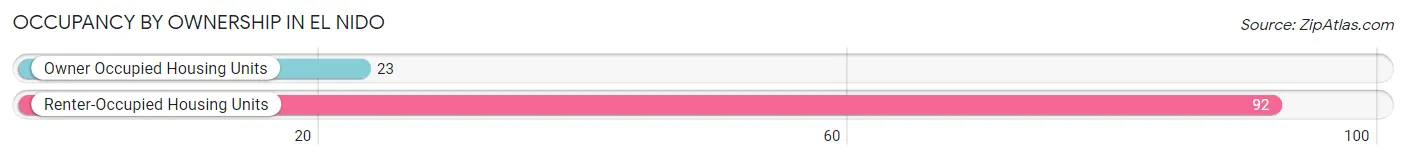
Occupancy by Ownership in El Nido
Of the total 115 dwellings in El Nido, owner-occupied units account for 23 (20.0%), while renter-occupied units make up 92 (80.0%).
| Occupancy | # Housing Units | % Housing Units |
| Owner Occupied Housing Units | 23 | 20.0% |
| Renter-Occupied Housing Units | 92 | 80.0% |
| Total Occupied Housing Units | 115 | 100.0% |
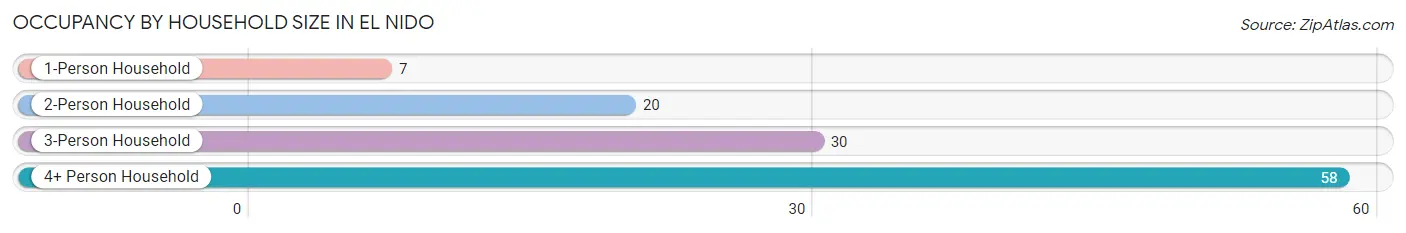
Occupancy by Household Size in El Nido
| Household Size | # Housing Units | % Housing Units |
| 1-Person Household | 7 | 6.1% |
| 2-Person Household | 20 | 17.4% |
| 3-Person Household | 30 | 26.1% |
| 4+ Person Household | 58 | 50.4% |
| Total Housing Units | 115 | 100.0% |
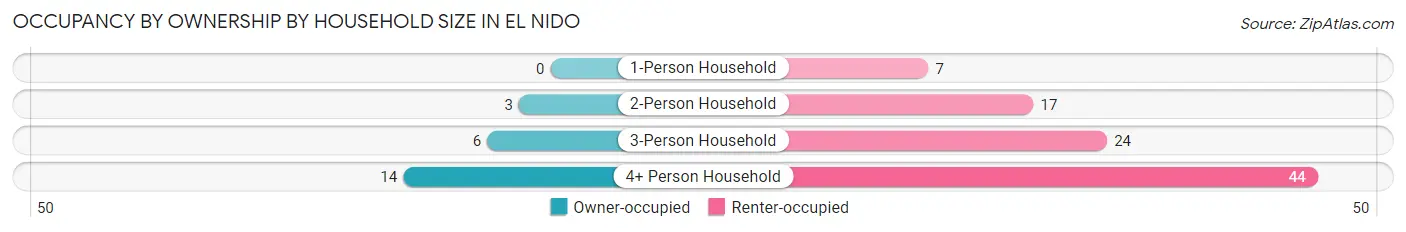
Occupancy by Ownership by Household Size in El Nido
| Household Size | Owner-occupied | Renter-occupied |
| 1-Person Household | 0 (0.0%) | 7 (100.0%) |
| 2-Person Household | 3 (15.0%) | 17 (85.0%) |
| 3-Person Household | 6 (20.0%) | 24 (80.0%) |
| 4+ Person Household | 14 (24.1%) | 44 (75.9%) |
| Total Housing Units | 23 (20.0%) | 92 (80.0%) |
Occupancy by Educational Attainment in El Nido
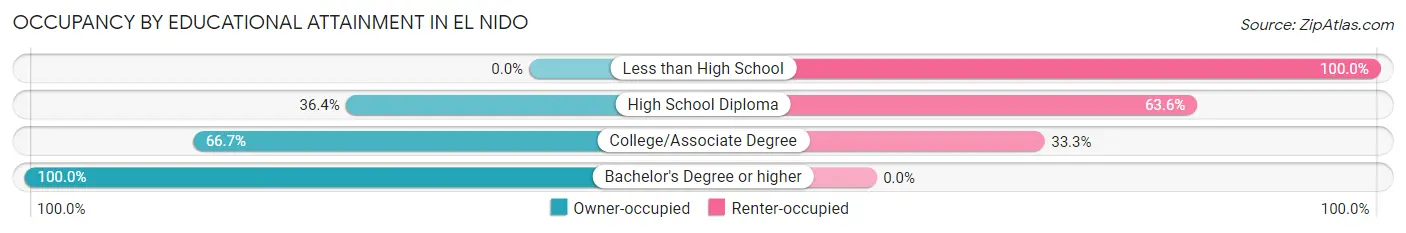
| Household Size | Owner-occupied | Renter-occupied |
| Less than High School | 0 (0.0%) | 72 (100.0%) |
| High School Diploma | 8 (36.4%) | 14 (63.6%) |
| College/Associate Degree | 12 (66.7%) | 6 (33.3%) |
| Bachelor's Degree or higher | 3 (100.0%) | 0 (0.0%) |
Occupancy by Age of Householder in El Nido
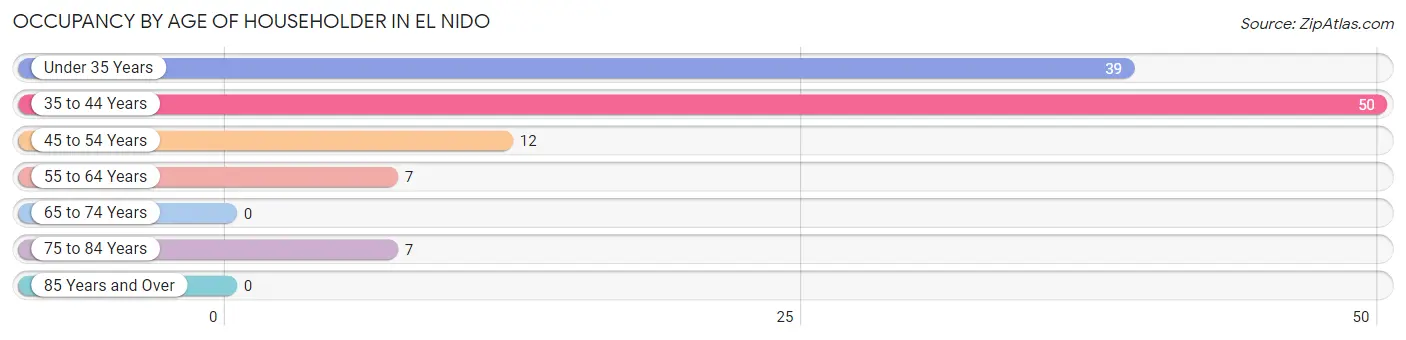
| Age Bracket | # Households | % Households |
| Under 35 Years | 39 | 33.9% |
| 35 to 44 Years | 50 | 43.5% |
| 45 to 54 Years | 12 | 10.4% |
| 55 to 64 Years | 7 | 6.1% |
| 65 to 74 Years | 0 | 0.0% |
| 75 to 84 Years | 7 | 6.1% |
| 85 Years and Over | 0 | 0.0% |
| Total | 115 | 100.0% |
Housing Finances in El Nido
Median Income by Occupancy in El Nido
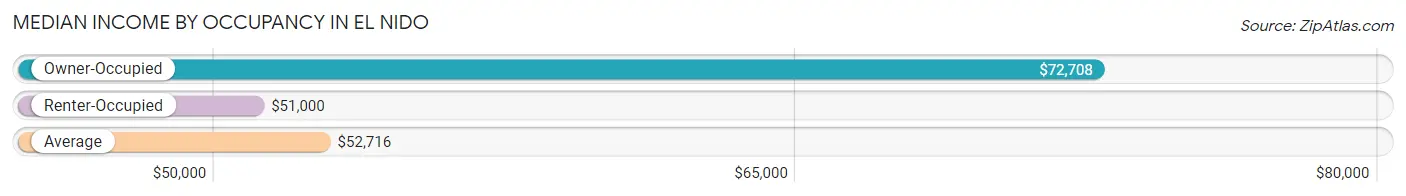
| Occupancy Type | # Households | Median Income |
| Owner-Occupied | 23 (20.0%) | $72,708 |
| Renter-Occupied | 92 (80.0%) | $51,000 |
| Average | 115 (100.0%) | $52,716 |
Occupancy by Householder Income Bracket in El Nido
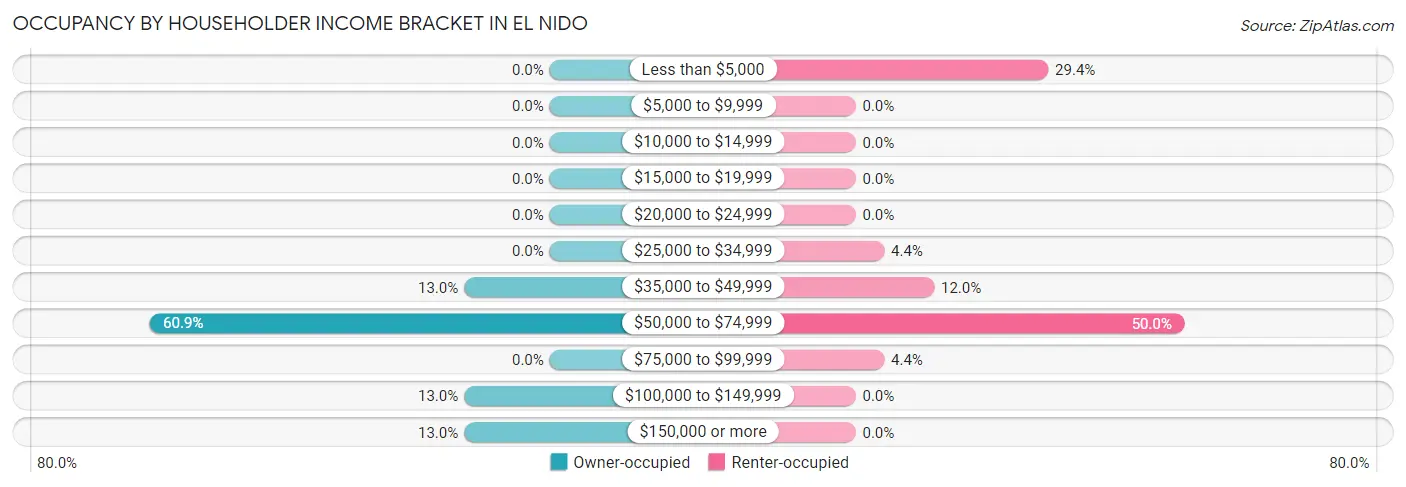
| Income Bracket | Owner-occupied | Renter-occupied |
| Less than $5,000 | 0 (0.0%) | 27 (29.3%) |
| $5,000 to $9,999 | 0 (0.0%) | 0 (0.0%) |
| $10,000 to $14,999 | 0 (0.0%) | 0 (0.0%) |
| $15,000 to $19,999 | 0 (0.0%) | 0 (0.0%) |
| $20,000 to $24,999 | 0 (0.0%) | 0 (0.0%) |
| $25,000 to $34,999 | 0 (0.0%) | 4 (4.3%) |
| $35,000 to $49,999 | 3 (13.0%) | 11 (12.0%) |
| $50,000 to $74,999 | 14 (60.9%) | 46 (50.0%) |
| $75,000 to $99,999 | 0 (0.0%) | 4 (4.3%) |
| $100,000 to $149,999 | 3 (13.0%) | 0 (0.0%) |
| $150,000 or more | 3 (13.0%) | 0 (0.0%) |
| Total | 23 (100.0%) | 92 (100.0%) |
Monthly Housing Cost Tiers in El Nido
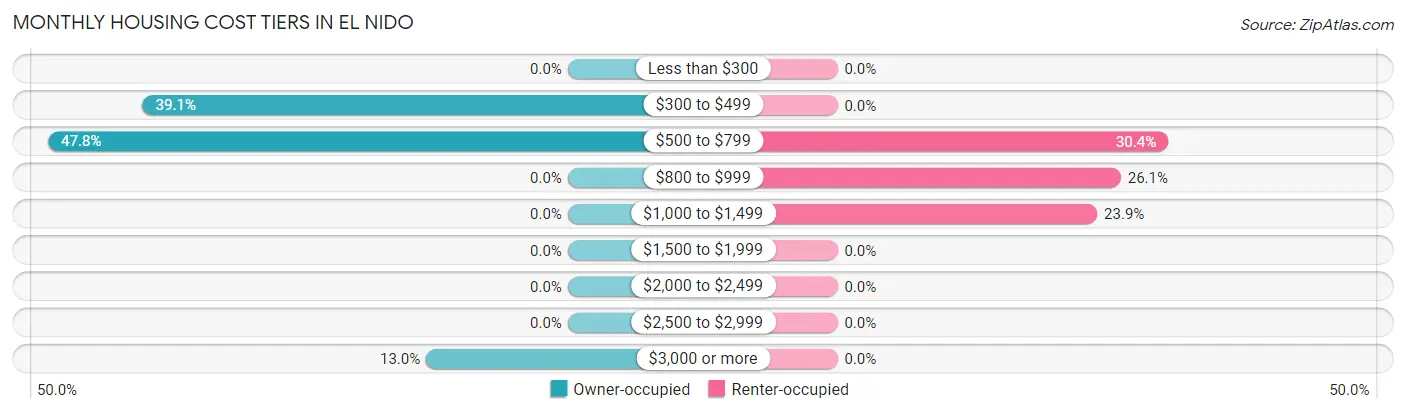
| Monthly Cost | Owner-occupied | Renter-occupied |
| Less than $300 | 0 (0.0%) | 0 (0.0%) |
| $300 to $499 | 9 (39.1%) | 0 (0.0%) |
| $500 to $799 | 11 (47.8%) | 28 (30.4%) |
| $800 to $999 | 0 (0.0%) | 24 (26.1%) |
| $1,000 to $1,499 | 0 (0.0%) | 22 (23.9%) |
| $1,500 to $1,999 | 0 (0.0%) | 0 (0.0%) |
| $2,000 to $2,499 | 0 (0.0%) | 0 (0.0%) |
| $2,500 to $2,999 | 0 (0.0%) | 0 (0.0%) |
| $3,000 or more | 3 (13.0%) | 0 (0.0%) |
| Total | 23 (100.0%) | 92 (100.0%) |
Physical Housing Characteristics in El Nido
Housing Structures in El Nido
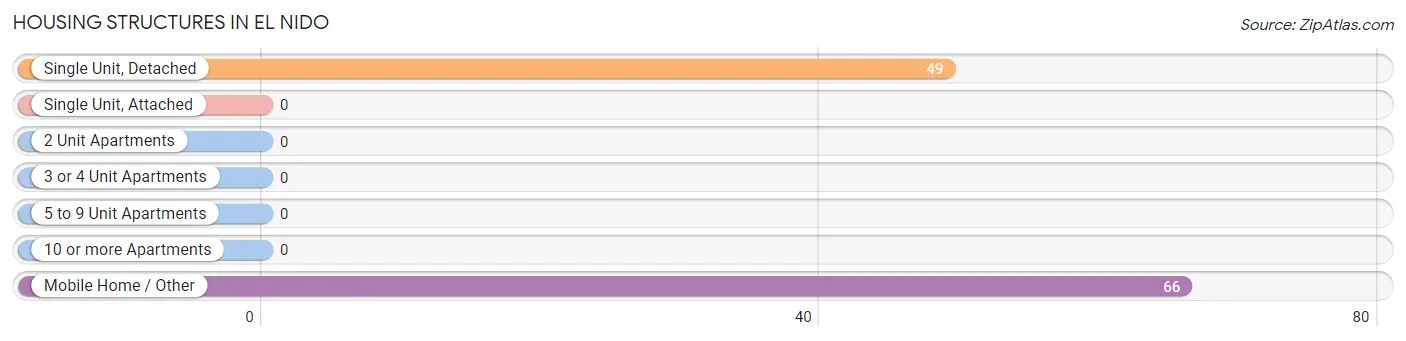
| Structure Type | # Housing Units | % Housing Units |
| Single Unit, Detached | 49 | 42.6% |
| Single Unit, Attached | 0 | 0.0% |
| 2 Unit Apartments | 0 | 0.0% |
| 3 or 4 Unit Apartments | 0 | 0.0% |
| 5 to 9 Unit Apartments | 0 | 0.0% |
| 10 or more Apartments | 0 | 0.0% |
| Mobile Home / Other | 66 | 57.4% |
| Total | 115 | 100.0% |
Housing Structures by Occupancy in El Nido
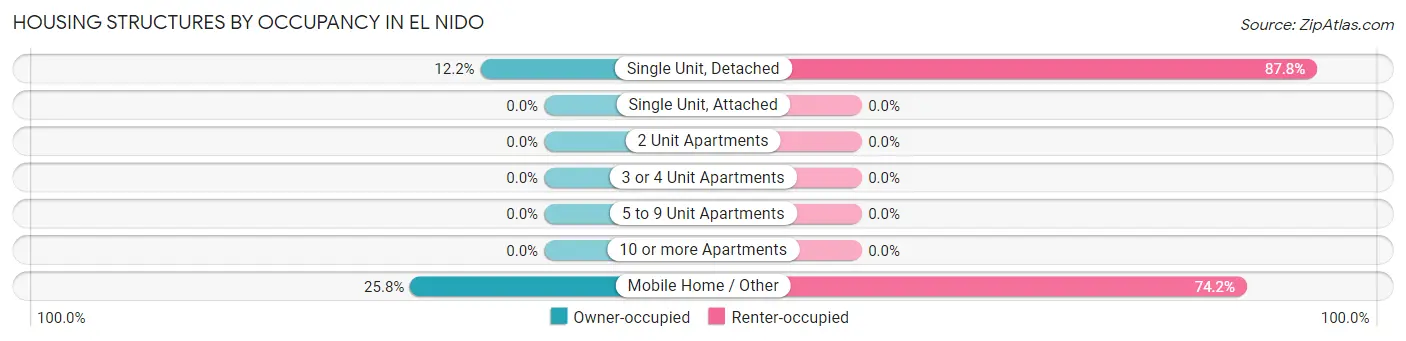
| Structure Type | Owner-occupied | Renter-occupied |
| Single Unit, Detached | 6 (12.2%) | 43 (87.8%) |
| Single Unit, Attached | 0 (0.0%) | 0 (0.0%) |
| 2 Unit Apartments | 0 (0.0%) | 0 (0.0%) |
| 3 or 4 Unit Apartments | 0 (0.0%) | 0 (0.0%) |
| 5 to 9 Unit Apartments | 0 (0.0%) | 0 (0.0%) |
| 10 or more Apartments | 0 (0.0%) | 0 (0.0%) |
| Mobile Home / Other | 17 (25.8%) | 49 (74.2%) |
| Total | 23 (20.0%) | 92 (80.0%) |
Housing Structures by Number of Rooms in El Nido
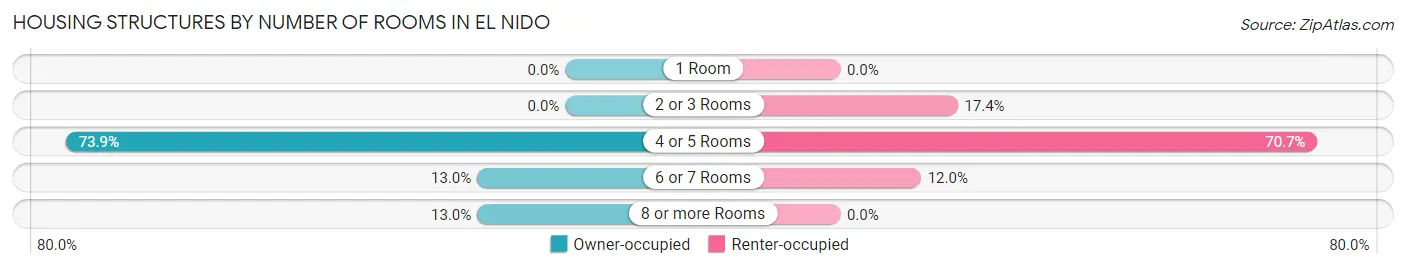
| Number of Rooms | Owner-occupied | Renter-occupied |
| 1 Room | 0 (0.0%) | 0 (0.0%) |
| 2 or 3 Rooms | 0 (0.0%) | 16 (17.4%) |
| 4 or 5 Rooms | 17 (73.9%) | 65 (70.7%) |
| 6 or 7 Rooms | 3 (13.0%) | 11 (12.0%) |
| 8 or more Rooms | 3 (13.0%) | 0 (0.0%) |
| Total | 23 (100.0%) | 92 (100.0%) |
Housing Structure by Heating Type in El Nido
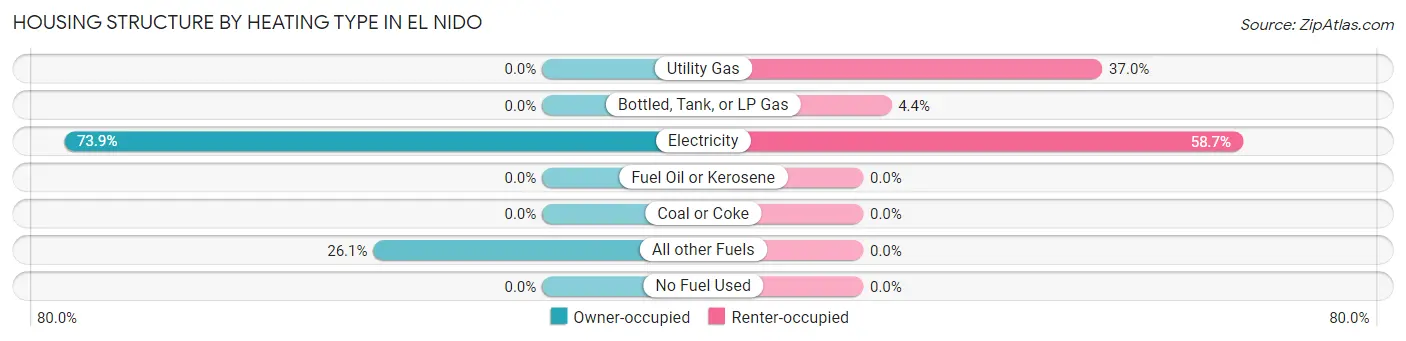
| Heating Type | Owner-occupied | Renter-occupied |
| Utility Gas | 0 (0.0%) | 34 (37.0%) |
| Bottled, Tank, or LP Gas | 0 (0.0%) | 4 (4.3%) |
| Electricity | 17 (73.9%) | 54 (58.7%) |
| Fuel Oil or Kerosene | 0 (0.0%) | 0 (0.0%) |
| Coal or Coke | 0 (0.0%) | 0 (0.0%) |
| All other Fuels | 6 (26.1%) | 0 (0.0%) |
| No Fuel Used | 0 (0.0%) | 0 (0.0%) |
| Total | 23 (100.0%) | 92 (100.0%) |
Household Vehicle Usage in El Nido
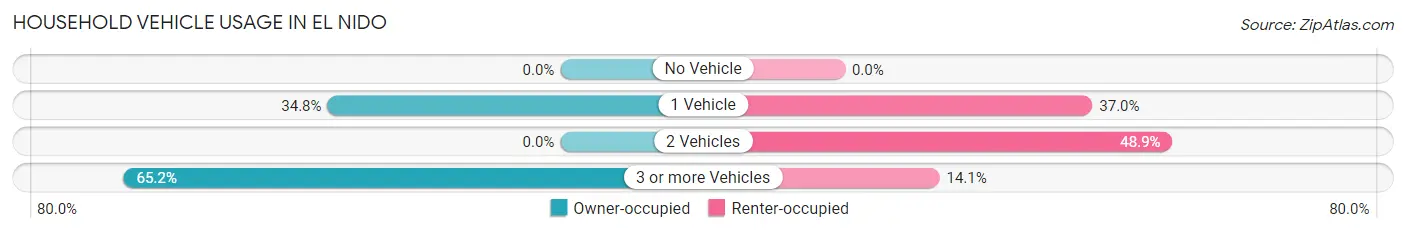
| Vehicles per Household | Owner-occupied | Renter-occupied |
| No Vehicle | 0 (0.0%) | 0 (0.0%) |
| 1 Vehicle | 8 (34.8%) | 34 (37.0%) |
| 2 Vehicles | 0 (0.0%) | 45 (48.9%) |
| 3 or more Vehicles | 15 (65.2%) | 13 (14.1%) |
| Total | 23 (100.0%) | 92 (100.0%) |
Real Estate & Mortgages in El Nido
Real Estate and Mortgage Overview in El Nido
| Characteristic | Without Mortgage | With Mortgage |
| Housing Units | 20 | 3 |
| Median Property Value | $16,700 | $0 |
| Median Household Income | $64,688 | $0 |
| Monthly Housing Costs | $533 | $3 |
| Real Estate Taxes | - | - |
Property Value by Mortgage Status in El Nido
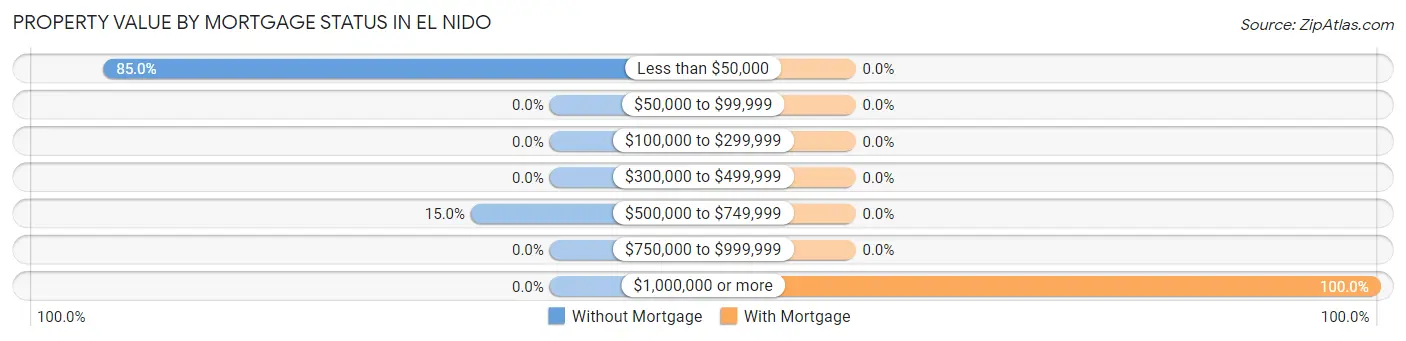
| Property Value | Without Mortgage | With Mortgage |
| Less than $50,000 | 17 (85.0%) | 0 (0.0%) |
| $50,000 to $99,999 | 0 (0.0%) | 0 (0.0%) |
| $100,000 to $299,999 | 0 (0.0%) | 0 (0.0%) |
| $300,000 to $499,999 | 0 (0.0%) | 0 (0.0%) |
| $500,000 to $749,999 | 3 (15.0%) | 0 (0.0%) |
| $750,000 to $999,999 | 0 (0.0%) | 0 (0.0%) |
| $1,000,000 or more | 0 (0.0%) | 3 (100.0%) |
| Total | 20 (100.0%) | 3 (100.0%) |
Household Income by Mortgage Status in El Nido
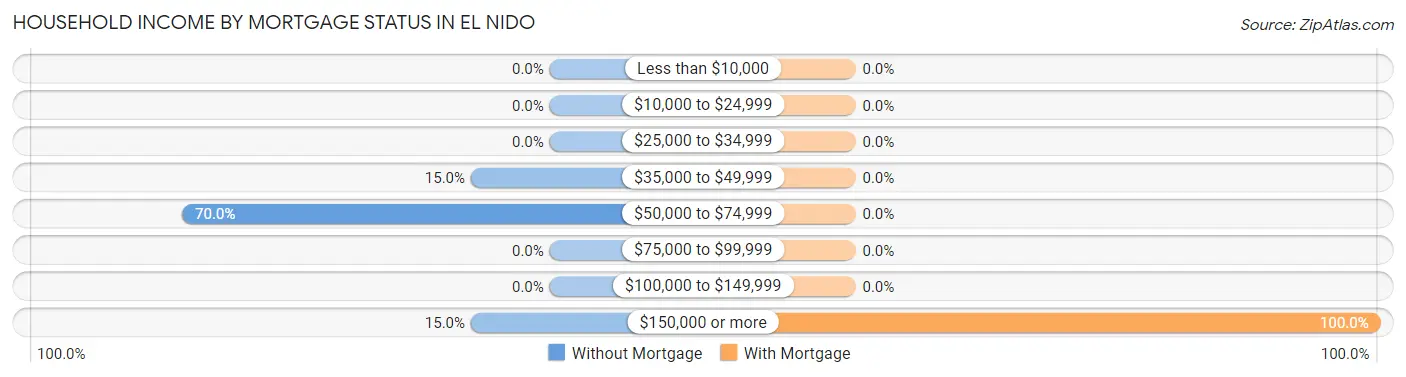
| Household Income | Without Mortgage | With Mortgage |
| Less than $10,000 | 0 (0.0%) | 0 (0.0%) |
| $10,000 to $24,999 | 0 (0.0%) | 0 (0.0%) |
| $25,000 to $34,999 | 0 (0.0%) | 0 (0.0%) |
| $35,000 to $49,999 | 3 (15.0%) | 0 (0.0%) |
| $50,000 to $74,999 | 14 (70.0%) | 0 (0.0%) |
| $75,000 to $99,999 | 0 (0.0%) | 0 (0.0%) |
| $100,000 to $149,999 | 0 (0.0%) | 0 (0.0%) |
| $150,000 or more | 3 (15.0%) | 3 (100.0%) |
| Total | 20 (100.0%) | 3 (100.0%) |
Property Value to Household Income Ratio in El Nido
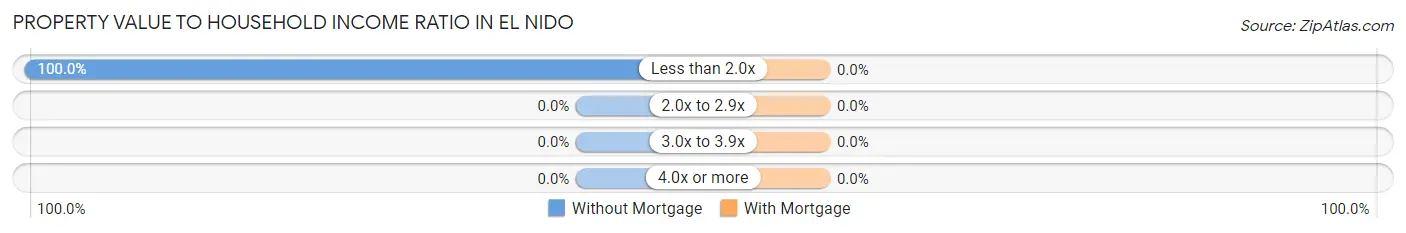
| Value-to-Income Ratio | Without Mortgage | With Mortgage |
| Less than 2.0x | 20 (100.0%) | 0 (0.0%) |
| 2.0x to 2.9x | 0 (0.0%) | 0 (0.0%) |
| 3.0x to 3.9x | 0 (0.0%) | 0 (0.0%) |
| 4.0x or more | 0 (0.0%) | 0 (0.0%) |
| Total | 20 (100.0%) | 3 (100.0%) |
Real Estate Taxes by Mortgage Status in El Nido
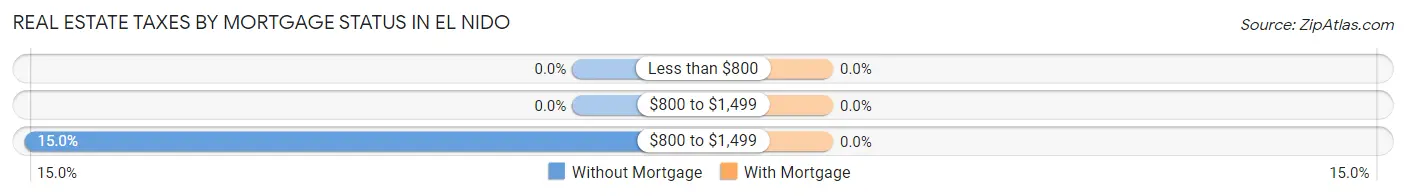
| Property Taxes | Without Mortgage | With Mortgage |
| Less than $800 | 0 (0.0%) | 0 (0.0%) |
| $800 to $1,499 | 0 (0.0%) | 0 (0.0%) |
| $800 to $1,499 | 3 (15.0%) | 0 (0.0%) |
| Total | 20 (100.0%) | 3 (100.0%) |
Health & Disability in El Nido
Health Insurance Coverage by Age in El Nido
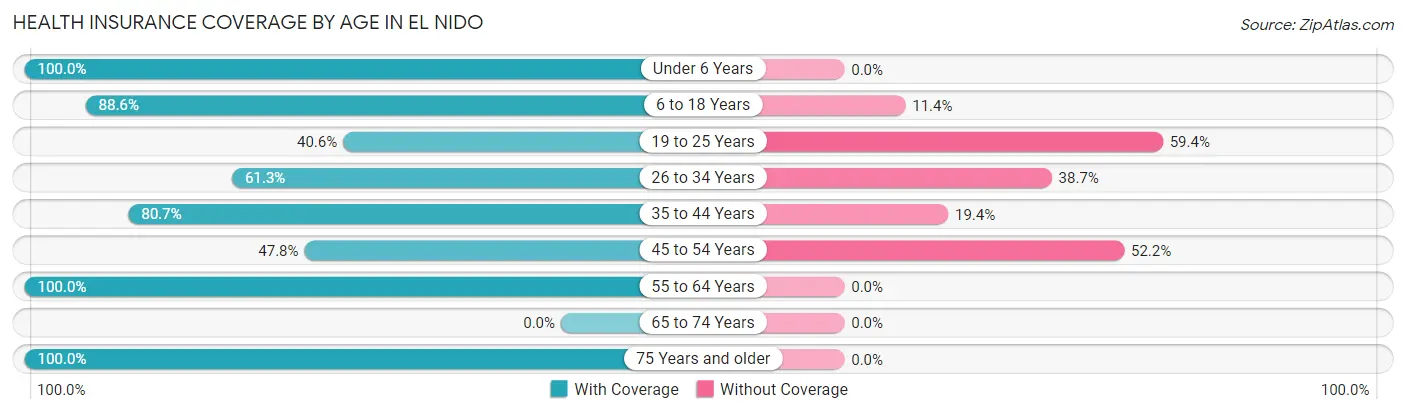
| Age Bracket | With Coverage | Without Coverage |
| Under 6 Years | 87 (100.0%) | 0 (0.0%) |
| 6 to 18 Years | 109 (88.6%) | 14 (11.4%) |
| 19 to 25 Years | 13 (40.6%) | 19 (59.4%) |
| 26 to 34 Years | 46 (61.3%) | 29 (38.7%) |
| 35 to 44 Years | 75 (80.6%) | 18 (19.4%) |
| 45 to 54 Years | 11 (47.8%) | 12 (52.2%) |
| 55 to 64 Years | 12 (100.0%) | 0 (0.0%) |
| 65 to 74 Years | 0 (0.0%) | 0 (0.0%) |
| 75 Years and older | 14 (100.0%) | 0 (0.0%) |
| Total | 367 (80.0%) | 92 (20.0%) |
Health Insurance Coverage by Citizenship Status in El Nido

| Citizenship Status | With Coverage | Without Coverage |
| Native Born | 87 (100.0%) | 0 (0.0%) |
| Foreign Born, Citizen | 109 (88.6%) | 14 (11.4%) |
| Foreign Born, not a Citizen | 13 (40.6%) | 19 (59.4%) |
Health Insurance Coverage by Household Income in El Nido
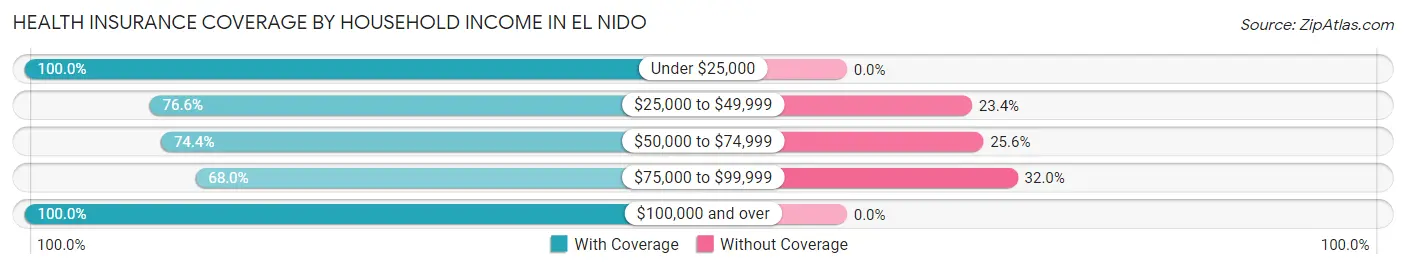
| Household Income | With Coverage | Without Coverage |
| Under $25,000 | 77 (100.0%) | 0 (0.0%) |
| $25,000 to $49,999 | 49 (76.6%) | 15 (23.4%) |
| $50,000 to $74,999 | 201 (74.4%) | 69 (25.6%) |
| $75,000 to $99,999 | 17 (68.0%) | 8 (32.0%) |
| $100,000 and over | 23 (100.0%) | 0 (0.0%) |
Public vs Private Health Insurance Coverage by Age in El Nido
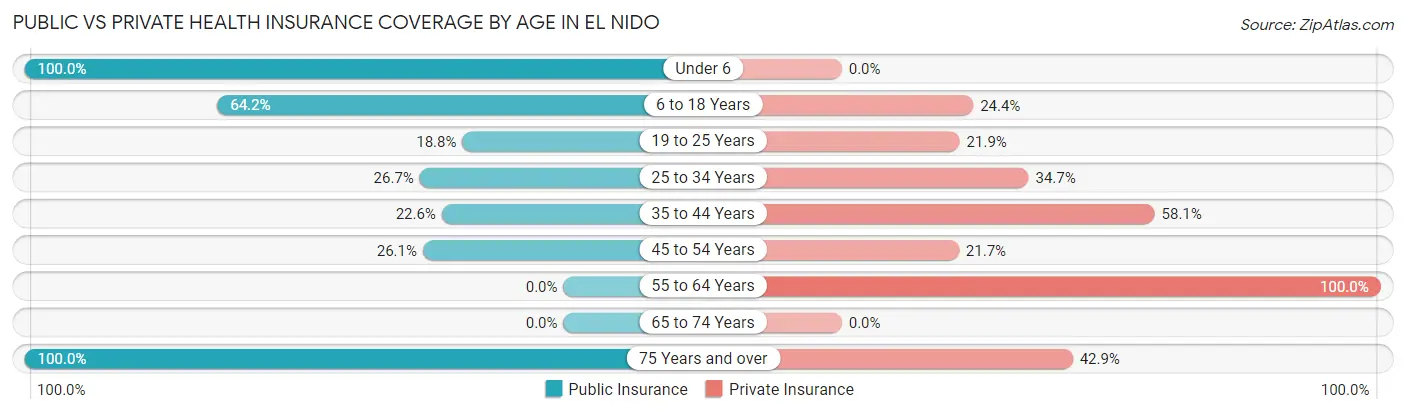
| Age Bracket | Public Insurance | Private Insurance |
| Under 6 | 87 (100.0%) | 0 (0.0%) |
| 6 to 18 Years | 79 (64.2%) | 30 (24.4%) |
| 19 to 25 Years | 6 (18.8%) | 7 (21.9%) |
| 25 to 34 Years | 20 (26.7%) | 26 (34.7%) |
| 35 to 44 Years | 21 (22.6%) | 54 (58.1%) |
| 45 to 54 Years | 6 (26.1%) | 5 (21.7%) |
| 55 to 64 Years | 0 (0.0%) | 12 (100.0%) |
| 65 to 74 Years | 0 (0.0%) | 0 (0.0%) |
| 75 Years and over | 14 (100.0%) | 6 (42.9%) |
| Total | 233 (50.8%) | 140 (30.5%) |
Disability Status by Sex by Age in El Nido
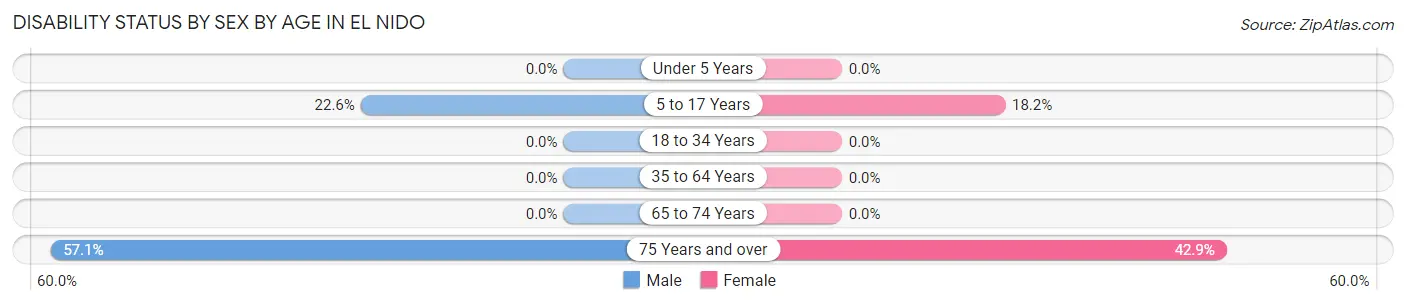
| Age Bracket | Male | Female |
| Under 5 Years | 0 (0.0%) | 0 (0.0%) |
| 5 to 17 Years | 14 (22.6%) | 12 (18.2%) |
| 18 to 34 Years | 0 (0.0%) | 0 (0.0%) |
| 35 to 64 Years | 0 (0.0%) | 0 (0.0%) |
| 65 to 74 Years | 0 (0.0%) | 0 (0.0%) |
| 75 Years and over | 4 (57.1%) | 3 (42.9%) |
Disability Class by Sex by Age in El Nido
Disability Class: Hearing Difficulty
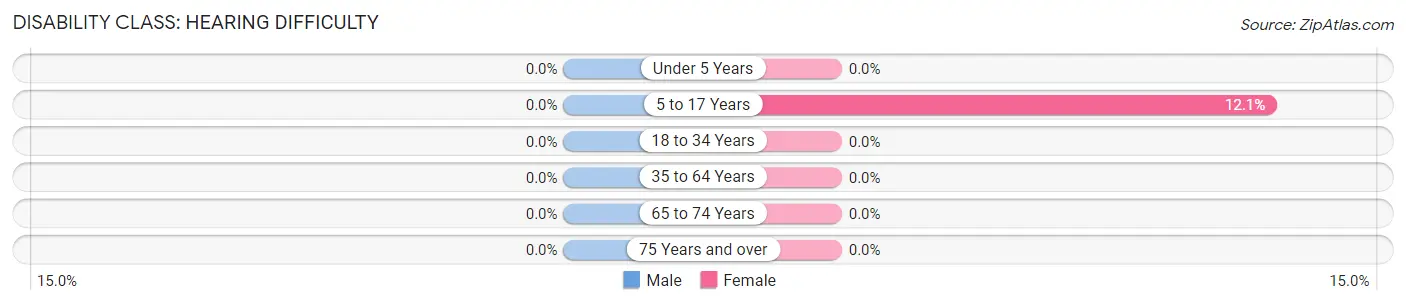
| Age Bracket | Male | Female |
| Under 5 Years | 0 (0.0%) | 0 (0.0%) |
| 5 to 17 Years | 0 (0.0%) | 8 (12.1%) |
| 18 to 34 Years | 0 (0.0%) | 0 (0.0%) |
| 35 to 64 Years | 0 (0.0%) | 0 (0.0%) |
| 65 to 74 Years | 0 (0.0%) | 0 (0.0%) |
| 75 Years and over | 0 (0.0%) | 0 (0.0%) |
Disability Class: Vision Difficulty
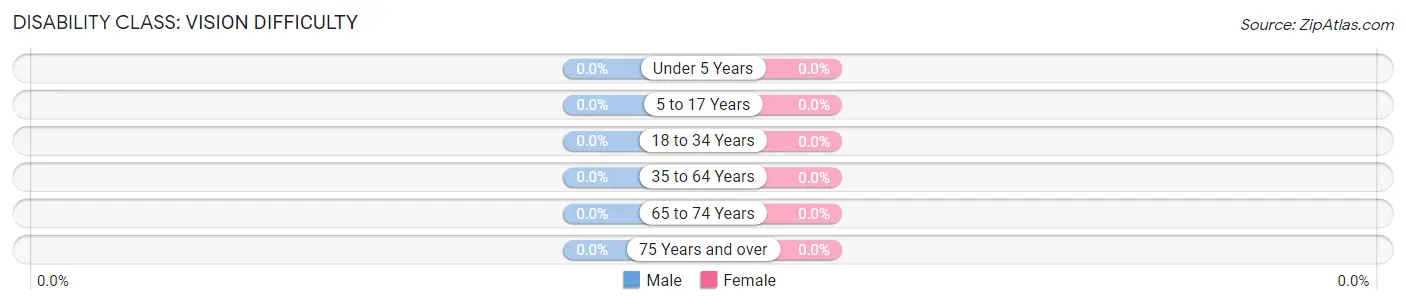
| Age Bracket | Male | Female |
| Under 5 Years | 0 (0.0%) | 0 (0.0%) |
| 5 to 17 Years | 0 (0.0%) | 0 (0.0%) |
| 18 to 34 Years | 0 (0.0%) | 0 (0.0%) |
| 35 to 64 Years | 0 (0.0%) | 0 (0.0%) |
| 65 to 74 Years | 0 (0.0%) | 0 (0.0%) |
| 75 Years and over | 0 (0.0%) | 0 (0.0%) |
Disability Class: Cognitive Difficulty
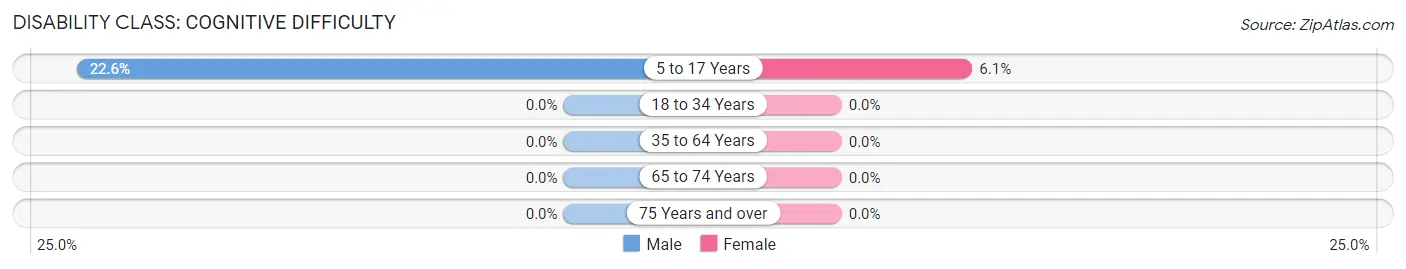
| Age Bracket | Male | Female |
| 5 to 17 Years | 14 (22.6%) | 4 (6.1%) |
| 18 to 34 Years | 0 (0.0%) | 0 (0.0%) |
| 35 to 64 Years | 0 (0.0%) | 0 (0.0%) |
| 65 to 74 Years | 0 (0.0%) | 0 (0.0%) |
| 75 Years and over | 0 (0.0%) | 0 (0.0%) |
Disability Class: Ambulatory Difficulty
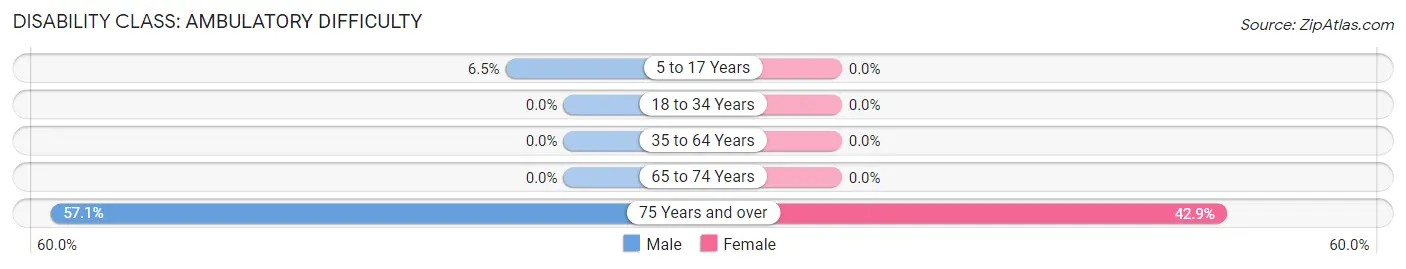
| Age Bracket | Male | Female |
| 5 to 17 Years | 4 (6.5%) | 0 (0.0%) |
| 18 to 34 Years | 0 (0.0%) | 0 (0.0%) |
| 35 to 64 Years | 0 (0.0%) | 0 (0.0%) |
| 65 to 74 Years | 0 (0.0%) | 0 (0.0%) |
| 75 Years and over | 4 (57.1%) | 3 (42.9%) |
Disability Class: Self-Care Difficulty
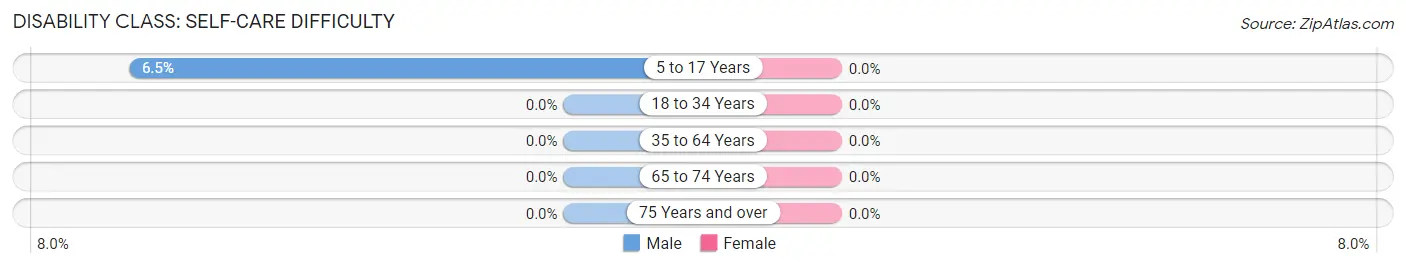
| Age Bracket | Male | Female |
| 5 to 17 Years | 4 (6.5%) | 0 (0.0%) |
| 18 to 34 Years | 0 (0.0%) | 0 (0.0%) |
| 35 to 64 Years | 0 (0.0%) | 0 (0.0%) |
| 65 to 74 Years | 0 (0.0%) | 0 (0.0%) |
| 75 Years and over | 0 (0.0%) | 0 (0.0%) |
Technology Access in El Nido
Computing Device Access in El Nido
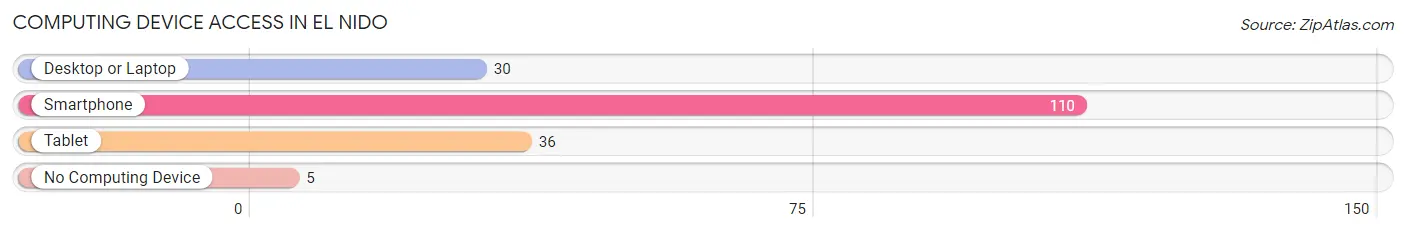
| Device Type | # Households | % Households |
| Desktop or Laptop | 30 | 26.1% |
| Smartphone | 110 | 95.7% |
| Tablet | 36 | 31.3% |
| No Computing Device | 5 | 4.3% |
| Total | 115 | 100.0% |
Internet Access in El Nido
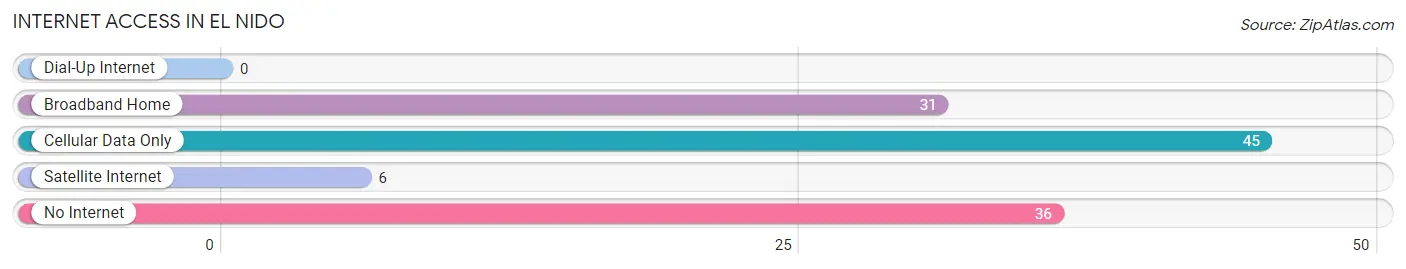
| Internet Type | # Households | % Households |
| Dial-Up Internet | 0 | 0.0% |
| Broadband Home | 31 | 27.0% |
| Cellular Data Only | 45 | 39.1% |
| Satellite Internet | 6 | 5.2% |
| No Internet | 36 | 31.3% |
| Total | 115 | 100.0% |
El Nido Summary
Nestled in the foothills of the Sierra Nevada Mountains, the small town of El Nido, California is a picturesque community with a rich history and a vibrant economy. Located in Madera County, El Nido is situated about 30 miles northeast of Fresno and is home to just over 1,000 residents.
History
The area that is now El Nido was first settled by Native Americans, who lived in the area for centuries before the arrival of Europeans. The first Europeans to settle in the area were Spanish missionaries, who established a mission in the area in 1806. The mission was abandoned in 1833, but the area remained sparsely populated until the late 19th century.
In 1891, the El Nido Land and Water Company was formed to develop the area. The company was led by William H. Boggs, who purchased the land from the Spanish government and began to develop it for agriculture. The company built a railroad line to connect the area to Fresno, and the town of El Nido was officially founded in 1895.
The town grew slowly over the next few decades, and by the mid-20th century, it had become a popular tourist destination. The town was known for its natural beauty, and it was a popular spot for fishing, camping, and other outdoor activities.
Geography
El Nido is located in the foothills of the Sierra Nevada Mountains, about 30 miles northeast of Fresno. The town is situated at an elevation of 1,400 feet, and it is surrounded by rolling hills and lush forests. The town is located in a semi-arid climate, with hot summers and mild winters.
The town is located on the banks of the San Joaquin River, and it is home to several small lakes and reservoirs. The nearby Sierra National Forest provides a variety of outdoor activities, including camping, hiking, and fishing.
Economy
The economy of El Nido is largely based on agriculture and tourism. The town is home to several small farms, which produce a variety of crops, including almonds, grapes, and olives. The town is also home to several wineries, which produce a variety of wines.
The town is also a popular tourist destination, and it is home to several bed and breakfasts, restaurants, and other tourist attractions. The nearby Sierra National Forest provides a variety of outdoor activities, including camping, hiking, and fishing.
Demographics
As of the 2010 census, El Nido had a population of 1,072. The town is predominantly white, with about 75% of the population identifying as white. The town is also home to a small Hispanic population, with about 15% of the population identifying as Hispanic or Latino. The town is also home to a small African American population, with about 5% of the population identifying as African American.
The median household income in El Nido is $45,000, and the median home value is $200,000. The town has a low unemployment rate, and the majority of the population is employed in the agricultural and tourism industries.
Conclusion
El Nido is a small town with a rich history and a vibrant economy. The town is situated in the foothills of the Sierra Nevada Mountains, and it is home to several small farms and wineries. The town is also a popular tourist destination, and it is home to several bed and breakfasts, restaurants, and other tourist attractions. The town is predominantly white, with a small Hispanic and African American population. The town has a low unemployment rate, and the majority of the population is employed in the agricultural and tourism industries.
Common Questions
What is Per Capita Income in El Nido?
Per Capita income in El Nido is $23,552.
What is the Median Family Income in El Nido?
Median Family Income in El Nido is $53,276.
What is the Median Household income in El Nido?
Median Household Income in El Nido is $52,716.
What is Inequality or Gini Index in El Nido?
Inequality or Gini Index in El Nido is 0.66.
What is the Total Population of El Nido?
Total Population of El Nido is 459.
What is the Total Male Population of El Nido?
Total Male Population of El Nido is 256.
What is the Total Female Population of El Nido?
Total Female Population of El Nido is 203.
What is the Ratio of Males per 100 Females in El Nido?
There are 126.11 Males per 100 Females in El Nido.
What is the Ratio of Females per 100 Males in El Nido?
There are 79.30 Females per 100 Males in El Nido.
What is the Median Population Age in El Nido?
Median Population Age in El Nido is 22.2 Years.
What is the Average Family Size in El Nido
Average Family Size in El Nido is 4.2 People.
What is the Average Household Size in El Nido
Average Household Size in El Nido is 4.0 People.
How Large is the Labor Force in El Nido?
There are 148 People in the Labor Forcein in El Nido.
What is the Percentage of People in the Labor Force in El Nido?
54.8% of People are in the Labor Force in El Nido.
What is the Unemployment Rate in El Nido?
Unemployment Rate in El Nido is 4.1%.