Zip Codes with the Highest Percentage of Families with Income Below $10,000 in San Jose, CA
RELATED REPORTS & OPTIONS
Family Income | $0-10k
San Jose
Compare Zip Codes
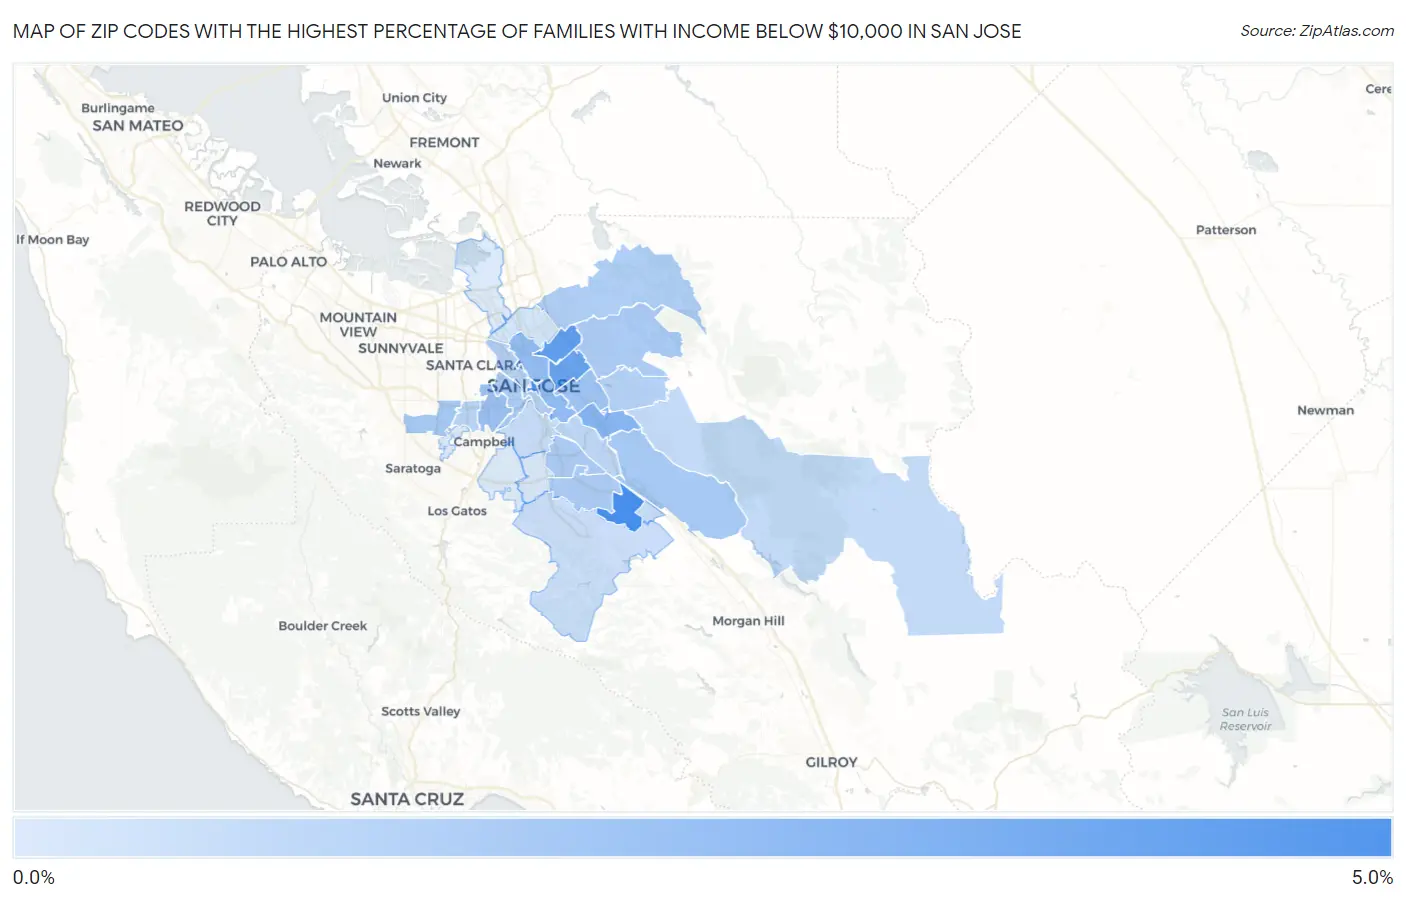
Map of Zip Codes with the Highest Percentage of Families with Income Below $10,000 in San Jose
0.60%
4.1%
Zip Codes with the Highest Percentage of Families with Income Below $10,000 in San Jose, CA
| Zip Code | Families with Income < $10k | vs State | vs National | |
| 1. | 95119 | 4.1% | 2.9%(+1.20)#400 | 3.1%(+1.000)#7,968 |
| 2. | 95113 | 3.9% | 2.9%(+1.00)#446 | 3.1%(+0.800)#8,573 |
| 3. | 95133 | 3.5% | 2.9%(+0.600)#513 | 3.1%(+0.400)#9,522 |
| 4. | 95116 | 3.3% | 2.9%(+0.400)#547 | 3.1%(+0.200)#10,103 |
| 5. | 95121 | 2.6% | 2.9%(-0.300)#735 | 3.1%(-0.500)#12,639 |
| 6. | 95112 | 2.3% | 2.9%(-0.600)#811 | 3.1%(-0.800)#13,870 |
| 7. | 95128 | 2.1% | 2.9%(-0.800)#885 | 3.1%(-1.000)#14,829 |
| 8. | 95122 | 2.0% | 2.9%(-0.900)#919 | 3.1%(-1.10)#15,251 |
| 9. | 95129 | 1.8% | 2.9%(-1.10)#990 | 3.1%(-1.30)#16,243 |
| 10. | 95138 | 1.8% | 2.9%(-1.10)#1,009 | 3.1%(-1.30)#16,356 |
| 11. | 95123 | 1.7% | 2.9%(-1.20)#1,022 | 3.1%(-1.40)#16,669 |
| 12. | 95127 | 1.7% | 2.9%(-1.20)#1,024 | 3.1%(-1.40)#16,673 |
| 13. | 95136 | 1.7% | 2.9%(-1.20)#1,029 | 3.1%(-1.40)#16,694 |
| 14. | 95126 | 1.7% | 2.9%(-1.20)#1,040 | 3.1%(-1.40)#16,731 |
| 15. | 95132 | 1.6% | 2.9%(-1.30)#1,071 | 3.1%(-1.50)#17,218 |
| 16. | 95148 | 1.5% | 2.9%(-1.40)#1,096 | 3.1%(-1.60)#17,672 |
| 17. | 95110 | 1.5% | 2.9%(-1.40)#1,111 | 3.1%(-1.60)#17,797 |
| 18. | 95117 | 1.4% | 2.9%(-1.50)#1,134 | 3.1%(-1.70)#18,246 |
| 19. | 95111 | 1.3% | 2.9%(-1.60)#1,151 | 3.1%(-1.80)#18,665 |
| 20. | 95135 | 1.2% | 2.9%(-1.70)#1,206 | 3.1%(-1.90)#19,326 |
| 21. | 95125 | 1.1% | 2.9%(-1.80)#1,216 | 3.1%(-2.00)#19,700 |
| 22. | 95139 | 1.1% | 2.9%(-1.80)#1,229 | 3.1%(-2.00)#19,931 |
| 23. | 95120 | 1.0% | 2.9%(-1.90)#1,237 | 3.1%(-2.10)#20,225 |
| 24. | 95131 | 0.80% | 2.9%(-2.10)#1,289 | 3.1%(-2.30)#21,229 |
| 25. | 95118 | 0.70% | 2.9%(-2.20)#1,304 | 3.1%(-2.40)#21,673 |
| 26. | 95124 | 0.60% | 2.9%(-2.30)#1,321 | 3.1%(-2.50)#22,142 |
| 27. | 95134 | 0.60% | 2.9%(-2.30)#1,328 | 3.1%(-2.50)#22,177 |
| 28. | 95130 | 0.60% | 2.9%(-2.30)#1,333 | 3.1%(-2.50)#22,273 |
1
Common Questions
What are the Top 10 Zip Codes with the Highest Percentage of Families with Income Below $10,000 in San Jose, CA?
Top 10 Zip Codes with the Highest Percentage of Families with Income Below $10,000 in San Jose, CA are:
What zip code has the Highest Percentage of Families with Income Below $10,000 in San Jose, CA?
95119 has the Highest Percentage of Families with Income Below $10,000 in San Jose, CA with 4.1%.
What is the Percentage of Families with Income Below $10,000 in San Jose, CA?
Percentage of Families with Income Below $10,000 in San Jose is 1.7%.
What is the Percentage of Families with Income Below $10,000 in California?
Percentage of Families with Income Below $10,000 in California is 2.9%.
What is the Percentage of Families with Income Below $10,000 in the United States?
Percentage of Families with Income Below $10,000 in the United States is 3.1%.