Cities with the Highest Percentage of Families with Income Below $10,000 in Wyoming
RELATED REPORTS & OPTIONS
Family Income | $0-10k
Wyoming
Compare Cities
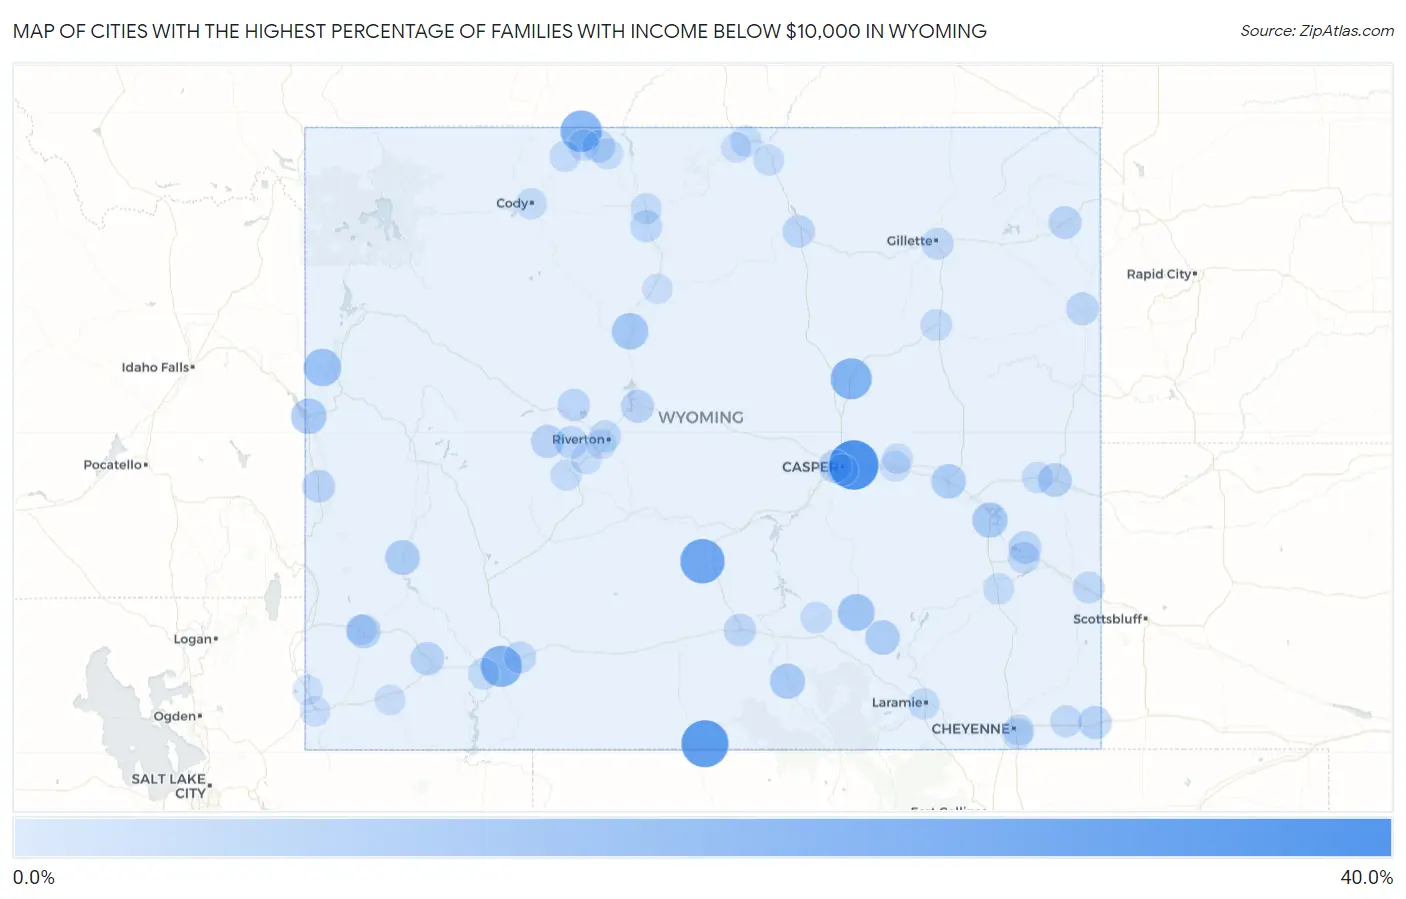
Map of Cities with the Highest Percentage of Families with Income Below $10,000 in Wyoming
0.0%
40.0%
Cities with the Highest Percentage of Families with Income Below $10,000 in Wyoming
| City | Families with Income < $10k | vs State | vs National | |
| 1. | Brookhurst | 40.0% | 2.6%(+37.4)#1 | 3.1%(+36.9)#212 |
| 2. | Dixon | 34.8% | 2.6%(+32.2)#2 | 3.1%(+31.7)#297 |
| 3. | Bairoil | 29.1% | 2.6%(+26.5)#3 | 3.1%(+26.0)#430 |
| 4. | Frannie | 22.8% | 2.6%(+20.2)#4 | 3.1%(+19.7)#713 |
| 5. | Purple Sage | 22.4% | 2.6%(+19.8)#5 | 3.1%(+19.3)#739 |
| 6. | Edgerton | 22.2% | 2.6%(+19.6)#6 | 3.1%(+19.1)#749 |
| 7. | Wilson | 14.8% | 2.6%(+12.2)#7 | 3.1%(+11.7)#1,491 |
| 8. | Medicine Bow | 13.3% | 2.6%(+10.7)#8 | 3.1%(+10.2)#1,818 |
| 9. | Lucerne | 12.4% | 2.6%(+9.80)#9 | 3.1%(+9.30)#2,040 |
| 10. | Alpine | 10.7% | 2.6%(+8.10)#10 | 3.1%(+7.60)#2,566 |
| 11. | Glendo | 10.2% | 2.6%(+7.60)#11 | 3.1%(+7.10)#2,788 |
| 12. | Saratoga | 10.1% | 2.6%(+7.50)#12 | 3.1%(+7.00)#2,803 |
| 13. | La Barge | 9.4% | 2.6%(+6.80)#13 | 3.1%(+6.30)#3,161 |
| 14. | Rock River | 8.9% | 2.6%(+6.30)#14 | 3.1%(+5.80)#3,424 |
| 15. | Douglas | 8.8% | 2.6%(+6.20)#15 | 3.1%(+5.70)#3,441 |
| 16. | Diamondville | 7.4% | 2.6%(+4.80)#16 | 3.1%(+4.30)#4,332 |
| 17. | Lusk | 7.0% | 2.6%(+4.40)#17 | 3.1%(+3.90)#4,648 |
| 18. | Granger | 6.6% | 2.6%(+4.00)#18 | 3.1%(+3.50)#5,046 |
| 19. | Pine Bluffs | 6.1% | 2.6%(+3.50)#19 | 3.1%(+3.00)#5,542 |
| 20. | Fort Washakie | 6.0% | 2.6%(+3.40)#20 | 3.1%(+2.90)#5,646 |
| 21. | Mills | 5.8% | 2.6%(+3.20)#21 | 3.1%(+2.70)#5,872 |
| 22. | Shoshoni | 5.7% | 2.6%(+3.10)#22 | 3.1%(+2.60)#6,032 |
| 23. | Afton | 5.4% | 2.6%(+2.80)#23 | 3.1%(+2.30)#6,379 |
| 24. | Sundance | 5.4% | 2.6%(+2.80)#24 | 3.1%(+2.30)#6,403 |
| 25. | Ethete | 5.3% | 2.6%(+2.70)#25 | 3.1%(+2.20)#6,524 |
| 26. | Newcastle | 5.2% | 2.6%(+2.60)#26 | 3.1%(+2.10)#6,671 |
| 27. | Hartville | 5.0% | 2.6%(+2.40)#27 | 3.1%(+1.90)#7,037 |
| 28. | Cowley | 4.8% | 2.6%(+2.20)#28 | 3.1%(+1.70)#7,295 |
| 29. | Rawlins | 4.7% | 2.6%(+2.10)#29 | 3.1%(+1.60)#7,380 |
| 30. | Buffalo | 4.6% | 2.6%(+2.00)#30 | 3.1%(+1.50)#7,542 |
| 31. | Pavillion | 4.4% | 2.6%(+1.80)#31 | 3.1%(+1.30)#7,950 |
| 32. | Gillette | 4.0% | 2.6%(+1.40)#32 | 3.1%(+0.900)#8,562 |
| 33. | Rock Springs | 3.9% | 2.6%(+1.30)#33 | 3.1%(+0.800)#8,747 |
| 34. | Riverton | 3.8% | 2.6%(+1.20)#34 | 3.1%(+0.700)#8,955 |
| 35. | Basin | 3.8% | 2.6%(+1.20)#35 | 3.1%(+0.700)#9,050 |
| 36. | Guernsey | 3.7% | 2.6%(+1.10)#36 | 3.1%(+0.600)#9,255 |
| 37. | Torrington | 3.5% | 2.6%(+0.900)#37 | 3.1%(+0.400)#9,593 |
| 38. | Burns | 3.4% | 2.6%(+0.800)#38 | 3.1%(+0.300)#9,930 |
| 39. | Casper | 3.1% | 2.6%(+0.500)#39 | 3.1%(=0.000)#10,441 |
| 40. | Wright | 3.1% | 2.6%(+0.500)#40 | 3.1%(=0.000)#10,575 |
| 41. | Hanna | 3.1% | 2.6%(+0.500)#41 | 3.1%(=0.000)#10,620 |
| 42. | Laramie | 2.7% | 2.6%(+0.100)#42 | 3.1%(-0.400)#11,453 |
| 43. | Green River | 2.6% | 2.6%(=0.000)#43 | 3.1%(-0.500)#11,715 |
| 44. | Manville | 2.6% | 2.6%(=0.000)#44 | 3.1%(-0.500)#11,936 |
| 45. | Cody | 2.5% | 2.6%(-0.100)#45 | 3.1%(-0.600)#12,034 |
| 46. | Wheatland | 2.5% | 2.6%(-0.100)#46 | 3.1%(-0.600)#12,079 |
| 47. | Ranchester | 2.5% | 2.6%(-0.100)#47 | 3.1%(-0.600)#12,148 |
| 48. | Deaver | 2.5% | 2.6%(-0.100)#48 | 3.1%(-0.600)#12,208 |
| 49. | Greybull | 2.4% | 2.6%(-0.200)#49 | 3.1%(-0.700)#12,394 |
| 50. | Powell | 2.3% | 2.6%(-0.300)#50 | 3.1%(-0.800)#12,642 |
| 51. | Fox Farm College | 2.3% | 2.6%(-0.300)#51 | 3.1%(-0.800)#12,667 |
| 52. | Lander | 2.2% | 2.6%(-0.400)#52 | 3.1%(-0.900)#12,931 |
| 53. | Lovell | 2.2% | 2.6%(-0.400)#53 | 3.1%(-0.900)#13,001 |
| 54. | Sheridan | 2.1% | 2.6%(-0.500)#54 | 3.1%(-1.000)#13,190 |
| 55. | Cheyenne | 2.0% | 2.6%(-0.600)#55 | 3.1%(-1.10)#13,450 |
| 56. | Kemmerer | 1.8% | 2.6%(-0.800)#56 | 3.1%(-1.30)#14,219 |
| 57. | Hudson | 1.7% | 2.6%(-0.900)#57 | 3.1%(-1.40)#14,657 |
| 58. | Glenrock | 1.5% | 2.6%(-1.10)#58 | 3.1%(-1.60)#15,211 |
| 59. | Rolling Hills | 1.4% | 2.6%(-1.20)#59 | 3.1%(-1.70)#15,684 |
| 60. | Lyman | 1.3% | 2.6%(-1.30)#60 | 3.1%(-1.80)#15,957 |
| 61. | Arapahoe | 1.2% | 2.6%(-1.40)#61 | 3.1%(-1.90)#16,311 |
| 62. | La Grange | 1.2% | 2.6%(-1.40)#62 | 3.1%(-1.90)#16,405 |
| 63. | Dayton | 1.0% | 2.6%(-1.60)#63 | 3.1%(-2.10)#17,052 |
| 64. | Evanston | 0.90% | 2.6%(-1.70)#64 | 3.1%(-2.20)#17,209 |
| 65. | Worland | 0.80% | 2.6%(-1.80)#65 | 3.1%(-2.30)#17,625 |
| 66. | Bear River | 0.40% | 2.6%(-2.20)#66 | 3.1%(-2.70)#18,788 |
1
2Common Questions
What are the Top 10 Cities with the Highest Percentage of Families with Income Below $10,000 in Wyoming?
Top 10 Cities with the Highest Percentage of Families with Income Below $10,000 in Wyoming are:
#1
40.0%
#2
34.8%
#3
29.1%
#4
22.8%
#5
22.4%
#6
22.2%
#7
14.8%
#8
13.3%
#9
12.4%
#10
10.7%
What city has the Highest Percentage of Families with Income Below $10,000 in Wyoming?
Brookhurst has the Highest Percentage of Families with Income Below $10,000 in Wyoming with 40.0%.
What is the Percentage of Families with Income Below $10,000 in the State of Wyoming?
Percentage of Families with Income Below $10,000 in Wyoming is 2.6%.
What is the Percentage of Families with Income Below $10,000 in the United States?
Percentage of Families with Income Below $10,000 in the United States is 3.1%.