Cities with the Highest Percentage of Families with Income Below $10,000 in Delaware
RELATED REPORTS & OPTIONS
Family Income | $0-10k
Delaware
Compare Cities
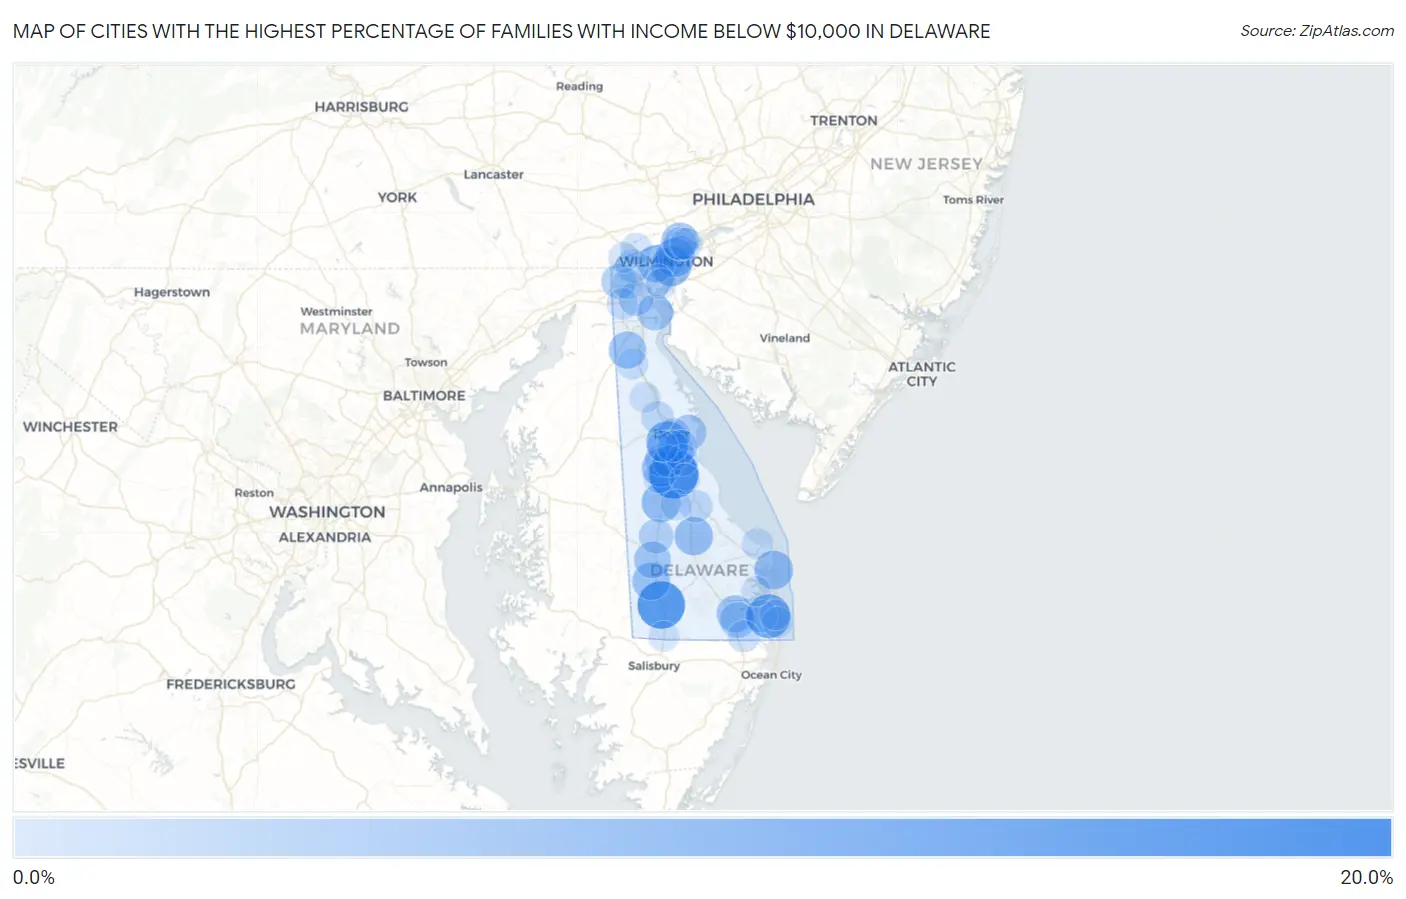
Map of Cities with the Highest Percentage of Families with Income Below $10,000 in Delaware
0.0%
20.0%
Cities with the Highest Percentage of Families with Income Below $10,000 in Delaware
| City | Families with Income < $10k | vs State | vs National | |
| 1. | Riverview | 17.1% | 2.6%(+14.5)#1 | 3.1%(+14.0)#1,191 |
| 2. | Laurel | 15.3% | 2.6%(+12.7)#2 | 3.1%(+12.2)#1,423 |
| 3. | Ocean View | 11.9% | 2.6%(+9.30)#3 | 3.1%(+8.80)#2,150 |
| 4. | Rodney Village | 10.7% | 2.6%(+8.10)#4 | 3.1%(+7.60)#2,559 |
| 5. | Wilmington | 8.4% | 2.6%(+5.80)#5 | 3.1%(+5.30)#3,649 |
| 6. | Edgemoor | 7.8% | 2.6%(+5.20)#6 | 3.1%(+4.70)#4,021 |
| 7. | Harrington | 7.8% | 2.6%(+5.20)#7 | 3.1%(+4.70)#4,030 |
| 8. | Dewey Beach | 7.4% | 2.6%(+4.80)#8 | 3.1%(+4.30)#4,342 |
| 9. | Viola | 7.4% | 2.6%(+4.80)#9 | 3.1%(+4.30)#4,358 |
| 10. | Ellendale | 7.2% | 2.6%(+4.60)#10 | 3.1%(+4.10)#4,494 |
| 11. | Seaford | 6.6% | 2.6%(+4.00)#11 | 3.1%(+3.50)#4,978 |
| 12. | Elsmere | 6.3% | 2.6%(+3.70)#12 | 3.1%(+3.20)#5,274 |
| 13. | Middletown | 6.2% | 2.6%(+3.60)#13 | 3.1%(+3.10)#5,380 |
| 14. | Arden | 6.1% | 2.6%(+3.50)#14 | 3.1%(+3.00)#5,554 |
| 15. | Dagsboro | 5.8% | 2.6%(+3.20)#15 | 3.1%(+2.70)#5,902 |
| 16. | Bridgeville | 5.7% | 2.6%(+3.10)#16 | 3.1%(+2.60)#5,986 |
| 17. | Delaware City | 4.9% | 2.6%(+2.30)#17 | 3.1%(+1.80)#7,133 |
| 18. | Frankford | 4.7% | 2.6%(+2.10)#18 | 3.1%(+1.60)#7,452 |
| 19. | Little Creek | 4.6% | 2.6%(+2.00)#19 | 3.1%(+1.50)#7,619 |
| 20. | Newark | 4.1% | 2.6%(+1.50)#20 | 3.1%(+1.000)#8,352 |
| 21. | Rising Sun Lebanon | 4.0% | 2.6%(+1.40)#21 | 3.1%(+0.900)#8,618 |
| 22. | Greenwood | 3.8% | 2.6%(+1.20)#22 | 3.1%(+0.700)#9,037 |
| 23. | Bear | 3.7% | 2.6%(+1.10)#23 | 3.1%(+0.600)#9,145 |
| 24. | Pike Creek Valley | 2.9% | 2.6%(+0.300)#24 | 3.1%(-0.200)#10,957 |
| 25. | Dover | 2.8% | 2.6%(+0.200)#25 | 3.1%(-0.300)#11,189 |
| 26. | Ardencroft | 2.7% | 2.6%(+0.100)#26 | 3.1%(-0.400)#11,657 |
| 27. | Woodside | 2.6% | 2.6%(=0.000)#27 | 3.1%(-0.500)#11,925 |
| 28. | Dover Base Housing | 2.4% | 2.6%(-0.200)#28 | 3.1%(-0.700)#12,370 |
| 29. | Cheswold | 2.2% | 2.6%(-0.400)#29 | 3.1%(-0.900)#13,021 |
| 30. | Milford | 2.1% | 2.6%(-0.500)#30 | 3.1%(-1.000)#13,216 |
| 31. | Millville | 2.0% | 2.6%(-0.600)#31 | 3.1%(-1.10)#13,612 |
| 32. | Woodside East | 1.7% | 2.6%(-0.900)#32 | 3.1%(-1.40)#14,546 |
| 33. | Claymont | 1.6% | 2.6%(-1.00)#33 | 3.1%(-1.50)#14,795 |
| 34. | Selbyville | 1.5% | 2.6%(-1.10)#34 | 3.1%(-1.60)#15,209 |
| 35. | Magnolia | 1.4% | 2.6%(-1.20)#35 | 3.1%(-1.70)#15,719 |
| 36. | Wilmington Manor | 1.3% | 2.6%(-1.30)#36 | 3.1%(-1.80)#15,849 |
| 37. | Hockessin | 1.2% | 2.6%(-1.40)#37 | 3.1%(-1.90)#16,153 |
| 38. | Glasgow | 1.1% | 2.6%(-1.50)#38 | 3.1%(-2.00)#16,485 |
| 39. | Highland Acres | 1.1% | 2.6%(-1.50)#39 | 3.1%(-2.00)#16,594 |
| 40. | Lewes | 1.1% | 2.6%(-1.50)#40 | 3.1%(-2.00)#16,605 |
| 41. | Brookside | 0.90% | 2.6%(-1.70)#41 | 3.1%(-2.20)#17,191 |
| 42. | Townsend | 0.90% | 2.6%(-1.70)#42 | 3.1%(-2.20)#17,330 |
| 43. | Felton | 0.90% | 2.6%(-1.70)#43 | 3.1%(-2.20)#17,388 |
| 44. | South Bethany | 0.90% | 2.6%(-1.70)#44 | 3.1%(-2.20)#17,452 |
| 45. | Wyoming | 0.80% | 2.6%(-1.80)#45 | 3.1%(-2.30)#17,705 |
| 46. | North Star | 0.60% | 2.6%(-2.00)#46 | 3.1%(-2.50)#18,214 |
| 47. | Clayton | 0.60% | 2.6%(-2.00)#47 | 3.1%(-2.50)#18,275 |
| 48. | Bethany Beach | 0.60% | 2.6%(-2.00)#48 | 3.1%(-2.50)#18,368 |
| 49. | Houston | 0.60% | 2.6%(-2.00)#49 | 3.1%(-2.50)#18,403 |
| 50. | Delmar | 0.50% | 2.6%(-2.10)#50 | 3.1%(-2.60)#18,561 |
| 51. | New Castle | 0.40% | 2.6%(-2.20)#51 | 3.1%(-2.70)#18,720 |
| 52. | Frederica | 0.40% | 2.6%(-2.20)#52 | 3.1%(-2.70)#18,781 |
| 53. | Long Neck | 0.10% | 2.6%(-2.50)#53 | 3.1%(-3.00)#19,004 |
1
Common Questions
What are the Top 10 Cities with the Highest Percentage of Families with Income Below $10,000 in Delaware?
Top 10 Cities with the Highest Percentage of Families with Income Below $10,000 in Delaware are:
#1
17.1%
#2
15.3%
#3
11.9%
#4
10.7%
#5
8.4%
#6
7.8%
#7
7.8%
#8
7.4%
#9
7.4%
#10
7.2%
What city has the Highest Percentage of Families with Income Below $10,000 in Delaware?
Riverview has the Highest Percentage of Families with Income Below $10,000 in Delaware with 17.1%.
What is the Percentage of Families with Income Below $10,000 in the State of Delaware?
Percentage of Families with Income Below $10,000 in Delaware is 2.6%.
What is the Percentage of Families with Income Below $10,000 in the United States?
Percentage of Families with Income Below $10,000 in the United States is 3.1%.