Cities with the Highest Percentage of Families with Income Below $10,000 in North Dakota
RELATED REPORTS & OPTIONS
Family Income | $0-10k
North Dakota
Compare Cities
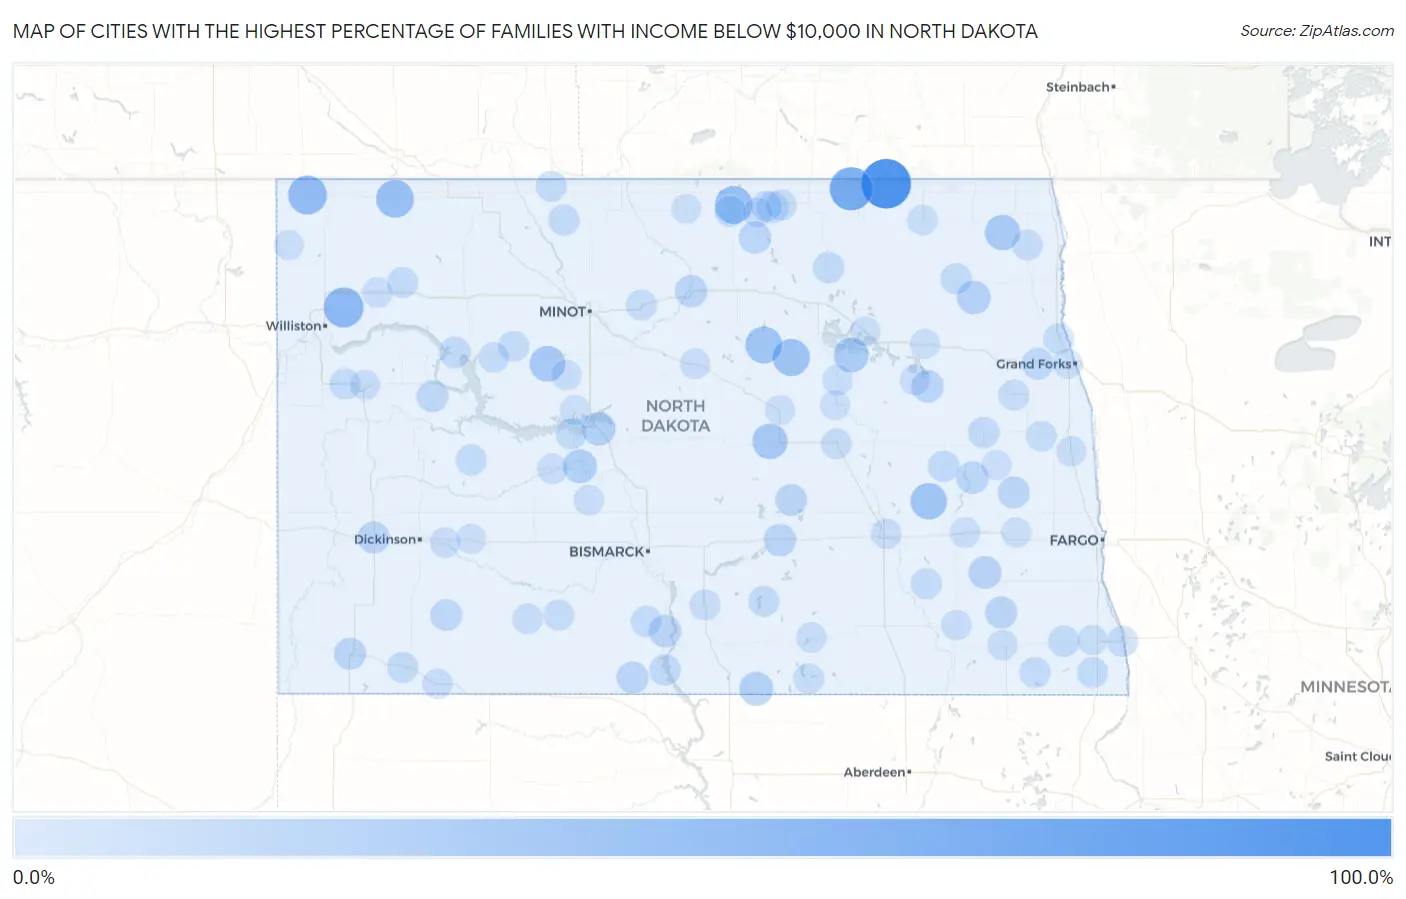
Map of Cities with the Highest Percentage of Families with Income Below $10,000 in North Dakota
0.0%
100.0%
Cities with the Highest Percentage of Families with Income Below $10,000 in North Dakota
| City | Families with Income < $10k | vs State | vs National | |
| 1. | Hannah | 100.0% | 2.0%(+98.0)#1 | 3.1%(+96.9)#37 |
| 2. | Sarles | 66.7% | 2.0%(+64.7)#2 | 3.1%(+63.6)#70 |
| 3. | Springbrook | 50.0% | 2.0%(+48.0)#3 | 3.1%(+46.9)#132 |
| 4. | Fortuna | 45.5% | 2.0%(+43.5)#4 | 3.1%(+42.4)#162 |
| 5. | Noonan | 40.0% | 2.0%(+38.0)#5 | 3.1%(+36.9)#211 |
| 6. | East Dunseith | 39.8% | 2.0%(+37.8)#6 | 3.1%(+36.7)#222 |
| 7. | Maddock | 35.9% | 2.0%(+33.9)#7 | 3.1%(+32.8)#279 |
| 8. | Esmond | 35.3% | 2.0%(+33.3)#8 | 3.1%(+32.2)#289 |
| 9. | Leal | 33.3% | 2.0%(+31.3)#9 | 3.1%(+30.2)#333 |
| 10. | Ryder | 29.0% | 2.0%(+27.0)#10 | 3.1%(+25.9)#433 |
| 11. | Bowdon | 27.7% | 2.0%(+25.7)#11 | 3.1%(+24.6)#484 |
| 12. | Canton City Hensel | 27.3% | 2.0%(+25.3)#12 | 3.1%(+24.2)#497 |
| 13. | Fort Totten | 25.4% | 2.0%(+23.4)#13 | 3.1%(+22.3)#571 |
| 14. | Zeeland | 21.1% | 2.0%(+19.1)#14 | 3.1%(+18.0)#818 |
| 15. | Stanton | 20.3% | 2.0%(+18.3)#15 | 3.1%(+17.2)#875 |
| 16. | Coleharbor | 20.0% | 2.0%(+18.0)#16 | 3.1%(+16.9)#905 |
| 17. | Lankin | 19.0% | 2.0%(+17.0)#17 | 3.1%(+15.9)#1,006 |
| 18. | Nome | 15.8% | 2.0%(+13.8)#18 | 3.1%(+12.7)#1,354 |
| 19. | Luverne | 14.3% | 2.0%(+12.3)#19 | 3.1%(+11.2)#1,623 |
| 20. | Cannon Ball | 13.7% | 2.0%(+11.7)#20 | 3.1%(+10.6)#1,723 |
| 21. | Towner | 13.6% | 2.0%(+11.6)#21 | 3.1%(+10.5)#1,751 |
| 22. | Tappen | 13.5% | 2.0%(+11.5)#22 | 3.1%(+10.4)#1,776 |
| 23. | Rolette | 13.3% | 2.0%(+11.3)#23 | 3.1%(+10.2)#1,816 |
| 24. | Pekin | 13.3% | 2.0%(+11.3)#24 | 3.1%(+10.2)#1,825 |
| 25. | Lisbon | 12.7% | 2.0%(+10.7)#25 | 3.1%(+9.60)#1,943 |
| 26. | Belfield | 12.0% | 2.0%(+10.00)#26 | 3.1%(+8.90)#2,136 |
| 27. | Bowman | 11.8% | 2.0%(+9.80)#27 | 3.1%(+8.70)#2,184 |
| 28. | Pettibone | 11.8% | 2.0%(+9.80)#28 | 3.1%(+8.70)#2,208 |
| 29. | Page | 11.6% | 2.0%(+9.60)#29 | 3.1%(+8.50)#2,265 |
| 30. | Selfridge | 11.5% | 2.0%(+9.50)#30 | 3.1%(+8.40)#2,302 |
| 31. | Emerado | 11.1% | 2.0%(+9.10)#31 | 3.1%(+8.00)#2,432 |
| 32. | Mandaree | 10.4% | 2.0%(+8.40)#32 | 3.1%(+7.30)#2,684 |
| 33. | Regent | 10.3% | 2.0%(+8.30)#33 | 3.1%(+7.20)#2,738 |
| 34. | Fort Yates | 9.1% | 2.0%(+7.10)#34 | 3.1%(+6.00)#3,322 |
| 35. | Hannaford | 9.1% | 2.0%(+7.10)#35 | 3.1%(+6.00)#3,326 |
| 36. | New Town | 9.0% | 2.0%(+7.00)#36 | 3.1%(+5.90)#3,355 |
| 37. | Finley | 9.0% | 2.0%(+7.00)#37 | 3.1%(+5.90)#3,382 |
| 38. | Green Acres | 8.8% | 2.0%(+6.80)#38 | 3.1%(+5.70)#3,467 |
| 39. | Cando | 8.7% | 2.0%(+6.70)#39 | 3.1%(+5.60)#3,519 |
| 40. | Adams | 8.3% | 2.0%(+6.30)#40 | 3.1%(+5.20)#3,755 |
| 41. | Wyndmere | 8.2% | 2.0%(+6.20)#41 | 3.1%(+5.10)#3,809 |
| 42. | Halliday | 7.9% | 2.0%(+5.90)#42 | 3.1%(+4.80)#3,997 |
| 43. | Arnegard | 7.7% | 2.0%(+5.70)#43 | 3.1%(+4.60)#4,137 |
| 44. | Reeder | 7.7% | 2.0%(+5.70)#44 | 3.1%(+4.60)#4,144 |
| 45. | Cayuga | 7.7% | 2.0%(+5.70)#45 | 3.1%(+4.60)#4,147 |
| 46. | Mohall | 7.6% | 2.0%(+5.60)#46 | 3.1%(+4.50)#4,196 |
| 47. | Marion | 7.1% | 2.0%(+5.10)#47 | 3.1%(+4.00)#4,592 |
| 48. | Solen | 7.1% | 2.0%(+5.10)#48 | 3.1%(+4.00)#4,595 |
| 49. | Tioga | 6.9% | 2.0%(+4.90)#49 | 3.1%(+3.80)#4,738 |
| 50. | Pick City | 6.9% | 2.0%(+4.90)#50 | 3.1%(+3.80)#4,779 |
| 51. | Hankinson | 6.8% | 2.0%(+4.80)#51 | 3.1%(+3.70)#4,833 |
| 52. | Sherwood | 6.8% | 2.0%(+4.80)#52 | 3.1%(+3.70)#4,858 |
| 53. | Dunseith | 6.6% | 2.0%(+4.60)#53 | 3.1%(+3.50)#5,018 |
| 54. | Napoleon | 6.6% | 2.0%(+4.60)#54 | 3.1%(+3.50)#5,021 |
| 55. | Wahpeton | 6.5% | 2.0%(+4.50)#55 | 3.1%(+3.40)#5,065 |
| 56. | Hazelton | 6.3% | 2.0%(+4.30)#56 | 3.1%(+3.20)#5,348 |
| 57. | Rolla | 6.2% | 2.0%(+4.20)#57 | 3.1%(+3.10)#5,444 |
| 58. | Northwood | 6.2% | 2.0%(+4.20)#58 | 3.1%(+3.10)#5,450 |
| 59. | Ashley | 6.0% | 2.0%(+4.00)#59 | 3.1%(+2.90)#5,671 |
| 60. | Carson | 6.0% | 2.0%(+4.00)#60 | 3.1%(+2.90)#5,695 |
| 61. | Plaza | 6.0% | 2.0%(+4.00)#61 | 3.1%(+2.90)#5,702 |
| 62. | Belcourt | 5.9% | 2.0%(+3.90)#62 | 3.1%(+2.80)#5,773 |
| 63. | Granville | 5.9% | 2.0%(+3.90)#63 | 3.1%(+2.80)#5,808 |
| 64. | St Thomas | 5.6% | 2.0%(+3.60)#64 | 3.1%(+2.50)#6,182 |
| 65. | Elgin | 5.3% | 2.0%(+3.30)#65 | 3.1%(+2.20)#6,550 |
| 66. | Carrington | 5.1% | 2.0%(+3.10)#66 | 3.1%(+2.00)#6,785 |
| 67. | Mayville | 5.1% | 2.0%(+3.10)#67 | 3.1%(+2.00)#6,787 |
| 68. | Parshall | 5.0% | 2.0%(+3.00)#68 | 3.1%(+1.90)#6,970 |
| 69. | Manvel | 4.9% | 2.0%(+2.90)#69 | 3.1%(+1.80)#7,168 |
| 70. | Trenton | 4.8% | 2.0%(+2.80)#70 | 3.1%(+1.70)#7,300 |
| 71. | Hazen | 4.5% | 2.0%(+2.50)#71 | 3.1%(+1.40)#7,696 |
| 72. | Langdon | 4.5% | 2.0%(+2.50)#72 | 3.1%(+1.40)#7,714 |
| 73. | Gladstone | 4.5% | 2.0%(+2.50)#73 | 3.1%(+1.40)#7,795 |
| 74. | Tolna | 4.5% | 2.0%(+2.50)#74 | 3.1%(+1.40)#7,798 |
| 75. | Verona | 4.5% | 2.0%(+2.50)#75 | 3.1%(+1.40)#7,800 |
| 76. | Center | 4.3% | 2.0%(+2.30)#76 | 3.1%(+1.20)#8,109 |
| 77. | Drake | 4.3% | 2.0%(+2.30)#77 | 3.1%(+1.20)#8,132 |
| 78. | Sheyenne | 4.3% | 2.0%(+2.30)#78 | 3.1%(+1.20)#8,142 |
| 79. | Lehr | 4.2% | 2.0%(+2.20)#79 | 3.1%(+1.10)#8,334 |
| 80. | Jamestown | 4.1% | 2.0%(+2.10)#80 | 3.1%(+1.000)#8,367 |
| 81. | Valley City | 4.0% | 2.0%(+2.00)#81 | 3.1%(+0.900)#8,605 |
| 82. | Hettinger | 3.9% | 2.0%(+1.90)#82 | 3.1%(+0.800)#8,853 |
| 83. | Ray | 3.8% | 2.0%(+1.80)#83 | 3.1%(+0.700)#9,077 |
| 84. | Douglas | 3.7% | 2.0%(+1.70)#84 | 3.1%(+0.600)#9,311 |
| 85. | Gwinner | 3.5% | 2.0%(+1.50)#85 | 3.1%(+0.400)#9,692 |
| 86. | Watford City | 3.4% | 2.0%(+1.40)#86 | 3.1%(+0.300)#9,803 |
| 87. | Hillsboro | 3.4% | 2.0%(+1.40)#87 | 3.1%(+0.300)#9,856 |
| 88. | Mooreton | 3.3% | 2.0%(+1.30)#88 | 3.1%(+0.200)#10,174 |
| 89. | Buffalo | 3.2% | 2.0%(+1.20)#89 | 3.1%(+0.100)#10,423 |
| 90. | Grenora | 3.1% | 2.0%(+1.10)#90 | 3.1%(=0.000)#10,641 |
| 91. | Grand Forks | 2.8% | 2.0%(+0.800)#91 | 3.1%(-0.300)#11,179 |
| 92. | Garrison | 2.8% | 2.0%(+0.800)#92 | 3.1%(-0.300)#11,325 |
| 93. | Hope | 2.8% | 2.0%(+0.800)#93 | 3.1%(-0.300)#11,401 |
| 94. | New Rockford | 2.7% | 2.0%(+0.700)#94 | 3.1%(-0.400)#11,583 |
| 95. | Devils Lake | 2.6% | 2.0%(+0.600)#95 | 3.1%(-0.500)#11,746 |
| 96. | Lakota | 2.6% | 2.0%(+0.600)#96 | 3.1%(-0.500)#11,881 |
| 97. | Shell Valley | 2.5% | 2.0%(+0.500)#97 | 3.1%(-0.600)#12,136 |
| 98. | Richardton | 2.5% | 2.0%(+0.500)#98 | 3.1%(-0.600)#12,159 |
| 99. | Bottineau | 2.4% | 2.0%(+0.400)#99 | 3.1%(-0.700)#12,395 |
| 100. | Fessenden | 2.4% | 2.0%(+0.400)#100 | 3.1%(-0.700)#12,478 |
Common Questions
What are the Top 10 Cities with the Highest Percentage of Families with Income Below $10,000 in North Dakota?
Top 10 Cities with the Highest Percentage of Families with Income Below $10,000 in North Dakota are:
#1
100.0%
#2
66.7%
#3
50.0%
#4
45.5%
#5
40.0%
#6
39.8%
#7
35.9%
#8
35.3%
#9
33.3%
#10
29.0%
What city has the Highest Percentage of Families with Income Below $10,000 in North Dakota?
Hannah has the Highest Percentage of Families with Income Below $10,000 in North Dakota with 100.0%.
What is the Percentage of Families with Income Below $10,000 in the State of North Dakota?
Percentage of Families with Income Below $10,000 in North Dakota is 2.0%.
What is the Percentage of Families with Income Below $10,000 in the United States?
Percentage of Families with Income Below $10,000 in the United States is 3.1%.