Cities with the Highest Percentage of Families with Income Below $10,000 in Massachusetts
RELATED REPORTS & OPTIONS
Family Income | $0-10k
Massachusetts
Compare Cities
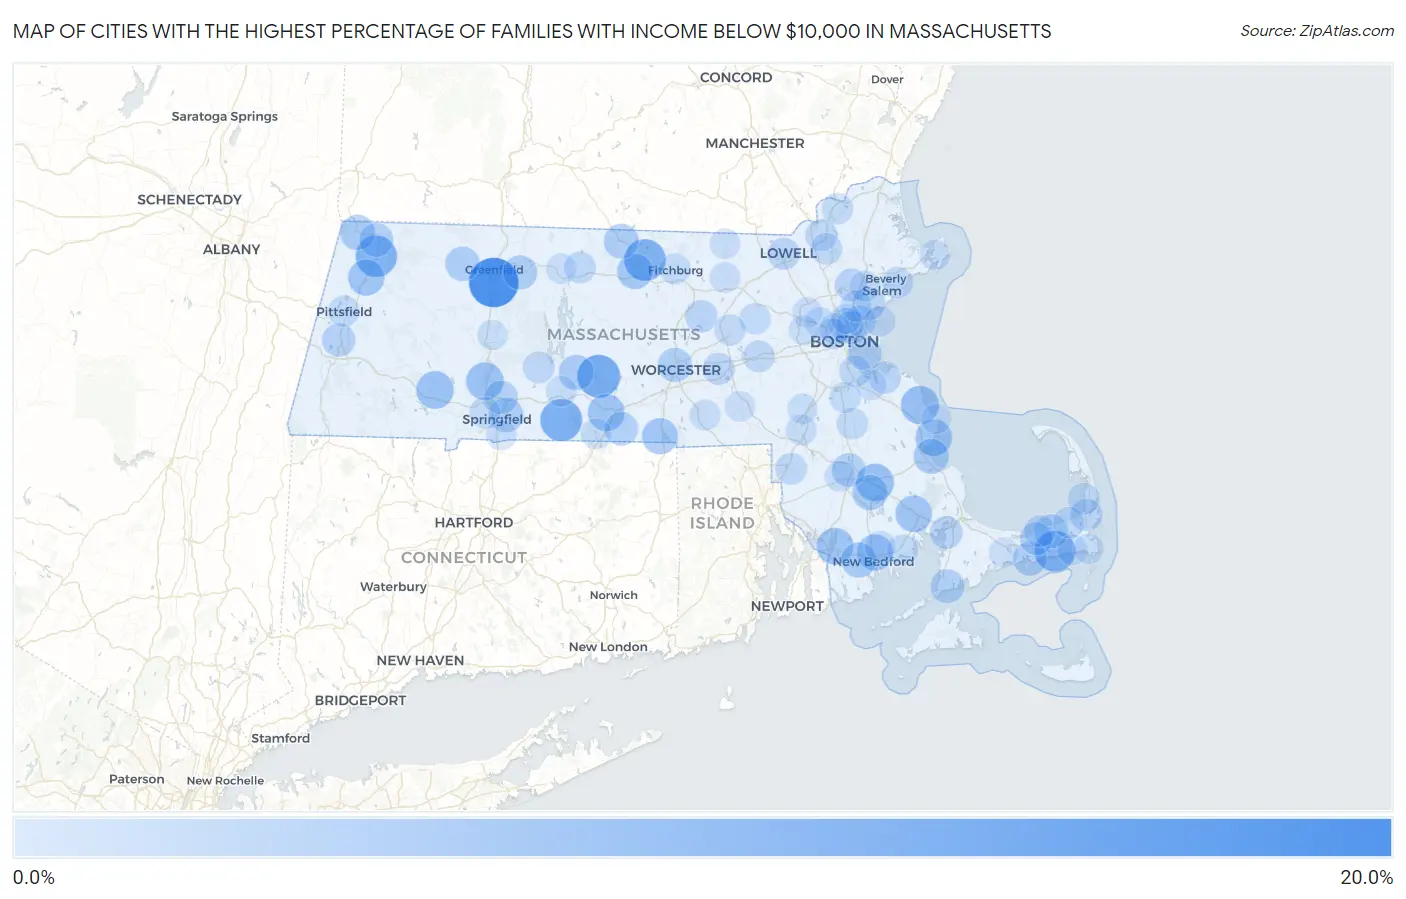
Map of Cities with the Highest Percentage of Families with Income Below $10,000 in Massachusetts
0.0%
20.0%
Cities with the Highest Percentage of Families with Income Below $10,000 in Massachusetts
| City | Families with Income < $10k | vs State | vs National | |
| 1. | Deerfield | 18.7% | 2.4%(+16.3)#1 | 3.1%(+15.6)#1,033 |
| 2. | West Brookfield | 12.8% | 2.4%(+10.4)#2 | 3.1%(+9.70)#1,914 |
| 3. | Monson Center | 12.0% | 2.4%(+9.60)#3 | 3.1%(+8.90)#2,130 |
| 4. | South Ashburnham | 11.7% | 2.4%(+9.30)#4 | 3.1%(+8.60)#2,224 |
| 5. | Adams | 11.5% | 2.4%(+9.10)#5 | 3.1%(+8.40)#2,273 |
| 6. | Dennis Port | 11.1% | 2.4%(+8.70)#6 | 3.1%(+8.00)#2,414 |
| 7. | Oak Bluffs | 10.0% | 2.4%(+7.60)#7 | 3.1%(+6.90)#2,840 |
| 8. | Marshfield Hills | 8.7% | 2.4%(+6.30)#8 | 3.1%(+5.60)#3,510 |
| 9. | Middleborough Center | 8.4% | 2.4%(+6.00)#9 | 3.1%(+5.30)#3,657 |
| 10. | Holyoke | 8.2% | 2.4%(+5.80)#10 | 3.1%(+5.10)#3,762 |
| 11. | Russell | 8.2% | 2.4%(+5.80)#11 | 3.1%(+5.10)#3,805 |
| 12. | Fall River | 7.6% | 2.4%(+5.20)#12 | 3.1%(+4.50)#4,151 |
| 13. | Fiskdale | 7.6% | 2.4%(+5.20)#13 | 3.1%(+4.50)#4,171 |
| 14. | Duxbury | 7.5% | 2.4%(+5.10)#14 | 3.1%(+4.40)#4,237 |
| 15. | West Wareham | 7.3% | 2.4%(+4.90)#15 | 3.1%(+4.20)#4,391 |
| 16. | Cheshire | 7.1% | 2.4%(+4.70)#16 | 3.1%(+4.00)#4,568 |
| 17. | New Bedford | 7.0% | 2.4%(+4.60)#17 | 3.1%(+3.90)#4,604 |
| 18. | Webster | 6.9% | 2.4%(+4.50)#18 | 3.1%(+3.80)#4,707 |
| 19. | Gardner | 6.6% | 2.4%(+4.20)#19 | 3.1%(+3.50)#4,963 |
| 20. | Smith Mills | 6.2% | 2.4%(+3.80)#20 | 3.1%(+3.10)#5,406 |
| 21. | North Lakeville | 6.2% | 2.4%(+3.80)#21 | 3.1%(+3.10)#5,411 |
| 22. | Ware | 6.1% | 2.4%(+3.70)#22 | 3.1%(+3.00)#5,504 |
| 23. | Williamstown | 6.1% | 2.4%(+3.70)#23 | 3.1%(+3.00)#5,515 |
| 24. | North Plymouth | 6.1% | 2.4%(+3.70)#24 | 3.1%(+3.00)#5,516 |
| 25. | Winchendon | 5.9% | 2.4%(+3.50)#25 | 3.1%(+2.80)#5,751 |
| 26. | Springfield | 5.5% | 2.4%(+3.10)#26 | 3.1%(+2.40)#6,202 |
| 27. | Shelburne Falls | 5.5% | 2.4%(+3.10)#27 | 3.1%(+2.40)#6,274 |
| 28. | Millers Falls | 5.4% | 2.4%(+3.00)#28 | 3.1%(+2.30)#6,407 |
| 29. | Worcester | 5.3% | 2.4%(+2.90)#29 | 3.1%(+2.20)#6,445 |
| 30. | West Yarmouth | 5.2% | 2.4%(+2.80)#30 | 3.1%(+2.10)#6,657 |
| 31. | North Adams | 5.1% | 2.4%(+2.70)#31 | 3.1%(+2.00)#6,744 |
| 32. | East Dennis | 5.1% | 2.4%(+2.70)#32 | 3.1%(+2.00)#6,766 |
| 33. | Falmouth | 5.0% | 2.4%(+2.60)#33 | 3.1%(+1.90)#6,932 |
| 34. | Southbridge Town | 4.9% | 2.4%(+2.50)#34 | 3.1%(+1.80)#7,059 |
| 35. | Raynham Center | 4.9% | 2.4%(+2.50)#35 | 3.1%(+1.80)#7,092 |
| 36. | Everett | 4.8% | 2.4%(+2.40)#36 | 3.1%(+1.70)#7,204 |
| 37. | Boston | 4.7% | 2.4%(+2.30)#37 | 3.1%(+1.60)#7,335 |
| 38. | Chicopee | 4.6% | 2.4%(+2.20)#38 | 3.1%(+1.50)#7,493 |
| 39. | Lenox | 4.6% | 2.4%(+2.20)#39 | 3.1%(+1.50)#7,569 |
| 40. | Yarmouth Port | 4.3% | 2.4%(+1.90)#40 | 3.1%(+1.20)#8,014 |
| 41. | Chelsea | 4.1% | 2.4%(+1.70)#41 | 3.1%(+1.000)#8,349 |
| 42. | Lynn | 4.0% | 2.4%(+1.60)#42 | 3.1%(+0.900)#8,541 |
| 43. | Lynnfield | 4.0% | 2.4%(+1.60)#43 | 3.1%(+0.900)#8,585 |
| 44. | Bourne | 4.0% | 2.4%(+1.60)#44 | 3.1%(+0.900)#8,645 |
| 45. | South Lancaster | 3.8% | 2.4%(+1.40)#45 | 3.1%(+0.700)#9,036 |
| 46. | Lowell | 3.6% | 2.4%(+1.20)#46 | 3.1%(+0.500)#9,320 |
| 47. | Hingham | 3.6% | 2.4%(+1.20)#47 | 3.1%(+0.500)#9,385 |
| 48. | Westborough | 3.5% | 2.4%(+1.10)#48 | 3.1%(+0.400)#9,611 |
| 49. | Orleans | 3.5% | 2.4%(+1.10)#49 | 3.1%(+0.400)#9,661 |
| 50. | Lawrence | 3.4% | 2.4%(+1.00)#50 | 3.1%(+0.300)#9,736 |
| 51. | Attleboro | 3.3% | 2.4%(+0.900)#51 | 3.1%(+0.200)#9,966 |
| 52. | Athol | 3.3% | 2.4%(+0.900)#52 | 3.1%(+0.200)#10,016 |
| 53. | Belchertown | 3.3% | 2.4%(+0.900)#53 | 3.1%(+0.200)#10,057 |
| 54. | North Eastham | 3.3% | 2.4%(+0.900)#54 | 3.1%(+0.200)#10,073 |
| 55. | Quincy | 3.2% | 2.4%(+0.800)#55 | 3.1%(+0.100)#10,190 |
| 56. | Framingham | 3.2% | 2.4%(+0.800)#56 | 3.1%(+0.100)#10,197 |
| 57. | Revere | 3.2% | 2.4%(+0.800)#57 | 3.1%(+0.100)#10,199 |
| 58. | Andover | 3.2% | 2.4%(+0.800)#58 | 3.1%(+0.100)#10,261 |
| 59. | Dennis | 3.2% | 2.4%(+0.800)#59 | 3.1%(+0.100)#10,332 |
| 60. | Brockton | 3.1% | 2.4%(+0.700)#60 | 3.1%(=0.000)#10,432 |
| 61. | Beverly | 3.1% | 2.4%(+0.700)#61 | 3.1%(=0.000)#10,452 |
| 62. | Maynard | 3.0% | 2.4%(+0.600)#62 | 3.1%(-0.100)#10,724 |
| 63. | Haverhill | 2.9% | 2.4%(+0.500)#63 | 3.1%(-0.200)#10,899 |
| 64. | Pittsfield | 2.9% | 2.4%(+0.500)#64 | 3.1%(-0.200)#10,909 |
| 65. | West Springfield Town | 2.9% | 2.4%(+0.500)#65 | 3.1%(-0.200)#10,919 |
| 66. | Saugus | 2.9% | 2.4%(+0.500)#66 | 3.1%(-0.200)#10,920 |
| 67. | Hudson | 2.9% | 2.4%(+0.500)#67 | 3.1%(-0.200)#10,941 |
| 68. | Brewster | 2.9% | 2.4%(+0.500)#68 | 3.1%(-0.200)#11,054 |
| 69. | Randolph Town | 2.7% | 2.4%(+0.300)#69 | 3.1%(-0.400)#11,450 |
| 70. | Fitchburg | 2.6% | 2.4%(+0.200)#70 | 3.1%(-0.500)#11,682 |
| 71. | Mattapoisett Center | 2.6% | 2.4%(+0.200)#71 | 3.1%(-0.500)#11,797 |
| 72. | Somerville | 2.5% | 2.4%(+0.100)#72 | 3.1%(-0.600)#11,959 |
| 73. | Peabody | 2.5% | 2.4%(+0.100)#73 | 3.1%(-0.600)#11,965 |
| 74. | Whitinsville | 2.5% | 2.4%(+0.100)#74 | 3.1%(-0.600)#12,048 |
| 75. | Acushnet Center | 2.5% | 2.4%(+0.100)#75 | 3.1%(-0.600)#12,086 |
| 76. | Holland | 2.5% | 2.4%(+0.100)#76 | 3.1%(-0.600)#12,126 |
| 77. | Cambridge | 2.4% | 2.4%(=0.000)#77 | 3.1%(-0.700)#12,222 |
| 78. | Taunton | 2.4% | 2.4%(=0.000)#78 | 3.1%(-0.700)#12,231 |
| 79. | Arlington | 2.4% | 2.4%(=0.000)#79 | 3.1%(-0.700)#12,236 |
| 80. | Gloucester | 2.4% | 2.4%(=0.000)#80 | 3.1%(-0.700)#12,246 |
| 81. | Palmer Town | 2.4% | 2.4%(=0.000)#81 | 3.1%(-0.700)#12,289 |
| 82. | Foxborough | 2.4% | 2.4%(=0.000)#82 | 3.1%(-0.700)#12,338 |
| 83. | Nahant | 2.4% | 2.4%(=0.000)#83 | 3.1%(-0.700)#12,368 |
| 84. | Weymouth Town | 2.3% | 2.4%(-0.100)#84 | 3.1%(-0.800)#12,544 |
| 85. | Amherst | 2.3% | 2.4%(-0.100)#85 | 3.1%(-0.800)#12,554 |
| 86. | Milford | 2.3% | 2.4%(-0.100)#86 | 3.1%(-0.800)#12,562 |
| 87. | Greenfield | 2.3% | 2.4%(-0.100)#87 | 3.1%(-0.800)#12,584 |
| 88. | Orange | 2.3% | 2.4%(-0.100)#88 | 3.1%(-0.800)#12,670 |
| 89. | Ayer | 2.3% | 2.4%(-0.100)#89 | 3.1%(-0.800)#12,685 |
| 90. | Pepperell | 2.3% | 2.4%(-0.100)#90 | 3.1%(-0.800)#12,703 |
| 91. | Harwich Port | 2.2% | 2.4%(-0.200)#91 | 3.1%(-0.900)#12,999 |
| 92. | Lexington | 2.1% | 2.4%(-0.300)#92 | 3.1%(-1.000)#13,163 |
| 93. | Longmeadow | 2.1% | 2.4%(-0.300)#93 | 3.1%(-1.000)#13,200 |
| 94. | Walpole | 2.1% | 2.4%(-0.300)#94 | 3.1%(-1.000)#13,242 |
| 95. | Hatfield | 2.1% | 2.4%(-0.300)#95 | 3.1%(-1.000)#13,347 |
| 96. | Malden | 2.0% | 2.4%(-0.400)#96 | 3.1%(-1.10)#13,448 |
| 97. | West Chatham | 2.0% | 2.4%(-0.400)#97 | 3.1%(-1.10)#13,630 |
| 98. | Waltham | 1.9% | 2.4%(-0.500)#98 | 3.1%(-1.20)#13,772 |
| 99. | Barnstable Town | 1.9% | 2.4%(-0.500)#99 | 3.1%(-1.20)#13,777 |
| 100. | Ocean Bluff Brant Rock | 1.9% | 2.4%(-0.500)#100 | 3.1%(-1.20)#13,883 |
Common Questions
What are the Top 10 Cities with the Highest Percentage of Families with Income Below $10,000 in Massachusetts?
Top 10 Cities with the Highest Percentage of Families with Income Below $10,000 in Massachusetts are:
#1
18.7%
#2
12.8%
#3
12.0%
#4
11.7%
#5
11.5%
#6
11.1%
#7
8.7%
#8
8.4%
#9
8.2%
#10
8.2%
What city has the Highest Percentage of Families with Income Below $10,000 in Massachusetts?
Deerfield has the Highest Percentage of Families with Income Below $10,000 in Massachusetts with 18.7%.
What is the Percentage of Families with Income Below $10,000 in the State of Massachusetts?
Percentage of Families with Income Below $10,000 in Massachusetts is 2.4%.
What is the Percentage of Families with Income Below $10,000 in the United States?
Percentage of Families with Income Below $10,000 in the United States is 3.1%.