Cities with the Highest Percentage of Families with Income Below $10,000 in Idaho
RELATED REPORTS & OPTIONS
Family Income | $0-10k
Idaho
Compare Cities
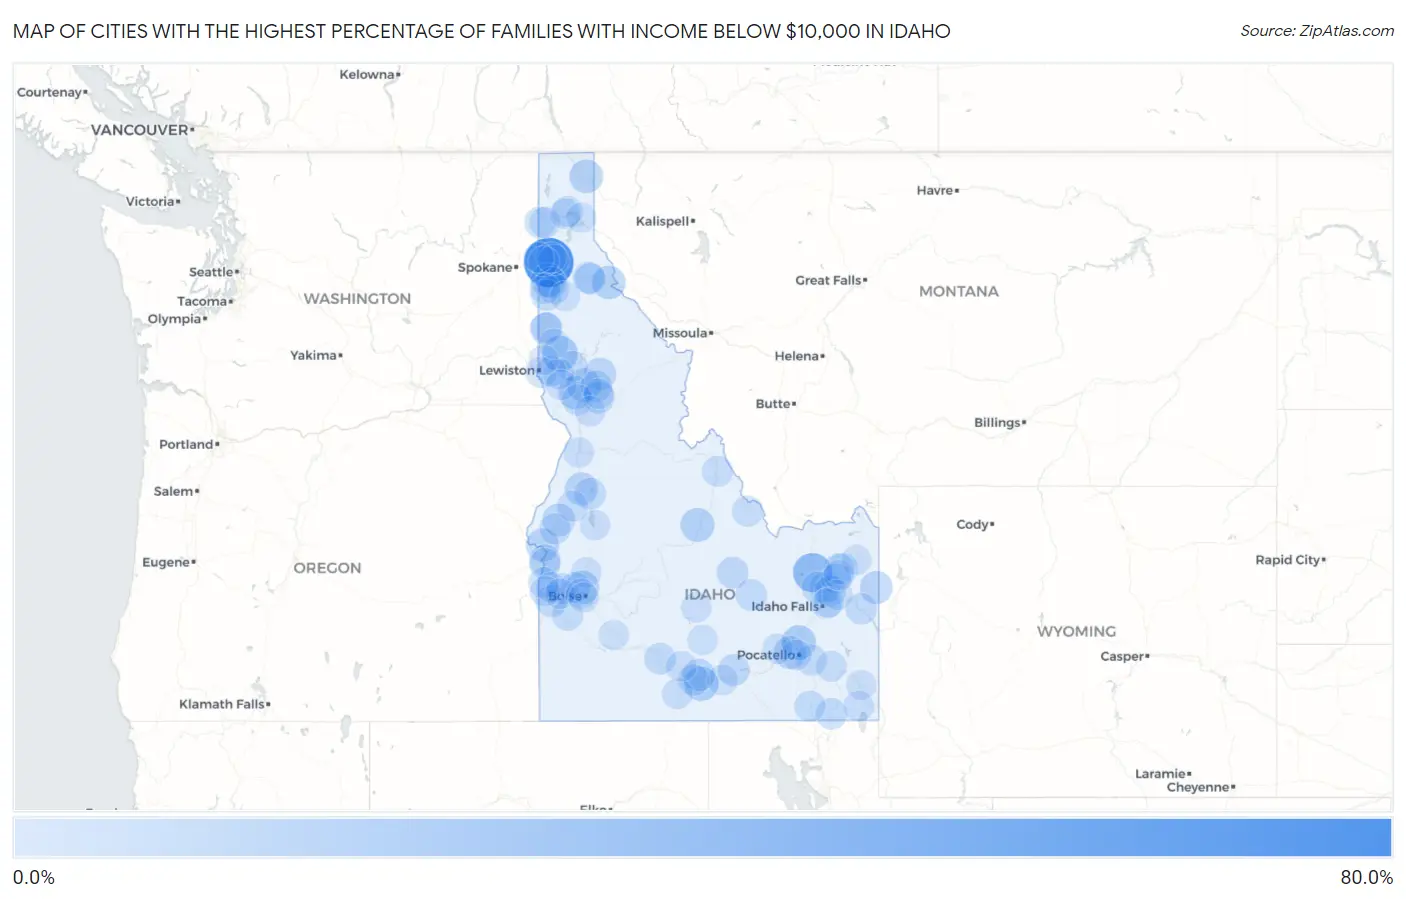
Map of Cities with the Highest Percentage of Families with Income Below $10,000 in Idaho
0.0%
80.0%
Cities with the Highest Percentage of Families with Income Below $10,000 in Idaho
| City | Families with Income < $10k | vs State | vs National | |
| 1. | Huetter | 64.3% | 2.2%(+62.1)#1 | 3.1%(+61.2)#75 |
| 2. | Hamer | 30.0% | 2.2%(+27.8)#2 | 3.1%(+26.9)#412 |
| 3. | Kendrick | 19.4% | 2.2%(+17.2)#3 | 3.1%(+16.3)#962 |
| 4. | Fort Hall | 15.3% | 2.2%(+13.1)#4 | 3.1%(+12.2)#1,425 |
| 5. | Murtaugh | 14.9% | 2.2%(+12.7)#5 | 3.1%(+11.8)#1,489 |
| 6. | Challis | 13.6% | 2.2%(+11.4)#6 | 3.1%(+10.5)#1,744 |
| 7. | Moyie Springs | 13.1% | 2.2%(+10.9)#7 | 3.1%(+10.00)#1,858 |
| 8. | Hidden Springs | 12.8% | 2.2%(+10.6)#8 | 3.1%(+9.70)#1,911 |
| 9. | Nezperce | 12.8% | 2.2%(+10.6)#9 | 3.1%(+9.70)#1,923 |
| 10. | Rockford Bay | 12.8% | 2.2%(+10.6)#10 | 3.1%(+9.70)#1,926 |
| 11. | Mullan | 12.3% | 2.2%(+10.1)#11 | 3.1%(+9.20)#2,052 |
| 12. | Ferdinand | 11.3% | 2.2%(+9.10)#12 | 3.1%(+8.20)#2,376 |
| 13. | Weiser | 11.2% | 2.2%(+9.00)#13 | 3.1%(+8.10)#2,383 |
| 14. | Arbon Valley | 11.0% | 2.2%(+8.80)#14 | 3.1%(+7.90)#2,473 |
| 15. | Driggs | 10.5% | 2.2%(+8.30)#15 | 3.1%(+7.40)#2,641 |
| 16. | New Meadows | 10.4% | 2.2%(+8.20)#16 | 3.1%(+7.30)#2,694 |
| 17. | Cambridge | 10.0% | 2.2%(+7.80)#17 | 3.1%(+6.90)#2,863 |
| 18. | Eden | 9.5% | 2.2%(+7.30)#18 | 3.1%(+6.40)#3,103 |
| 19. | Potlatch | 8.7% | 2.2%(+6.50)#19 | 3.1%(+5.60)#3,524 |
| 20. | Weippe | 8.4% | 2.2%(+6.20)#20 | 3.1%(+5.30)#3,695 |
| 21. | Stites | 7.9% | 2.2%(+5.70)#21 | 3.1%(+4.80)#4,003 |
| 22. | Acequia | 7.7% | 2.2%(+5.50)#22 | 3.1%(+4.60)#4,136 |
| 23. | Mackay | 7.1% | 2.2%(+4.90)#23 | 3.1%(+4.00)#4,566 |
| 24. | Kamiah | 7.0% | 2.2%(+4.80)#24 | 3.1%(+3.90)#4,652 |
| 25. | Mccall | 6.9% | 2.2%(+4.70)#25 | 3.1%(+3.80)#4,716 |
| 26. | Hagerman | 6.8% | 2.2%(+4.60)#26 | 3.1%(+3.70)#4,824 |
| 27. | Menan | 6.8% | 2.2%(+4.60)#27 | 3.1%(+3.70)#4,834 |
| 28. | Arco | 6.8% | 2.2%(+4.60)#28 | 3.1%(+3.70)#4,835 |
| 29. | Roberts | 6.8% | 2.2%(+4.60)#29 | 3.1%(+3.70)#4,848 |
| 30. | St Anthony | 6.3% | 2.2%(+4.10)#30 | 3.1%(+3.20)#5,280 |
| 31. | Kellogg | 6.3% | 2.2%(+4.10)#31 | 3.1%(+3.20)#5,289 |
| 32. | Swan Valley | 6.3% | 2.2%(+4.10)#32 | 3.1%(+3.20)#5,343 |
| 33. | Marsing | 6.2% | 2.2%(+4.00)#33 | 3.1%(+3.10)#5,443 |
| 34. | Oldtown | 6.2% | 2.2%(+4.00)#34 | 3.1%(+3.10)#5,460 |
| 35. | Wardner | 6.2% | 2.2%(+4.00)#35 | 3.1%(+3.10)#5,468 |
| 36. | Preston | 6.1% | 2.2%(+3.90)#36 | 3.1%(+3.00)#5,508 |
| 37. | Melba | 5.7% | 2.2%(+3.50)#37 | 3.1%(+2.60)#6,036 |
| 38. | Rigby | 5.6% | 2.2%(+3.40)#38 | 3.1%(+2.50)#6,101 |
| 39. | Payette | 5.4% | 2.2%(+3.20)#39 | 3.1%(+2.30)#6,356 |
| 40. | Inkom | 5.3% | 2.2%(+3.10)#40 | 3.1%(+2.20)#6,537 |
| 41. | Harrison | 5.3% | 2.2%(+3.10)#41 | 3.1%(+2.20)#6,588 |
| 42. | Midvale | 5.3% | 2.2%(+3.10)#42 | 3.1%(+2.20)#6,589 |
| 43. | Fruitland | 5.2% | 2.2%(+3.00)#43 | 3.1%(+2.10)#6,656 |
| 44. | Plummer | 5.2% | 2.2%(+3.00)#44 | 3.1%(+2.10)#6,696 |
| 45. | Middleton | 5.0% | 2.2%(+2.80)#45 | 3.1%(+1.90)#6,908 |
| 46. | Malad City | 5.0% | 2.2%(+2.80)#46 | 3.1%(+1.90)#6,950 |
| 47. | Hansen | 5.0% | 2.2%(+2.80)#47 | 3.1%(+1.90)#6,962 |
| 48. | Cottonwood | 5.0% | 2.2%(+2.80)#48 | 3.1%(+1.90)#6,969 |
| 49. | Priest River | 4.9% | 2.2%(+2.70)#49 | 3.1%(+1.80)#7,126 |
| 50. | Parma | 4.9% | 2.2%(+2.70)#50 | 3.1%(+1.80)#7,132 |
| 51. | Salmon | 4.8% | 2.2%(+2.60)#51 | 3.1%(+1.70)#7,253 |
| 52. | Leadore | 4.8% | 2.2%(+2.60)#52 | 3.1%(+1.70)#7,326 |
| 53. | Council | 4.7% | 2.2%(+2.50)#53 | 3.1%(+1.60)#7,460 |
| 54. | Conkling Park | 4.7% | 2.2%(+2.50)#54 | 3.1%(+1.60)#7,484 |
| 55. | Parker | 4.5% | 2.2%(+2.30)#55 | 3.1%(+1.40)#7,761 |
| 56. | Lewiston | 4.4% | 2.2%(+2.20)#56 | 3.1%(+1.30)#7,823 |
| 57. | Bancroft | 4.4% | 2.2%(+2.20)#57 | 3.1%(+1.30)#7,945 |
| 58. | Peck | 4.3% | 2.2%(+2.10)#58 | 3.1%(+1.20)#8,158 |
| 59. | Kootenai | 4.1% | 2.2%(+1.90)#59 | 3.1%(+1.000)#8,469 |
| 60. | Culdesac | 4.0% | 2.2%(+1.80)#60 | 3.1%(+0.900)#8,700 |
| 61. | Hollister | 4.0% | 2.2%(+1.80)#61 | 3.1%(+0.900)#8,703 |
| 62. | Jerome | 3.8% | 2.2%(+1.60)#62 | 3.1%(+0.700)#8,953 |
| 63. | Notus | 3.8% | 2.2%(+1.60)#63 | 3.1%(+0.700)#9,087 |
| 64. | Onaway | 3.8% | 2.2%(+1.60)#64 | 3.1%(+0.700)#9,114 |
| 65. | Bloomington | 3.8% | 2.2%(+1.60)#65 | 3.1%(+0.700)#9,119 |
| 66. | Eagle | 3.7% | 2.2%(+1.50)#66 | 3.1%(+0.600)#9,141 |
| 67. | Burley | 3.7% | 2.2%(+1.50)#67 | 3.1%(+0.600)#9,161 |
| 68. | Sandpoint | 3.7% | 2.2%(+1.50)#68 | 3.1%(+0.600)#9,171 |
| 69. | Rexburg | 3.6% | 2.2%(+1.40)#69 | 3.1%(+0.500)#9,330 |
| 70. | Lapwai | 3.5% | 2.2%(+1.30)#70 | 3.1%(+0.400)#9,678 |
| 71. | Winchester | 3.5% | 2.2%(+1.30)#71 | 3.1%(+0.400)#9,727 |
| 72. | Dalton Gardens | 3.4% | 2.2%(+1.20)#72 | 3.1%(+0.300)#9,837 |
| 73. | Richfield | 3.4% | 2.2%(+1.20)#73 | 3.1%(+0.300)#9,919 |
| 74. | Bellevue | 3.3% | 2.2%(+1.10)#74 | 3.1%(+0.200)#10,063 |
| 75. | Cascade | 3.3% | 2.2%(+1.10)#75 | 3.1%(+0.200)#10,093 |
| 76. | Grangeville | 3.2% | 2.2%(+1.000)#76 | 3.1%(+0.100)#10,298 |
| 77. | Horseshoe Bend | 3.2% | 2.2%(+1.000)#77 | 3.1%(+0.100)#10,378 |
| 78. | Pocatello | 3.1% | 2.2%(+0.900)#78 | 3.1%(=0.000)#10,444 |
| 79. | Aberdeen | 3.1% | 2.2%(+0.900)#79 | 3.1%(=0.000)#10,552 |
| 80. | Worley | 3.1% | 2.2%(+0.900)#80 | 3.1%(=0.000)#10,644 |
| 81. | Hayden | 3.0% | 2.2%(+0.800)#81 | 3.1%(-0.100)#10,709 |
| 82. | Wilder | 3.0% | 2.2%(+0.800)#82 | 3.1%(-0.100)#10,808 |
| 83. | Riggins | 3.0% | 2.2%(+0.800)#83 | 3.1%(-0.100)#10,875 |
| 84. | Caldwell | 2.9% | 2.2%(+0.700)#84 | 3.1%(-0.200)#10,904 |
| 85. | Lincoln | 2.9% | 2.2%(+0.700)#85 | 3.1%(-0.200)#11,020 |
| 86. | Post Falls | 2.8% | 2.2%(+0.600)#86 | 3.1%(-0.300)#11,187 |
| 87. | Garden City | 2.8% | 2.2%(+0.600)#87 | 3.1%(-0.300)#11,228 |
| 88. | Ashton | 2.8% | 2.2%(+0.600)#88 | 3.1%(-0.300)#11,333 |
| 89. | Troy | 2.8% | 2.2%(+0.600)#89 | 3.1%(-0.300)#11,353 |
| 90. | Hauser | 2.8% | 2.2%(+0.600)#90 | 3.1%(-0.300)#11,356 |
| 91. | Mountain Home | 2.7% | 2.2%(+0.500)#91 | 3.1%(-0.400)#11,483 |
| 92. | St Maries | 2.7% | 2.2%(+0.500)#92 | 3.1%(-0.400)#11,552 |
| 93. | Genesee | 2.7% | 2.2%(+0.500)#93 | 3.1%(-0.400)#11,589 |
| 94. | Ririe | 2.7% | 2.2%(+0.500)#94 | 3.1%(-0.400)#11,611 |
| 95. | Kooskia | 2.7% | 2.2%(+0.500)#95 | 3.1%(-0.400)#11,623 |
| 96. | East Hope | 2.7% | 2.2%(+0.500)#96 | 3.1%(-0.400)#11,656 |
| 97. | Iona | 2.6% | 2.2%(+0.400)#97 | 3.1%(-0.500)#11,796 |
| 98. | Georgetown | 2.5% | 2.2%(+0.300)#98 | 3.1%(-0.600)#12,160 |
| 99. | Sugar City | 2.4% | 2.2%(+0.200)#99 | 3.1%(-0.700)#12,396 |
| 100. | Boise City | 2.3% | 2.2%(+0.100)#100 | 3.1%(-0.800)#12,516 |
Common Questions
What are the Top 10 Cities with the Highest Percentage of Families with Income Below $10,000 in Idaho?
Top 10 Cities with the Highest Percentage of Families with Income Below $10,000 in Idaho are:
#1
64.3%
#2
30.0%
#3
19.4%
#4
15.3%
#5
14.9%
#6
13.6%
#7
13.1%
#8
12.8%
#9
12.8%
#10
12.8%
What city has the Highest Percentage of Families with Income Below $10,000 in Idaho?
Huetter has the Highest Percentage of Families with Income Below $10,000 in Idaho with 64.3%.
What is the Percentage of Families with Income Below $10,000 in the State of Idaho?
Percentage of Families with Income Below $10,000 in Idaho is 2.2%.
What is the Percentage of Families with Income Below $10,000 in the United States?
Percentage of Families with Income Below $10,000 in the United States is 3.1%.