Valley Home, CA Map & Demographics
Valley Home Map
Valley Home Overview
$44,426
PER CAPITA INCOME
$93,864
AVG FAMILY INCOME
$84,297
AVG HOUSEHOLD INCOME
37.9%
WAGE / INCOME GAP [ % ]
62.1¢/ $1
WAGE / INCOME GAP [ $ ]
0.56
INEQUALITY / GINI INDEX
246
TOTAL POPULATION
117
MALE POPULATION
129
FEMALE POPULATION
90.70
MALES / 100 FEMALES
110.26
FEMALES / 100 MALES
50.5
MEDIAN AGE
3.0
AVG FAMILY SIZE
2.4
AVG HOUSEHOLD SIZE
112
LABOR FORCE [ PEOPLE ]
48.9%
PERCENT IN LABOR FORCE
8.9%
UNEMPLOYMENT RATE
Valley Home Area Codes
Income in Valley Home
Income Overview in Valley Home
Per Capita Income in Valley Home is $44,426, while median incomes of families and households are $93,864 and $84,297 respectively.
| Characteristic | Number | Measure |
| Per Capita Income | 246 | $44,426 |
| Median Family Income | 74 | $93,864 |
| Mean Family Income | 74 | $132,176 |
| Median Household Income | 101 | $84,297 |
| Mean Household Income | 101 | $98,018 |
| Income Deficit | 74 | $0 |
| Wage / Income Gap (%) | 246 | 37.91% |
| Wage / Income Gap ($) | 246 | 62.09¢ per $1 |
| Gini / Inequality Index | 246 | 0.56 |
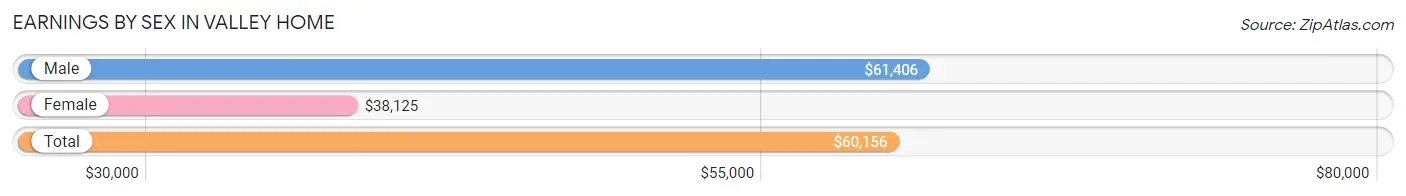
Earnings by Sex in Valley Home
Average Earnings in Valley Home are $60,156, $61,406 for men and $38,125 for women, a difference of 37.9%.
| Sex | Number | Average Earnings |
| Male | 64 (62.7%) | $61,406 |
| Female | 38 (37.2%) | $38,125 |
| Total | 102 (100.0%) | $60,156 |
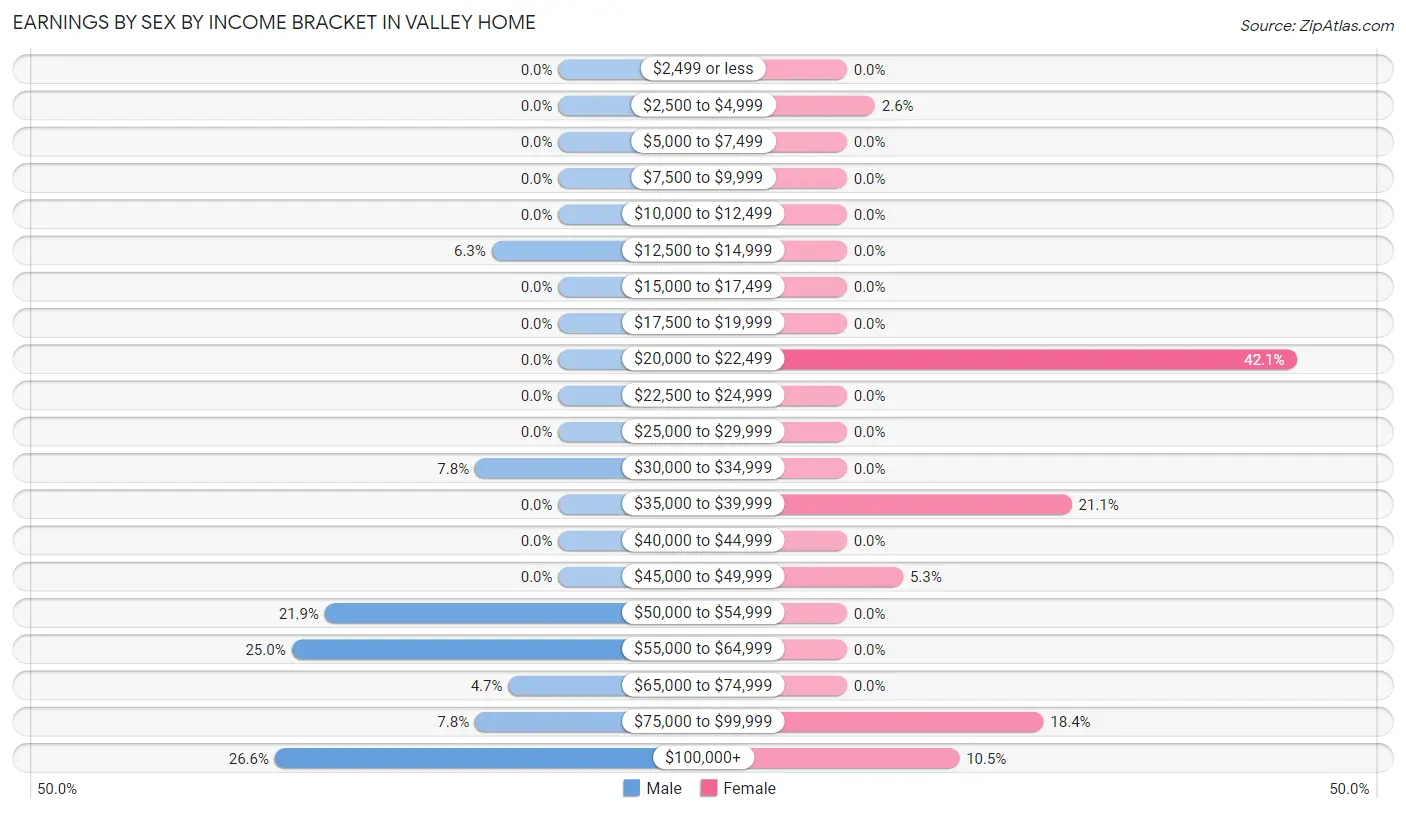
Earnings by Sex by Income Bracket in Valley Home
The most common earnings brackets in Valley Home are $100,000+ for men (17 | 26.6%) and $20,000 to $22,499 for women (16 | 42.1%).
| Income | Male | Female |
| $2,499 or less | 0 (0.0%) | 0 (0.0%) |
| $2,500 to $4,999 | 0 (0.0%) | 1 (2.6%) |
| $5,000 to $7,499 | 0 (0.0%) | 0 (0.0%) |
| $7,500 to $9,999 | 0 (0.0%) | 0 (0.0%) |
| $10,000 to $12,499 | 0 (0.0%) | 0 (0.0%) |
| $12,500 to $14,999 | 4 (6.2%) | 0 (0.0%) |
| $15,000 to $17,499 | 0 (0.0%) | 0 (0.0%) |
| $17,500 to $19,999 | 0 (0.0%) | 0 (0.0%) |
| $20,000 to $22,499 | 0 (0.0%) | 16 (42.1%) |
| $22,500 to $24,999 | 0 (0.0%) | 0 (0.0%) |
| $25,000 to $29,999 | 0 (0.0%) | 0 (0.0%) |
| $30,000 to $34,999 | 5 (7.8%) | 0 (0.0%) |
| $35,000 to $39,999 | 0 (0.0%) | 8 (21.0%) |
| $40,000 to $44,999 | 0 (0.0%) | 0 (0.0%) |
| $45,000 to $49,999 | 0 (0.0%) | 2 (5.3%) |
| $50,000 to $54,999 | 14 (21.9%) | 0 (0.0%) |
| $55,000 to $64,999 | 16 (25.0%) | 0 (0.0%) |
| $65,000 to $74,999 | 3 (4.7%) | 0 (0.0%) |
| $75,000 to $99,999 | 5 (7.8%) | 7 (18.4%) |
| $100,000+ | 17 (26.6%) | 4 (10.5%) |
| Total | 64 (100.0%) | 38 (100.0%) |
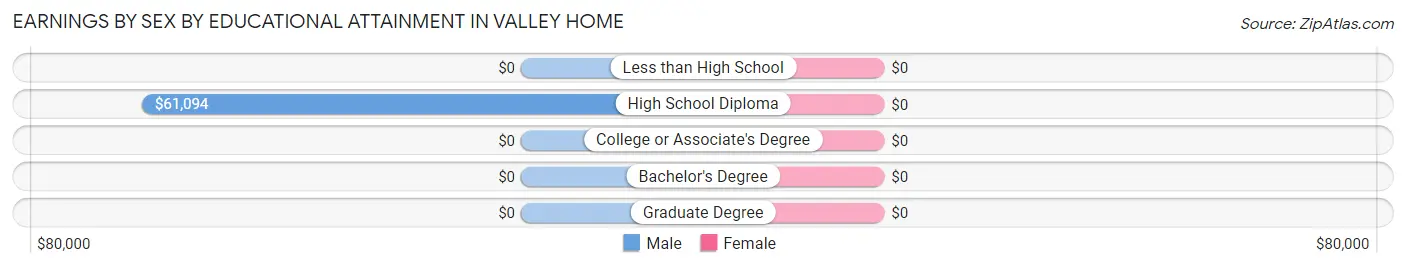
Earnings by Sex by Educational Attainment in Valley Home
| Educational Attainment | Male Income | Female Income |
| Less than High School | - | - |
| High School Diploma | $61,094 | $0 |
| College or Associate's Degree | - | - |
| Bachelor's Degree | - | - |
| Graduate Degree | - | - |
| Total | $61,719 | $38,125 |
Family Income in Valley Home
Family Income Brackets in Valley Home
According to the Valley Home family income data, there are 31 families falling into the $75,000 to $99,999 income range, which is the most common income bracket and makes up 41.9% of all families.
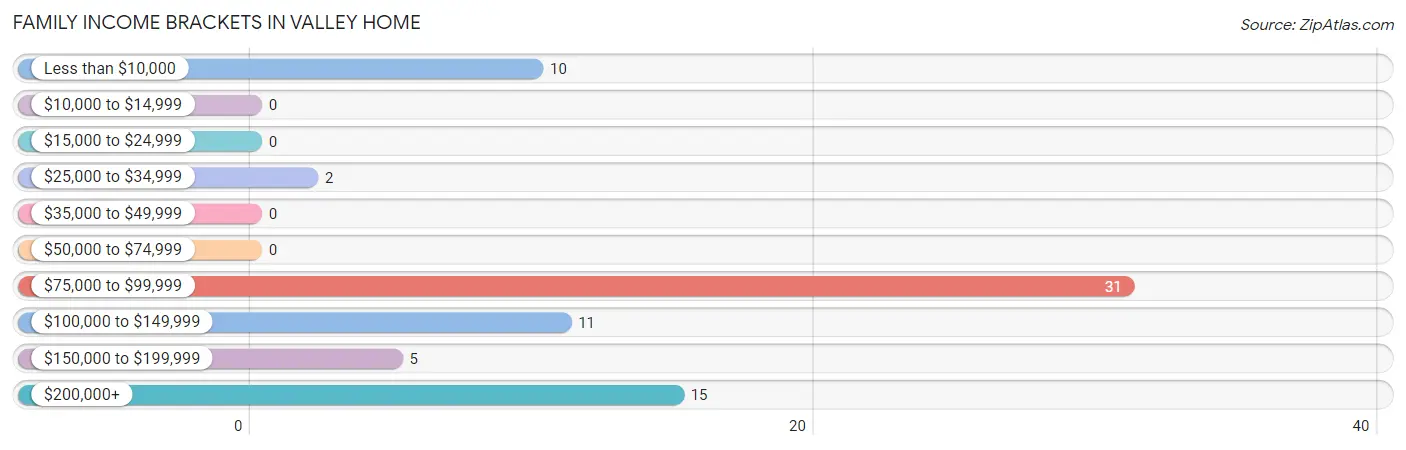
| Income Bracket | # Families | % Families |
| Less than $10,000 | 10 | 13.5% |
| $10,000 to $14,999 | 0 | 0.0% |
| $15,000 to $24,999 | 0 | 0.0% |
| $25,000 to $34,999 | 2 | 2.7% |
| $35,000 to $49,999 | 0 | 0.0% |
| $50,000 to $74,999 | 0 | 0.0% |
| $75,000 to $99,999 | 31 | 41.9% |
| $100,000 to $149,999 | 11 | 14.9% |
| $150,000 to $199,999 | 5 | 6.8% |
| $200,000+ | 15 | 20.3% |
Family Income by Famaliy Size in Valley Home
2-person families (37 | 50.0%) account for the highest median family income in Valley Home with $145,972 per family, while 2-person families (37 | 50.0%) have the highest median income of $72,986 per family member.
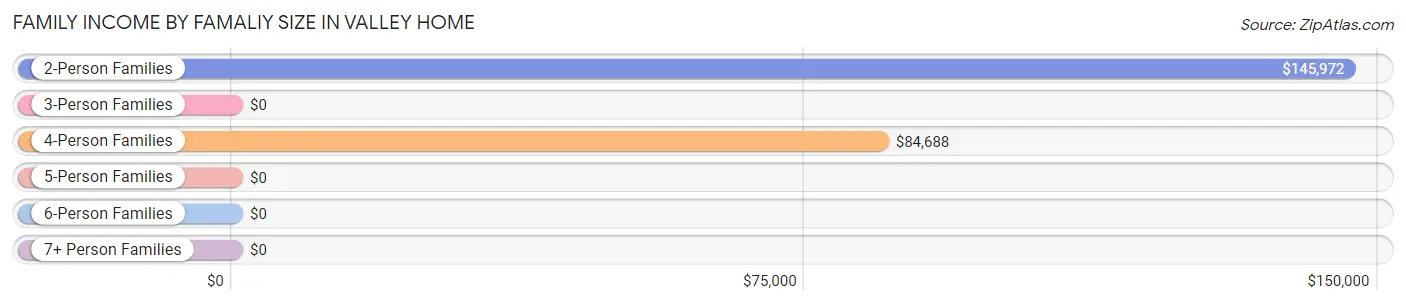
| Income Bracket | # Families | Median Income |
| 2-Person Families | 37 (50.0%) | $145,972 |
| 3-Person Families | 9 (12.2%) | $0 |
| 4-Person Families | 28 (37.8%) | $84,688 |
| 5-Person Families | 0 (0.0%) | $0 |
| 6-Person Families | 0 (0.0%) | $0 |
| 7+ Person Families | 0 (0.0%) | $0 |
| Total | 74 (100.0%) | $93,864 |
Family Income by Number of Earners in Valley Home
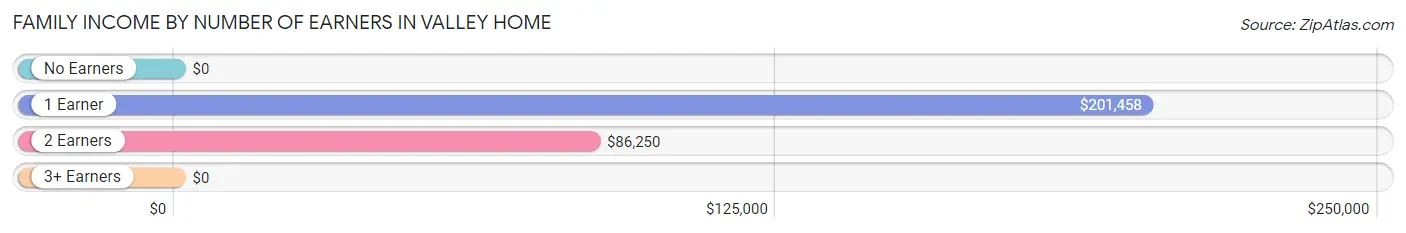
| Number of Earners | # Families | Median Income |
| No Earners | 26 (35.1%) | $0 |
| 1 Earner | 9 (12.2%) | $201,458 |
| 2 Earners | 32 (43.2%) | $86,250 |
| 3+ Earners | 7 (9.5%) | $0 |
| Total | 74 (100.0%) | $93,864 |
Household Income in Valley Home
Household Income Brackets in Valley Home
With 34 households falling in the category, the less than $10,000 income range is the most frequent in Valley Home, accounting for 33.7% of all households.
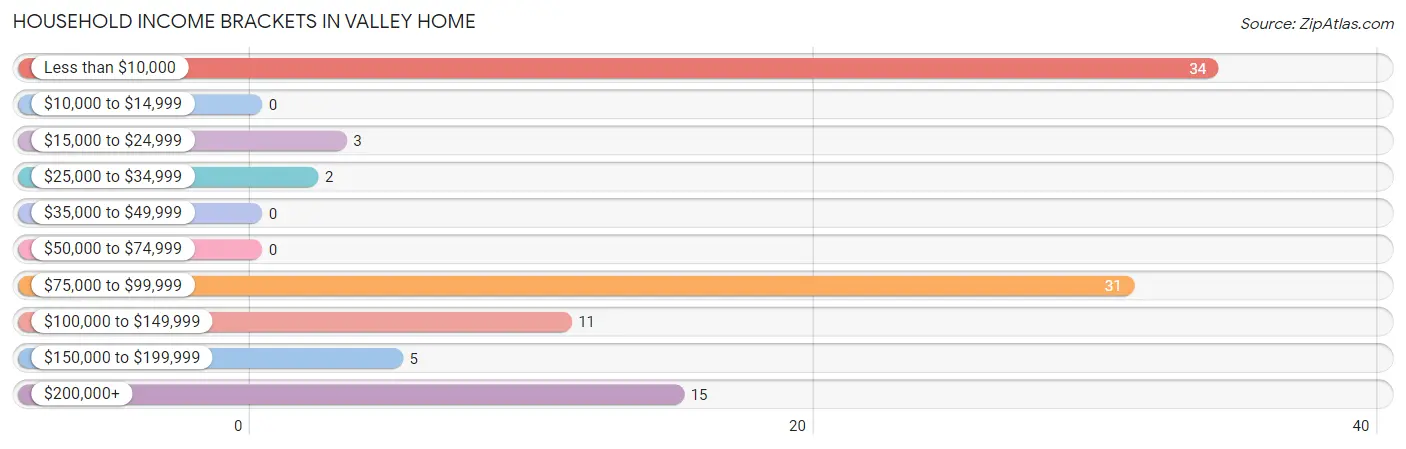
| Income Bracket | # Households | % Households |
| Less than $10,000 | 34 | 33.7% |
| $10,000 to $14,999 | 0 | 0.0% |
| $15,000 to $24,999 | 3 | 3.0% |
| $25,000 to $34,999 | 2 | 2.0% |
| $35,000 to $49,999 | 0 | 0.0% |
| $50,000 to $74,999 | 0 | 0.0% |
| $75,000 to $99,999 | 31 | 30.7% |
| $100,000 to $149,999 | 11 | 10.9% |
| $150,000 to $199,999 | 5 | 5.0% |
| $200,000+ | 15 | 14.9% |
Household Income by Householder Age in Valley Home
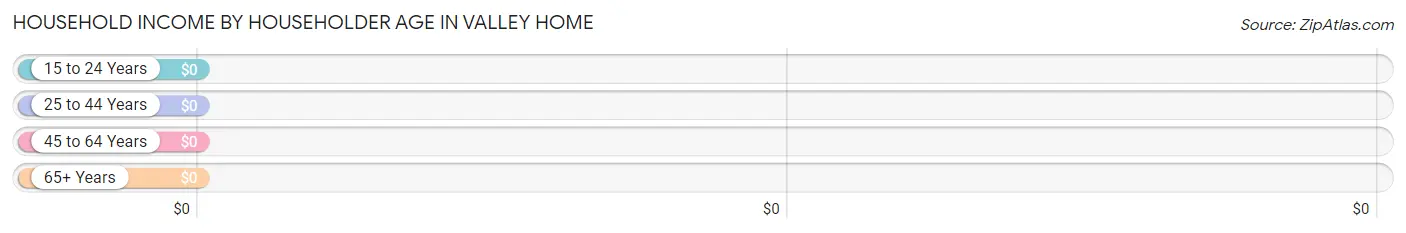
| Income Bracket | # Households | Median Income |
| 15 to 24 Years | 0 (0.0%) | $0 |
| 25 to 44 Years | 8 (7.9%) | $0 |
| 45 to 64 Years | 54 (53.5%) | $0 |
| 65+ Years | 39 (38.6%) | $0 |
| Total | 101 (100.0%) | $84,297 |
Poverty in Valley Home
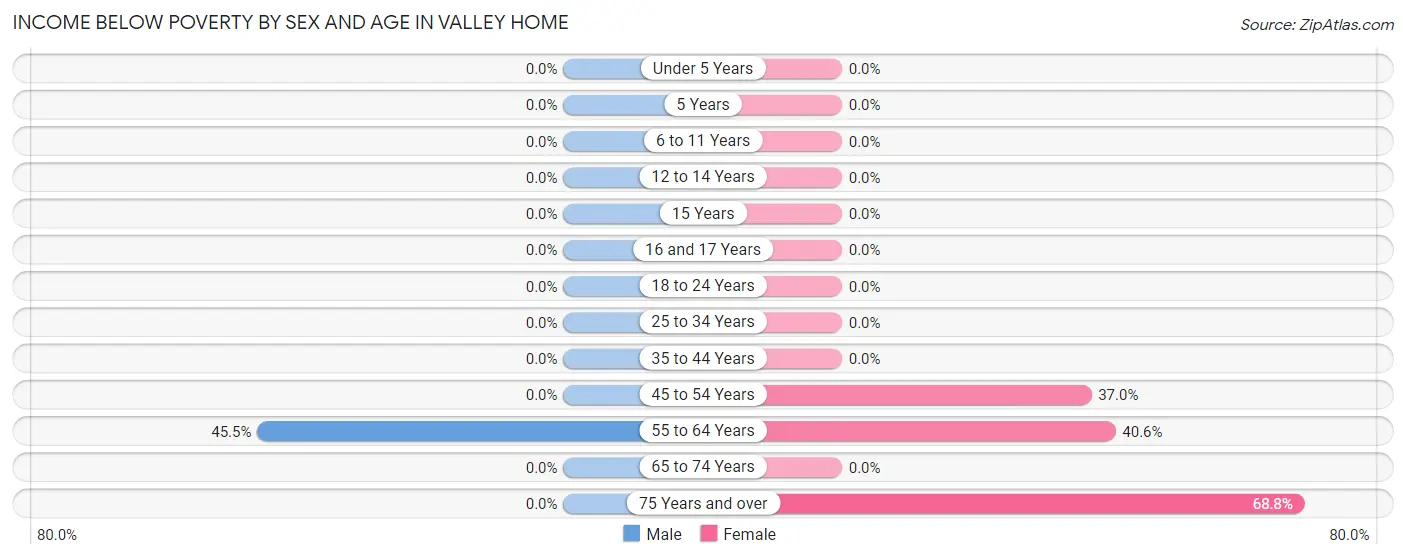
Income Below Poverty by Sex and Age in Valley Home
With 8.6% poverty level for males and 26.4% for females among the residents of Valley Home, 55 to 64 year old males and 75 year old and over females are the most vulnerable to poverty, with 10 males (45.5%) and 11 females (68.8%) in their respective age groups living below the poverty level.
| Age Bracket | Male | Female |
| Under 5 Years | 0 (0.0%) | 0 (0.0%) |
| 5 Years | 0 (0.0%) | 0 (0.0%) |
| 6 to 11 Years | 0 (0.0%) | 0 (0.0%) |
| 12 to 14 Years | 0 (0.0%) | 0 (0.0%) |
| 15 Years | 0 (0.0%) | 0 (0.0%) |
| 16 and 17 Years | 0 (0.0%) | 0 (0.0%) |
| 18 to 24 Years | 0 (0.0%) | 0 (0.0%) |
| 25 to 34 Years | 0 (0.0%) | 0 (0.0%) |
| 35 to 44 Years | 0 (0.0%) | 0 (0.0%) |
| 45 to 54 Years | 0 (0.0%) | 10 (37.0%) |
| 55 to 64 Years | 10 (45.5%) | 13 (40.6%) |
| 65 to 74 Years | 0 (0.0%) | 0 (0.0%) |
| 75 Years and over | 0 (0.0%) | 11 (68.8%) |
| Total | 10 (8.6%) | 34 (26.4%) |
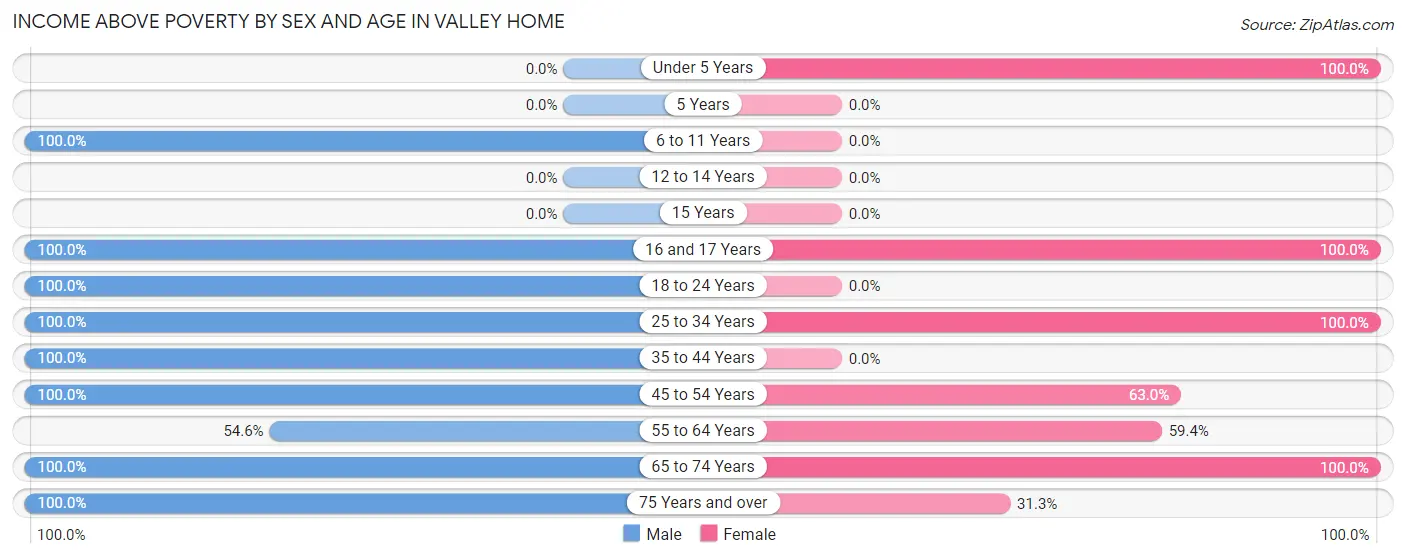
Income Above Poverty by Sex and Age in Valley Home
According to the poverty statistics in Valley Home, males aged 6 to 11 years and females aged under 5 years are the age groups that are most secure financially, with 100.0% of males and 100.0% of females in these age groups living above the poverty line.
| Age Bracket | Male | Female |
| Under 5 Years | 0 (0.0%) | 9 (100.0%) |
| 5 Years | 0 (0.0%) | 0 (0.0%) |
| 6 to 11 Years | 8 (100.0%) | 0 (0.0%) |
| 12 to 14 Years | 0 (0.0%) | 0 (0.0%) |
| 15 Years | 0 (0.0%) | 0 (0.0%) |
| 16 and 17 Years | 19 (100.0%) | 17 (100.0%) |
| 18 to 24 Years | 4 (100.0%) | 0 (0.0%) |
| 25 to 34 Years | 5 (100.0%) | 8 (100.0%) |
| 35 to 44 Years | 13 (100.0%) | 0 (0.0%) |
| 45 to 54 Years | 19 (100.0%) | 17 (63.0%) |
| 55 to 64 Years | 12 (54.5%) | 19 (59.4%) |
| 65 to 74 Years | 19 (100.0%) | 20 (100.0%) |
| 75 Years and over | 8 (100.0%) | 5 (31.2%) |
| Total | 107 (91.4%) | 95 (73.6%) |
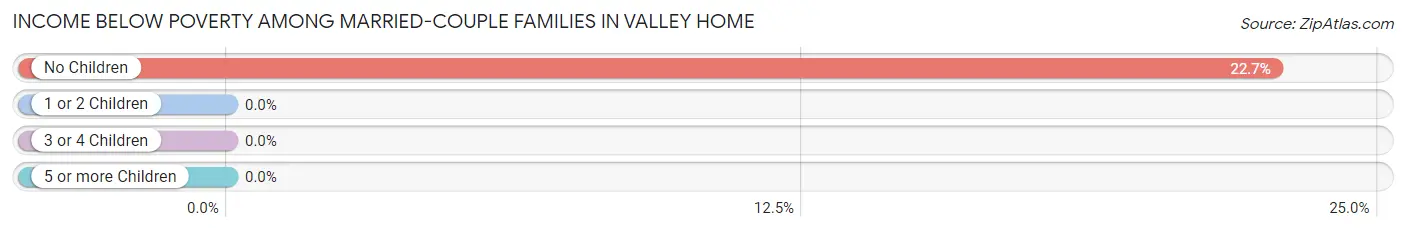
Income Below Poverty Among Married-Couple Families in Valley Home
The poverty statistics for married-couple families in Valley Home show that 13.5% or 10 of the total 74 families live below the poverty line. Families with no children have the highest poverty rate of 22.7%, comprising of 10 families. On the other hand, families with 1 or 2 children have the lowest poverty rate of 0.0%, which includes 0 families.
| Children | Above Poverty | Below Poverty |
| No Children | 34 (77.3%) | 10 (22.7%) |
| 1 or 2 Children | 30 (100.0%) | 0 (0.0%) |
| 3 or 4 Children | 0 (0.0%) | 0 (0.0%) |
| 5 or more Children | 0 (0.0%) | 0 (0.0%) |
| Total | 64 (86.5%) | 10 (13.5%) |
Income Below Poverty Among Single-Parent Households in Valley Home
| Children | Single Father | Single Mother |
| No Children | 0 (0.0%) | 0 (0.0%) |
| 1 or 2 Children | 0 (0.0%) | 0 (0.0%) |
| 3 or 4 Children | 0 (0.0%) | 0 (0.0%) |
| 5 or more Children | 0 (0.0%) | 0 (0.0%) |
| Total | 0 (0.0%) | 0 (0.0%) |
Income Below Poverty Among Married-Couple vs Single-Parent Households in Valley Home
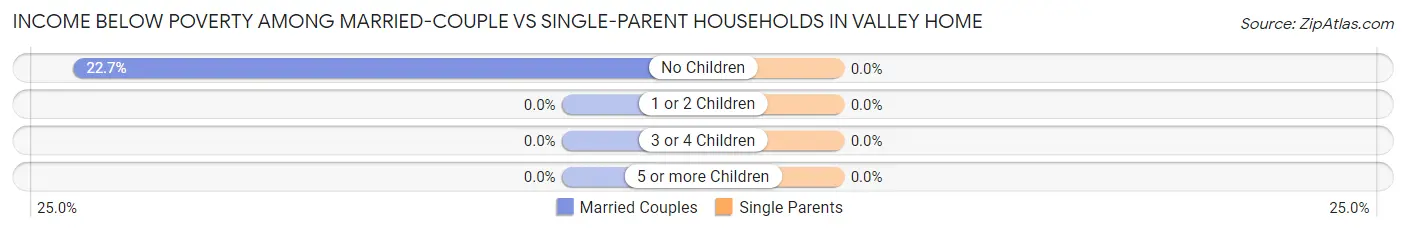
| Children | Married-Couple Families | Single-Parent Households |
| No Children | 10 (22.7%) | 0 (0.0%) |
| 1 or 2 Children | 0 (0.0%) | 0 (0.0%) |
| 3 or 4 Children | 0 (0.0%) | 0 (0.0%) |
| 5 or more Children | 0 (0.0%) | 0 (0.0%) |
| Total | 10 (13.5%) | 0 (0.0%) |
Race in Valley Home
The most populous races in Valley Home are White / Caucasian (218 | 88.6%), Hispanic or Latino (22 | 8.9%), and Some other Race (20 | 8.1%).
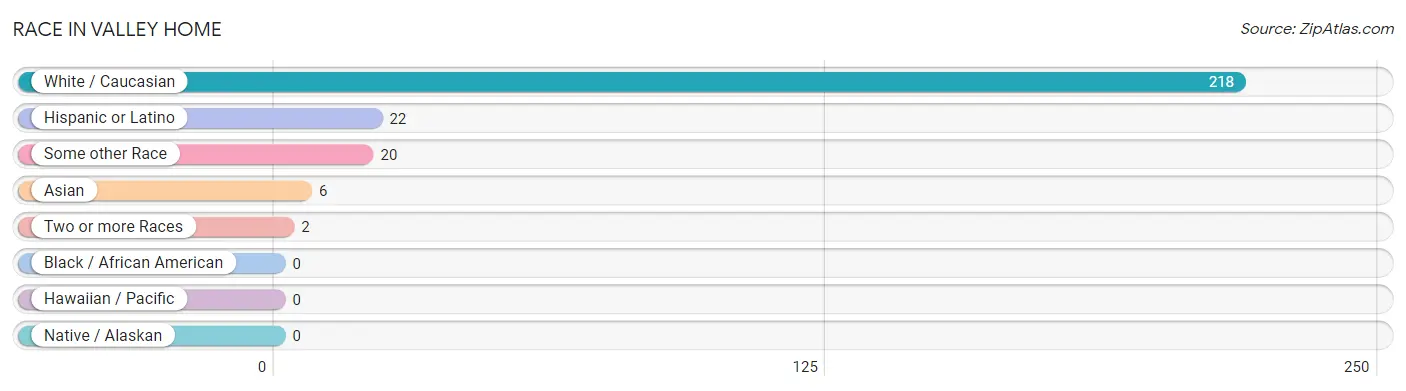
| Race | # Population | % Population |
| Asian | 6 | 2.4% |
| Black / African American | 0 | 0.0% |
| Hawaiian / Pacific | 0 | 0.0% |
| Hispanic or Latino | 22 | 8.9% |
| Native / Alaskan | 0 | 0.0% |
| White / Caucasian | 218 | 88.6% |
| Two or more Races | 2 | 0.8% |
| Some other Race | 20 | 8.1% |
| Total | 246 | 100.0% |
Ancestry in Valley Home
The most populous ancestries reported in Valley Home are American (79 | 32.1%), English (48 | 19.5%), Portuguese (30 | 12.2%), German (29 | 11.8%), and Irish (23 | 9.3%), together accounting for 85.0% of all Valley Home residents.
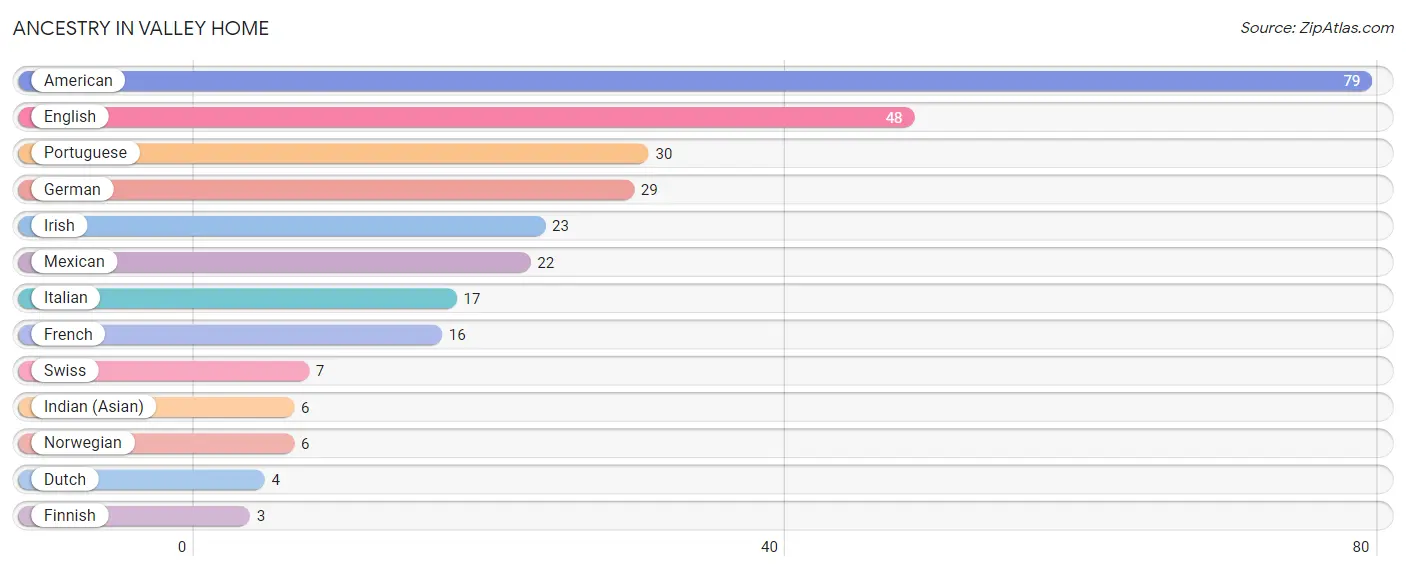
| Ancestry | # Population | % Population |
| American | 79 | 32.1% |
| Dutch | 4 | 1.6% |
| English | 48 | 19.5% |
| Finnish | 3 | 1.2% |
| French | 16 | 6.5% |
| German | 29 | 11.8% |
| Indian (Asian) | 6 | 2.4% |
| Irish | 23 | 9.3% |
| Italian | 17 | 6.9% |
| Mexican | 22 | 8.9% |
| Norwegian | 6 | 2.4% |
| Portuguese | 30 | 12.2% |
| Swiss | 7 | 2.9% | View All 13 Rows |
Immigrants in Valley Home
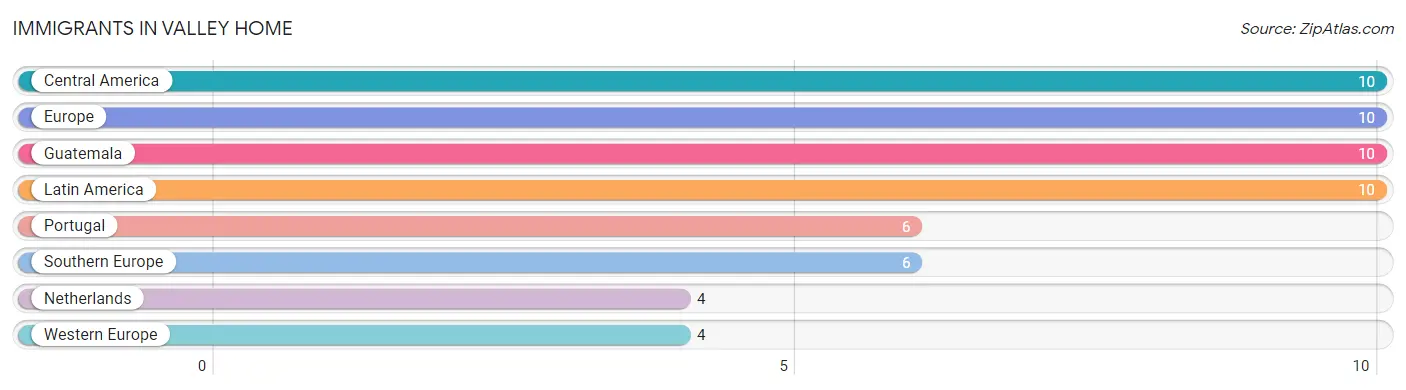
The most numerous immigrant groups reported in Valley Home came from Central America (10 | 4.1%), Europe (10 | 4.1%), Guatemala (10 | 4.1%), Latin America (10 | 4.1%), and Portugal (6 | 2.4%), together accounting for 18.7% of all Valley Home residents.
| Immigration Origin | # Population | % Population |
| Central America | 10 | 4.1% |
| Europe | 10 | 4.1% |
| Guatemala | 10 | 4.1% |
| Latin America | 10 | 4.1% |
| Netherlands | 4 | 1.6% |
| Portugal | 6 | 2.4% |
| Southern Europe | 6 | 2.4% |
| Western Europe | 4 | 1.6% | View All 8 Rows |
Sex and Age in Valley Home
Sex and Age in Valley Home
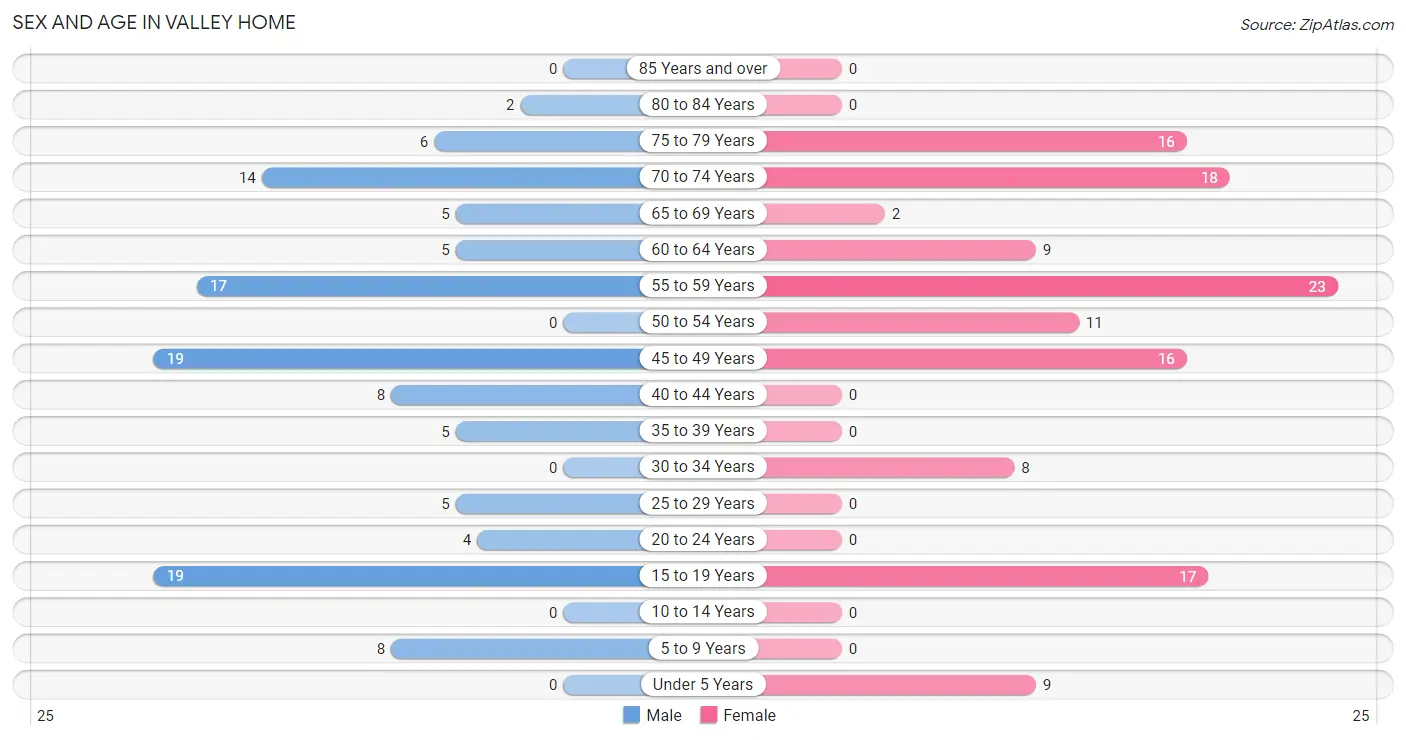
The most populous age groups in Valley Home are 15 to 19 Years (19 | 16.2%) for men and 55 to 59 Years (23 | 17.8%) for women.
| Age Bracket | Male | Female |
| Under 5 Years | 0 (0.0%) | 9 (7.0%) |
| 5 to 9 Years | 8 (6.8%) | 0 (0.0%) |
| 10 to 14 Years | 0 (0.0%) | 0 (0.0%) |
| 15 to 19 Years | 19 (16.2%) | 17 (13.2%) |
| 20 to 24 Years | 4 (3.4%) | 0 (0.0%) |
| 25 to 29 Years | 5 (4.3%) | 0 (0.0%) |
| 30 to 34 Years | 0 (0.0%) | 8 (6.2%) |
| 35 to 39 Years | 5 (4.3%) | 0 (0.0%) |
| 40 to 44 Years | 8 (6.8%) | 0 (0.0%) |
| 45 to 49 Years | 19 (16.2%) | 16 (12.4%) |
| 50 to 54 Years | 0 (0.0%) | 11 (8.5%) |
| 55 to 59 Years | 17 (14.5%) | 23 (17.8%) |
| 60 to 64 Years | 5 (4.3%) | 9 (7.0%) |
| 65 to 69 Years | 5 (4.3%) | 2 (1.5%) |
| 70 to 74 Years | 14 (12.0%) | 18 (14.0%) |
| 75 to 79 Years | 6 (5.1%) | 16 (12.4%) |
| 80 to 84 Years | 2 (1.7%) | 0 (0.0%) |
| 85 Years and over | 0 (0.0%) | 0 (0.0%) |
| Total | 117 (100.0%) | 129 (100.0%) |
Families and Households in Valley Home
Median Family Size in Valley Home
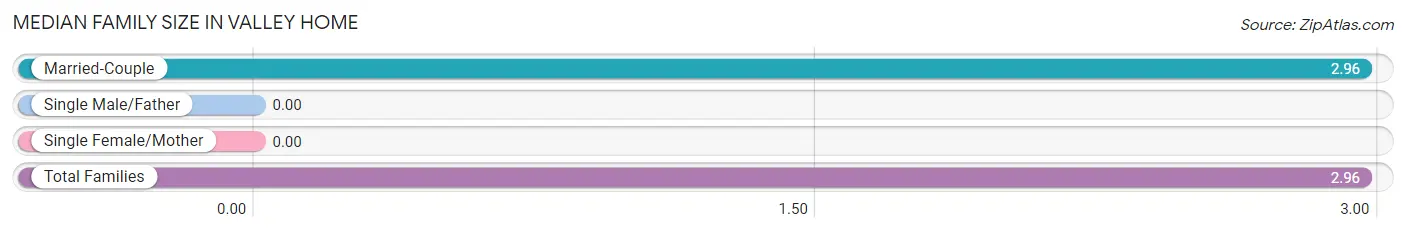
| Family Type | # Families | Family Size |
| Married-Couple | 74 (100.0%) | 2.96 |
| Single Male/Father | 0 (0.0%) | - |
| Single Female/Mother | 0 (0.0%) | - |
| Total Families | 74 (100.0%) | 2.96 |
Median Household Size in Valley Home
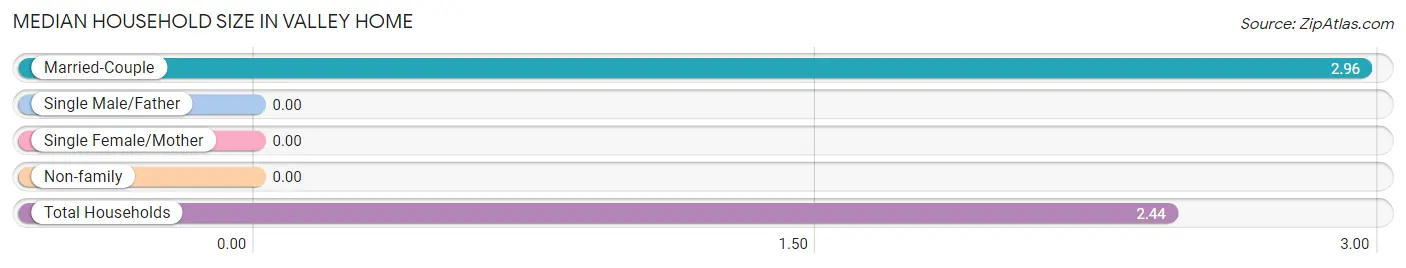
| Household Type | # Households | Household Size |
| Married-Couple | 74 (73.3%) | 2.96 |
| Single Male/Father | 0 (0.0%) | - |
| Single Female/Mother | 0 (0.0%) | - |
| Non-family | 27 (26.7%) | - |
| Total Households | 101 (100.0%) | 2.44 |
Household Size by Marriage Status in Valley Home
Out of a total of 101 households in Valley Home, 74 (73.3%) are family households, while 27 (26.7%) are nonfamily households. The most numerous type of family households are 2-person households, comprising 37, and the most common type of nonfamily households are 1-person households, comprising 27.
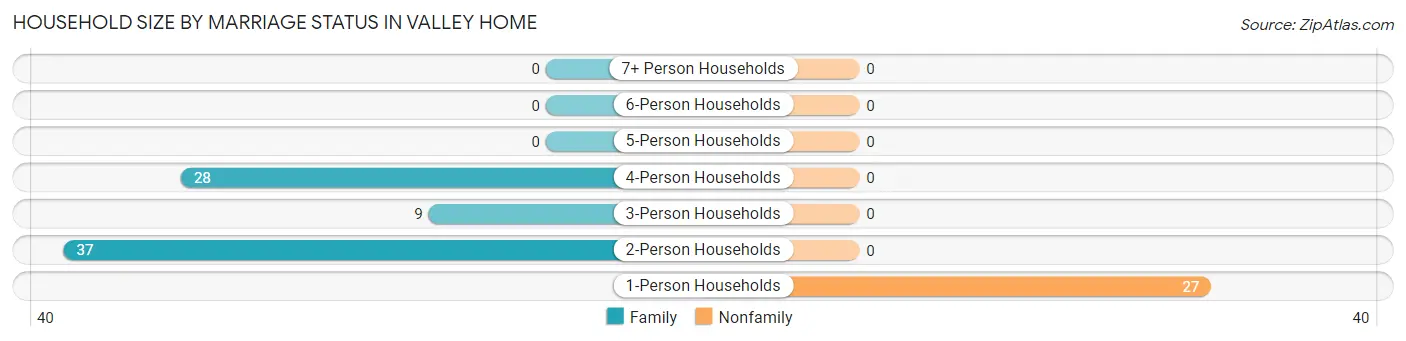
| Household Size | Family Households | Nonfamily Households |
| 1-Person Households | - | 27 (26.7%) |
| 2-Person Households | 37 (36.6%) | 0 (0.0%) |
| 3-Person Households | 9 (8.9%) | 0 (0.0%) |
| 4-Person Households | 28 (27.7%) | 0 (0.0%) |
| 5-Person Households | 0 (0.0%) | 0 (0.0%) |
| 6-Person Households | 0 (0.0%) | 0 (0.0%) |
| 7+ Person Households | 0 (0.0%) | 0 (0.0%) |
| Total | 74 (73.3%) | 27 (26.7%) |
Female Fertility in Valley Home
Fertility by Age in Valley Home
| Age Bracket | Women with Births | Births / 1,000 Women |
| 15 to 19 years | 0 (0.0%) | 0.0 |
| 20 to 34 years | 0 (0.0%) | 0.0 |
| 35 to 50 years | 0 (0.0%) | 0.0 |
| Total | 0 (0.0%) | 0.0 |
Fertility by Age by Marriage Status in Valley Home
| Age Bracket | Married | Unmarried |
| 15 to 19 years | 0 (0.0%) | 0 (0.0%) |
| 20 to 34 years | 0 (0.0%) | 0 (0.0%) |
| 35 to 50 years | 0 (0.0%) | 0 (0.0%) |
| Total | 0 (0.0%) | 0 (0.0%) |
Fertility by Education in Valley Home
| Educational Attainment | Women with Births | Births / 1,000 Women |
| Less than High School | 0 (0.0%) | 0.0 |
| High School Diploma | 0 (0.0%) | 0.0 |
| College or Associate's Degree | 0 (0.0%) | 0.0 |
| Bachelor's Degree | 0 (0.0%) | 0.0 |
| Graduate Degree | 0 (0.0%) | 0.0 |
| Total | 0 (0.0%) | 0.0 |
Fertility by Education by Marriage Status in Valley Home
| Educational Attainment | Married | Unmarried |
| Less than High School | 0 (0.0%) | 0 (0.0%) |
| High School Diploma | 0 (0.0%) | 0 (0.0%) |
| College or Associate's Degree | 0 (0.0%) | 0 (0.0%) |
| Bachelor's Degree | 0 (0.0%) | 0 (0.0%) |
| Graduate Degree | 0 (0.0%) | 0 (0.0%) |
| Total | 0 (0.0%) | 0 (0.0%) |
Employment Characteristics in Valley Home
Employment by Class of Employer in Valley Home
Among the 102 employed individuals in Valley Home, private company employees (71 | 69.6%), self-employed (not incorporated) (18 | 17.6%), and self-employed (incorporated) (10 | 9.8%) make up the most common classes of employment.
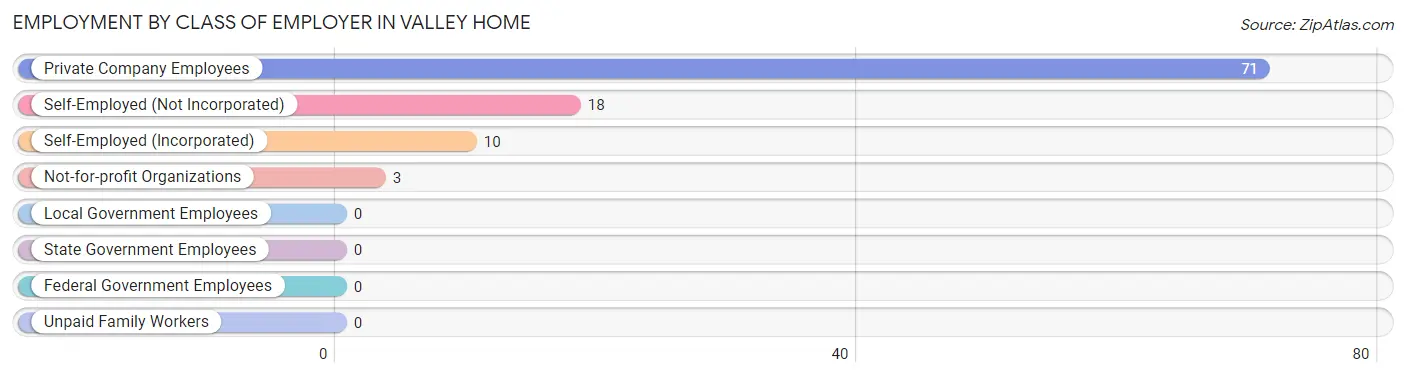
| Employer Class | # Employees | % Employees |
| Private Company Employees | 71 | 69.6% |
| Self-Employed (Incorporated) | 10 | 9.8% |
| Self-Employed (Not Incorporated) | 18 | 17.6% |
| Not-for-profit Organizations | 3 | 2.9% |
| Local Government Employees | 0 | 0.0% |
| State Government Employees | 0 | 0.0% |
| Federal Government Employees | 0 | 0.0% |
| Unpaid Family Workers | 0 | 0.0% |
| Total | 102 | 100.0% |
Employment Status by Age in Valley Home
According to the labor force statistics for Valley Home, out of the total population over 16 years of age (229), 48.9% or 112 individuals are in the labor force, with 8.9% or 10 of them unemployed. The age group with the highest labor force participation rate is 20 to 24 years, with 100.0% or 4 individuals in the labor force. Within the labor force, the 55 to 59 years age range has the highest percentage of unemployed individuals, with 41.7% or 10 of them being unemployed.

| Age Bracket | In Labor Force | Unemployed |
| 16 to 19 Years | 0 (0.0%) | 0 (0.0%) |
| 20 to 24 Years | 4 (100.0%) | 0 (0.0%) |
| 25 to 29 Years | 5 (100.0%) | 0 (0.0%) |
| 30 to 34 Years | 8 (100.0%) | 0 (0.0%) |
| 35 to 44 Years | 13 (100.0%) | 0 (0.0%) |
| 45 to 54 Years | 36 (78.3%) | 0 (0.0%) |
| 55 to 59 Years | 24 (60.0%) | 10 (41.7%) |
| 60 to 64 Years | 9 (64.3%) | 0 (0.0%) |
| 65 to 74 Years | 7 (17.9%) | 0 (0.0%) |
| 75 Years and over | 6 (25.0%) | 0 (0.0%) |
| Total | 112 (48.9%) | 10 (8.9%) |
Employment Status by Educational Attainment in Valley Home
According to labor force statistics for Valley Home, 75.4% of individuals (95) out of the total population between 25 and 64 years of age (126) are in the labor force, with 10.5% or 10 of them being unemployed. The group with the highest labor force participation rate are those with the educational attainment of less than high school, with 100.0% or 3 individuals in the labor force. Within the labor force, individuals with high school diploma education have the highest percentage of unemployment, with 22.2% or 10 of them being unemployed.
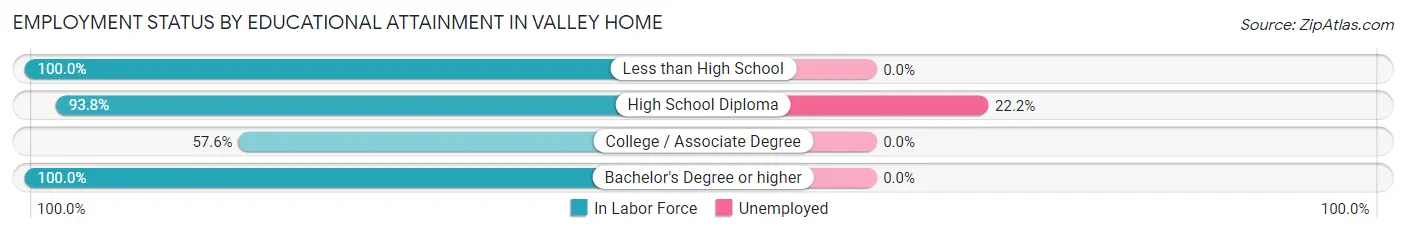
| Educational Attainment | In Labor Force | Unemployed |
| Less than High School | 3 (100.0%) | 0 (0.0%) |
| High School Diploma | 45 (93.8%) | 11 (22.2%) |
| College / Associate Degree | 38 (57.6%) | 0 (0.0%) |
| Bachelor's Degree or higher | 9 (100.0%) | 0 (0.0%) |
| Total | 95 (75.4%) | 13 (10.5%) |
Employment Occupations by Sex in Valley Home
Management, Business, Science and Arts Occupations
The most common Management, Business, Science and Arts occupations in Valley Home are Management (23 | 22.6%), Business & Financial (7 | 6.9%), Health Diagnosing & Treating (4 | 3.9%), Health Technologists (4 | 3.9%), and Community & Social Service (3 | 2.9%).
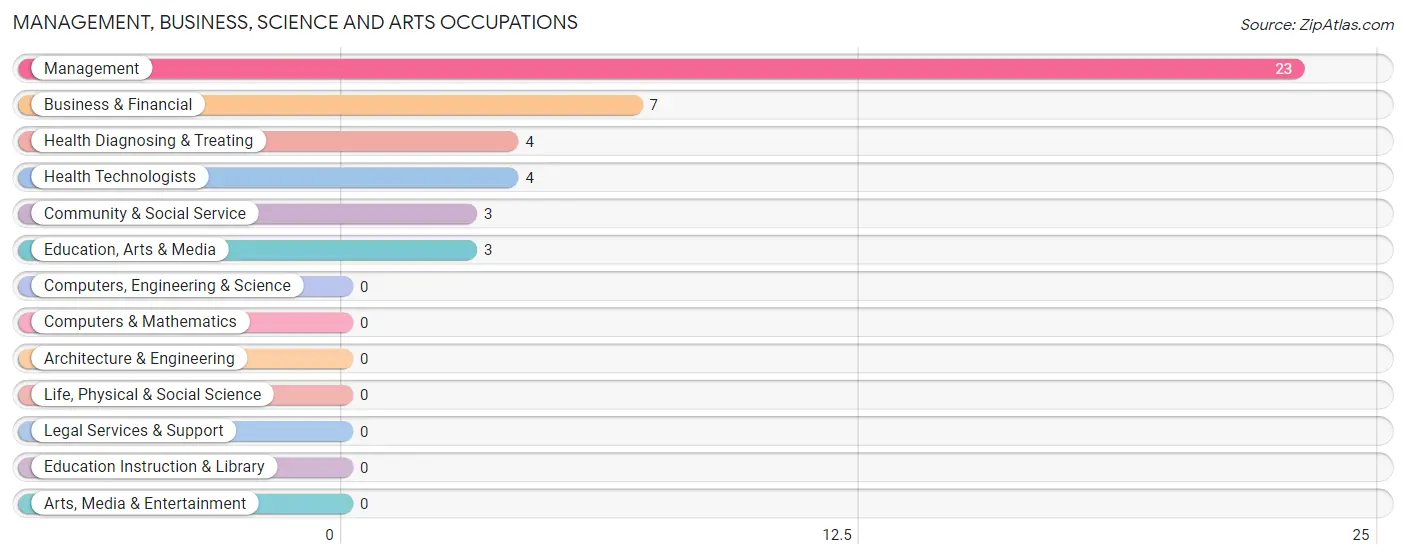
Management, Business, Science and Arts Occupations by Sex
Within the Management, Business, Science and Arts occupations in Valley Home, the most male-oriented occupations are Health Diagnosing & Treating (100.0%), Health Technologists (100.0%), and Management (82.6%), while the most female-oriented occupations are Community & Social Service (100.0%), Education, Arts & Media (100.0%), and Business & Financial (57.1%).
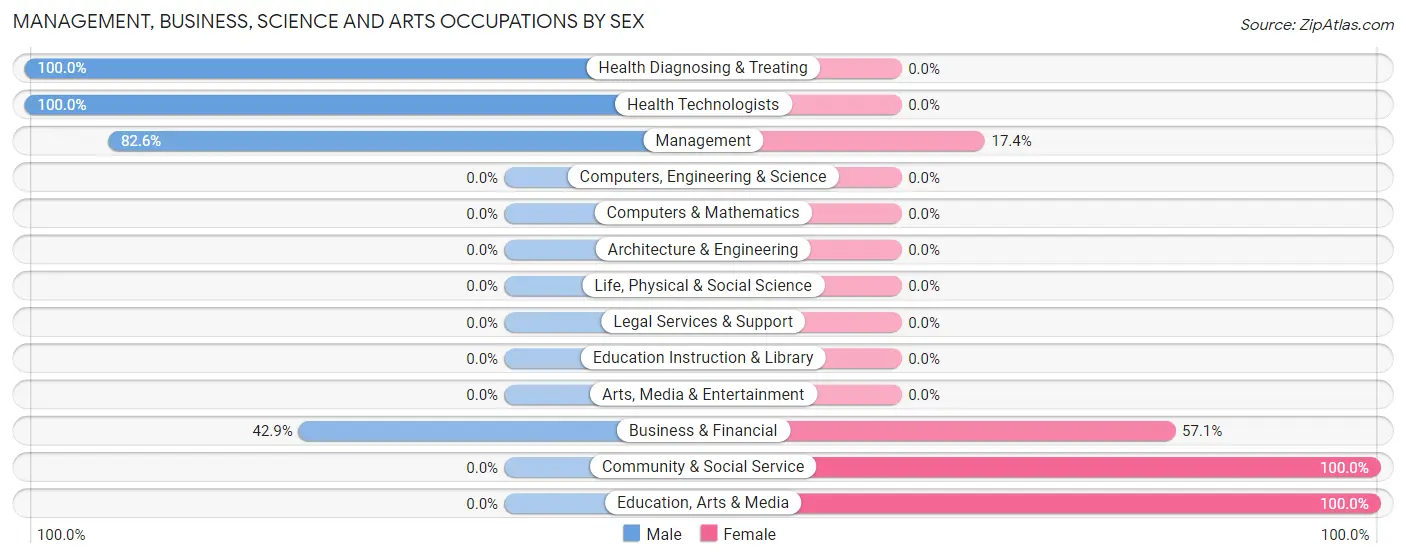
| Occupation | Male | Female |
| Management | 19 (82.6%) | 4 (17.4%) |
| Business & Financial | 3 (42.9%) | 4 (57.1%) |
| Computers, Engineering & Science | 0 (0.0%) | 0 (0.0%) |
| Computers & Mathematics | 0 (0.0%) | 0 (0.0%) |
| Architecture & Engineering | 0 (0.0%) | 0 (0.0%) |
| Life, Physical & Social Science | 0 (0.0%) | 0 (0.0%) |
| Community & Social Service | 0 (0.0%) | 3 (100.0%) |
| Education, Arts & Media | 0 (0.0%) | 3 (100.0%) |
| Legal Services & Support | 0 (0.0%) | 0 (0.0%) |
| Education Instruction & Library | 0 (0.0%) | 0 (0.0%) |
| Arts, Media & Entertainment | 0 (0.0%) | 0 (0.0%) |
| Health Diagnosing & Treating | 4 (100.0%) | 0 (0.0%) |
| Health Technologists | 4 (100.0%) | 0 (0.0%) |
| Total (Category) | 26 (70.3%) | 11 (29.7%) |
| Total (Overall) | 64 (62.7%) | 38 (37.2%) |
Services Occupations
Services Occupations by Sex
| Occupation | Male | Female |
| Healthcare Support | 0 (0.0%) | 0 (0.0%) |
| Security & Protection | 0 (0.0%) | 0 (0.0%) |
| Firefighting & Prevention | 0 (0.0%) | 0 (0.0%) |
| Law Enforcement | 0 (0.0%) | 0 (0.0%) |
| Food Preparation & Serving | 0 (0.0%) | 0 (0.0%) |
| Cleaning & Maintenance | 0 (0.0%) | 0 (0.0%) |
| Personal Care & Service | 0 (0.0%) | 0 (0.0%) |
| Total (Category) | 0 (0.0%) | 0 (0.0%) |
| Total (Overall) | 64 (62.7%) | 38 (37.2%) |
Sales and Office Occupations
The most common Sales and Office occupations in Valley Home are Office & Administration (22 | 21.6%), and Sales & Related (8 | 7.8%).
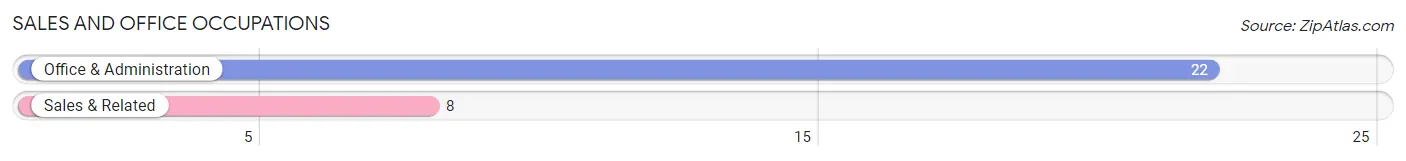
Sales and Office Occupations by Sex
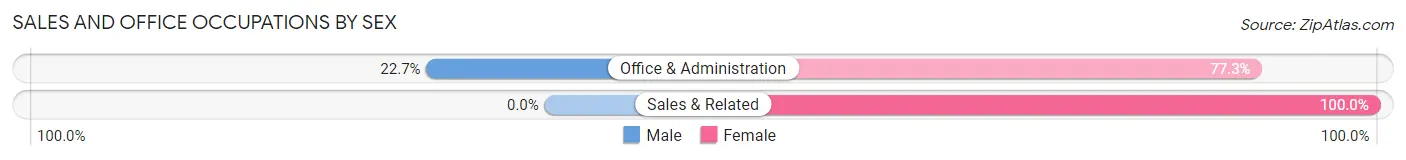
| Occupation | Male | Female |
| Sales & Related | 0 (0.0%) | 8 (100.0%) |
| Office & Administration | 5 (22.7%) | 17 (77.3%) |
| Total (Category) | 5 (16.7%) | 25 (83.3%) |
| Total (Overall) | 64 (62.7%) | 38 (37.2%) |
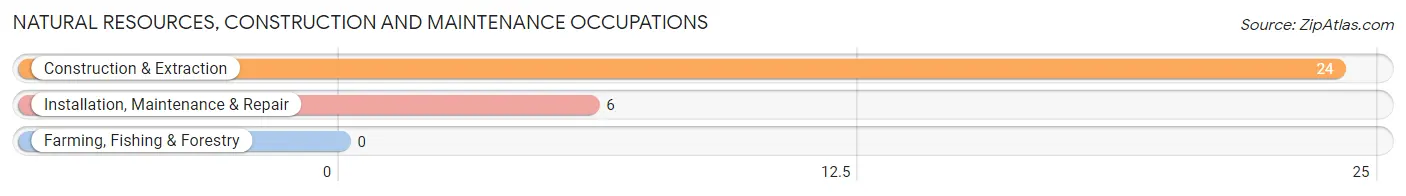
Natural Resources, Construction and Maintenance Occupations
The most common Natural Resources, Construction and Maintenance occupations in Valley Home are Construction & Extraction (24 | 23.5%), and Installation, Maintenance & Repair (6 | 5.9%).
Natural Resources, Construction and Maintenance Occupations by Sex
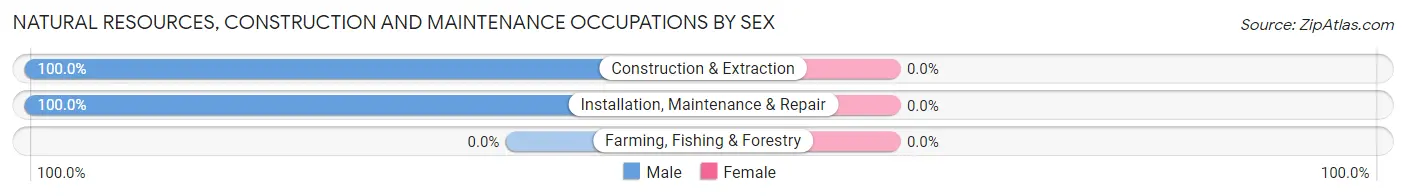
| Occupation | Male | Female |
| Farming, Fishing & Forestry | 0 (0.0%) | 0 (0.0%) |
| Construction & Extraction | 24 (100.0%) | 0 (0.0%) |
| Installation, Maintenance & Repair | 6 (100.0%) | 0 (0.0%) |
| Total (Category) | 30 (100.0%) | 0 (0.0%) |
| Total (Overall) | 64 (62.7%) | 38 (37.2%) |
Production, Transportation and Moving Occupations
The most common Production, Transportation and Moving occupations in Valley Home are Production (3 | 2.9%), and Material Moving (2 | 2.0%).
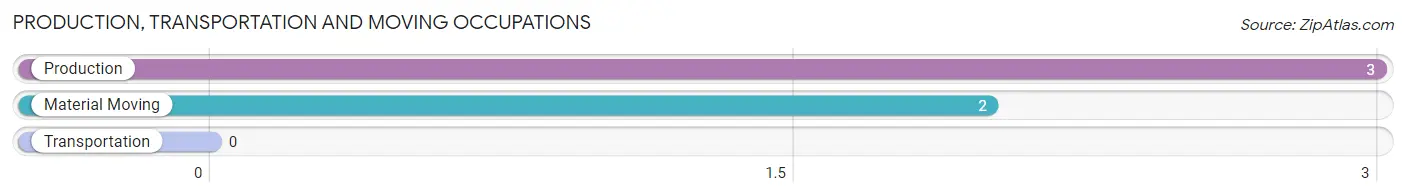
Production, Transportation and Moving Occupations by Sex
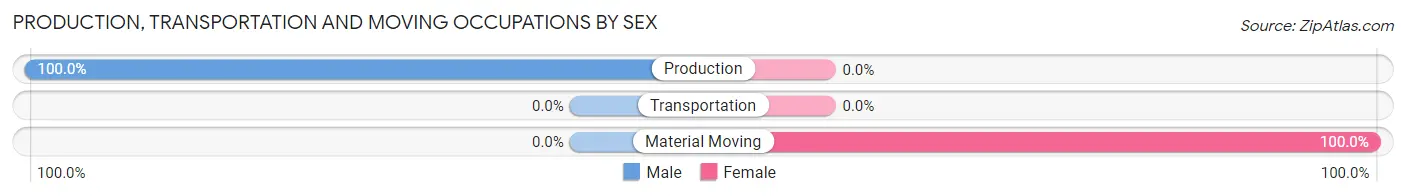
| Occupation | Male | Female |
| Production | 3 (100.0%) | 0 (0.0%) |
| Transportation | 0 (0.0%) | 0 (0.0%) |
| Material Moving | 0 (0.0%) | 2 (100.0%) |
| Total (Category) | 3 (60.0%) | 2 (40.0%) |
| Total (Overall) | 64 (62.7%) | 38 (37.2%) |
Employment Industries by Sex in Valley Home
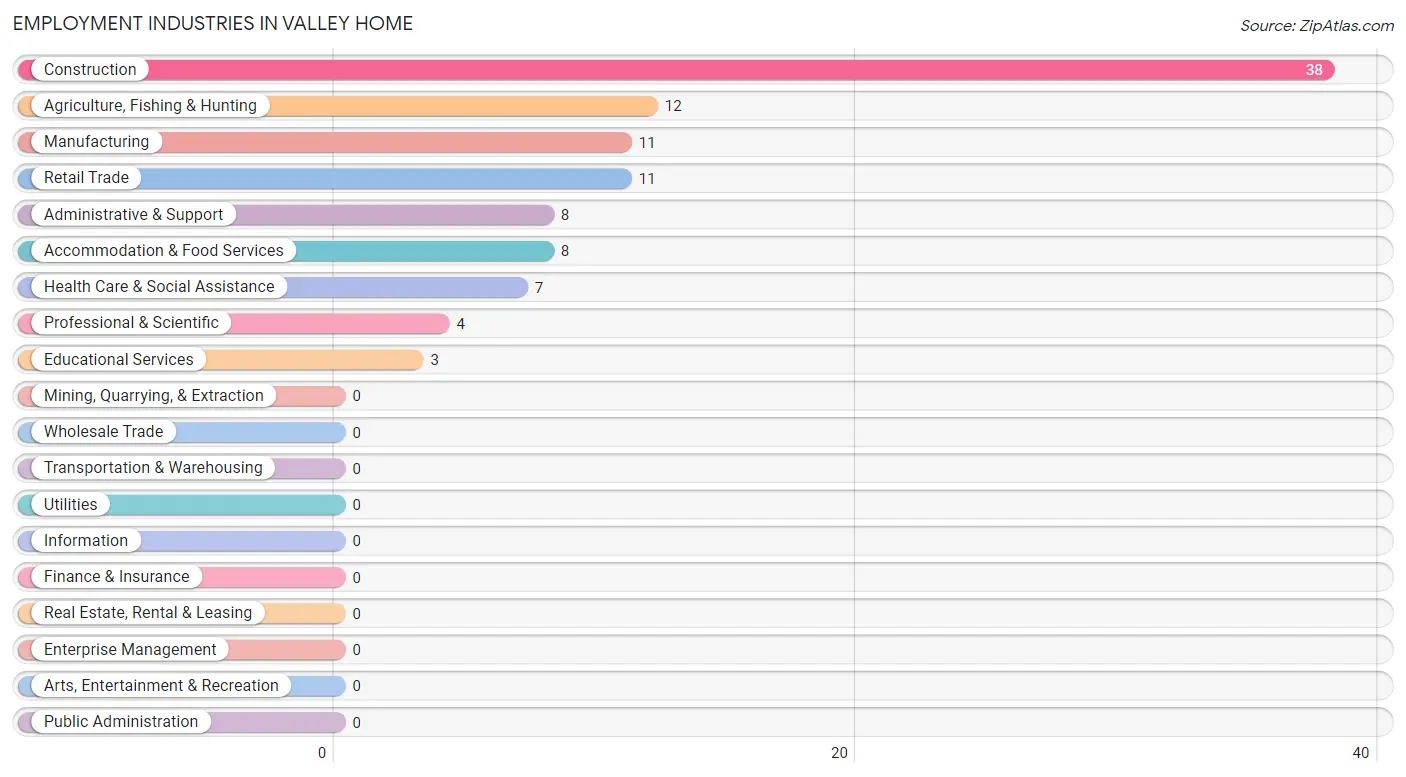
Employment Industries in Valley Home
The major employment industries in Valley Home include Construction (38 | 37.2%), Agriculture, Fishing & Hunting (12 | 11.8%), Manufacturing (11 | 10.8%), Retail Trade (11 | 10.8%), and Administrative & Support (8 | 7.8%).
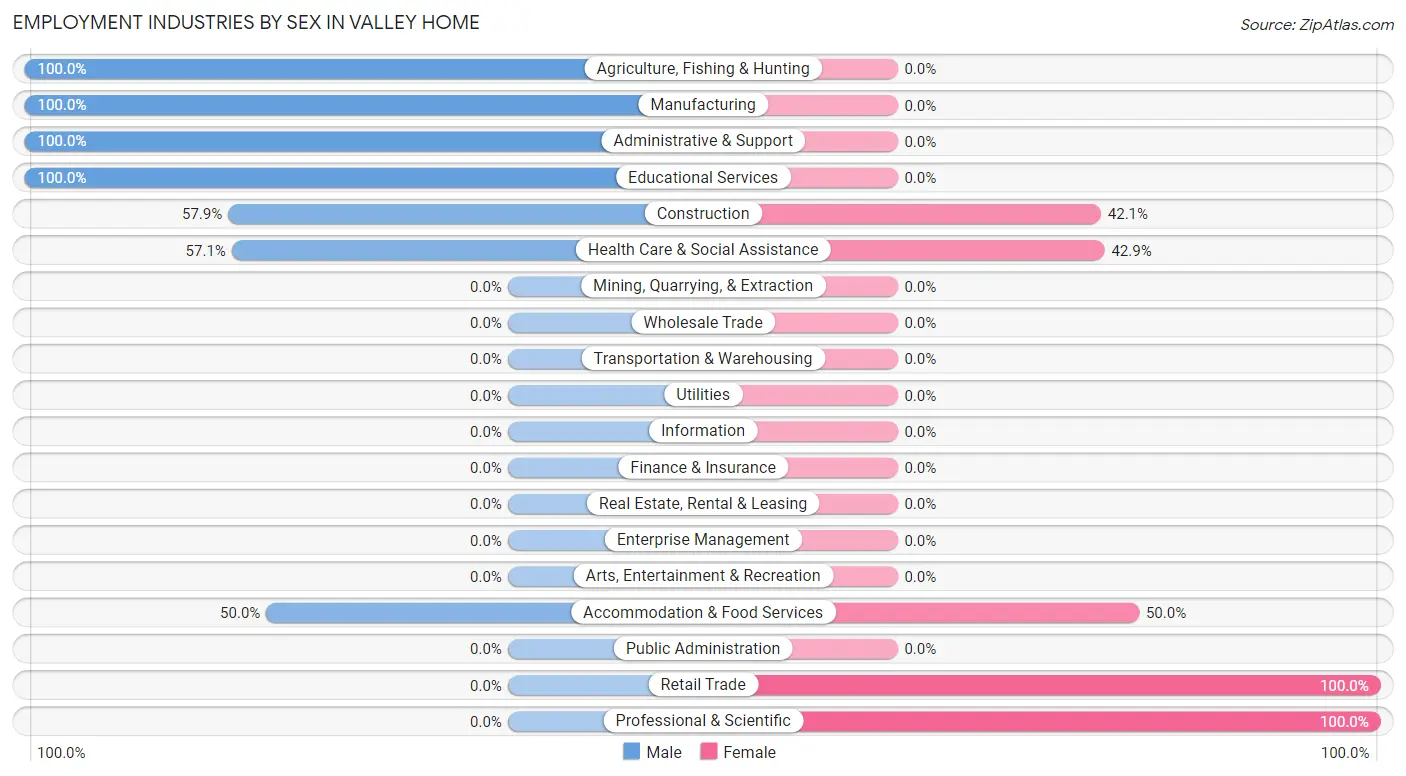
Employment Industries by Sex in Valley Home
The Valley Home industries that see more men than women are Agriculture, Fishing & Hunting (100.0%), Manufacturing (100.0%), and Administrative & Support (100.0%), whereas the industries that tend to have a higher number of women are Retail Trade (100.0%), Professional & Scientific (100.0%), and Accommodation & Food Services (50.0%).
| Industry | Male | Female |
| Agriculture, Fishing & Hunting | 12 (100.0%) | 0 (0.0%) |
| Mining, Quarrying, & Extraction | 0 (0.0%) | 0 (0.0%) |
| Construction | 22 (57.9%) | 16 (42.1%) |
| Manufacturing | 11 (100.0%) | 0 (0.0%) |
| Wholesale Trade | 0 (0.0%) | 0 (0.0%) |
| Retail Trade | 0 (0.0%) | 11 (100.0%) |
| Transportation & Warehousing | 0 (0.0%) | 0 (0.0%) |
| Utilities | 0 (0.0%) | 0 (0.0%) |
| Information | 0 (0.0%) | 0 (0.0%) |
| Finance & Insurance | 0 (0.0%) | 0 (0.0%) |
| Real Estate, Rental & Leasing | 0 (0.0%) | 0 (0.0%) |
| Professional & Scientific | 0 (0.0%) | 4 (100.0%) |
| Enterprise Management | 0 (0.0%) | 0 (0.0%) |
| Administrative & Support | 8 (100.0%) | 0 (0.0%) |
| Educational Services | 3 (100.0%) | 0 (0.0%) |
| Health Care & Social Assistance | 4 (57.1%) | 3 (42.9%) |
| Arts, Entertainment & Recreation | 0 (0.0%) | 0 (0.0%) |
| Accommodation & Food Services | 4 (50.0%) | 4 (50.0%) |
| Public Administration | 0 (0.0%) | 0 (0.0%) |
| Total | 64 (62.7%) | 38 (37.2%) |
Education in Valley Home
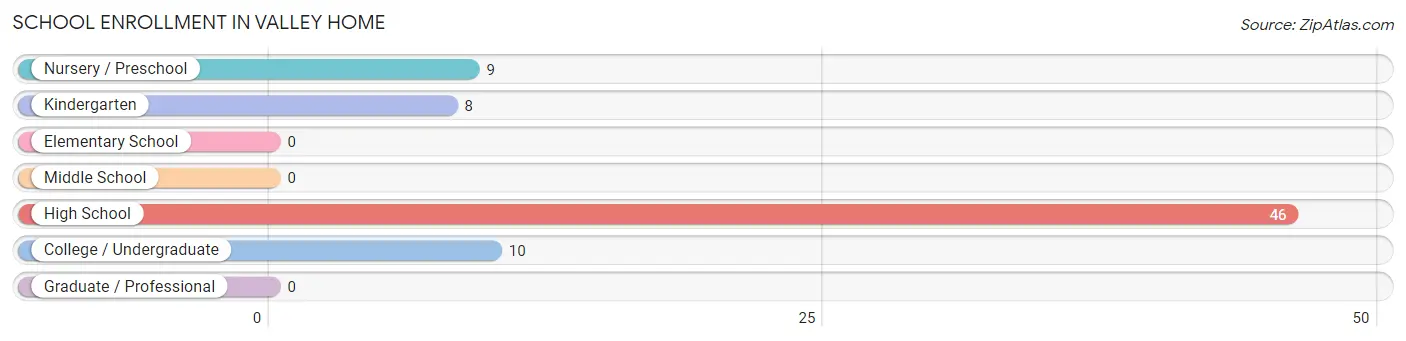
School Enrollment in Valley Home
The most common levels of schooling among the 73 students in Valley Home are high school (46 | 63.0%), college / undergraduate (10 | 13.7%), and nursery / preschool (9 | 12.3%).
| School Level | # Students | % Students |
| Nursery / Preschool | 9 | 12.3% |
| Kindergarten | 8 | 11.0% |
| Elementary School | 0 | 0.0% |
| Middle School | 0 | 0.0% |
| High School | 46 | 63.0% |
| College / Undergraduate | 10 | 13.7% |
| Graduate / Professional | 0 | 0.0% |
| Total | 73 | 100.0% |
School Enrollment by Age by Funding Source in Valley Home
Out of a total of 73 students who are enrolled in schools in Valley Home, 48 (65.8%) attend a private institution, while the remaining 25 (34.2%) are enrolled in public schools. The age group of 3 to 4 year olds has the highest likelihood of being enrolled in private schools, with 9 (100.0% in the age bracket) enrolled. Conversely, the age group of 20 to 24 year olds has the lowest likelihood of being enrolled in a private school, with 4 (100.0% in the age bracket) attending a public institution.
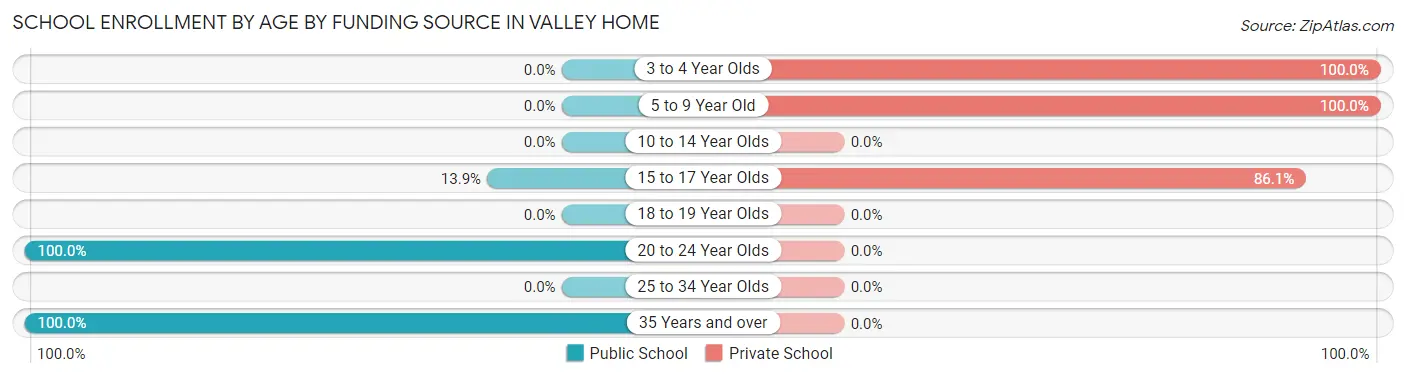
| Age Bracket | Public School | Private School |
| 3 to 4 Year Olds | 0 (0.0%) | 9 (100.0%) |
| 5 to 9 Year Old | 0 (0.0%) | 8 (100.0%) |
| 10 to 14 Year Olds | 0 (0.0%) | 0 (0.0%) |
| 15 to 17 Year Olds | 5 (13.9%) | 31 (86.1%) |
| 18 to 19 Year Olds | 0 (0.0%) | 0 (0.0%) |
| 20 to 24 Year Olds | 4 (100.0%) | 0 (0.0%) |
| 25 to 34 Year Olds | 0 (0.0%) | 0 (0.0%) |
| 35 Years and over | 16 (100.0%) | 0 (0.0%) |
| Total | 25 (34.2%) | 48 (65.8%) |
Educational Attainment by Field of Study in Valley Home
Business (9 | 31.0%), bio, nature & agricultural (6 | 20.7%), science & technology (6 | 20.7%), social sciences (5 | 17.2%), and education (3 | 10.3%) are the most common fields of study among 29 individuals in Valley Home who have obtained a bachelor's degree or higher.
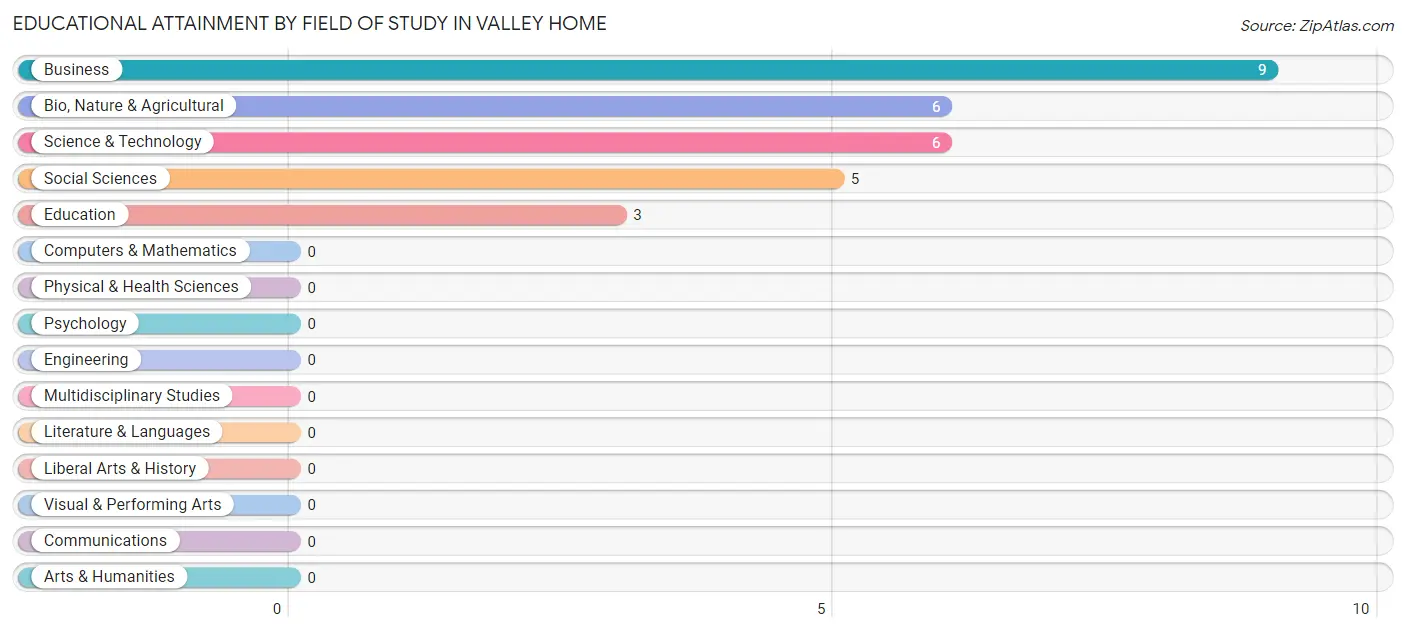
| Field of Study | # Graduates | % Graduates |
| Computers & Mathematics | 0 | 0.0% |
| Bio, Nature & Agricultural | 6 | 20.7% |
| Physical & Health Sciences | 0 | 0.0% |
| Psychology | 0 | 0.0% |
| Social Sciences | 5 | 17.2% |
| Engineering | 0 | 0.0% |
| Multidisciplinary Studies | 0 | 0.0% |
| Science & Technology | 6 | 20.7% |
| Business | 9 | 31.0% |
| Education | 3 | 10.3% |
| Literature & Languages | 0 | 0.0% |
| Liberal Arts & History | 0 | 0.0% |
| Visual & Performing Arts | 0 | 0.0% |
| Communications | 0 | 0.0% |
| Arts & Humanities | 0 | 0.0% |
| Total | 29 | 100.0% |
Transportation & Commute in Valley Home
Vehicle Availability by Sex in Valley Home
The most prevalent vehicle ownership categories in Valley Home are males with 4 vehicles (30, accounting for 46.9%) and females with 4 vehicles (12, making up 78.9%).
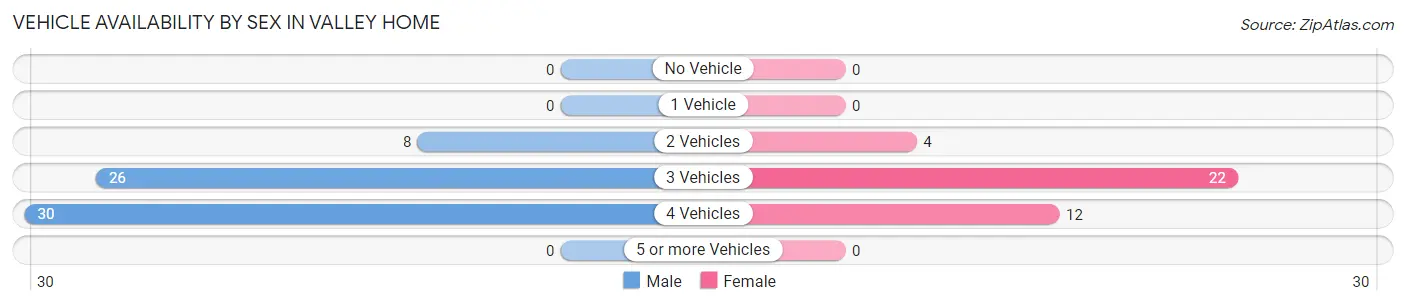
| Vehicles Available | Male | Female |
| No Vehicle | 0 (0.0%) | 0 (0.0%) |
| 1 Vehicle | 0 (0.0%) | 0 (0.0%) |
| 2 Vehicles | 8 (12.5%) | 4 (10.5%) |
| 3 Vehicles | 26 (40.6%) | 22 (57.9%) |
| 4 Vehicles | 30 (46.9%) | 12 (31.6%) |
| 5 or more Vehicles | 0 (0.0%) | 0 (0.0%) |
| Total | 64 (100.0%) | 38 (100.0%) |
Commute Time in Valley Home
The most frequently occuring commute durations in Valley Home are 15 to 19 minutes (24 commuters, 29.6%), 30 to 34 minutes (16 commuters, 19.8%), and 10 to 14 minutes (12 commuters, 14.8%).
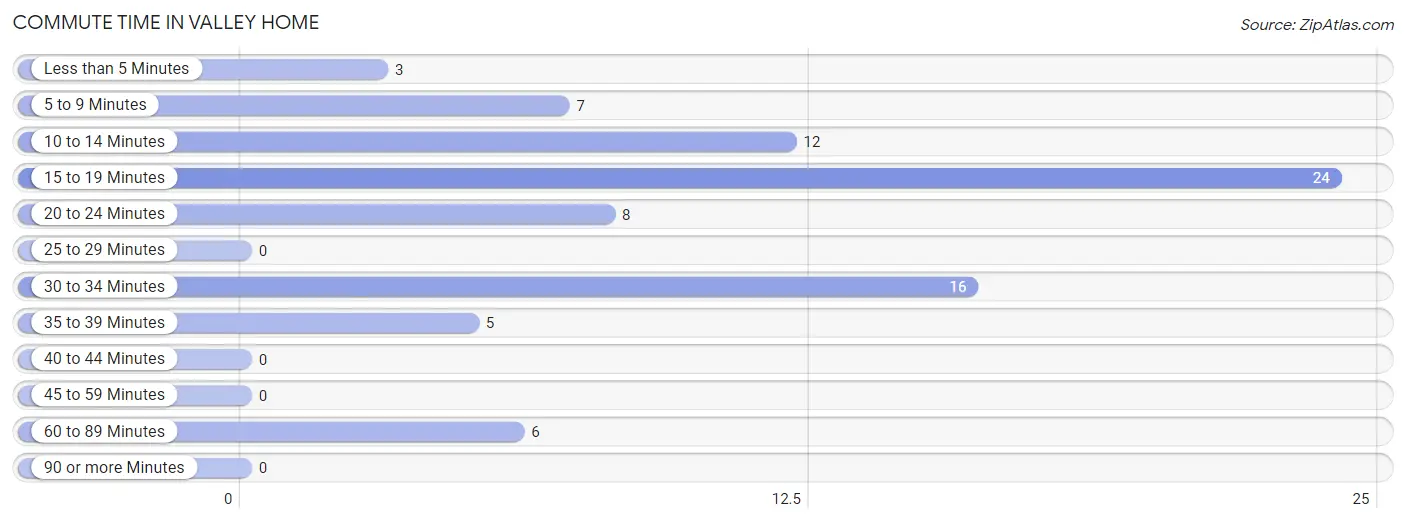
| Commute Time | # Commuters | % Commuters |
| Less than 5 Minutes | 3 | 3.7% |
| 5 to 9 Minutes | 7 | 8.6% |
| 10 to 14 Minutes | 12 | 14.8% |
| 15 to 19 Minutes | 24 | 29.6% |
| 20 to 24 Minutes | 8 | 9.9% |
| 25 to 29 Minutes | 0 | 0.0% |
| 30 to 34 Minutes | 16 | 19.8% |
| 35 to 39 Minutes | 5 | 6.2% |
| 40 to 44 Minutes | 0 | 0.0% |
| 45 to 59 Minutes | 0 | 0.0% |
| 60 to 89 Minutes | 6 | 7.4% |
| 90 or more Minutes | 0 | 0.0% |
Commute Time by Sex in Valley Home
The most common commute times in Valley Home are 15 to 19 minutes (24 commuters, 37.5%) for males and 20 to 24 minutes (8 commuters, 47.1%) for females.
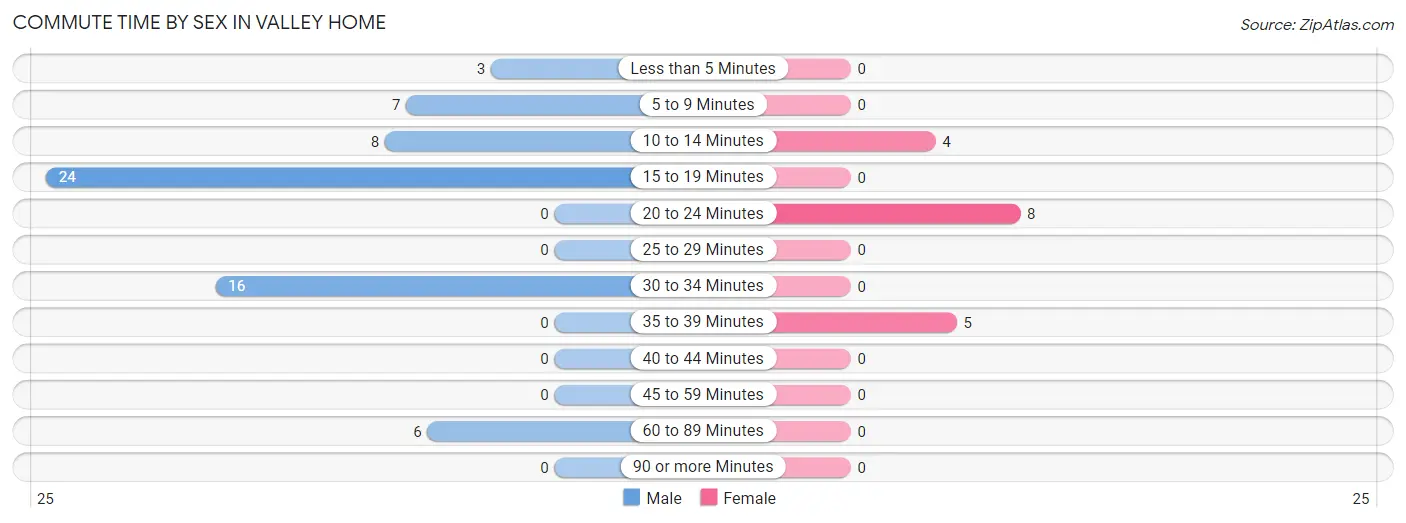
| Commute Time | Male | Female |
| Less than 5 Minutes | 3 (4.7%) | 0 (0.0%) |
| 5 to 9 Minutes | 7 (10.9%) | 0 (0.0%) |
| 10 to 14 Minutes | 8 (12.5%) | 4 (23.5%) |
| 15 to 19 Minutes | 24 (37.5%) | 0 (0.0%) |
| 20 to 24 Minutes | 0 (0.0%) | 8 (47.1%) |
| 25 to 29 Minutes | 0 (0.0%) | 0 (0.0%) |
| 30 to 34 Minutes | 16 (25.0%) | 0 (0.0%) |
| 35 to 39 Minutes | 0 (0.0%) | 5 (29.4%) |
| 40 to 44 Minutes | 0 (0.0%) | 0 (0.0%) |
| 45 to 59 Minutes | 0 (0.0%) | 0 (0.0%) |
| 60 to 89 Minutes | 6 (9.4%) | 0 (0.0%) |
| 90 or more Minutes | 0 (0.0%) | 0 (0.0%) |
Time of Departure to Work by Sex in Valley Home
The most frequent times of departure to work in Valley Home are 6:30 AM to 6:59 AM (27, 42.2%) for males and 8:00 AM to 8:29 AM (8, 47.1%) for females.
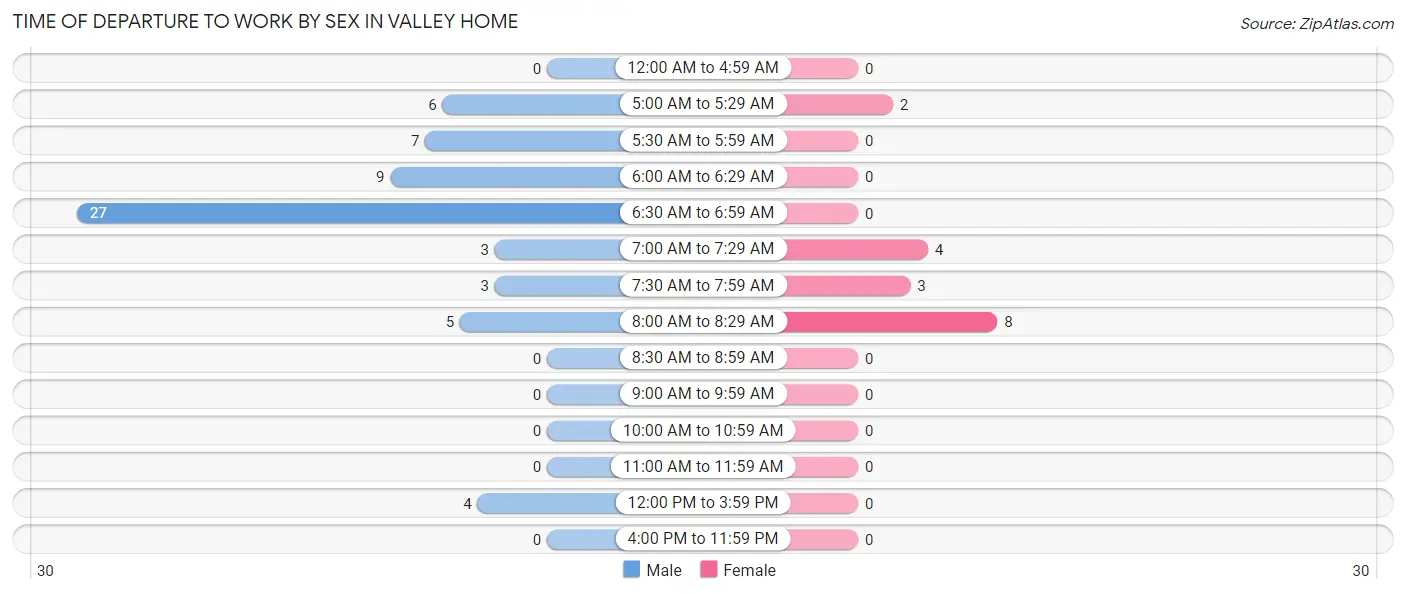
| Time of Departure | Male | Female |
| 12:00 AM to 4:59 AM | 0 (0.0%) | 0 (0.0%) |
| 5:00 AM to 5:29 AM | 6 (9.4%) | 2 (11.8%) |
| 5:30 AM to 5:59 AM | 7 (10.9%) | 0 (0.0%) |
| 6:00 AM to 6:29 AM | 9 (14.1%) | 0 (0.0%) |
| 6:30 AM to 6:59 AM | 27 (42.2%) | 0 (0.0%) |
| 7:00 AM to 7:29 AM | 3 (4.7%) | 4 (23.5%) |
| 7:30 AM to 7:59 AM | 3 (4.7%) | 3 (17.6%) |
| 8:00 AM to 8:29 AM | 5 (7.8%) | 8 (47.1%) |
| 8:30 AM to 8:59 AM | 0 (0.0%) | 0 (0.0%) |
| 9:00 AM to 9:59 AM | 0 (0.0%) | 0 (0.0%) |
| 10:00 AM to 10:59 AM | 0 (0.0%) | 0 (0.0%) |
| 11:00 AM to 11:59 AM | 0 (0.0%) | 0 (0.0%) |
| 12:00 PM to 3:59 PM | 4 (6.2%) | 0 (0.0%) |
| 4:00 PM to 11:59 PM | 0 (0.0%) | 0 (0.0%) |
| Total | 64 (100.0%) | 17 (100.0%) |
Housing Occupancy in Valley Home
Occupancy by Ownership in Valley Home
Of the total 101 dwellings in Valley Home, owner-occupied units account for 98 (97.0%), while renter-occupied units make up 3 (3.0%).
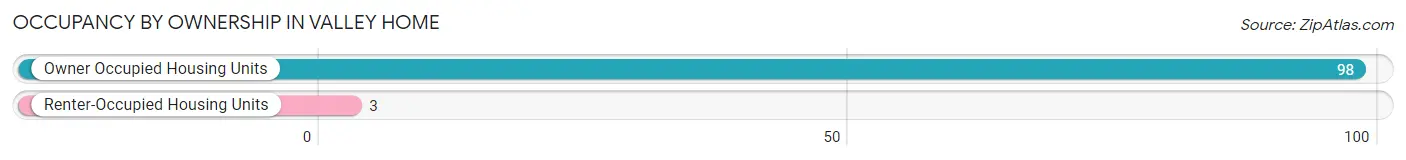
| Occupancy | # Housing Units | % Housing Units |
| Owner Occupied Housing Units | 98 | 97.0% |
| Renter-Occupied Housing Units | 3 | 3.0% |
| Total Occupied Housing Units | 101 | 100.0% |
Occupancy by Household Size in Valley Home
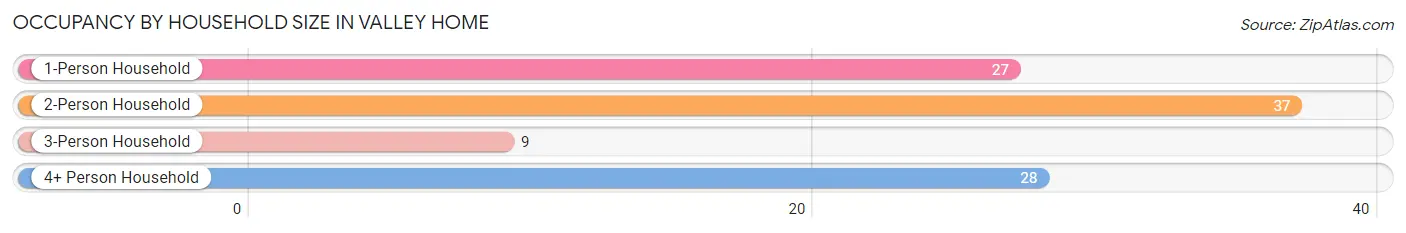
| Household Size | # Housing Units | % Housing Units |
| 1-Person Household | 27 | 26.7% |
| 2-Person Household | 37 | 36.6% |
| 3-Person Household | 9 | 8.9% |
| 4+ Person Household | 28 | 27.7% |
| Total Housing Units | 101 | 100.0% |
Occupancy by Ownership by Household Size in Valley Home
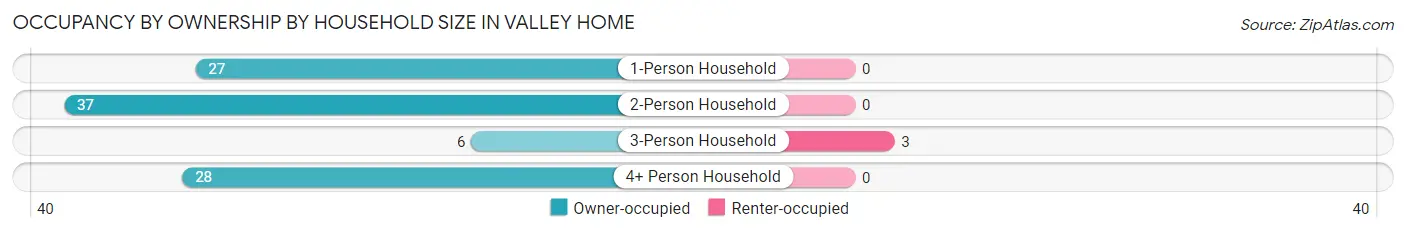
| Household Size | Owner-occupied | Renter-occupied |
| 1-Person Household | 27 (100.0%) | 0 (0.0%) |
| 2-Person Household | 37 (100.0%) | 0 (0.0%) |
| 3-Person Household | 6 (66.7%) | 3 (33.3%) |
| 4+ Person Household | 28 (100.0%) | 0 (0.0%) |
| Total Housing Units | 98 (97.0%) | 3 (3.0%) |
Occupancy by Educational Attainment in Valley Home
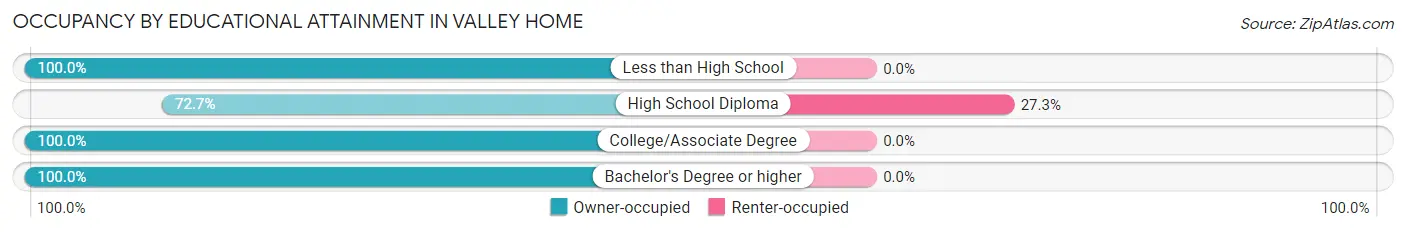
| Household Size | Owner-occupied | Renter-occupied |
| Less than High School | 3 (100.0%) | 0 (0.0%) |
| High School Diploma | 8 (72.7%) | 3 (27.3%) |
| College/Associate Degree | 76 (100.0%) | 0 (0.0%) |
| Bachelor's Degree or higher | 11 (100.0%) | 0 (0.0%) |
Occupancy by Age of Householder in Valley Home
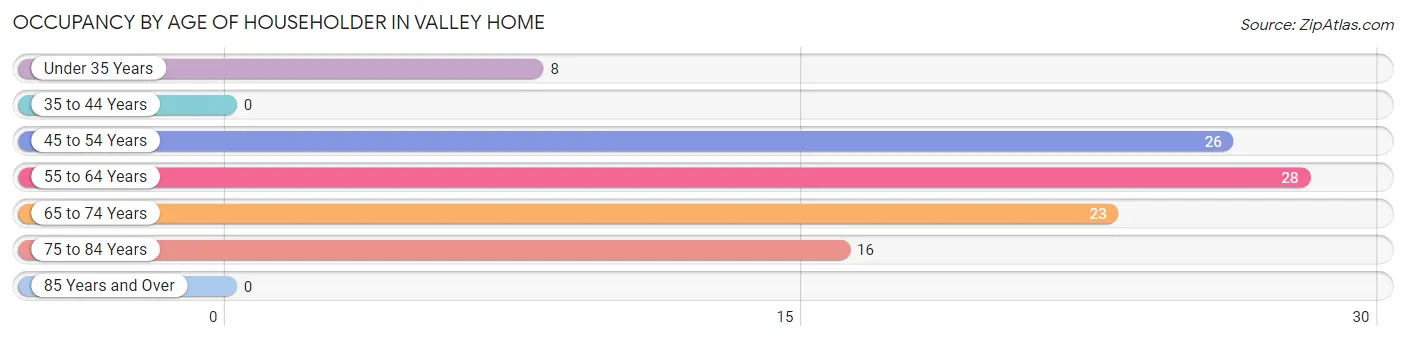
| Age Bracket | # Households | % Households |
| Under 35 Years | 8 | 7.9% |
| 35 to 44 Years | 0 | 0.0% |
| 45 to 54 Years | 26 | 25.7% |
| 55 to 64 Years | 28 | 27.7% |
| 65 to 74 Years | 23 | 22.8% |
| 75 to 84 Years | 16 | 15.8% |
| 85 Years and Over | 0 | 0.0% |
| Total | 101 | 100.0% |
Housing Finances in Valley Home
Median Income by Occupancy in Valley Home
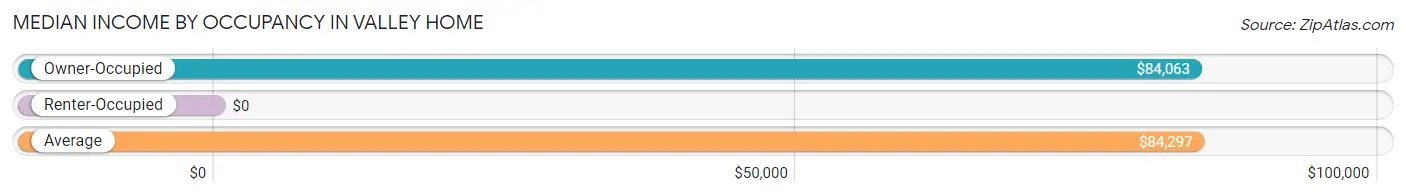
| Occupancy Type | # Households | Median Income |
| Owner-Occupied | 98 (97.0%) | $84,063 |
| Renter-Occupied | 3 (3.0%) | $0 |
| Average | 101 (100.0%) | $84,297 |
Occupancy by Householder Income Bracket in Valley Home
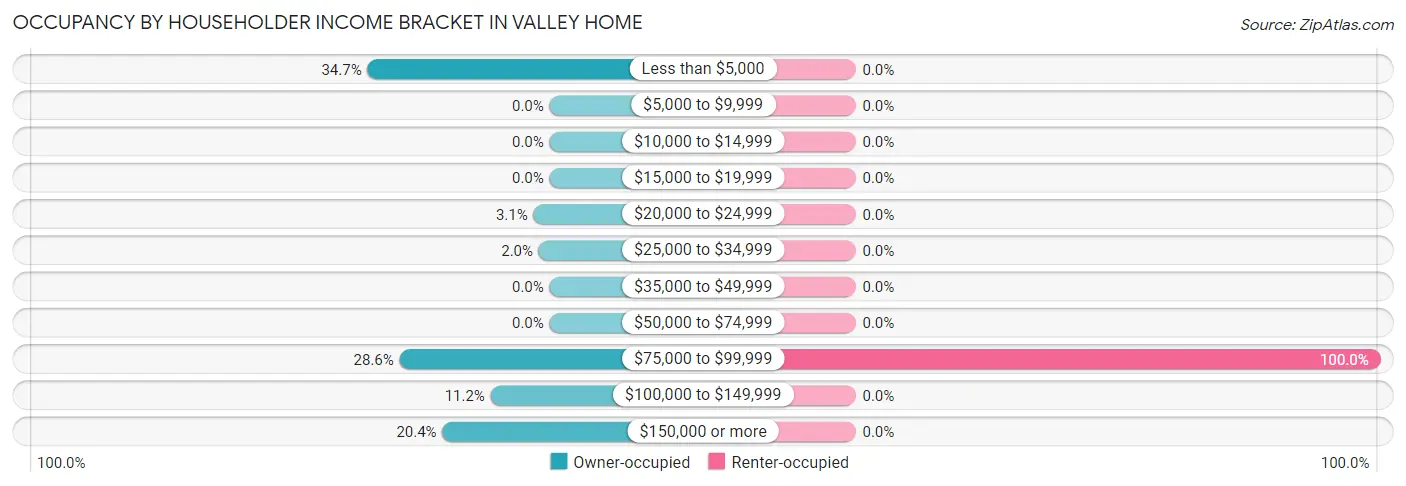
| Income Bracket | Owner-occupied | Renter-occupied |
| Less than $5,000 | 34 (34.7%) | 0 (0.0%) |
| $5,000 to $9,999 | 0 (0.0%) | 0 (0.0%) |
| $10,000 to $14,999 | 0 (0.0%) | 0 (0.0%) |
| $15,000 to $19,999 | 0 (0.0%) | 0 (0.0%) |
| $20,000 to $24,999 | 3 (3.1%) | 0 (0.0%) |
| $25,000 to $34,999 | 2 (2.0%) | 0 (0.0%) |
| $35,000 to $49,999 | 0 (0.0%) | 0 (0.0%) |
| $50,000 to $74,999 | 0 (0.0%) | 0 (0.0%) |
| $75,000 to $99,999 | 28 (28.6%) | 3 (100.0%) |
| $100,000 to $149,999 | 11 (11.2%) | 0 (0.0%) |
| $150,000 or more | 20 (20.4%) | 0 (0.0%) |
| Total | 98 (100.0%) | 3 (100.0%) |
Monthly Housing Cost Tiers in Valley Home
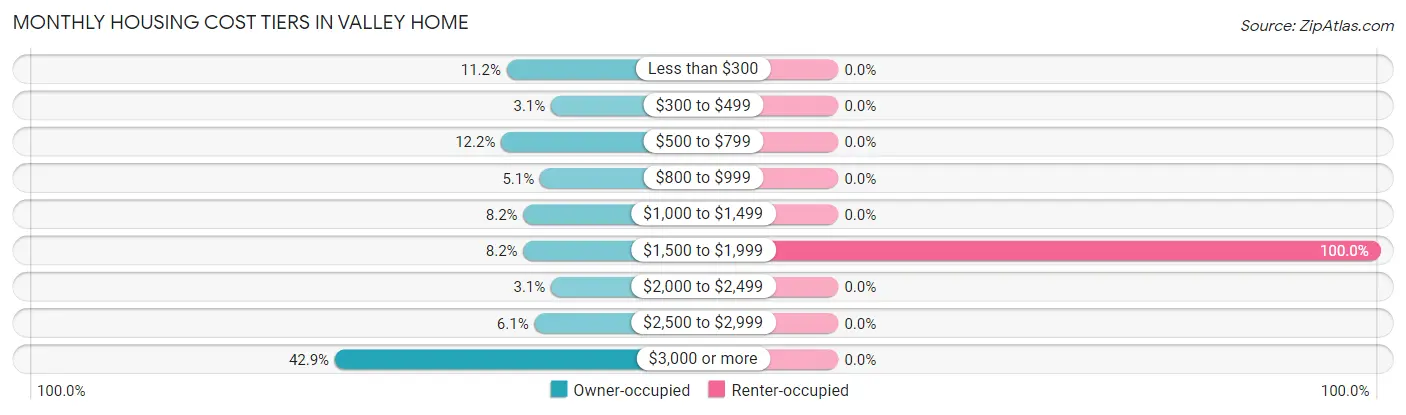
| Monthly Cost | Owner-occupied | Renter-occupied |
| Less than $300 | 11 (11.2%) | 0 (0.0%) |
| $300 to $499 | 3 (3.1%) | 0 (0.0%) |
| $500 to $799 | 12 (12.2%) | 0 (0.0%) |
| $800 to $999 | 5 (5.1%) | 0 (0.0%) |
| $1,000 to $1,499 | 8 (8.2%) | 0 (0.0%) |
| $1,500 to $1,999 | 8 (8.2%) | 3 (100.0%) |
| $2,000 to $2,499 | 3 (3.1%) | 0 (0.0%) |
| $2,500 to $2,999 | 6 (6.1%) | 0 (0.0%) |
| $3,000 or more | 42 (42.9%) | 0 (0.0%) |
| Total | 98 (100.0%) | 3 (100.0%) |
Physical Housing Characteristics in Valley Home
Housing Structures in Valley Home
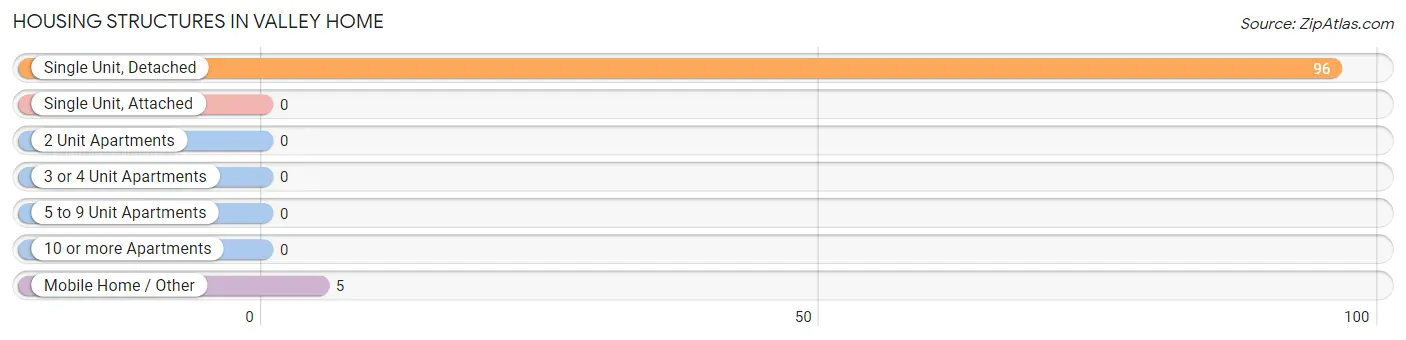
| Structure Type | # Housing Units | % Housing Units |
| Single Unit, Detached | 96 | 95.1% |
| Single Unit, Attached | 0 | 0.0% |
| 2 Unit Apartments | 0 | 0.0% |
| 3 or 4 Unit Apartments | 0 | 0.0% |
| 5 to 9 Unit Apartments | 0 | 0.0% |
| 10 or more Apartments | 0 | 0.0% |
| Mobile Home / Other | 5 | 5.0% |
| Total | 101 | 100.0% |
Housing Structures by Occupancy in Valley Home
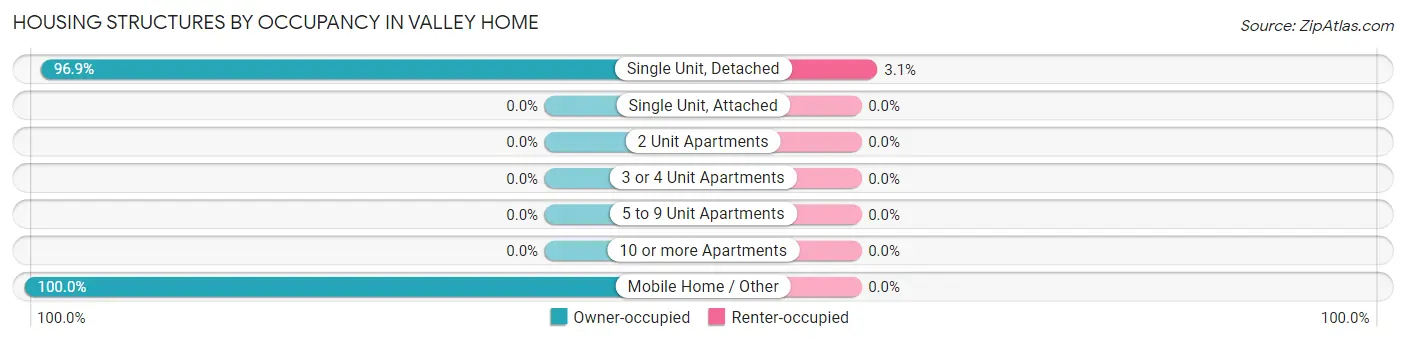
| Structure Type | Owner-occupied | Renter-occupied |
| Single Unit, Detached | 93 (96.9%) | 3 (3.1%) |
| Single Unit, Attached | 0 (0.0%) | 0 (0.0%) |
| 2 Unit Apartments | 0 (0.0%) | 0 (0.0%) |
| 3 or 4 Unit Apartments | 0 (0.0%) | 0 (0.0%) |
| 5 to 9 Unit Apartments | 0 (0.0%) | 0 (0.0%) |
| 10 or more Apartments | 0 (0.0%) | 0 (0.0%) |
| Mobile Home / Other | 5 (100.0%) | 0 (0.0%) |
| Total | 98 (97.0%) | 3 (3.0%) |
Housing Structures by Number of Rooms in Valley Home
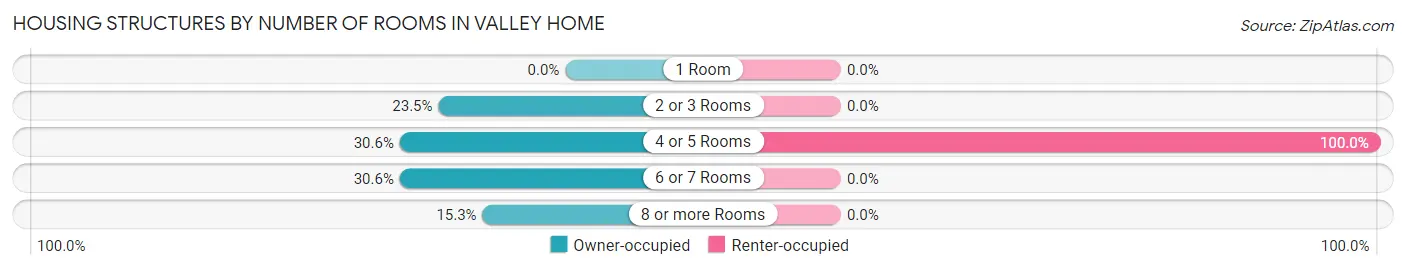
| Number of Rooms | Owner-occupied | Renter-occupied |
| 1 Room | 0 (0.0%) | 0 (0.0%) |
| 2 or 3 Rooms | 23 (23.5%) | 0 (0.0%) |
| 4 or 5 Rooms | 30 (30.6%) | 3 (100.0%) |
| 6 or 7 Rooms | 30 (30.6%) | 0 (0.0%) |
| 8 or more Rooms | 15 (15.3%) | 0 (0.0%) |
| Total | 98 (100.0%) | 3 (100.0%) |
Housing Structure by Heating Type in Valley Home
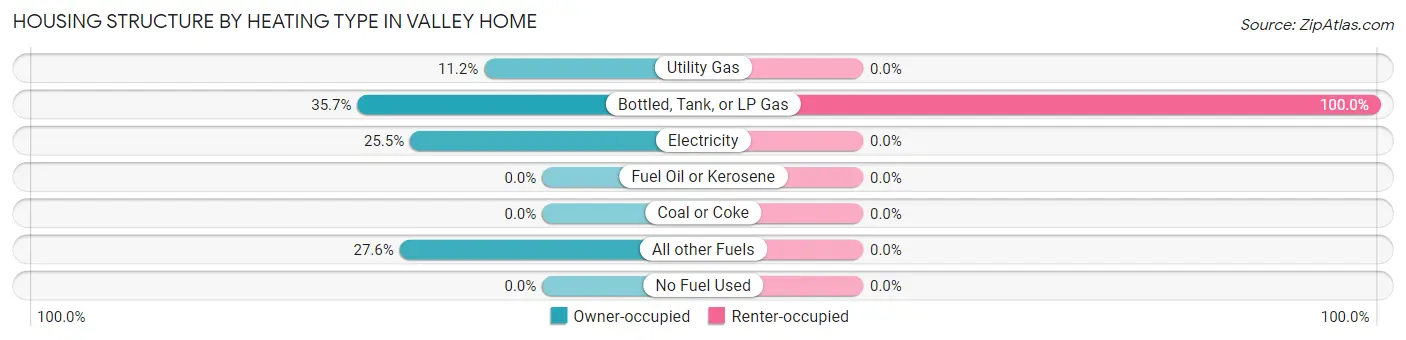
| Heating Type | Owner-occupied | Renter-occupied |
| Utility Gas | 11 (11.2%) | 0 (0.0%) |
| Bottled, Tank, or LP Gas | 35 (35.7%) | 3 (100.0%) |
| Electricity | 25 (25.5%) | 0 (0.0%) |
| Fuel Oil or Kerosene | 0 (0.0%) | 0 (0.0%) |
| Coal or Coke | 0 (0.0%) | 0 (0.0%) |
| All other Fuels | 27 (27.6%) | 0 (0.0%) |
| No Fuel Used | 0 (0.0%) | 0 (0.0%) |
| Total | 98 (100.0%) | 3 (100.0%) |
Household Vehicle Usage in Valley Home
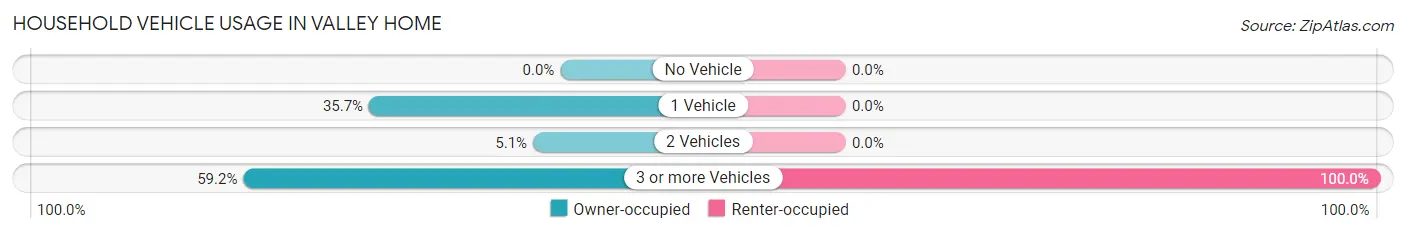
| Vehicles per Household | Owner-occupied | Renter-occupied |
| No Vehicle | 0 (0.0%) | 0 (0.0%) |
| 1 Vehicle | 35 (35.7%) | 0 (0.0%) |
| 2 Vehicles | 5 (5.1%) | 0 (0.0%) |
| 3 or more Vehicles | 58 (59.2%) | 3 (100.0%) |
| Total | 98 (100.0%) | 3 (100.0%) |
Real Estate & Mortgages in Valley Home
Real Estate and Mortgage Overview in Valley Home
| Characteristic | Without Mortgage | With Mortgage |
| Housing Units | 31 | 67 |
| Median Property Value | $445,000 | $802,900 |
| Median Household Income | - | - |
| Monthly Housing Costs | $575 | $42 |
| Real Estate Taxes | - | - |
Property Value by Mortgage Status in Valley Home
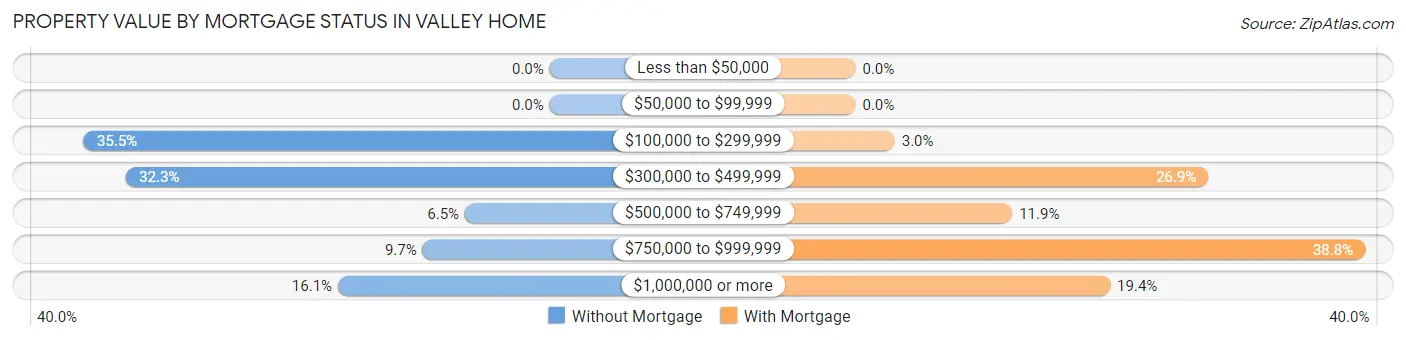
| Property Value | Without Mortgage | With Mortgage |
| Less than $50,000 | 0 (0.0%) | 0 (0.0%) |
| $50,000 to $99,999 | 0 (0.0%) | 0 (0.0%) |
| $100,000 to $299,999 | 11 (35.5%) | 2 (3.0%) |
| $300,000 to $499,999 | 10 (32.3%) | 18 (26.9%) |
| $500,000 to $749,999 | 2 (6.5%) | 8 (11.9%) |
| $750,000 to $999,999 | 3 (9.7%) | 26 (38.8%) |
| $1,000,000 or more | 5 (16.1%) | 13 (19.4%) |
| Total | 31 (100.0%) | 67 (100.0%) |
Household Income by Mortgage Status in Valley Home
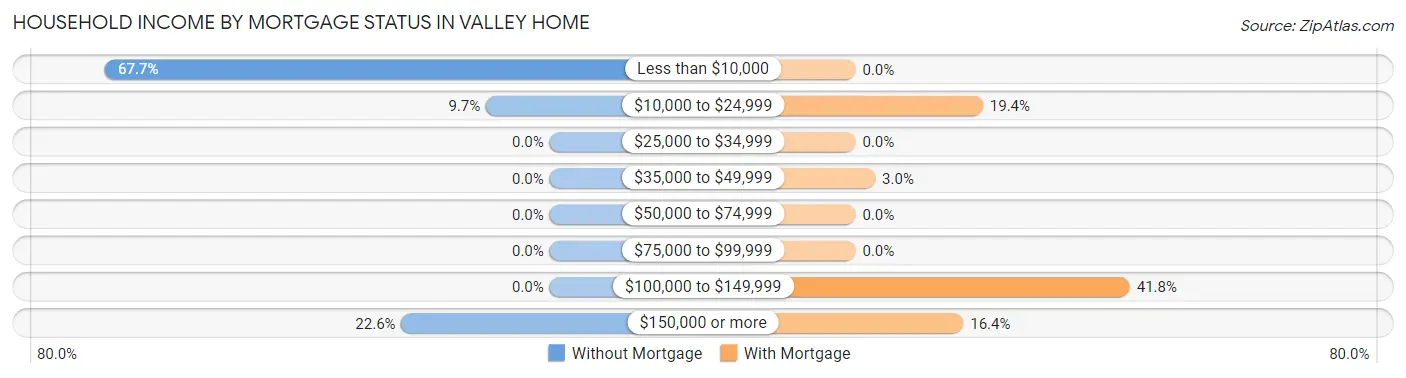
| Household Income | Without Mortgage | With Mortgage |
| Less than $10,000 | 21 (67.7%) | 0 (0.0%) |
| $10,000 to $24,999 | 3 (9.7%) | 13 (19.4%) |
| $25,000 to $34,999 | 0 (0.0%) | 0 (0.0%) |
| $35,000 to $49,999 | 0 (0.0%) | 2 (3.0%) |
| $50,000 to $74,999 | 0 (0.0%) | 0 (0.0%) |
| $75,000 to $99,999 | 0 (0.0%) | 0 (0.0%) |
| $100,000 to $149,999 | 0 (0.0%) | 28 (41.8%) |
| $150,000 or more | 7 (22.6%) | 11 (16.4%) |
| Total | 31 (100.0%) | 67 (100.0%) |
Property Value to Household Income Ratio in Valley Home
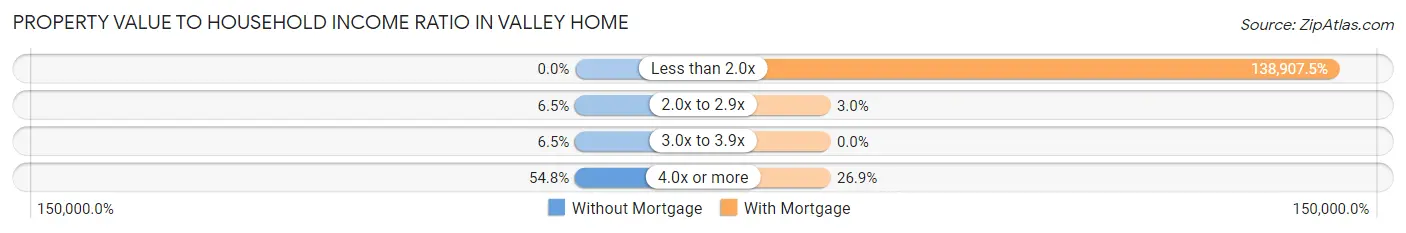
| Value-to-Income Ratio | Without Mortgage | With Mortgage |
| Less than 2.0x | 0 (0.0%) | 93,068 (138,907.5%) |
| 2.0x to 2.9x | 2 (6.5%) | 2 (3.0%) |
| 3.0x to 3.9x | 2 (6.5%) | 0 (0.0%) |
| 4.0x or more | 17 (54.8%) | 18 (26.9%) |
| Total | 31 (100.0%) | 67 (100.0%) |
Real Estate Taxes by Mortgage Status in Valley Home
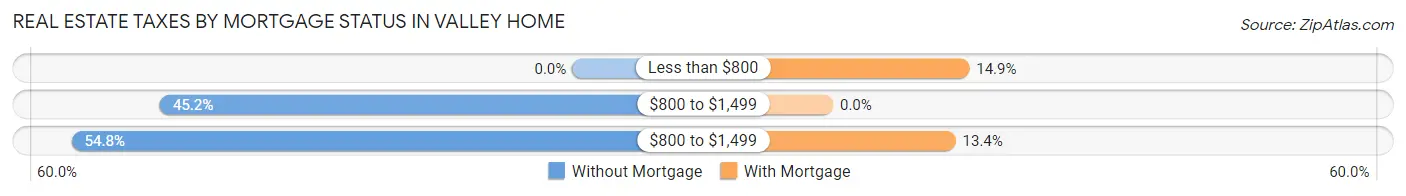
| Property Taxes | Without Mortgage | With Mortgage |
| Less than $800 | 0 (0.0%) | 10 (14.9%) |
| $800 to $1,499 | 14 (45.2%) | 0 (0.0%) |
| $800 to $1,499 | 17 (54.8%) | 9 (13.4%) |
| Total | 31 (100.0%) | 67 (100.0%) |
Health & Disability in Valley Home
Health Insurance Coverage by Age in Valley Home
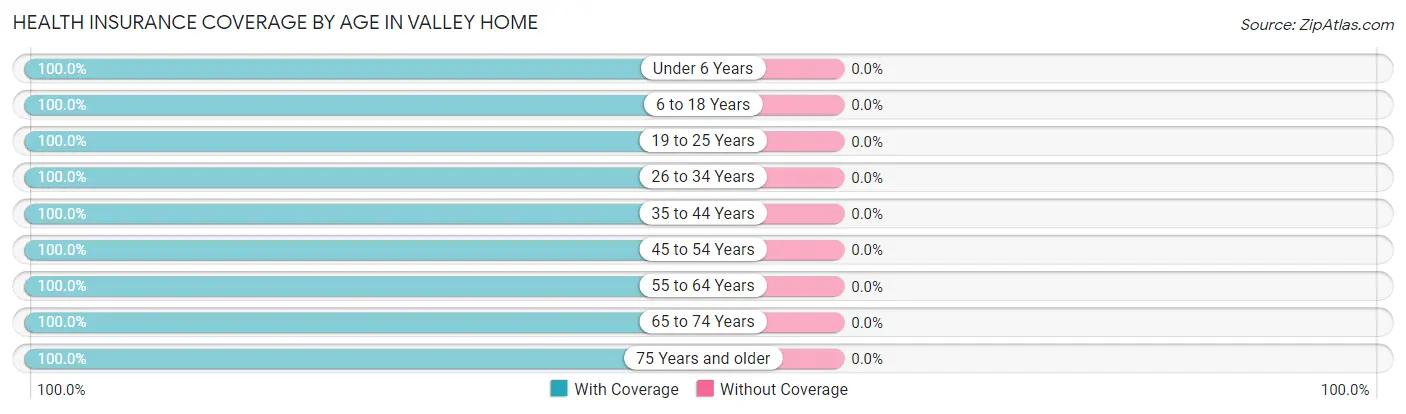
| Age Bracket | With Coverage | Without Coverage |
| Under 6 Years | 9 (100.0%) | 0 (0.0%) |
| 6 to 18 Years | 44 (100.0%) | 0 (0.0%) |
| 19 to 25 Years | 4 (100.0%) | 0 (0.0%) |
| 26 to 34 Years | 13 (100.0%) | 0 (0.0%) |
| 35 to 44 Years | 13 (100.0%) | 0 (0.0%) |
| 45 to 54 Years | 46 (100.0%) | 0 (0.0%) |
| 55 to 64 Years | 54 (100.0%) | 0 (0.0%) |
| 65 to 74 Years | 39 (100.0%) | 0 (0.0%) |
| 75 Years and older | 24 (100.0%) | 0 (0.0%) |
| Total | 246 (100.0%) | 0 (0.0%) |
Health Insurance Coverage by Citizenship Status in Valley Home
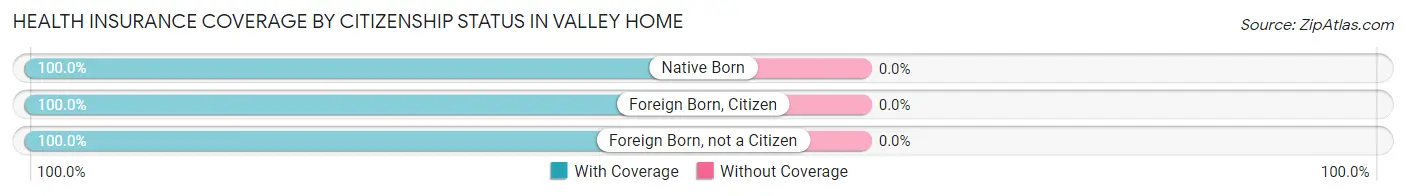
| Citizenship Status | With Coverage | Without Coverage |
| Native Born | 9 (100.0%) | 0 (0.0%) |
| Foreign Born, Citizen | 44 (100.0%) | 0 (0.0%) |
| Foreign Born, not a Citizen | 4 (100.0%) | 0 (0.0%) |
Health Insurance Coverage by Household Income in Valley Home
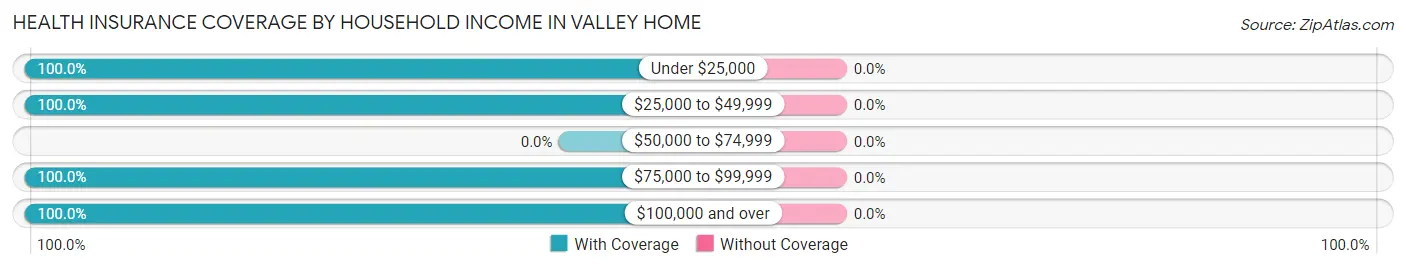
| Household Income | With Coverage | Without Coverage |
| Under $25,000 | 47 (100.0%) | 0 (0.0%) |
| $25,000 to $49,999 | 4 (100.0%) | 0 (0.0%) |
| $50,000 to $74,999 | 0 (0.0%) | 0 (0.0%) |
| $75,000 to $99,999 | 115 (100.0%) | 0 (0.0%) |
| $100,000 and over | 80 (100.0%) | 0 (0.0%) |
Public vs Private Health Insurance Coverage by Age in Valley Home
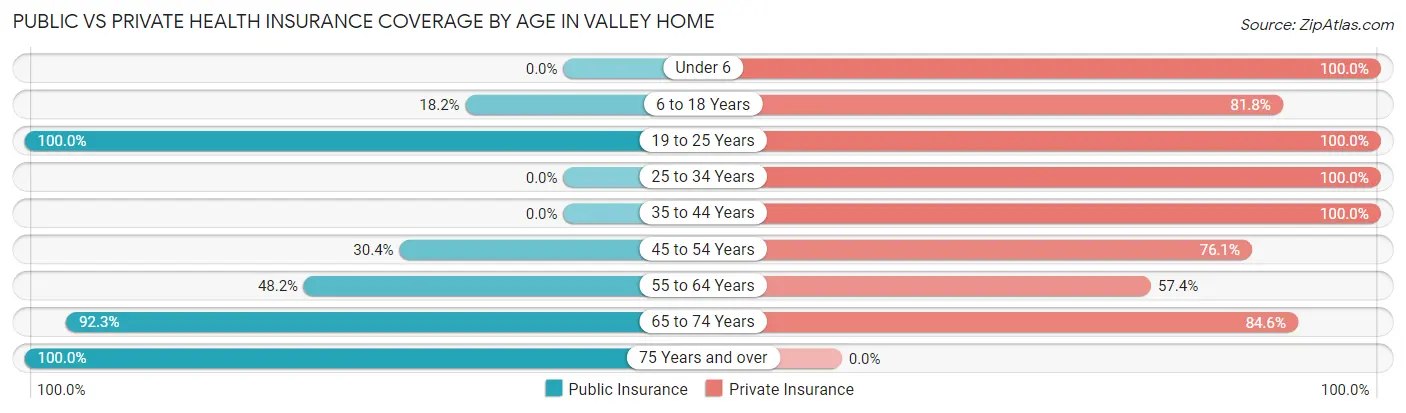
| Age Bracket | Public Insurance | Private Insurance |
| Under 6 | 0 (0.0%) | 9 (100.0%) |
| 6 to 18 Years | 8 (18.2%) | 36 (81.8%) |
| 19 to 25 Years | 4 (100.0%) | 4 (100.0%) |
| 25 to 34 Years | 0 (0.0%) | 13 (100.0%) |
| 35 to 44 Years | 0 (0.0%) | 13 (100.0%) |
| 45 to 54 Years | 14 (30.4%) | 35 (76.1%) |
| 55 to 64 Years | 26 (48.1%) | 31 (57.4%) |
| 65 to 74 Years | 36 (92.3%) | 33 (84.6%) |
| 75 Years and over | 24 (100.0%) | 0 (0.0%) |
| Total | 112 (45.5%) | 174 (70.7%) |
Disability Status by Sex by Age in Valley Home
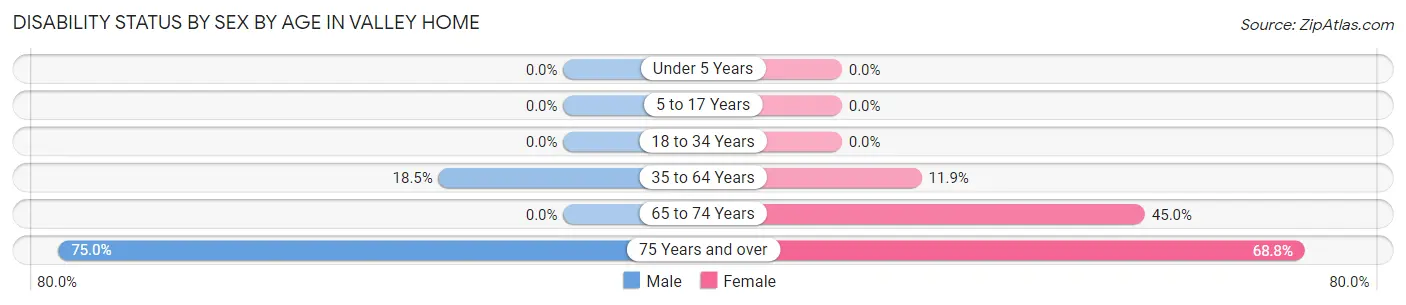
| Age Bracket | Male | Female |
| Under 5 Years | 0 (0.0%) | 0 (0.0%) |
| 5 to 17 Years | 0 (0.0%) | 0 (0.0%) |
| 18 to 34 Years | 0 (0.0%) | 0 (0.0%) |
| 35 to 64 Years | 10 (18.5%) | 7 (11.9%) |
| 65 to 74 Years | 0 (0.0%) | 9 (45.0%) |
| 75 Years and over | 6 (75.0%) | 11 (68.8%) |
Disability Class by Sex by Age in Valley Home
Disability Class: Hearing Difficulty
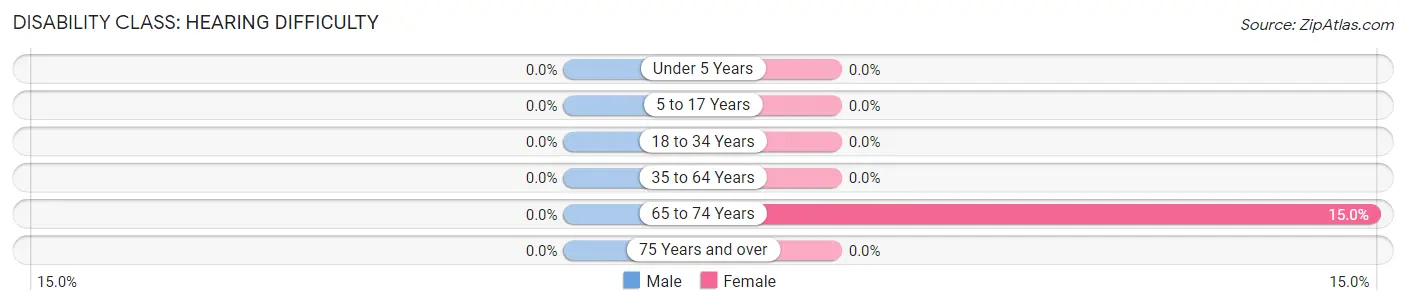
| Age Bracket | Male | Female |
| Under 5 Years | 0 (0.0%) | 0 (0.0%) |
| 5 to 17 Years | 0 (0.0%) | 0 (0.0%) |
| 18 to 34 Years | 0 (0.0%) | 0 (0.0%) |
| 35 to 64 Years | 0 (0.0%) | 0 (0.0%) |
| 65 to 74 Years | 0 (0.0%) | 3 (15.0%) |
| 75 Years and over | 0 (0.0%) | 0 (0.0%) |
Disability Class: Vision Difficulty
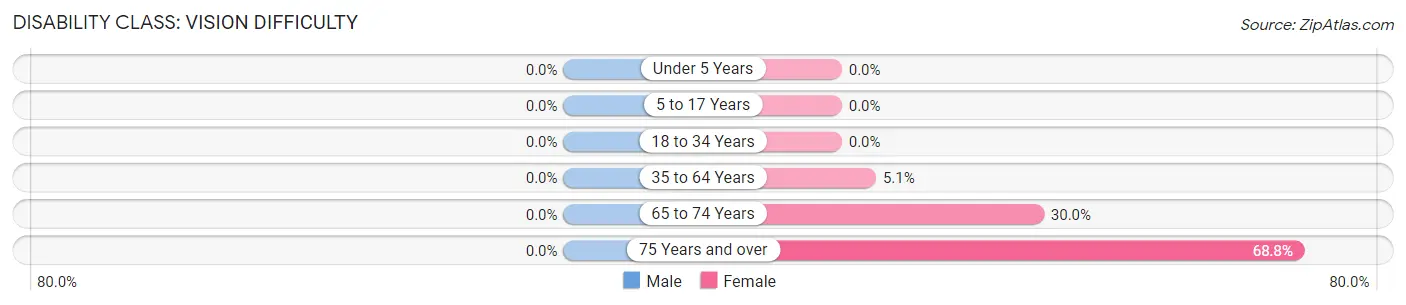
| Age Bracket | Male | Female |
| Under 5 Years | 0 (0.0%) | 0 (0.0%) |
| 5 to 17 Years | 0 (0.0%) | 0 (0.0%) |
| 18 to 34 Years | 0 (0.0%) | 0 (0.0%) |
| 35 to 64 Years | 0 (0.0%) | 3 (5.1%) |
| 65 to 74 Years | 0 (0.0%) | 6 (30.0%) |
| 75 Years and over | 0 (0.0%) | 11 (68.8%) |
Disability Class: Cognitive Difficulty
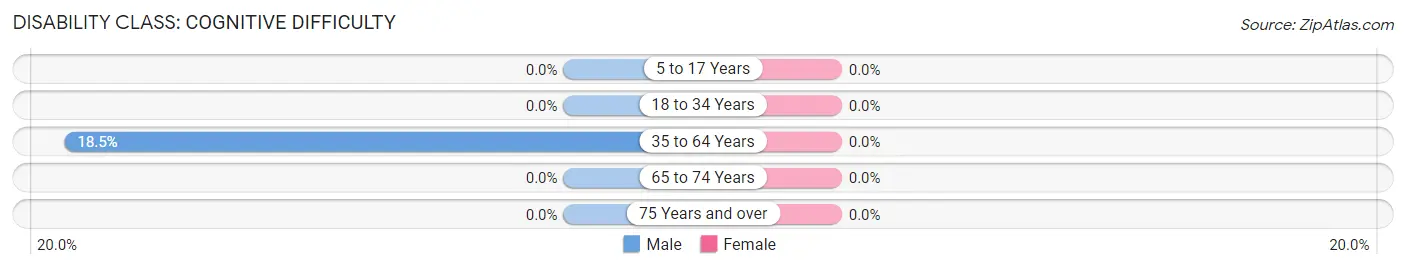
| Age Bracket | Male | Female |
| 5 to 17 Years | 0 (0.0%) | 0 (0.0%) |
| 18 to 34 Years | 0 (0.0%) | 0 (0.0%) |
| 35 to 64 Years | 10 (18.5%) | 0 (0.0%) |
| 65 to 74 Years | 0 (0.0%) | 0 (0.0%) |
| 75 Years and over | 0 (0.0%) | 0 (0.0%) |
Disability Class: Ambulatory Difficulty
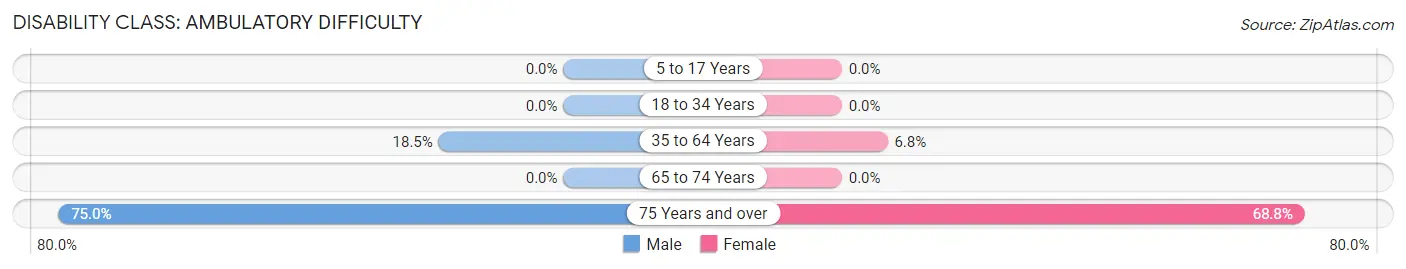
| Age Bracket | Male | Female |
| 5 to 17 Years | 0 (0.0%) | 0 (0.0%) |
| 18 to 34 Years | 0 (0.0%) | 0 (0.0%) |
| 35 to 64 Years | 10 (18.5%) | 4 (6.8%) |
| 65 to 74 Years | 0 (0.0%) | 0 (0.0%) |
| 75 Years and over | 6 (75.0%) | 11 (68.8%) |
Disability Class: Self-Care Difficulty
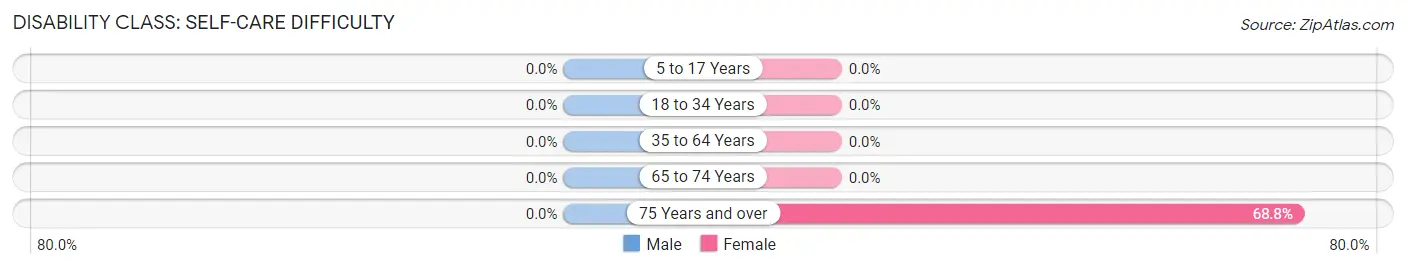
| Age Bracket | Male | Female |
| 5 to 17 Years | 0 (0.0%) | 0 (0.0%) |
| 18 to 34 Years | 0 (0.0%) | 0 (0.0%) |
| 35 to 64 Years | 0 (0.0%) | 0 (0.0%) |
| 65 to 74 Years | 0 (0.0%) | 0 (0.0%) |
| 75 Years and over | 0 (0.0%) | 11 (68.8%) |
Technology Access in Valley Home
Computing Device Access in Valley Home
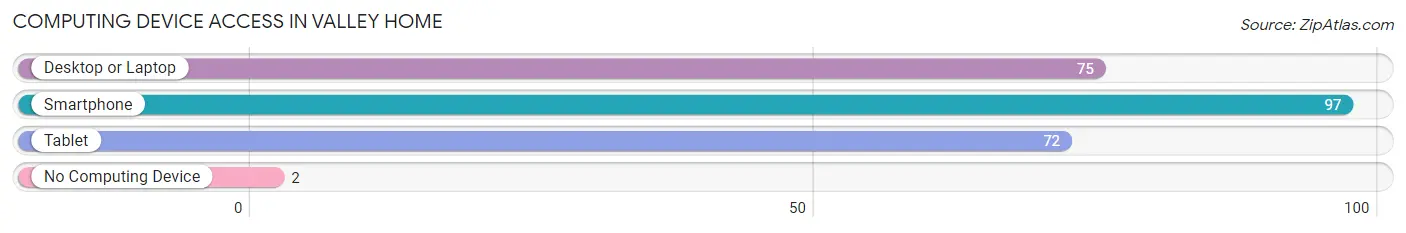
| Device Type | # Households | % Households |
| Desktop or Laptop | 75 | 74.3% |
| Smartphone | 97 | 96.0% |
| Tablet | 72 | 71.3% |
| No Computing Device | 2 | 2.0% |
| Total | 101 | 100.0% |
Internet Access in Valley Home
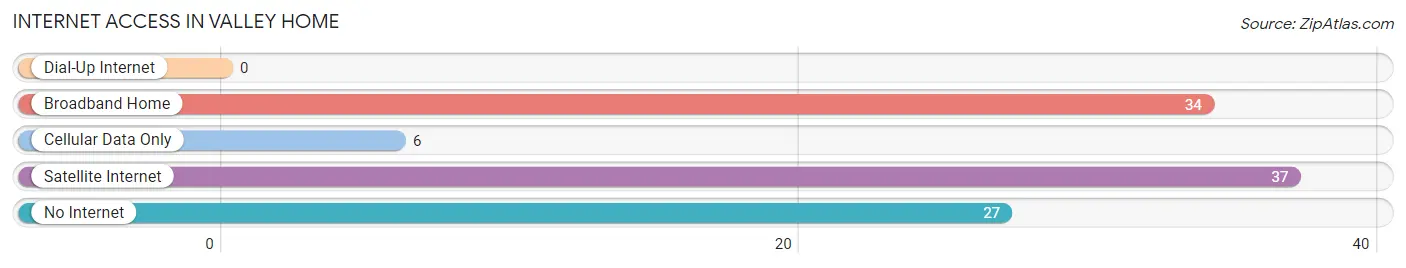
| Internet Type | # Households | % Households |
| Dial-Up Internet | 0 | 0.0% |
| Broadband Home | 34 | 33.7% |
| Cellular Data Only | 6 | 5.9% |
| Satellite Internet | 37 | 36.6% |
| No Internet | 27 | 26.7% |
| Total | 101 | 100.0% |
Valley Home Summary
Valley Home is an unincorporated community located in Stanislaus County, California. It is situated in the San Joaquin Valley, approximately 8 miles east of Oakdale and about 40 miles east of Modesto. The population of Valley Home was estimated to be around 1,000 in 2020.
Geography
Valley Home is located at an elevation of approximately 200 feet above sea level. The area is characterized by rolling hills and flat plains. The climate is semi-arid, with hot summers and mild winters. The average annual precipitation is approximately 10 inches.
The community is located in the San Joaquin Valley, which is one of the most productive agricultural regions in the world. The valley is home to a variety of crops, including grapes, almonds, walnuts, tomatoes, and cotton.
Economy
The economy of Valley Home is largely based on agriculture. The area is home to a variety of crops, including grapes, almonds, walnuts, tomatoes, and cotton. The area is also home to several wineries and vineyards.
In addition to agriculture, Valley Home is home to a variety of small businesses, including restaurants, retail stores, and service providers. The community is also home to a number of small manufacturing companies.
Demographics
The population of Valley Home was estimated to be around 1,000 in 2020. The racial makeup of the community is predominantly white (90.2%), followed by Hispanic or Latino (7.2%), and Asian (1.2%).
The median household income in Valley Home is $50,000, which is slightly lower than the median household income for the state of California ($63,783). The median home value in Valley Home is $250,000, which is slightly higher than the median home value for the state of California ($552,500).
Conclusion
Valley Home is an unincorporated community located in Stanislaus County, California. It is situated in the San Joaquin Valley, approximately 8 miles east of Oakdale and about 40 miles east of Modesto. The population of Valley Home was estimated to be around 1,000 in 2020. The economy of Valley Home is largely based on agriculture, with a variety of crops grown in the area. The racial makeup of the community is predominantly white, followed by Hispanic or Latino, and Asian. The median household income in Valley Home is $50,000, which is slightly lower than the median household income for the state of California.
Common Questions
What is Per Capita Income in Valley Home?
Per Capita income in Valley Home is $44,426.
What is the Median Family Income in Valley Home?
Median Family Income in Valley Home is $93,864.
What is the Median Household income in Valley Home?
Median Household Income in Valley Home is $84,297.
What is Income or Wage Gap in Valley Home?
Income or Wage Gap in Valley Home is 37.9%.
Women in Valley Home earn 62.1 cents for every dollar earned by a man.
What is Inequality or Gini Index in Valley Home?
Inequality or Gini Index in Valley Home is 0.56.
What is the Total Population of Valley Home?
Total Population of Valley Home is 246.
What is the Total Male Population of Valley Home?
Total Male Population of Valley Home is 117.
What is the Total Female Population of Valley Home?
Total Female Population of Valley Home is 129.
What is the Ratio of Males per 100 Females in Valley Home?
There are 90.70 Males per 100 Females in Valley Home.
What is the Ratio of Females per 100 Males in Valley Home?
There are 110.26 Females per 100 Males in Valley Home.
What is the Median Population Age in Valley Home?
Median Population Age in Valley Home is 50.5 Years.
What is the Average Family Size in Valley Home
Average Family Size in Valley Home is 3.0 People.
What is the Average Household Size in Valley Home
Average Household Size in Valley Home is 2.4 People.
How Large is the Labor Force in Valley Home?
There are 112 People in the Labor Forcein in Valley Home.
What is the Percentage of People in the Labor Force in Valley Home?
48.9% of People are in the Labor Force in Valley Home.
What is the Unemployment Rate in Valley Home?
Unemployment Rate in Valley Home is 8.9%.