Cities with the Highest Percentage of Families with Income Below $10,000 in Utah
RELATED REPORTS & OPTIONS
Family Income | $0-10k
Utah
Compare Cities
Map of Cities with the Highest Percentage of Families with Income Below $10,000 in Utah
0.0%
40.0%
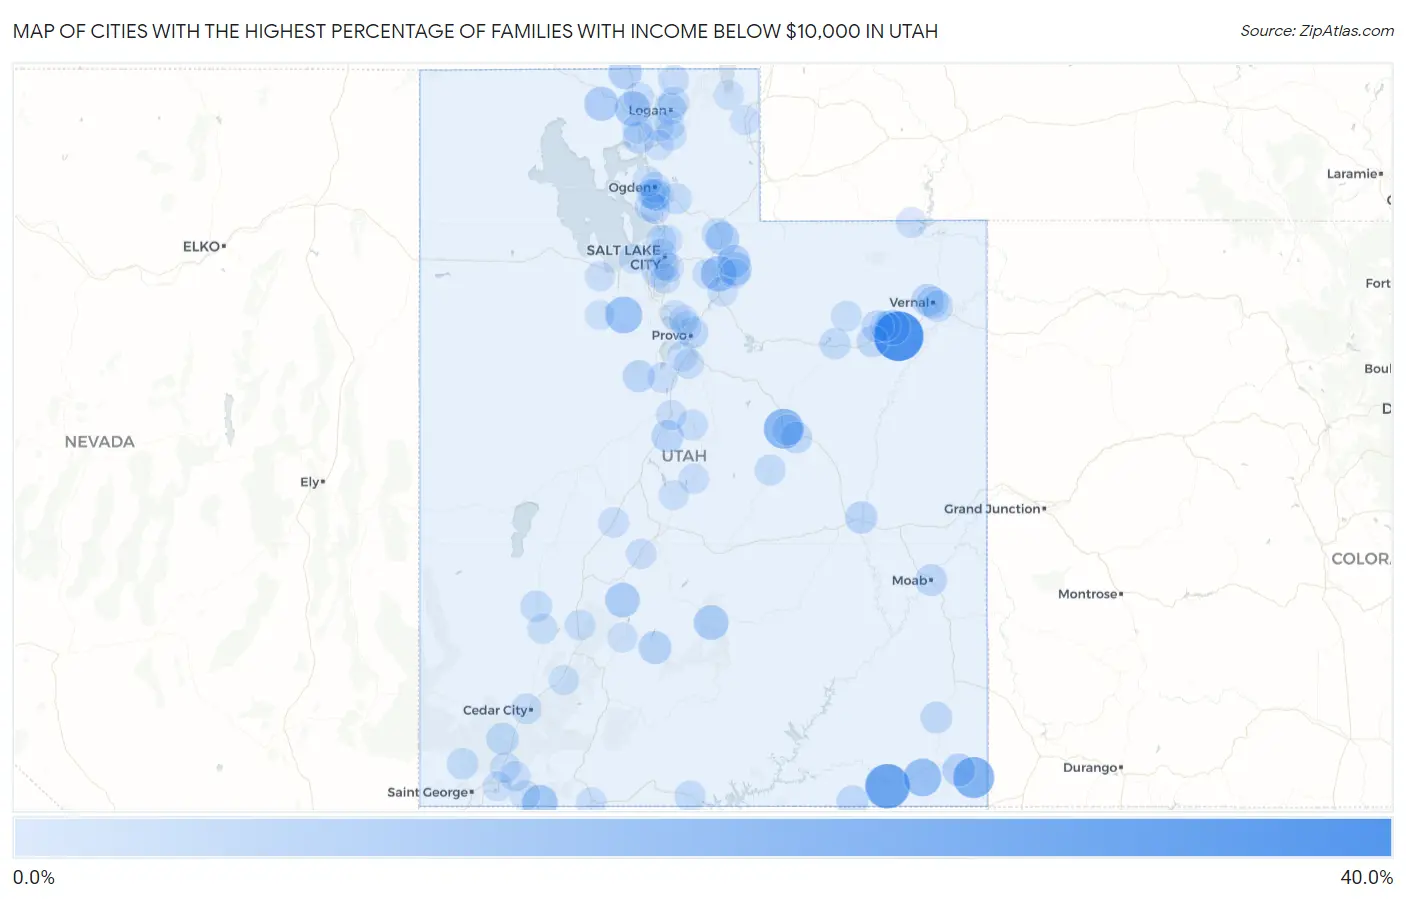
Cities with the Highest Percentage of Families with Income Below $10,000 in Utah
| City | Families with Income < $10k | vs State | vs National | |
| 1. | Randlett | 36.8% | 1.7%(+35.1)#1 | 3.1%(+33.7)#263 |
| 2. | Halchita | 27.5% | 1.7%(+25.8)#2 | 3.1%(+24.4)#489 |
| 3. | Aneth | 21.0% | 1.7%(+19.3)#3 | 3.1%(+17.9)#822 |
| 4. | West Wood | 19.0% | 1.7%(+17.3)#4 | 3.1%(+15.9)#1,003 |
| 5. | Tselakai Dezza | 15.0% | 1.7%(+13.3)#5 | 3.1%(+11.9)#1,466 |
| 6. | Ophir | 13.3% | 1.7%(+11.6)#6 | 3.1%(+10.2)#1,827 |
| 7. | Hideout | 11.5% | 1.7%(+9.80)#7 | 3.1%(+8.40)#2,292 |
| 8. | Hildale | 10.8% | 1.7%(+9.10)#8 | 3.1%(+7.70)#2,526 |
| 9. | Fort Duchesne | 10.5% | 1.7%(+8.80)#9 | 3.1%(+7.40)#2,651 |
| 10. | Garland | 10.3% | 1.7%(+8.60)#10 | 3.1%(+7.20)#2,712 |
| 11. | Teasdale | 9.7% | 1.7%(+8.00)#11 | 3.1%(+6.60)#3,021 |
| 12. | Marysvale | 9.6% | 1.7%(+7.90)#12 | 3.1%(+6.50)#3,055 |
| 13. | Howell | 8.8% | 1.7%(+7.10)#13 | 3.1%(+5.70)#3,478 |
| 14. | Marion | 7.9% | 1.7%(+6.20)#14 | 3.1%(+4.80)#3,989 |
| 15. | Portage | 7.5% | 1.7%(+5.80)#15 | 3.1%(+4.40)#4,278 |
| 16. | Hoytsville | 7.4% | 1.7%(+5.70)#16 | 3.1%(+4.30)#4,327 |
| 17. | Antimony | 6.9% | 1.7%(+5.20)#17 | 3.1%(+3.80)#4,782 |
| 18. | Oakley | 6.8% | 1.7%(+5.10)#18 | 3.1%(+3.70)#4,816 |
| 19. | Montezuma Creek | 6.8% | 1.7%(+5.10)#19 | 3.1%(+3.70)#4,856 |
| 20. | Maeser | 5.7% | 1.7%(+4.00)#20 | 3.1%(+2.60)#5,976 |
| 21. | Levan | 5.7% | 1.7%(+4.00)#21 | 3.1%(+2.60)#6,025 |
| 22. | Green River | 5.6% | 1.7%(+3.90)#22 | 3.1%(+2.50)#6,162 |
| 23. | Eureka | 5.1% | 1.7%(+3.40)#23 | 3.1%(+2.00)#6,827 |
| 24. | Corinne | 5.1% | 1.7%(+3.40)#24 | 3.1%(+2.00)#6,828 |
| 25. | Roosevelt | 5.0% | 1.7%(+3.30)#25 | 3.1%(+1.90)#6,918 |
| 26. | New Harmony | 5.0% | 1.7%(+3.30)#26 | 3.1%(+1.90)#7,016 |
| 27. | Vernal | 4.9% | 1.7%(+3.20)#27 | 3.1%(+1.80)#7,073 |
| 28. | Blanding | 4.8% | 1.7%(+3.10)#28 | 3.1%(+1.70)#7,250 |
| 29. | Provo | 4.7% | 1.7%(+3.00)#29 | 3.1%(+1.60)#7,339 |
| 30. | Moab | 4.7% | 1.7%(+3.00)#30 | 3.1%(+1.60)#7,394 |
| 31. | Oljato Monument Valley | 4.6% | 1.7%(+2.90)#31 | 3.1%(+1.50)#7,598 |
| 32. | Logan | 4.5% | 1.7%(+2.80)#32 | 3.1%(+1.40)#7,629 |
| 33. | Wellington | 4.5% | 1.7%(+2.80)#33 | 3.1%(+1.40)#7,718 |
| 34. | Myton | 4.5% | 1.7%(+2.80)#34 | 3.1%(+1.40)#7,763 |
| 35. | Naples | 4.4% | 1.7%(+2.70)#35 | 3.1%(+1.30)#7,875 |
| 36. | Coalville | 4.4% | 1.7%(+2.70)#36 | 3.1%(+1.30)#7,889 |
| 37. | Milford | 4.3% | 1.7%(+2.60)#37 | 3.1%(+1.20)#8,058 |
| 38. | South Ogden | 4.1% | 1.7%(+2.40)#38 | 3.1%(+1.000)#8,362 |
| 39. | Dammeron Valley | 4.1% | 1.7%(+2.40)#39 | 3.1%(+1.000)#8,485 |
| 40. | Duchesne | 3.9% | 1.7%(+2.20)#40 | 3.1%(+0.800)#8,828 |
| 41. | White | 3.8% | 1.7%(+2.10)#41 | 3.1%(+0.700)#8,981 |
| 42. | North Logan | 3.7% | 1.7%(+2.00)#42 | 3.1%(+0.600)#9,163 |
| 43. | Mountain Green | 3.7% | 1.7%(+2.00)#43 | 3.1%(+0.600)#9,200 |
| 44. | Clearfield | 3.6% | 1.7%(+1.90)#44 | 3.1%(+0.500)#9,334 |
| 45. | Big Water | 3.6% | 1.7%(+1.90)#45 | 3.1%(+0.500)#9,493 |
| 46. | Washington Terrace | 3.5% | 1.7%(+1.80)#46 | 3.1%(+0.400)#9,575 |
| 47. | Taylorsville | 3.4% | 1.7%(+1.70)#47 | 3.1%(+0.300)#9,742 |
| 48. | Price | 3.4% | 1.7%(+1.70)#48 | 3.1%(+0.300)#9,792 |
| 49. | Huntington | 3.3% | 1.7%(+1.60)#49 | 3.1%(+0.200)#10,071 |
| 50. | Ogden | 3.2% | 1.7%(+1.50)#50 | 3.1%(+0.100)#10,193 |
| 51. | South Salt Lake | 3.0% | 1.7%(+1.30)#51 | 3.1%(-0.100)#10,694 |
| 52. | Fountain Green | 3.0% | 1.7%(+1.30)#52 | 3.1%(-0.100)#10,815 |
| 53. | Cedar City | 2.8% | 1.7%(+1.10)#53 | 3.1%(-0.300)#11,193 |
| 54. | Paradise | 2.8% | 1.7%(+1.10)#54 | 3.1%(-0.300)#11,363 |
| 55. | Altamont | 2.8% | 1.7%(+1.10)#55 | 3.1%(-0.300)#11,388 |
| 56. | Beaver | 2.7% | 1.7%(+1.00)#56 | 3.1%(-0.400)#11,533 |
| 57. | Richfield | 2.6% | 1.7%(+0.900)#57 | 3.1%(-0.500)#11,736 |
| 58. | Fillmore | 2.6% | 1.7%(+0.900)#58 | 3.1%(-0.500)#11,800 |
| 59. | Goshen | 2.6% | 1.7%(+0.900)#59 | 3.1%(-0.500)#11,865 |
| 60. | Fielding | 2.6% | 1.7%(+0.900)#60 | 3.1%(-0.500)#11,880 |
| 61. | Manila | 2.6% | 1.7%(+0.900)#61 | 3.1%(-0.500)#11,911 |
| 62. | Layton | 2.5% | 1.7%(+0.800)#62 | 3.1%(-0.600)#11,958 |
| 63. | Bountiful | 2.5% | 1.7%(+0.800)#63 | 3.1%(-0.600)#11,973 |
| 64. | Nephi | 2.5% | 1.7%(+0.800)#64 | 3.1%(-0.600)#12,054 |
| 65. | Woods Cross | 2.4% | 1.7%(+0.700)#65 | 3.1%(-0.700)#12,295 |
| 66. | Park City | 2.4% | 1.7%(+0.700)#66 | 3.1%(-0.700)#12,317 |
| 67. | Manti | 2.4% | 1.7%(+0.700)#67 | 3.1%(-0.700)#12,365 |
| 68. | Toquerville | 2.4% | 1.7%(+0.700)#68 | 3.1%(-0.700)#12,398 |
| 69. | Ballard | 2.4% | 1.7%(+0.700)#69 | 3.1%(-0.700)#12,414 |
| 70. | Benjamin | 2.4% | 1.7%(+0.700)#70 | 3.1%(-0.700)#12,460 |
| 71. | Virgin | 2.4% | 1.7%(+0.700)#71 | 3.1%(-0.700)#12,470 |
| 72. | Richmond | 2.3% | 1.7%(+0.600)#72 | 3.1%(-0.800)#12,686 |
| 73. | Marriott Slaterville | 2.3% | 1.7%(+0.600)#73 | 3.1%(-0.800)#12,707 |
| 74. | Salt Lake City | 2.2% | 1.7%(+0.500)#74 | 3.1%(-0.900)#12,833 |
| 75. | Midvale | 2.2% | 1.7%(+0.500)#75 | 3.1%(-0.900)#12,870 |
| 76. | Heber | 2.2% | 1.7%(+0.500)#76 | 3.1%(-0.900)#12,890 |
| 77. | Kanab | 2.2% | 1.7%(+0.500)#77 | 3.1%(-0.900)#12,953 |
| 78. | Minersville | 2.2% | 1.7%(+0.500)#78 | 3.1%(-0.900)#13,056 |
| 79. | Magna | 2.1% | 1.7%(+0.400)#79 | 3.1%(-1.000)#13,168 |
| 80. | Salem | 2.1% | 1.7%(+0.400)#80 | 3.1%(-1.000)#13,227 |
| 81. | Paragonah | 2.1% | 1.7%(+0.400)#81 | 3.1%(-1.000)#13,383 |
| 82. | Orem | 2.0% | 1.7%(+0.300)#82 | 3.1%(-1.10)#13,441 |
| 83. | American Fork | 2.0% | 1.7%(+0.300)#83 | 3.1%(-1.10)#13,459 |
| 84. | Grantsville | 2.0% | 1.7%(+0.300)#84 | 3.1%(-1.10)#13,503 |
| 85. | Wellsville | 2.0% | 1.7%(+0.300)#85 | 3.1%(-1.10)#13,563 |
| 86. | East Basin | 2.0% | 1.7%(+0.300)#86 | 3.1%(-1.10)#13,570 |
| 87. | Gunnison | 2.0% | 1.7%(+0.300)#87 | 3.1%(-1.10)#13,572 |
| 88. | Circleville | 2.0% | 1.7%(+0.300)#88 | 3.1%(-1.10)#13,708 |
| 89. | Laketown | 2.0% | 1.7%(+0.300)#89 | 3.1%(-1.10)#13,736 |
| 90. | Hurricane | 1.9% | 1.7%(+0.200)#90 | 3.1%(-1.20)#13,814 |
| 91. | Lindon | 1.9% | 1.7%(+0.200)#91 | 3.1%(-1.20)#13,829 |
| 92. | Riverdale | 1.9% | 1.7%(+0.200)#92 | 3.1%(-1.20)#13,846 |
| 93. | Kamas | 1.9% | 1.7%(+0.200)#93 | 3.1%(-1.20)#13,918 |
| 94. | Apple Valley | 1.9% | 1.7%(+0.200)#94 | 3.1%(-1.20)#13,962 |
| 95. | Randolph | 1.9% | 1.7%(+0.200)#95 | 3.1%(-1.20)#13,977 |
| 96. | Millcreek | 1.8% | 1.7%(+0.100)#96 | 3.1%(-1.30)#14,065 |
| 97. | Hyrum | 1.8% | 1.7%(+0.100)#97 | 3.1%(-1.30)#14,144 |
| 98. | Mantua | 1.8% | 1.7%(+0.100)#98 | 3.1%(-1.30)#14,261 |
| 99. | Bear River City | 1.8% | 1.7%(+0.100)#99 | 3.1%(-1.30)#14,296 |
| 100. | Rush Valley | 1.8% | 1.7%(+0.100)#100 | 3.1%(-1.30)#14,336 |
Common Questions
What are the Top 10 Cities with the Highest Percentage of Families with Income Below $10,000 in Utah?
Top 10 Cities with the Highest Percentage of Families with Income Below $10,000 in Utah are:
#1
36.8%
#2
27.5%
#3
21.0%
#4
19.0%
#5
15.0%
#6
13.3%
#7
11.5%
#8
10.8%
#9
10.5%
#10
10.3%
What city has the Highest Percentage of Families with Income Below $10,000 in Utah?
Randlett has the Highest Percentage of Families with Income Below $10,000 in Utah with 36.8%.
What is the Percentage of Families with Income Below $10,000 in the State of Utah?
Percentage of Families with Income Below $10,000 in Utah is 1.7%.
What is the Percentage of Families with Income Below $10,000 in the United States?
Percentage of Families with Income Below $10,000 in the United States is 3.1%.