Cities with the Highest Percentage of Families with Income Below $10,000 in Kansas
RELATED REPORTS & OPTIONS
Family Income | $0-10k
Kansas
Compare Cities
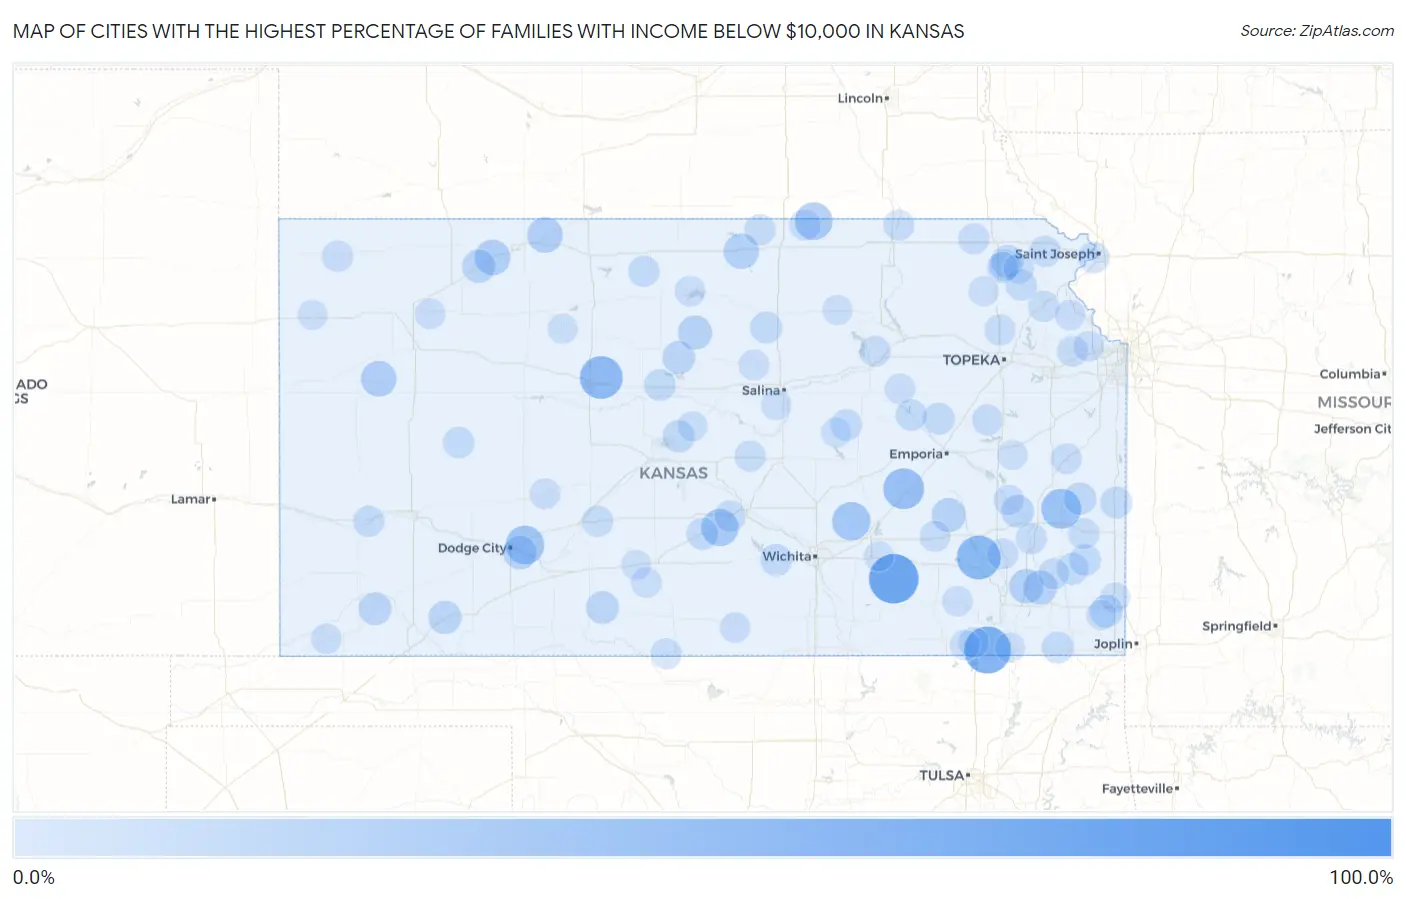
Map of Cities with the Highest Percentage of Families with Income Below $10,000 in Kansas
0.0%
100.0%
Cities with the Highest Percentage of Families with Income Below $10,000 in Kansas
| City | Families with Income < $10k | vs State | vs National | |
| 1. | Silverdale | 100.0% | 2.6%(+97.4)#1 | 3.1%(+96.9)#25 |
| 2. | Beaver | 100.0% | 2.6%(+97.4)#2 | 3.1%(+96.9)#35 |
| 3. | Latham | 74.8% | 2.6%(+72.2)#3 | 3.1%(+71.7)#58 |
| 4. | Tyro | 65.3% | 2.6%(+62.7)#4 | 3.1%(+62.2)#72 |
| 5. | Coyville | 53.8% | 2.6%(+51.2)#5 | 3.1%(+50.7)#103 |
| 6. | Murdock | 53.3% | 2.6%(+50.7)#6 | 3.1%(+50.2)#106 |
| 7. | Catharine | 50.7% | 2.6%(+48.1)#7 | 3.1%(+47.6)#122 |
| 8. | Navarre | 45.1% | 2.6%(+42.5)#8 | 3.1%(+42.0)#164 |
| 9. | Matfield Green | 42.9% | 2.6%(+40.3)#9 | 3.1%(+39.8)#184 |
| 10. | Mildred | 40.0% | 2.6%(+37.4)#10 | 3.1%(+36.9)#217 |
| 11. | Wright | 35.7% | 2.6%(+33.1)#11 | 3.1%(+32.6)#284 |
| 12. | Potwin | 34.4% | 2.6%(+31.8)#12 | 3.1%(+31.3)#306 |
| 13. | Mahaska | 31.6% | 2.6%(+29.0)#13 | 3.1%(+28.5)#367 |
| 14. | Arlington | 30.4% | 2.6%(+27.8)#14 | 3.1%(+27.3)#397 |
| 15. | Clayton | 25.0% | 2.6%(+22.4)#15 | 3.1%(+21.9)#600 |
| 16. | Russell Springs | 25.0% | 2.6%(+22.4)#16 | 3.1%(+21.9)#603 |
| 17. | Almena | 24.5% | 2.6%(+21.9)#17 | 3.1%(+21.4)#619 |
| 18. | Formoso | 23.8% | 2.6%(+21.2)#18 | 3.1%(+20.7)#661 |
| 19. | Thayer | 21.4% | 2.6%(+18.8)#19 | 3.1%(+18.3)#799 |
| 20. | Hamilton | 20.0% | 2.6%(+17.4)#20 | 3.1%(+16.9)#895 |
| 21. | Hunter | 20.0% | 2.6%(+17.4)#21 | 3.1%(+16.9)#903 |
| 22. | Galesburg | 20.0% | 2.6%(+17.4)#22 | 3.1%(+16.9)#906 |
| 23. | Wilroads Gardens | 18.8% | 2.6%(+16.2)#23 | 3.1%(+15.7)#1,018 |
| 24. | Jennings | 17.4% | 2.6%(+14.8)#24 | 3.1%(+14.3)#1,167 |
| 25. | Plains | 16.8% | 2.6%(+14.2)#25 | 3.1%(+13.7)#1,229 |
| 26. | Lucas | 15.4% | 2.6%(+12.8)#26 | 3.1%(+12.3)#1,409 |
| 27. | Moscow | 15.4% | 2.6%(+12.8)#27 | 3.1%(+12.3)#1,414 |
| 28. | Neosho Falls | 15.4% | 2.6%(+12.8)#28 | 3.1%(+12.3)#1,417 |
| 29. | Wilmore | 15.4% | 2.6%(+12.8)#29 | 3.1%(+12.3)#1,420 |
| 30. | Weir | 14.9% | 2.6%(+12.3)#30 | 3.1%(+11.8)#1,478 |
| 31. | Blue Mound | 14.5% | 2.6%(+11.9)#31 | 3.1%(+11.4)#1,556 |
| 32. | Kickapoo Site 1 | 14.3% | 2.6%(+11.7)#32 | 3.1%(+11.2)#1,611 |
| 33. | Claflin | 13.7% | 2.6%(+11.1)#33 | 3.1%(+10.6)#1,726 |
| 34. | Walnut | 12.7% | 2.6%(+10.1)#34 | 3.1%(+9.60)#1,965 |
| 35. | Garden Plain | 12.6% | 2.6%(+10.00)#35 | 3.1%(+9.50)#1,974 |
| 36. | Bushong | 12.5% | 2.6%(+9.90)#36 | 3.1%(+9.40)#2,017 |
| 37. | Langdon | 12.5% | 2.6%(+9.90)#37 | 3.1%(+9.40)#2,018 |
| 38. | Delphos | 12.4% | 2.6%(+9.80)#38 | 3.1%(+9.30)#2,043 |
| 39. | Prescott | 12.2% | 2.6%(+9.60)#39 | 3.1%(+9.10)#2,087 |
| 40. | Bunker Hill | 11.8% | 2.6%(+9.20)#40 | 3.1%(+8.70)#2,204 |
| 41. | Bartlett | 11.8% | 2.6%(+9.20)#41 | 3.1%(+8.70)#2,207 |
| 42. | Hepler | 11.5% | 2.6%(+8.90)#42 | 3.1%(+8.40)#2,308 |
| 43. | Ramona | 11.1% | 2.6%(+8.50)#43 | 3.1%(+8.00)#2,450 |
| 44. | Partridge | 10.6% | 2.6%(+8.00)#44 | 3.1%(+7.50)#2,622 |
| 45. | Council Grove | 10.5% | 2.6%(+7.90)#45 | 3.1%(+7.40)#2,642 |
| 46. | Muscotah | 10.3% | 2.6%(+7.70)#46 | 3.1%(+7.20)#2,739 |
| 47. | Gaylord | 10.3% | 2.6%(+7.70)#47 | 3.1%(+7.20)#2,743 |
| 48. | Lakin | 10.2% | 2.6%(+7.60)#48 | 3.1%(+7.10)#2,767 |
| 49. | Elwood | 10.2% | 2.6%(+7.60)#49 | 3.1%(+7.10)#2,776 |
| 50. | Dighton | 10.2% | 2.6%(+7.60)#50 | 3.1%(+7.10)#2,781 |
| 51. | Lewis | 10.0% | 2.6%(+7.40)#51 | 3.1%(+6.90)#2,857 |
| 52. | Republic | 10.0% | 2.6%(+7.40)#52 | 3.1%(+6.90)#2,878 |
| 53. | Narka | 10.0% | 2.6%(+7.40)#53 | 3.1%(+6.90)#2,881 |
| 54. | Kickapoo Site 7 | 10.0% | 2.6%(+7.40)#54 | 3.1%(+6.90)#2,887 |
| 55. | Leona | 10.0% | 2.6%(+7.40)#55 | 3.1%(+6.90)#2,891 |
| 56. | Humboldt | 9.9% | 2.6%(+7.30)#56 | 3.1%(+6.80)#2,907 |
| 57. | Bird City | 9.9% | 2.6%(+7.30)#57 | 3.1%(+6.80)#2,916 |
| 58. | Uniontown | 9.8% | 2.6%(+7.20)#58 | 3.1%(+6.70)#2,961 |
| 59. | Osage City | 9.5% | 2.6%(+6.90)#59 | 3.1%(+6.40)#3,077 |
| 60. | Hoyt | 9.5% | 2.6%(+6.90)#60 | 3.1%(+6.40)#3,096 |
| 61. | Kickapoo Site 5 | 9.5% | 2.6%(+6.90)#61 | 3.1%(+6.40)#3,113 |
| 62. | Windom | 9.5% | 2.6%(+6.90)#62 | 3.1%(+6.40)#3,116 |
| 63. | Nortonville | 9.4% | 2.6%(+6.80)#63 | 3.1%(+6.30)#3,143 |
| 64. | Buffalo | 9.2% | 2.6%(+6.60)#64 | 3.1%(+6.10)#3,264 |
| 65. | Fort Riley | 9.1% | 2.6%(+6.50)#65 | 3.1%(+6.00)#3,273 |
| 66. | Oneida | 9.1% | 2.6%(+6.50)#66 | 3.1%(+6.00)#3,315 |
| 67. | Erie | 9.0% | 2.6%(+6.40)#67 | 3.1%(+5.90)#3,364 |
| 68. | Hardtner | 9.0% | 2.6%(+6.40)#68 | 3.1%(+5.90)#3,384 |
| 69. | Greeley | 8.8% | 2.6%(+6.20)#69 | 3.1%(+5.70)#3,479 |
| 70. | Tonganoxie | 8.7% | 2.6%(+6.10)#70 | 3.1%(+5.60)#3,505 |
| 71. | Oketo | 8.7% | 2.6%(+6.10)#71 | 3.1%(+5.60)#3,543 |
| 72. | Eureka | 8.6% | 2.6%(+6.00)#72 | 3.1%(+5.50)#3,565 |
| 73. | Tescott | 8.3% | 2.6%(+5.70)#73 | 3.1%(+5.20)#3,739 |
| 74. | Hanston | 8.2% | 2.6%(+5.60)#74 | 3.1%(+5.10)#3,819 |
| 75. | Horton | 7.7% | 2.6%(+5.10)#75 | 3.1%(+4.60)#4,101 |
| 76. | Menlo | 7.7% | 2.6%(+5.10)#76 | 3.1%(+4.60)#4,149 |
| 77. | Basehor | 7.6% | 2.6%(+5.00)#77 | 3.1%(+4.50)#4,161 |
| 78. | Leroy | 7.5% | 2.6%(+4.90)#78 | 3.1%(+4.40)#4,262 |
| 79. | Dwight | 7.5% | 2.6%(+4.90)#79 | 3.1%(+4.40)#4,274 |
| 80. | Coats | 7.4% | 2.6%(+4.80)#80 | 3.1%(+4.30)#4,353 |
| 81. | Rolla | 7.3% | 2.6%(+4.70)#81 | 3.1%(+4.20)#4,415 |
| 82. | Cawker City | 7.3% | 2.6%(+4.70)#82 | 3.1%(+4.20)#4,428 |
| 83. | Longton | 7.1% | 2.6%(+4.50)#83 | 3.1%(+4.00)#4,578 |
| 84. | Havana | 7.1% | 2.6%(+4.50)#84 | 3.1%(+4.00)#4,594 |
| 85. | Easton | 7.0% | 2.6%(+4.40)#85 | 3.1%(+3.90)#4,692 |
| 86. | Anthony | 6.9% | 2.6%(+4.30)#86 | 3.1%(+3.80)#4,730 |
| 87. | Leon | 6.7% | 2.6%(+4.10)#87 | 3.1%(+3.60)#4,922 |
| 88. | Palco | 6.7% | 2.6%(+4.10)#88 | 3.1%(+3.60)#4,936 |
| 89. | Pittsburg | 6.6% | 2.6%(+4.00)#89 | 3.1%(+3.50)#4,965 |
| 90. | Smolan | 6.5% | 2.6%(+3.90)#90 | 3.1%(+3.40)#5,147 |
| 91. | Circleville | 6.5% | 2.6%(+3.90)#91 | 3.1%(+3.40)#5,149 |
| 92. | Scammon | 6.4% | 2.6%(+3.80)#92 | 3.1%(+3.30)#5,240 |
| 93. | Niotaze | 6.4% | 2.6%(+3.80)#93 | 3.1%(+3.30)#5,251 |
| 94. | Holyrood | 6.3% | 2.6%(+3.70)#94 | 3.1%(+3.20)#5,333 |
| 95. | Tampa | 6.3% | 2.6%(+3.70)#95 | 3.1%(+3.20)#5,357 |
| 96. | Cullison | 6.3% | 2.6%(+3.70)#96 | 3.1%(+3.20)#5,363 |
| 97. | Clay Center | 6.2% | 2.6%(+3.60)#97 | 3.1%(+3.10)#5,408 |
| 98. | Goodland | 6.2% | 2.6%(+3.60)#98 | 3.1%(+3.10)#5,410 |
| 99. | Waverly | 6.2% | 2.6%(+3.60)#99 | 3.1%(+3.10)#5,457 |
| 100. | Coffeyville | 6.1% | 2.6%(+3.50)#100 | 3.1%(+3.00)#5,497 |
Common Questions
What are the Top 10 Cities with the Highest Percentage of Families with Income Below $10,000 in Kansas?
Top 10 Cities with the Highest Percentage of Families with Income Below $10,000 in Kansas are:
What city has the Highest Percentage of Families with Income Below $10,000 in Kansas?
Latham has the Highest Percentage of Families with Income Below $10,000 in Kansas with 74.8%.
What is the Percentage of Families with Income Below $10,000 in the State of Kansas?
Percentage of Families with Income Below $10,000 in Kansas is 2.6%.
What is the Percentage of Families with Income Below $10,000 in the United States?
Percentage of Families with Income Below $10,000 in the United States is 3.1%.