Zip Codes with the Highest Percentage of Families with Income Below $10,000 in Lompoc, CA
RELATED REPORTS & OPTIONS
Family Income | $0-10k
Lompoc
Compare Zip Codes
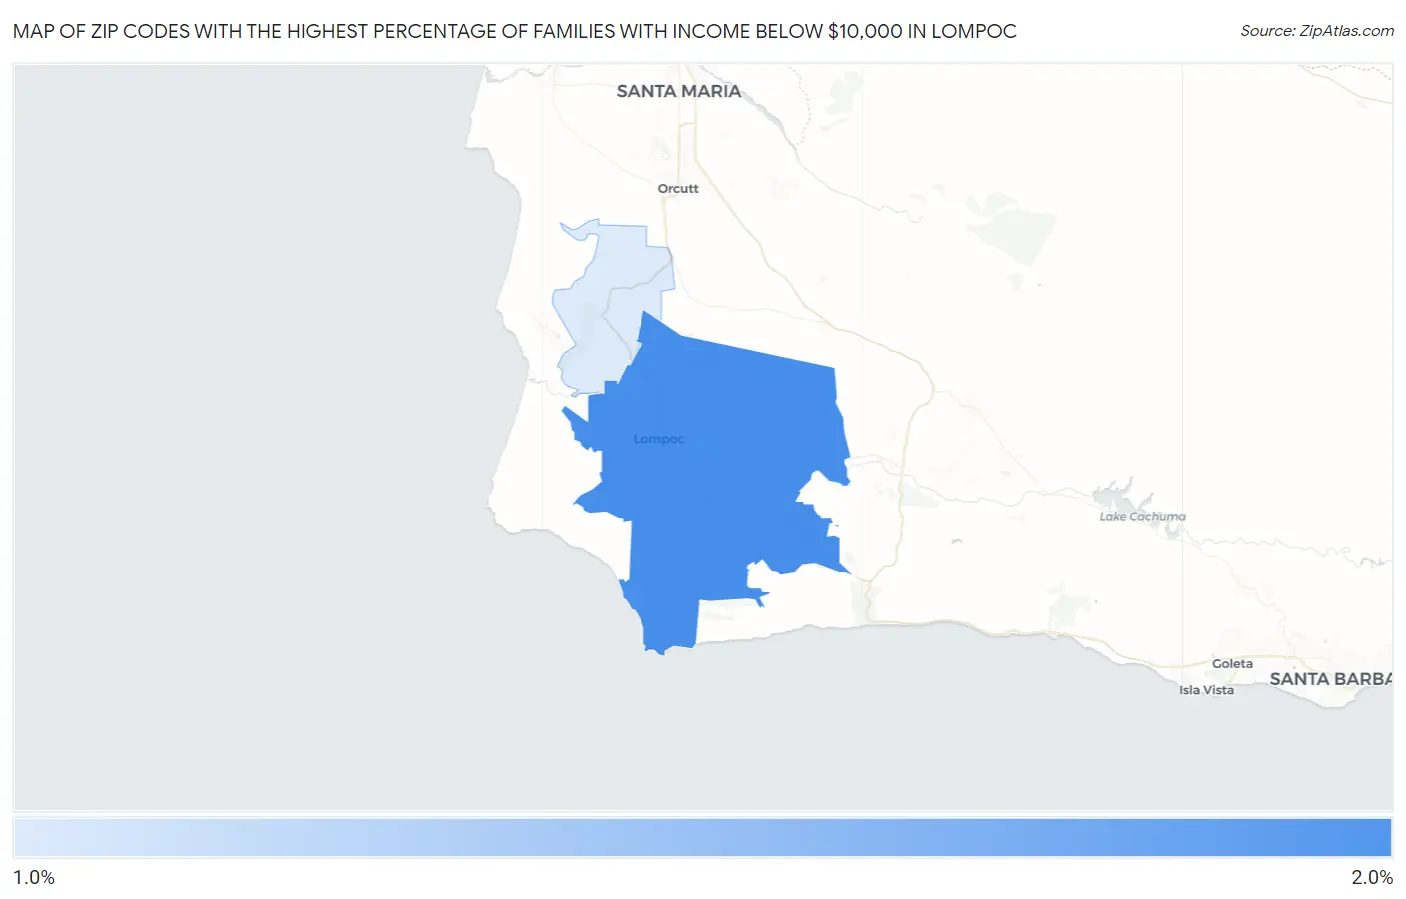
Map of Zip Codes with the Highest Percentage of Families with Income Below $10,000 in Lompoc
1.3%
1.7%
Zip Codes with the Highest Percentage of Families with Income Below $10,000 in Lompoc, CA
| Zip Code | Families with Income < $10k | vs State | vs National | |
| 1. | 93436 | 1.7% | 2.9%(-1.20)#1,027 | 3.1%(-1.40)#16,681 |
| 2. | 93437 | 1.3% | 2.9%(-1.60)#1,187 | 3.1%(-1.80)#18,992 |
1
Common Questions
What are the Top Zip Codes with the Highest Percentage of Families with Income Below $10,000 in Lompoc, CA?
Top Zip Codes with the Highest Percentage of Families with Income Below $10,000 in Lompoc, CA are:
What zip code has the Highest Percentage of Families with Income Below $10,000 in Lompoc, CA?
93436 has the Highest Percentage of Families with Income Below $10,000 in Lompoc, CA with 1.7%.
What is the Percentage of Families with Income Below $10,000 in Lompoc, CA?
Percentage of Families with Income Below $10,000 in Lompoc is 2.2%.
What is the Percentage of Families with Income Below $10,000 in California?
Percentage of Families with Income Below $10,000 in California is 2.9%.
What is the Percentage of Families with Income Below $10,000 in the United States?
Percentage of Families with Income Below $10,000 in the United States is 3.1%.