Cities with the Highest Percentage of Families with Income Below $10,000 in Illinois
RELATED REPORTS & OPTIONS
Family Income | $0-10k
Illinois
Compare Cities
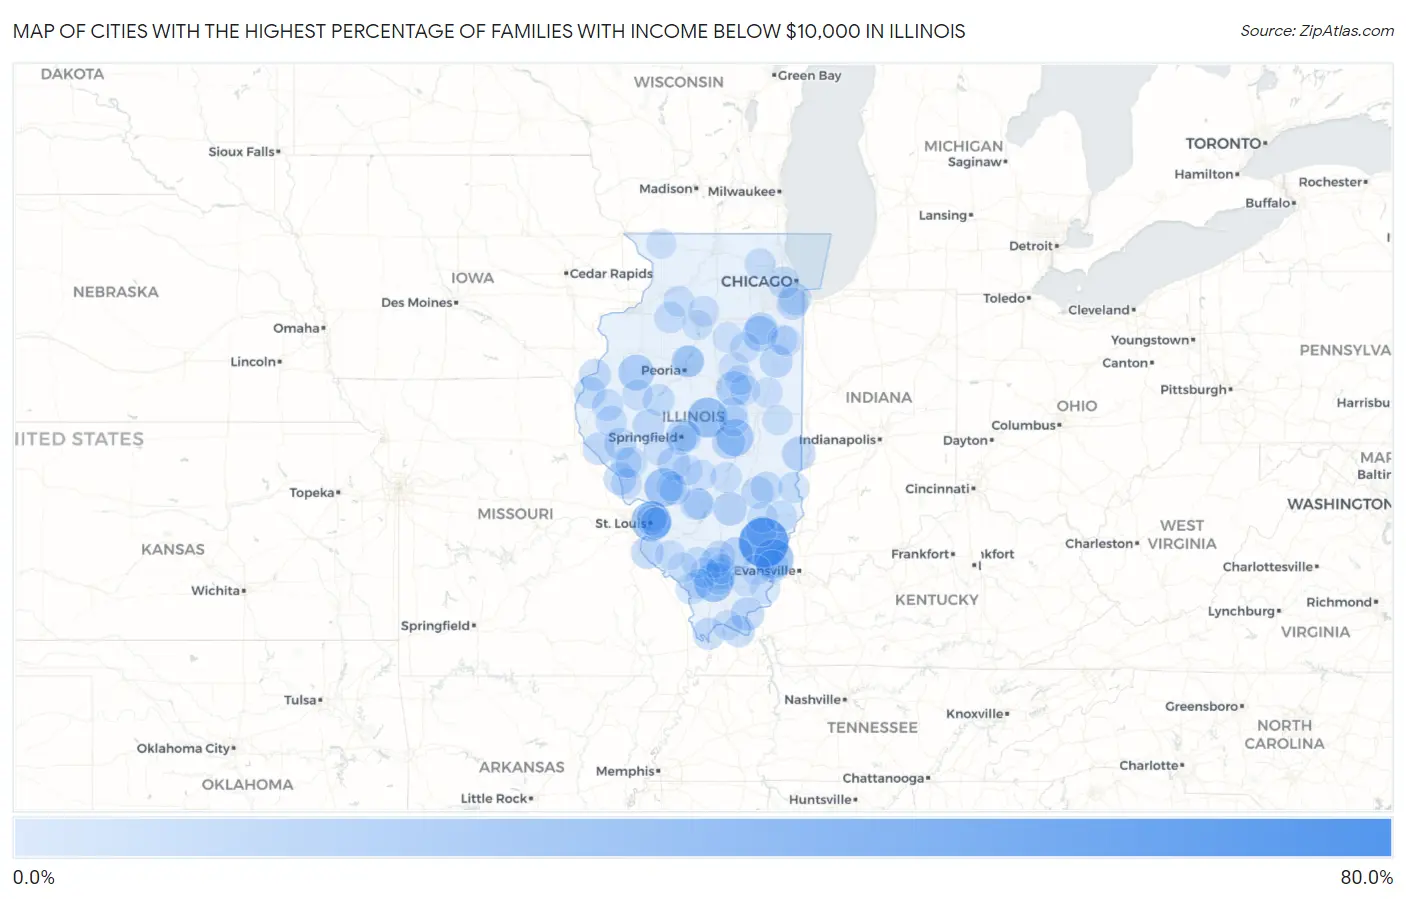
Map of Cities with the Highest Percentage of Families with Income Below $10,000 in Illinois
0.0%
80.0%
Cities with the Highest Percentage of Families with Income Below $10,000 in Illinois
| City | Families with Income < $10k | vs State | vs National | |
| 1. | Serena | 78.3% | 3.0%(+75.3)#1 | 3.1%(+75.2)#51 |
| 2. | Golden Gate | 64.3% | 3.0%(+61.3)#2 | 3.1%(+61.2)#76 |
| 3. | Chestnut | 36.4% | 3.0%(+33.4)#3 | 3.1%(+33.3)#269 |
| 4. | Brooklyn | 36.3% | 3.0%(+33.3)#4 | 3.1%(+33.2)#273 |
| 5. | Phillipstown | 35.3% | 3.0%(+32.3)#5 | 3.1%(+32.2)#291 |
| 6. | Colp | 34.5% | 3.0%(+31.5)#6 | 3.1%(+31.4)#303 |
| 7. | Royal Lakes | 32.6% | 3.0%(+29.6)#7 | 3.1%(+29.5)#344 |
| 8. | Lowpoint | 32.5% | 3.0%(+29.5)#8 | 3.1%(+29.4)#347 |
| 9. | Laplace | 28.2% | 3.0%(+25.2)#9 | 3.1%(+25.1)#462 |
| 10. | Avon | 25.3% | 3.0%(+22.3)#10 | 3.1%(+22.2)#577 |
| 11. | Gulfport | 23.5% | 3.0%(+20.5)#11 | 3.1%(+20.4)#673 |
| 12. | East Brooklyn | 23.5% | 3.0%(+20.5)#12 | 3.1%(+20.4)#675 |
| 13. | Ellsworth | 23.2% | 3.0%(+20.2)#13 | 3.1%(+20.1)#692 |
| 14. | Dewey | 22.2% | 3.0%(+19.2)#14 | 3.1%(+19.1)#748 |
| 15. | Farina | 19.7% | 3.0%(+16.7)#15 | 3.1%(+16.6)#929 |
| 16. | Vermilion | 19.5% | 3.0%(+16.5)#16 | 3.1%(+16.4)#955 |
| 17. | Dahlgren | 18.7% | 3.0%(+15.7)#17 | 3.1%(+15.6)#1,032 |
| 18. | Golconda | 18.6% | 3.0%(+15.6)#18 | 3.1%(+15.5)#1,037 |
| 19. | Dalton City | 18.0% | 3.0%(+15.0)#19 | 3.1%(+14.9)#1,107 |
| 20. | Girard | 17.5% | 3.0%(+14.5)#20 | 3.1%(+14.4)#1,153 |
| 21. | Grandview | 17.5% | 3.0%(+14.5)#21 | 3.1%(+14.4)#1,155 |
| 22. | Danforth | 17.4% | 3.0%(+14.4)#22 | 3.1%(+14.3)#1,165 |
| 23. | Maeystown | 17.4% | 3.0%(+14.4)#23 | 3.1%(+14.3)#1,169 |
| 24. | Hamburg | 16.7% | 3.0%(+13.7)#24 | 3.1%(+13.6)#1,243 |
| 25. | Godley | 16.3% | 3.0%(+13.3)#25 | 3.1%(+13.2)#1,285 |
| 26. | Riverdale | 16.1% | 3.0%(+13.1)#26 | 3.1%(+13.0)#1,302 |
| 27. | Greenville | 16.1% | 3.0%(+13.1)#27 | 3.1%(+13.0)#1,303 |
| 28. | Maunie | 16.1% | 3.0%(+13.1)#28 | 3.1%(+13.0)#1,313 |
| 29. | Wheeler | 15.8% | 3.0%(+12.8)#29 | 3.1%(+12.7)#1,350 |
| 30. | New Canton | 15.7% | 3.0%(+12.7)#30 | 3.1%(+12.6)#1,361 |
| 31. | Virginia | 15.5% | 3.0%(+12.5)#31 | 3.1%(+12.4)#1,389 |
| 32. | Mound City | 15.5% | 3.0%(+12.5)#32 | 3.1%(+12.4)#1,390 |
| 33. | Sunnyland | 15.5% | 3.0%(+12.5)#33 | 3.1%(+12.4)#1,392 |
| 34. | Hazel Crest | 15.4% | 3.0%(+12.4)#34 | 3.1%(+12.3)#1,396 |
| 35. | Griggsville | 15.4% | 3.0%(+12.4)#35 | 3.1%(+12.3)#1,403 |
| 36. | Dallas City | 15.3% | 3.0%(+12.3)#36 | 3.1%(+12.2)#1,427 |
| 37. | Brookport | 15.3% | 3.0%(+12.3)#37 | 3.1%(+12.2)#1,428 |
| 38. | East St Louis | 15.2% | 3.0%(+12.2)#38 | 3.1%(+12.1)#1,430 |
| 39. | Spring Bay | 15.2% | 3.0%(+12.2)#39 | 3.1%(+12.1)#1,442 |
| 40. | Elvaston | 15.0% | 3.0%(+12.0)#40 | 3.1%(+11.9)#1,465 |
| 41. | Orient | 14.9% | 3.0%(+11.9)#41 | 3.1%(+11.8)#1,485 |
| 42. | Rose Hill | 14.3% | 3.0%(+11.3)#42 | 3.1%(+11.2)#1,621 |
| 43. | Broadview | 14.0% | 3.0%(+11.0)#43 | 3.1%(+10.9)#1,659 |
| 44. | Freeman Spur | 14.0% | 3.0%(+11.0)#44 | 3.1%(+10.9)#1,680 |
| 45. | Havana | 13.9% | 3.0%(+10.9)#45 | 3.1%(+10.8)#1,686 |
| 46. | Hillview | 13.8% | 3.0%(+10.8)#46 | 3.1%(+10.7)#1,714 |
| 47. | Mineral | 13.6% | 3.0%(+10.6)#47 | 3.1%(+10.5)#1,754 |
| 48. | Augusta | 13.5% | 3.0%(+10.5)#48 | 3.1%(+10.4)#1,772 |
| 49. | Mound Station | 13.5% | 3.0%(+10.5)#49 | 3.1%(+10.4)#1,780 |
| 50. | Sumner | 13.4% | 3.0%(+10.4)#50 | 3.1%(+10.3)#1,786 |
| 51. | Nason | 13.4% | 3.0%(+10.4)#51 | 3.1%(+10.3)#1,800 |
| 52. | Bay View Gardens | 13.3% | 3.0%(+10.3)#52 | 3.1%(+10.2)#1,819 |
| 53. | Gorham | 13.1% | 3.0%(+10.1)#53 | 3.1%(+10.00)#1,867 |
| 54. | Pinckneyville | 13.0% | 3.0%(+10.00)#54 | 3.1%(+9.90)#1,870 |
| 55. | Hutsonville | 12.9% | 3.0%(+9.90)#55 | 3.1%(+9.80)#1,901 |
| 56. | Cowden | 12.7% | 3.0%(+9.70)#56 | 3.1%(+9.60)#1,953 |
| 57. | Deer Grove | 12.5% | 3.0%(+9.50)#57 | 3.1%(+9.40)#2,014 |
| 58. | East Dundee | 12.4% | 3.0%(+9.40)#58 | 3.1%(+9.30)#2,021 |
| 59. | Madison | 12.4% | 3.0%(+9.40)#59 | 3.1%(+9.30)#2,024 |
| 60. | Sesser | 12.4% | 3.0%(+9.40)#60 | 3.1%(+9.30)#2,028 |
| 61. | Hardin | 12.4% | 3.0%(+9.40)#61 | 3.1%(+9.30)#2,037 |
| 62. | Table Grove | 12.2% | 3.0%(+9.20)#62 | 3.1%(+9.10)#2,083 |
| 63. | Arlington | 12.1% | 3.0%(+9.10)#63 | 3.1%(+9.00)#2,115 |
| 64. | Smithboro | 12.0% | 3.0%(+9.00)#64 | 3.1%(+8.90)#2,140 |
| 65. | Cahokia Heights | 11.9% | 3.0%(+8.90)#65 | 3.1%(+8.80)#2,146 |
| 66. | White City | 11.9% | 3.0%(+8.90)#66 | 3.1%(+8.80)#2,169 |
| 67. | Lawrence | 11.9% | 3.0%(+8.90)#67 | 3.1%(+8.80)#2,171 |
| 68. | Clear Lake | 11.8% | 3.0%(+8.80)#68 | 3.1%(+8.70)#2,200 |
| 69. | Pearl | 11.8% | 3.0%(+8.80)#69 | 3.1%(+8.70)#2,205 |
| 70. | Venice | 11.5% | 3.0%(+8.50)#70 | 3.1%(+8.40)#2,284 |
| 71. | Chenoa | 11.2% | 3.0%(+8.20)#71 | 3.1%(+8.10)#2,392 |
| 72. | Aroma Park | 11.2% | 3.0%(+8.20)#72 | 3.1%(+8.10)#2,398 |
| 73. | Noble | 11.2% | 3.0%(+8.20)#73 | 3.1%(+8.10)#2,399 |
| 74. | Ludlow | 11.1% | 3.0%(+8.10)#74 | 3.1%(+8.00)#2,433 |
| 75. | Mount Erie | 11.1% | 3.0%(+8.10)#75 | 3.1%(+8.00)#2,445 |
| 76. | Coalton | 11.0% | 3.0%(+8.00)#76 | 3.1%(+7.90)#2,479 |
| 77. | Washington Park | 10.9% | 3.0%(+7.90)#77 | 3.1%(+7.80)#2,486 |
| 78. | Shawneetown | 10.8% | 3.0%(+7.80)#78 | 3.1%(+7.70)#2,525 |
| 79. | Homer | 10.8% | 3.0%(+7.80)#79 | 3.1%(+7.70)#2,527 |
| 80. | Cisco | 10.8% | 3.0%(+7.80)#80 | 3.1%(+7.70)#2,542 |
| 81. | Odell | 10.7% | 3.0%(+7.70)#81 | 3.1%(+7.60)#2,564 |
| 82. | Harvel | 10.7% | 3.0%(+7.70)#82 | 3.1%(+7.60)#2,577 |
| 83. | Saybrook | 10.6% | 3.0%(+7.60)#83 | 3.1%(+7.50)#2,609 |
| 84. | Joppa | 10.6% | 3.0%(+7.60)#84 | 3.1%(+7.50)#2,618 |
| 85. | Bureau Junction | 10.5% | 3.0%(+7.50)#85 | 3.1%(+7.40)#2,655 |
| 86. | Weldon | 10.4% | 3.0%(+7.40)#86 | 3.1%(+7.30)#2,693 |
| 87. | Dowell | 10.3% | 3.0%(+7.30)#87 | 3.1%(+7.20)#2,735 |
| 88. | Stockton | 10.2% | 3.0%(+7.20)#88 | 3.1%(+7.10)#2,772 |
| 89. | West City | 10.2% | 3.0%(+7.20)#89 | 3.1%(+7.10)#2,783 |
| 90. | Kankakee | 10.1% | 3.0%(+7.10)#90 | 3.1%(+7.00)#2,790 |
| 91. | Southern View | 10.1% | 3.0%(+7.10)#91 | 3.1%(+7.00)#2,802 |
| 92. | Harrison | 10.1% | 3.0%(+7.10)#92 | 3.1%(+7.00)#2,807 |
| 93. | Franklin | 10.1% | 3.0%(+7.10)#93 | 3.1%(+7.00)#2,809 |
| 94. | Streator | 10.0% | 3.0%(+7.00)#94 | 3.1%(+6.90)#2,824 |
| 95. | Gillespie | 10.0% | 3.0%(+7.00)#95 | 3.1%(+6.90)#2,831 |
| 96. | Percy | 10.0% | 3.0%(+7.00)#96 | 3.1%(+6.90)#2,842 |
| 97. | Colfax | 10.0% | 3.0%(+7.00)#97 | 3.1%(+6.90)#2,845 |
| 98. | Norris City | 9.9% | 3.0%(+6.90)#98 | 3.1%(+6.80)#2,910 |
| 99. | Baldwin | 9.9% | 3.0%(+6.90)#99 | 3.1%(+6.80)#2,923 |
| 100. | Raleigh | 9.9% | 3.0%(+6.90)#100 | 3.1%(+6.80)#2,925 |
Common Questions
What are the Top 10 Cities with the Highest Percentage of Families with Income Below $10,000 in Illinois?
Top 10 Cities with the Highest Percentage of Families with Income Below $10,000 in Illinois are:
#1
64.3%
#2
36.4%
#3
36.3%
#4
35.3%
#5
34.5%
#6
32.6%
#7
28.2%
#8
25.3%
#9
23.5%
#10
23.2%
What city has the Highest Percentage of Families with Income Below $10,000 in Illinois?
Golden Gate has the Highest Percentage of Families with Income Below $10,000 in Illinois with 64.3%.
What is the Percentage of Families with Income Below $10,000 in the State of Illinois?
Percentage of Families with Income Below $10,000 in Illinois is 3.0%.
What is the Percentage of Families with Income Below $10,000 in the United States?
Percentage of Families with Income Below $10,000 in the United States is 3.1%.