Cities with the Highest Percentage of Families with Income Below $10,000 in Louisiana
RELATED REPORTS & OPTIONS
Family Income | $0-10k
Louisiana
Compare Cities
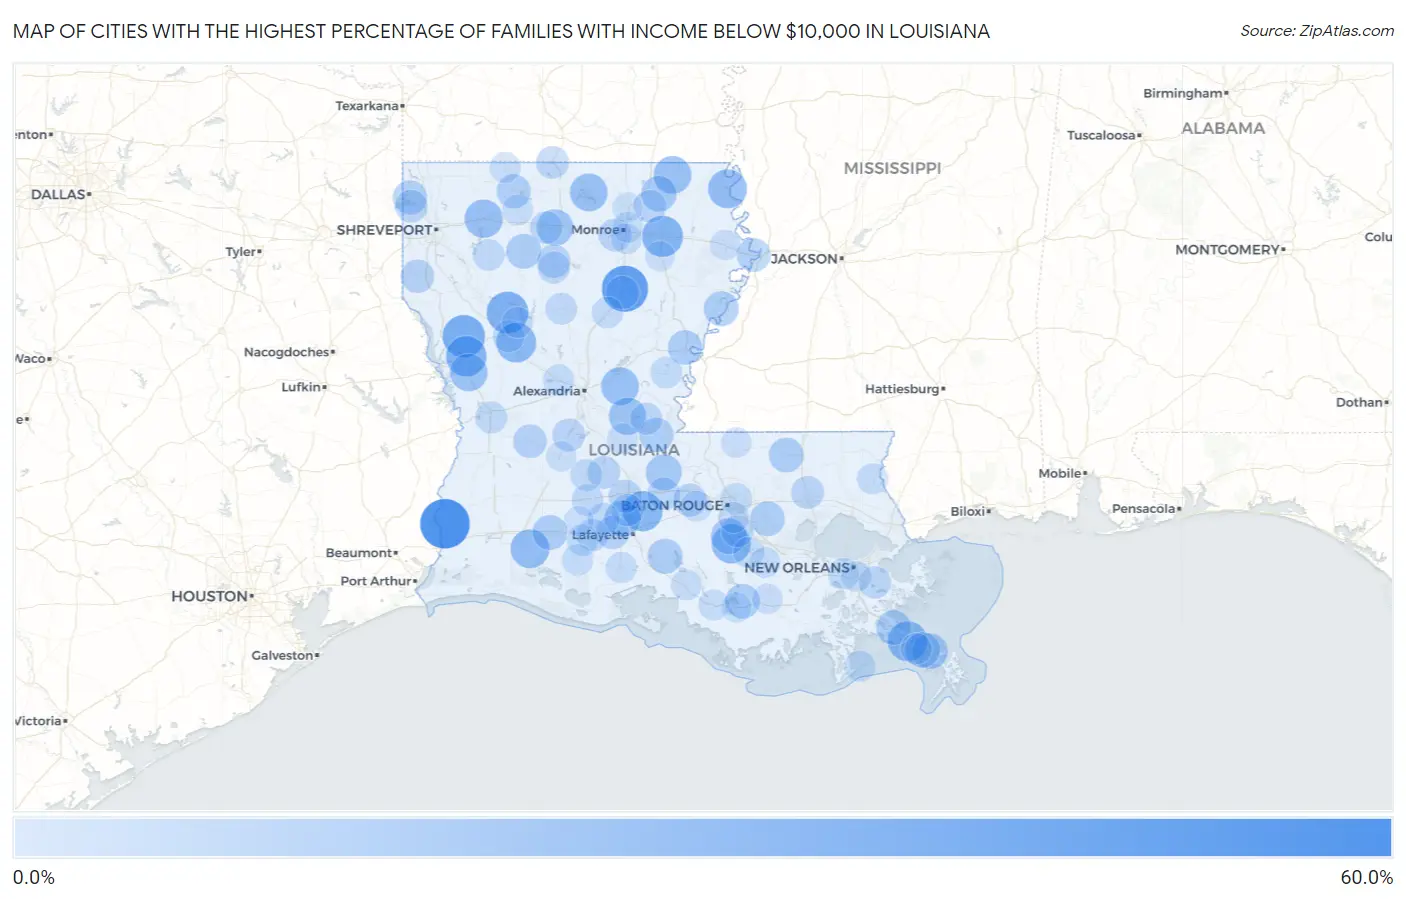
Map of Cities with the Highest Percentage of Families with Income Below $10,000 in Louisiana
0.0%
60.0%
Cities with the Highest Percentage of Families with Income Below $10,000 in Louisiana
| City | Families with Income < $10k | vs State | vs National | |
| 1. | Starks | 56.4% | 4.9%(+51.5)#1 | 3.1%(+53.3)#90 |
| 2. | Banks Springs | 48.1% | 4.9%(+43.2)#2 | 3.1%(+45.0)#144 |
| 3. | Centerville | 40.0% | 4.9%(+35.1)#3 | 3.1%(+36.9)#209 |
| 4. | Belmont | 38.7% | 4.9%(+33.8)#4 | 3.1%(+35.6)#234 |
| 5. | Campti | 36.9% | 4.9%(+32.0)#5 | 3.1%(+33.8)#261 |
| 6. | Rayville | 35.3% | 4.9%(+30.4)#6 | 3.1%(+32.2)#287 |
| 7. | Many | 34.1% | 4.9%(+29.2)#7 | 3.1%(+31.0)#310 |
| 8. | Arnaudville | 33.2% | 4.9%(+28.3)#8 | 3.1%(+30.1)#336 |
| 9. | Natchez | 32.6% | 4.9%(+27.7)#9 | 3.1%(+29.5)#343 |
| 10. | Empire | 32.1% | 4.9%(+27.2)#10 | 3.1%(+29.0)#354 |
| 11. | White Castle | 30.7% | 4.9%(+25.8)#11 | 3.1%(+27.6)#388 |
| 12. | Lake Providence | 29.9% | 4.9%(+25.0)#12 | 3.1%(+26.8)#413 |
| 13. | Hayes | 29.8% | 4.9%(+24.9)#13 | 3.1%(+26.7)#414 |
| 14. | Dixie Inn | 28.4% | 4.9%(+23.5)#14 | 3.1%(+25.3)#458 |
| 15. | Bonita | 27.3% | 4.9%(+22.4)#15 | 3.1%(+24.2)#495 |
| 16. | Farmerville | 27.0% | 4.9%(+22.1)#16 | 3.1%(+23.9)#502 |
| 17. | Deville | 27.0% | 4.9%(+22.1)#17 | 3.1%(+23.9)#505 |
| 18. | Florien | 26.9% | 4.9%(+22.0)#18 | 3.1%(+23.8)#510 |
| 19. | Marksville | 25.9% | 4.9%(+21.0)#19 | 3.1%(+22.8)#546 |
| 20. | Grambling | 24.1% | 4.9%(+19.2)#20 | 3.1%(+21.0)#635 |
| 21. | Cankton | 23.2% | 4.9%(+18.3)#21 | 3.1%(+20.1)#691 |
| 22. | Melville | 22.7% | 4.9%(+17.8)#22 | 3.1%(+19.6)#717 |
| 23. | Bayou Goula | 22.7% | 4.9%(+17.8)#23 | 3.1%(+19.6)#718 |
| 24. | Boothville | 22.1% | 4.9%(+17.2)#24 | 3.1%(+19.0)#757 |
| 25. | Mer Rouge | 21.8% | 4.9%(+16.9)#25 | 3.1%(+18.7)#772 |
| 26. | Triumph | 21.6% | 4.9%(+16.7)#26 | 3.1%(+18.5)#782 |
| 27. | Loreauville | 20.6% | 4.9%(+15.7)#27 | 3.1%(+17.5)#848 |
| 28. | Bienville | 20.6% | 4.9%(+15.7)#28 | 3.1%(+17.5)#850 |
| 29. | St Joseph | 20.4% | 4.9%(+15.5)#29 | 3.1%(+17.3)#866 |
| 30. | Roanoke | 20.4% | 4.9%(+15.5)#30 | 3.1%(+17.3)#869 |
| 31. | Bayou L Ourse | 20.0% | 4.9%(+15.1)#31 | 3.1%(+16.9)#889 |
| 32. | Port Sulphur | 20.0% | 4.9%(+15.1)#32 | 3.1%(+16.9)#890 |
| 33. | Greensburg | 19.9% | 4.9%(+15.0)#33 | 3.1%(+16.8)#922 |
| 34. | Port Vincent | 19.7% | 4.9%(+14.8)#34 | 3.1%(+16.6)#930 |
| 35. | Ferriday | 19.4% | 4.9%(+14.5)#35 | 3.1%(+16.3)#958 |
| 36. | Simmesport | 19.2% | 4.9%(+14.3)#36 | 3.1%(+16.1)#985 |
| 37. | Oil City | 18.8% | 4.9%(+13.9)#37 | 3.1%(+15.7)#1,017 |
| 38. | Homer | 18.6% | 4.9%(+13.7)#38 | 3.1%(+15.5)#1,035 |
| 39. | Delta | 17.6% | 4.9%(+12.7)#39 | 3.1%(+14.5)#1,147 |
| 40. | Pitkin | 17.2% | 4.9%(+12.3)#40 | 3.1%(+14.1)#1,187 |
| 41. | Keachi | 16.7% | 4.9%(+11.8)#41 | 3.1%(+13.6)#1,244 |
| 42. | East Hodge | 16.4% | 4.9%(+11.5)#42 | 3.1%(+13.3)#1,277 |
| 43. | Grayson | 16.3% | 4.9%(+11.4)#43 | 3.1%(+13.2)#1,284 |
| 44. | Duson | 16.2% | 4.9%(+11.3)#44 | 3.1%(+13.1)#1,291 |
| 45. | Maringouin | 16.0% | 4.9%(+11.1)#45 | 3.1%(+12.9)#1,319 |
| 46. | Opelousas | 15.9% | 4.9%(+11.0)#46 | 3.1%(+12.8)#1,326 |
| 47. | Bawcomville | 15.8% | 4.9%(+10.9)#47 | 3.1%(+12.7)#1,345 |
| 48. | Glenmora | 15.7% | 4.9%(+10.8)#48 | 3.1%(+12.6)#1,356 |
| 49. | Ville Platte | 15.5% | 4.9%(+10.6)#49 | 3.1%(+12.4)#1,379 |
| 50. | Natalbany | 15.5% | 4.9%(+10.6)#50 | 3.1%(+12.4)#1,385 |
| 51. | Mooringsport | 15.1% | 4.9%(+10.2)#51 | 3.1%(+12.0)#1,450 |
| 52. | Krotz Springs | 15.0% | 4.9%(+10.1)#52 | 3.1%(+11.9)#1,458 |
| 53. | Junction City | 14.9% | 4.9%(+10.00)#53 | 3.1%(+11.8)#1,482 |
| 54. | Collinston | 14.9% | 4.9%(+10.00)#54 | 3.1%(+11.8)#1,487 |
| 55. | Simsboro | 14.5% | 4.9%(+9.60)#55 | 3.1%(+11.4)#1,552 |
| 56. | Poydras | 14.3% | 4.9%(+9.40)#56 | 3.1%(+11.2)#1,585 |
| 57. | Sunset | 14.2% | 4.9%(+9.30)#57 | 3.1%(+11.1)#1,630 |
| 58. | Bordelonville | 14.0% | 4.9%(+9.10)#58 | 3.1%(+10.9)#1,677 |
| 59. | Crowley | 13.9% | 4.9%(+9.00)#59 | 3.1%(+10.8)#1,682 |
| 60. | Jonesboro | 13.7% | 4.9%(+8.80)#60 | 3.1%(+10.6)#1,717 |
| 61. | St Gabriel | 13.6% | 4.9%(+8.70)#61 | 3.1%(+10.5)#1,731 |
| 62. | Branch | 13.5% | 4.9%(+8.60)#62 | 3.1%(+10.4)#1,774 |
| 63. | Leesville | 13.4% | 4.9%(+8.50)#63 | 3.1%(+10.3)#1,783 |
| 64. | Natchitoches | 13.3% | 4.9%(+8.40)#64 | 3.1%(+10.2)#1,801 |
| 65. | Reddell | 13.2% | 4.9%(+8.30)#65 | 3.1%(+10.1)#1,842 |
| 66. | Winnfield | 13.0% | 4.9%(+8.10)#66 | 3.1%(+9.90)#1,871 |
| 67. | Eunice | 12.8% | 4.9%(+7.90)#67 | 3.1%(+9.70)#1,908 |
| 68. | Ringgold | 12.8% | 4.9%(+7.90)#68 | 3.1%(+9.70)#1,913 |
| 69. | Merrydale | 12.7% | 4.9%(+7.80)#69 | 3.1%(+9.60)#1,936 |
| 70. | Monterey | 12.7% | 4.9%(+7.80)#70 | 3.1%(+9.60)#1,963 |
| 71. | Olla | 12.5% | 4.9%(+7.60)#71 | 3.1%(+9.40)#1,987 |
| 72. | Bridge City | 12.3% | 4.9%(+7.40)#72 | 3.1%(+9.20)#2,044 |
| 73. | Estherwood | 12.1% | 4.9%(+7.20)#73 | 3.1%(+9.00)#2,104 |
| 74. | Boyce | 11.9% | 4.9%(+7.00)#74 | 3.1%(+8.80)#2,156 |
| 75. | Abbeville | 11.8% | 4.9%(+6.90)#75 | 3.1%(+8.70)#2,176 |
| 76. | Gueydan | 11.8% | 4.9%(+6.90)#76 | 3.1%(+8.70)#2,188 |
| 77. | Grand Isle | 11.6% | 4.9%(+6.70)#77 | 3.1%(+8.50)#2,248 |
| 78. | Donaldsonville | 11.5% | 4.9%(+6.60)#78 | 3.1%(+8.40)#2,272 |
| 79. | Buras | 11.3% | 4.9%(+6.40)#79 | 3.1%(+8.20)#2,361 |
| 80. | Sun | 11.3% | 4.9%(+6.40)#80 | 3.1%(+8.20)#2,368 |
| 81. | Gardere | 11.1% | 4.9%(+6.20)#81 | 3.1%(+8.00)#2,403 |
| 82. | Clarence | 11.1% | 4.9%(+6.20)#82 | 3.1%(+8.00)#2,431 |
| 83. | Evergreen | 11.1% | 4.9%(+6.20)#83 | 3.1%(+8.00)#2,435 |
| 84. | Haynesville | 11.0% | 4.9%(+6.10)#84 | 3.1%(+7.90)#2,464 |
| 85. | Patterson | 10.8% | 4.9%(+5.90)#85 | 3.1%(+7.70)#2,513 |
| 86. | Rosedale | 10.8% | 4.9%(+5.90)#86 | 3.1%(+7.70)#2,524 |
| 87. | Richwood | 10.7% | 4.9%(+5.80)#87 | 3.1%(+7.60)#2,552 |
| 88. | Baldwin | 10.6% | 4.9%(+5.70)#88 | 3.1%(+7.50)#2,596 |
| 89. | Gretna | 10.5% | 4.9%(+5.60)#89 | 3.1%(+7.40)#2,628 |
| 90. | St James | 10.4% | 4.9%(+5.50)#90 | 3.1%(+7.30)#2,686 |
| 91. | Athens | 10.4% | 4.9%(+5.50)#91 | 3.1%(+7.30)#2,695 |
| 92. | Schriever | 9.9% | 4.9%(+5.00)#92 | 3.1%(+6.80)#2,898 |
| 93. | Wilson | 9.9% | 4.9%(+5.00)#93 | 3.1%(+6.80)#2,915 |
| 94. | Monroe | 9.8% | 4.9%(+4.90)#94 | 3.1%(+6.70)#2,927 |
| 95. | Tallulah | 9.7% | 4.9%(+4.80)#95 | 3.1%(+6.60)#2,980 |
| 96. | Oakdale | 9.6% | 4.9%(+4.70)#96 | 3.1%(+6.50)#3,032 |
| 97. | Amelia | 9.5% | 4.9%(+4.60)#97 | 3.1%(+6.40)#3,080 |
| 98. | Iota | 9.5% | 4.9%(+4.60)#98 | 3.1%(+6.40)#3,083 |
| 99. | Sterlington | 9.3% | 4.9%(+4.40)#99 | 3.1%(+6.20)#3,180 |
| 100. | Mangham | 9.2% | 4.9%(+4.30)#100 | 3.1%(+6.10)#3,253 |
Common Questions
What are the Top 10 Cities with the Highest Percentage of Families with Income Below $10,000 in Louisiana?
Top 10 Cities with the Highest Percentage of Families with Income Below $10,000 in Louisiana are:
#1
56.4%
#2
48.1%
#3
38.7%
#4
36.9%
#5
35.3%
#6
34.1%
#7
33.2%
#8
32.6%
#9
32.1%
#10
30.7%
What city has the Highest Percentage of Families with Income Below $10,000 in Louisiana?
Starks has the Highest Percentage of Families with Income Below $10,000 in Louisiana with 56.4%.
What is the Percentage of Families with Income Below $10,000 in the State of Louisiana?
Percentage of Families with Income Below $10,000 in Louisiana is 4.9%.
What is the Percentage of Families with Income Below $10,000 in the United States?
Percentage of Families with Income Below $10,000 in the United States is 3.1%.