Cities with the Lowest Percentage of Births to Unmarried Women over the Age of 35 in Illinois
RELATED REPORTS & OPTIONS
Lowest Illegitimacy | Women 35+
Illinois
Compare Cities
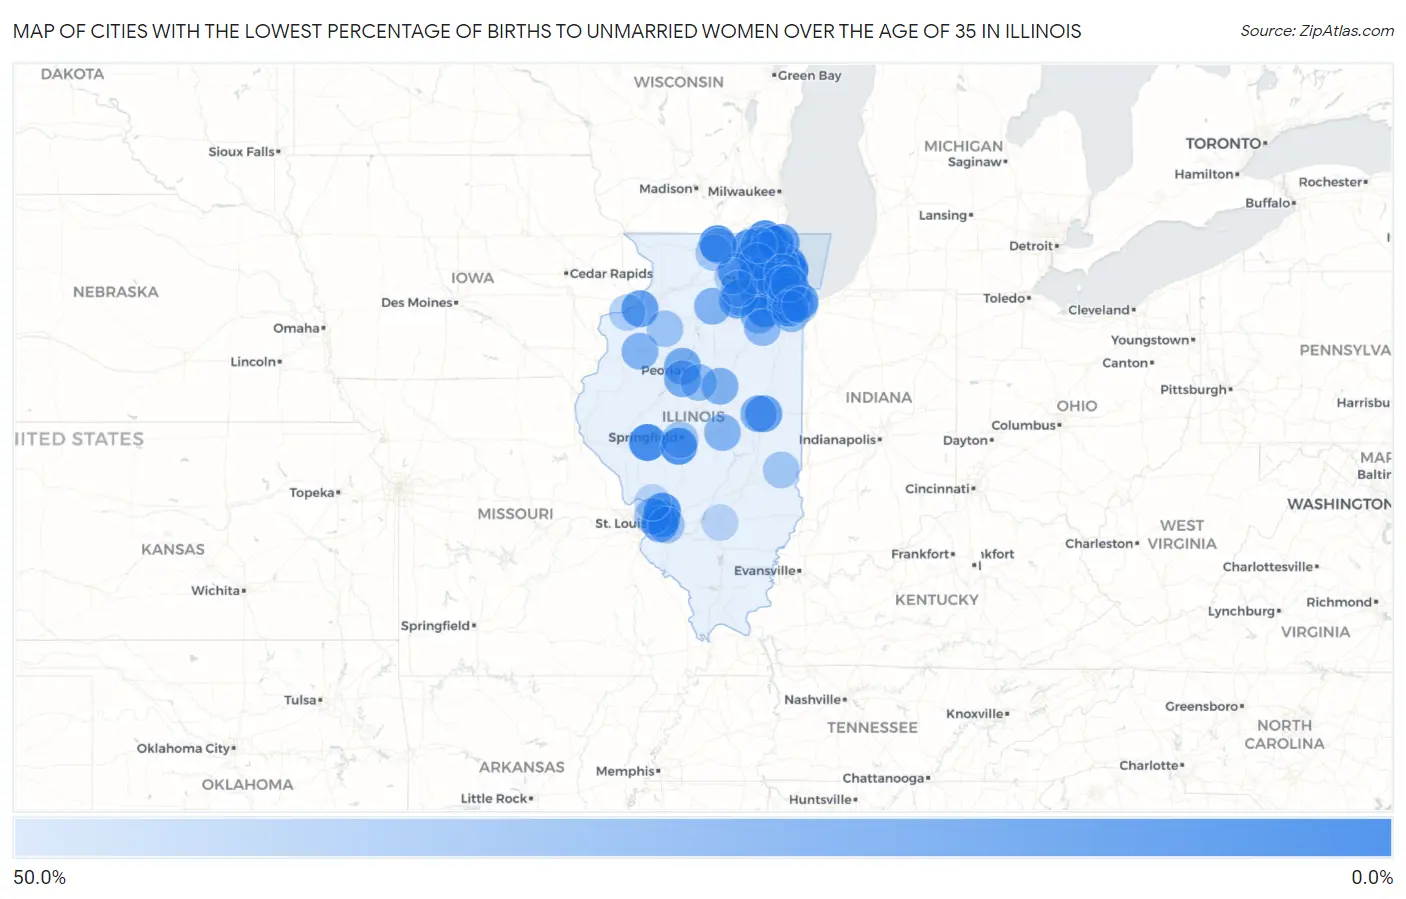
Map of Cities with the Lowest Percentage of Births to Unmarried Women over the Age of 35 in Illinois
50.0%
0.0%
Cities with the Lowest Percentage of Births to Unmarried Women over the Age of 35 in Illinois
| City | % Unmarried | vs State | vs National | |
| 1. | Downers Grove | 2.3% | 19.2%(-16.9)#1 | 20.1%(-17.8)#34 |
| 2. | Bolingbrook | 2.7% | 19.2%(-16.5)#2 | 20.1%(-17.4)#44 |
| 3. | Park Ridge | 3.7% | 19.2%(-15.5)#3 | 20.1%(-16.4)#70 |
| 4. | Elmhurst | 4.0% | 19.2%(-15.2)#4 | 20.1%(-16.1)#78 |
| 5. | Arlington Heights | 4.8% | 19.2%(-14.4)#5 | 20.1%(-15.3)#110 |
| 6. | Glenview | 5.1% | 19.2%(-14.1)#6 | 20.1%(-15.0)#124 |
| 7. | Mount Prospect | 5.2% | 19.2%(-14.0)#7 | 20.1%(-14.9)#129 |
| 8. | Skokie | 5.4% | 19.2%(-13.8)#8 | 20.1%(-14.7)#136 |
| 9. | Evergreen Park | 5.6% | 19.2%(-13.6)#9 | 20.1%(-14.5)#146 |
| 10. | Mundelein | 6.0% | 19.2%(-13.2)#10 | 20.1%(-14.1)#165 |
| 11. | Jacksonville | 8.2% | 19.2%(-11.0)#11 | 20.1%(-11.9)#269 |
| 12. | Palatine | 9.0% | 19.2%(-10.2)#12 | 20.1%(-11.1)#300 |
| 13. | Elgin | 9.6% | 19.2%(-9.60)#13 | 20.1%(-10.5)#327 |
| 14. | Joliet | 9.9% | 19.2%(-9.30)#14 | 20.1%(-10.2)#342 |
| 15. | Oak Lawn | 10.1% | 19.2%(-9.10)#15 | 20.1%(-10.0)#353 |
| 16. | Fox Lake | 10.1% | 19.2%(-9.10)#16 | 20.1%(-10.0)#356 |
| 17. | Lake In The Hills | 10.2% | 19.2%(-9.00)#17 | 20.1%(-9.90)#362 |
| 18. | Naperville | 11.1% | 19.2%(-8.10)#18 | 20.1%(-9.00)#390 |
| 19. | Machesney Park | 11.1% | 19.2%(-8.10)#19 | 20.1%(-9.00)#392 |
| 20. | Collinsville | 11.3% | 19.2%(-7.90)#20 | 20.1%(-8.80)#399 |
| 21. | South Elgin | 11.4% | 19.2%(-7.80)#21 | 20.1%(-8.70)#407 |
| 22. | Wheaton | 11.5% | 19.2%(-7.70)#22 | 20.1%(-8.60)#415 |
| 23. | Winfield | 11.9% | 19.2%(-7.30)#23 | 20.1%(-8.20)#429 |
| 24. | Chatham | 12.0% | 19.2%(-7.20)#24 | 20.1%(-8.10)#435 |
| 25. | Woodstock | 12.3% | 19.2%(-6.90)#25 | 20.1%(-7.80)#452 |
| 26. | Burr Ridge | 12.6% | 19.2%(-6.60)#26 | 20.1%(-7.50)#471 |
| 27. | Hoffman Estates | 12.8% | 19.2%(-6.40)#27 | 20.1%(-7.30)#477 |
| 28. | Edwardsville | 12.9% | 19.2%(-6.30)#28 | 20.1%(-7.20)#486 |
| 29. | Schaumburg | 13.0% | 19.2%(-6.20)#29 | 20.1%(-7.10)#490 |
| 30. | Bensenville | 13.7% | 19.2%(-5.50)#30 | 20.1%(-6.40)#533 |
| 31. | Grayslake | 14.0% | 19.2%(-5.20)#31 | 20.1%(-6.10)#555 |
| 32. | Glen Ellyn | 14.6% | 19.2%(-4.60)#32 | 20.1%(-5.50)#589 |
| 33. | Bloomingdale | 15.0% | 19.2%(-4.20)#33 | 20.1%(-5.10)#615 |
| 34. | Justice | 15.1% | 19.2%(-4.10)#34 | 20.1%(-5.00)#623 |
| 35. | Lombard | 16.2% | 19.2%(-3.00)#35 | 20.1%(-3.90)#684 |
| 36. | Hanover Park | 16.2% | 19.2%(-3.00)#36 | 20.1%(-3.90)#686 |
| 37. | Oak Park | 16.6% | 19.2%(-2.60)#37 | 20.1%(-3.50)#704 |
| 38. | Sycamore | 17.3% | 19.2%(-1.90)#38 | 20.1%(-2.80)#748 |
| 39. | Villa Park | 17.8% | 19.2%(-1.40)#39 | 20.1%(-2.30)#767 |
| 40. | Libertyville | 17.9% | 19.2%(-1.30)#40 | 20.1%(-2.20)#771 |
| 41. | Frankfort Square | 18.0% | 19.2%(-1.20)#41 | 20.1%(-2.10)#786 |
| 42. | Homer Glen | 18.7% | 19.2%(-0.500)#42 | 20.1%(-1.40)#820 |
| 43. | Carol Stream | 19.0% | 19.2%(-0.200)#43 | 20.1%(-1.10)#833 |
| 44. | East Moline | 19.0% | 19.2%(-0.200)#44 | 20.1%(-1.10)#835 |
| 45. | Waukegan | 19.3% | 19.2%(+0.100)#45 | 20.1%(-0.800)#842 |
| 46. | Calumet City | 19.5% | 19.2%(+0.300)#46 | 20.1%(-0.600)#851 |
| 47. | Darien | 19.5% | 19.2%(+0.300)#47 | 20.1%(-0.600)#852 |
| 48. | Urbana | 19.9% | 19.2%(+0.700)#48 | 20.1%(-0.200)#871 |
| 49. | Lake Holiday | 20.2% | 19.2%(+1.000)#49 | 20.1%(+0.100)#891 |
| 50. | Chicago | 21.1% | 19.2%(+1.90)#50 | 20.1%(+1.00)#932 |
| 51. | Buffalo Grove | 21.8% | 19.2%(+2.60)#51 | 20.1%(+1.70)#971 |
| 52. | Des Plaines | 22.0% | 19.2%(+2.80)#52 | 20.1%(+1.90)#979 |
| 53. | Caseyville | 22.6% | 19.2%(+3.40)#53 | 20.1%(+2.50)#1,011 |
| 54. | Aurora | 23.4% | 19.2%(+4.20)#54 | 20.1%(+3.30)#1,039 |
| 55. | Bartlett | 24.3% | 19.2%(+5.10)#55 | 20.1%(+4.20)#1,079 |
| 56. | Peoria | 24.5% | 19.2%(+5.30)#56 | 20.1%(+4.40)#1,082 |
| 57. | Northfield | 26.0% | 19.2%(+6.80)#57 | 20.1%(+5.90)#1,161 |
| 58. | Pekin | 26.2% | 19.2%(+7.00)#58 | 20.1%(+6.10)#1,166 |
| 59. | Sandwich | 26.3% | 19.2%(+7.10)#59 | 20.1%(+6.20)#1,174 |
| 60. | River Forest | 28.3% | 19.2%(+9.10)#60 | 20.1%(+8.20)#1,267 |
| 61. | Champaign | 30.1% | 19.2%(+10.9)#61 | 20.1%(+10.00)#1,348 |
| 62. | Bloomington | 30.2% | 19.2%(+11.0)#62 | 20.1%(+10.1)#1,352 |
| 63. | Lincolnwood | 31.0% | 19.2%(+11.8)#63 | 20.1%(+10.9)#1,383 |
| 64. | Mendota | 31.0% | 19.2%(+11.8)#64 | 20.1%(+10.9)#1,385 |
| 65. | Galesburg | 31.2% | 19.2%(+12.0)#65 | 20.1%(+11.1)#1,390 |
| 66. | Prospect Heights | 32.2% | 19.2%(+13.0)#66 | 20.1%(+12.1)#1,431 |
| 67. | Decatur | 32.3% | 19.2%(+13.1)#67 | 20.1%(+12.2)#1,433 |
| 68. | Addison | 32.6% | 19.2%(+13.4)#68 | 20.1%(+12.5)#1,440 |
| 69. | Round Lake Beach | 32.8% | 19.2%(+13.6)#69 | 20.1%(+12.7)#1,447 |
| 70. | St Charles | 33.1% | 19.2%(+13.9)#70 | 20.1%(+13.0)#1,453 |
| 71. | Channahon | 33.3% | 19.2%(+14.1)#71 | 20.1%(+13.2)#1,465 |
| 72. | University Park | 33.6% | 19.2%(+14.4)#72 | 20.1%(+13.5)#1,513 |
| 73. | Glendale Heights | 34.3% | 19.2%(+15.1)#73 | 20.1%(+14.2)#1,533 |
| 74. | Tinley Park | 34.4% | 19.2%(+15.2)#74 | 20.1%(+14.3)#1,538 |
| 75. | Braidwood | 34.5% | 19.2%(+15.3)#75 | 20.1%(+14.4)#1,541 |
| 76. | Burbank | 36.1% | 19.2%(+16.9)#76 | 20.1%(+16.0)#1,608 |
| 77. | Mackinaw | 36.4% | 19.2%(+17.2)#77 | 20.1%(+16.3)#1,617 |
| 78. | Worth | 37.2% | 19.2%(+18.0)#78 | 20.1%(+17.1)#1,642 |
| 79. | Wauconda | 37.3% | 19.2%(+18.1)#79 | 20.1%(+17.2)#1,646 |
| 80. | Gages Lake | 37.8% | 19.2%(+18.6)#80 | 20.1%(+17.7)#1,673 |
| 81. | Carpentersville | 38.1% | 19.2%(+18.9)#81 | 20.1%(+18.0)#1,683 |
| 82. | Rosemont | 38.1% | 19.2%(+18.9)#82 | 20.1%(+18.0)#1,687 |
| 83. | Madison | 38.1% | 19.2%(+18.9)#83 | 20.1%(+18.0)#1,688 |
| 84. | La Grange Park | 38.5% | 19.2%(+19.3)#84 | 20.1%(+18.4)#1,702 |
| 85. | O Fallon | 39.8% | 19.2%(+20.6)#85 | 20.1%(+19.7)#1,731 |
| 86. | Thornton | 40.0% | 19.2%(+20.8)#86 | 20.1%(+19.9)#1,749 |
| 87. | Kewanee | 40.4% | 19.2%(+21.2)#87 | 20.1%(+20.3)#1,769 |
| 88. | Springfield | 41.2% | 19.2%(+22.0)#88 | 20.1%(+21.1)#1,787 |
| 89. | Cicero | 41.6% | 19.2%(+22.4)#89 | 20.1%(+21.5)#1,799 |
| 90. | Rockford | 42.4% | 19.2%(+23.2)#90 | 20.1%(+22.3)#1,819 |
| 91. | Martinsville | 42.9% | 19.2%(+23.7)#91 | 20.1%(+22.8)#1,840 |
| 92. | Matteson | 43.5% | 19.2%(+24.3)#92 | 20.1%(+23.4)#1,852 |
| 93. | Rock Island | 45.8% | 19.2%(+26.6)#93 | 20.1%(+25.7)#1,932 |
| 94. | Dekalb | 47.1% | 19.2%(+27.9)#94 | 20.1%(+27.0)#1,960 |
| 95. | Lansing | 47.1% | 19.2%(+27.9)#95 | 20.1%(+27.0)#1,961 |
| 96. | Loves Park | 48.1% | 19.2%(+28.9)#96 | 20.1%(+28.0)#1,991 |
| 97. | Mchenry | 50.0% | 19.2%(+30.8)#97 | 20.1%(+29.9)#2,027 |
| 98. | Alton | 50.0% | 19.2%(+30.8)#98 | 20.1%(+29.9)#2,028 |
| 99. | Salem | 50.0% | 19.2%(+30.8)#99 | 20.1%(+29.9)#2,040 |
| 100. | Hinckley | 50.0% | 19.2%(+30.8)#100 | 20.1%(+29.9)#2,055 |
Common Questions
What are the Top 10 Cities with the Lowest Percentage of Births to Unmarried Women over the Age of 35 in Illinois?
Top 10 Cities with the Lowest Percentage of Births to Unmarried Women over the Age of 35 in Illinois are:
#1
2.3%
#2
2.7%
#3
3.7%
#4
4.0%
#5
4.8%
#6
5.1%
#7
5.2%
#8
5.4%
#9
5.6%
#10
6.0%
What city has the Lowest Percentage of Births to Unmarried Women over the Age of 35 in Illinois?
Downers Grove has the Lowest Percentage of Births to Unmarried Women over the Age of 35 in Illinois with 2.3%.
What is the Percentage of Births to Unmarried Women over the Age of 35 in the State of Illinois?
Percentage of Births to Unmarried Women over the Age of 35 in Illinois is 19.2%.
What is the Percentage of Births to Unmarried Women over the Age of 35 in the United States?
Percentage of Births to Unmarried Women over the Age of 35 in the United States is 20.1%.