West Puente Valley, CA Map & Demographics
West Puente Valley Map
West Puente Valley Overview
$25,030
PER CAPITA INCOME
$88,362
AVG FAMILY INCOME
$84,365
AVG HOUSEHOLD INCOME
19.8%
WAGE / INCOME GAP [ % ]
80.2¢/ $1
WAGE / INCOME GAP [ $ ]
$10,578
FAMILY INCOME DEFICIT
0.42
INEQUALITY / GINI INDEX
22,074
TOTAL POPULATION
11,514
MALE POPULATION
10,560
FEMALE POPULATION
109.03
MALES / 100 FEMALES
91.71
FEMALES / 100 MALES
39.1
MEDIAN AGE
4.5
AVG FAMILY SIZE
4.3
AVG HOUSEHOLD SIZE
10,778
LABOR FORCE [ PEOPLE ]
60.6%
PERCENT IN LABOR FORCE
7.3%
UNEMPLOYMENT RATE
Income in West Puente Valley
Income Overview in West Puente Valley
Per Capita Income in West Puente Valley is $25,030, while median incomes of families and households are $88,362 and $84,365 respectively.
| Characteristic | Number | Measure |
| Per Capita Income | 22,074 | $25,030 |
| Median Family Income | 4,450 | $88,362 |
| Mean Family Income | 4,450 | $102,827 |
| Median Household Income | 5,090 | $84,365 |
| Mean Household Income | 5,090 | $101,743 |
| Income Deficit | 4,450 | $10,578 |
| Wage / Income Gap (%) | 22,074 | 19.79% |
| Wage / Income Gap ($) | 22,074 | 80.21¢ per $1 |
| Gini / Inequality Index | 22,074 | 0.42 |
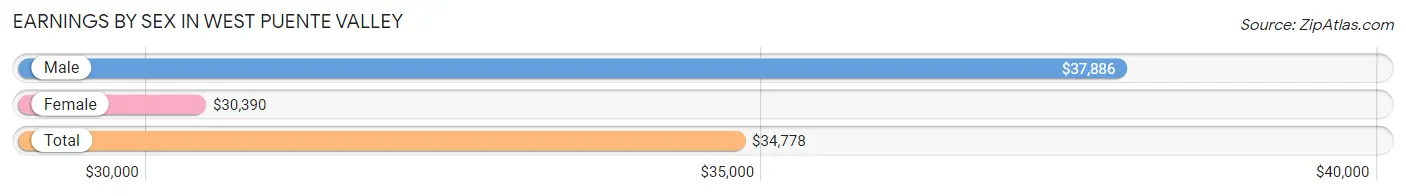
Earnings by Sex in West Puente Valley
Average Earnings in West Puente Valley are $34,778, $37,886 for men and $30,390 for women, a difference of 19.8%.
| Sex | Number | Average Earnings |
| Male | 6,064 (56.7%) | $37,886 |
| Female | 4,638 (43.3%) | $30,390 |
| Total | 10,702 (100.0%) | $34,778 |
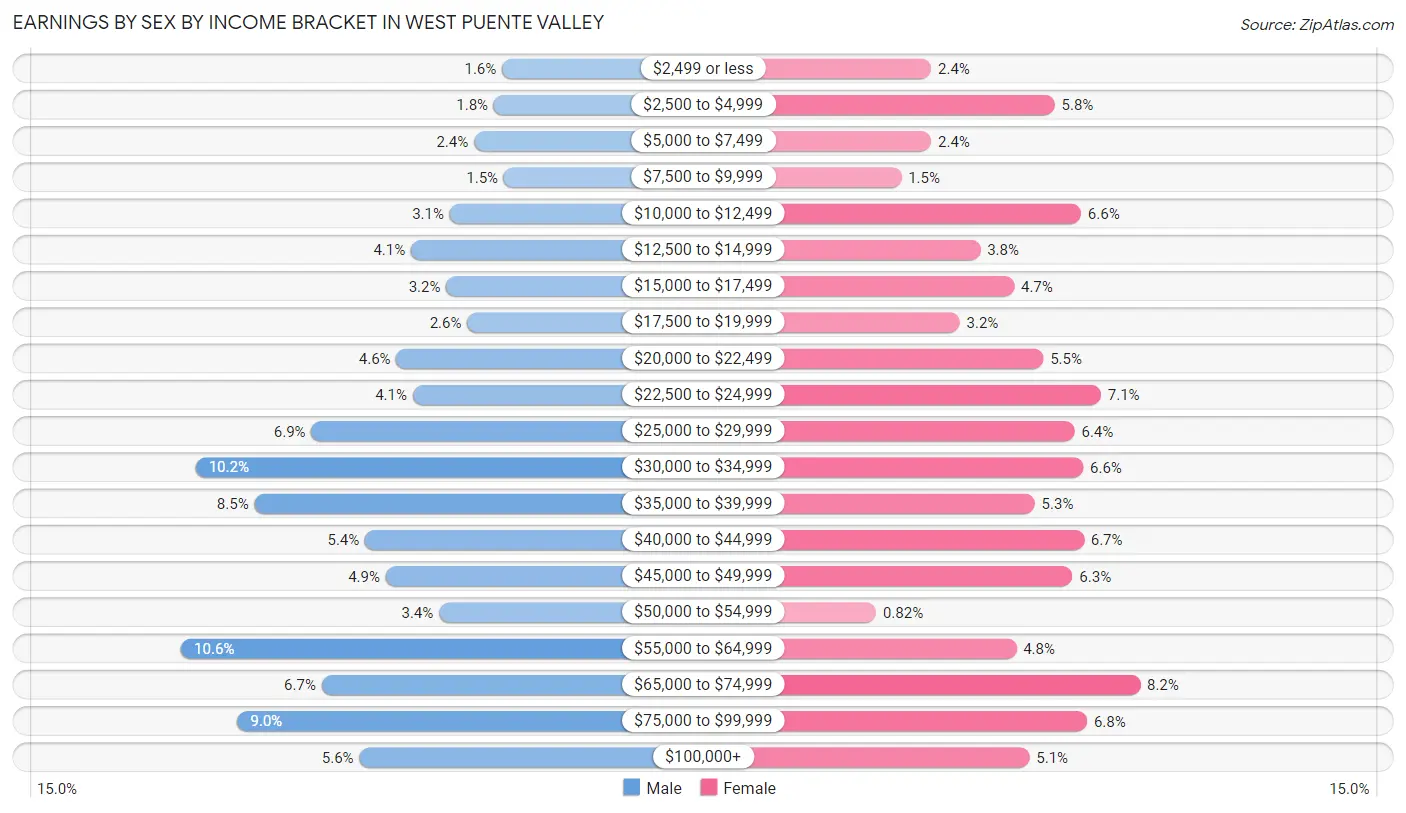
Earnings by Sex by Income Bracket in West Puente Valley
The most common earnings brackets in West Puente Valley are $55,000 to $64,999 for men (643 | 10.6%) and $65,000 to $74,999 for women (382 | 8.2%).
| Income | Male | Female |
| $2,499 or less | 96 (1.6%) | 110 (2.4%) |
| $2,500 to $4,999 | 110 (1.8%) | 271 (5.8%) |
| $5,000 to $7,499 | 144 (2.4%) | 110 (2.4%) |
| $7,500 to $9,999 | 93 (1.5%) | 71 (1.5%) |
| $10,000 to $12,499 | 185 (3.0%) | 305 (6.6%) |
| $12,500 to $14,999 | 251 (4.1%) | 174 (3.7%) |
| $15,000 to $17,499 | 191 (3.2%) | 218 (4.7%) |
| $17,500 to $19,999 | 155 (2.6%) | 147 (3.2%) |
| $20,000 to $22,499 | 276 (4.5%) | 256 (5.5%) |
| $22,500 to $24,999 | 248 (4.1%) | 331 (7.1%) |
| $25,000 to $29,999 | 421 (6.9%) | 297 (6.4%) |
| $30,000 to $34,999 | 618 (10.2%) | 308 (6.6%) |
| $35,000 to $39,999 | 518 (8.5%) | 245 (5.3%) |
| $40,000 to $44,999 | 329 (5.4%) | 309 (6.7%) |
| $45,000 to $49,999 | 294 (4.9%) | 294 (6.3%) |
| $50,000 to $54,999 | 203 (3.4%) | 38 (0.8%) |
| $55,000 to $64,999 | 643 (10.6%) | 221 (4.8%) |
| $65,000 to $74,999 | 403 (6.7%) | 382 (8.2%) |
| $75,000 to $99,999 | 547 (9.0%) | 313 (6.8%) |
| $100,000+ | 339 (5.6%) | 238 (5.1%) |
| Total | 6,064 (100.0%) | 4,638 (100.0%) |
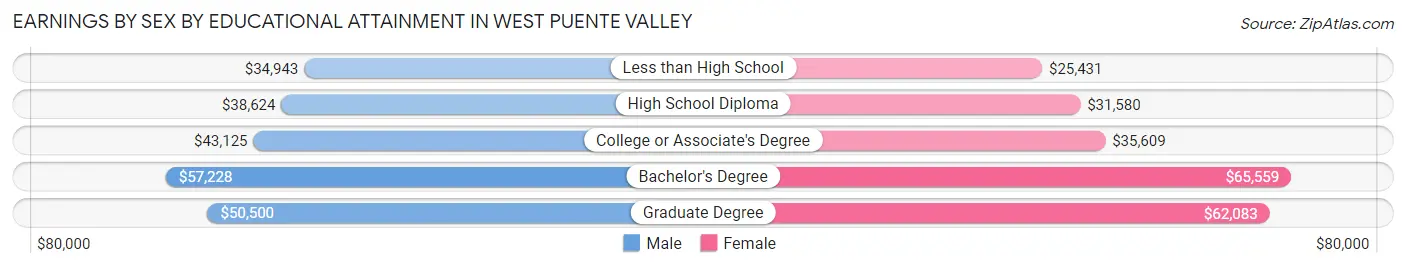
Earnings by Sex by Educational Attainment in West Puente Valley
Average earnings in West Puente Valley are $40,083 for men and $35,348 for women, a difference of 11.8%. Men with an educational attainment of bachelor's degree enjoy the highest average annual earnings of $57,228, while those with less than high school education earn the least with $34,943. Women with an educational attainment of bachelor's degree earn the most with the average annual earnings of $65,559, while those with less than high school education have the smallest earnings of $25,431.
| Educational Attainment | Male Income | Female Income |
| Less than High School | $34,943 | $25,431 |
| High School Diploma | $38,624 | $31,580 |
| College or Associate's Degree | $43,125 | $35,609 |
| Bachelor's Degree | $57,228 | $65,559 |
| Graduate Degree | $50,500 | $62,083 |
| Total | $40,083 | $35,348 |
Family Income in West Puente Valley
Family Income Brackets in West Puente Valley
According to the West Puente Valley family income data, there are 970 families falling into the $100,000 to $149,999 income range, which is the most common income bracket and makes up 21.8% of all families. Conversely, the $10,000 to $14,999 income bracket is the least frequent group with only 44 families (1.0%) belonging to this category.
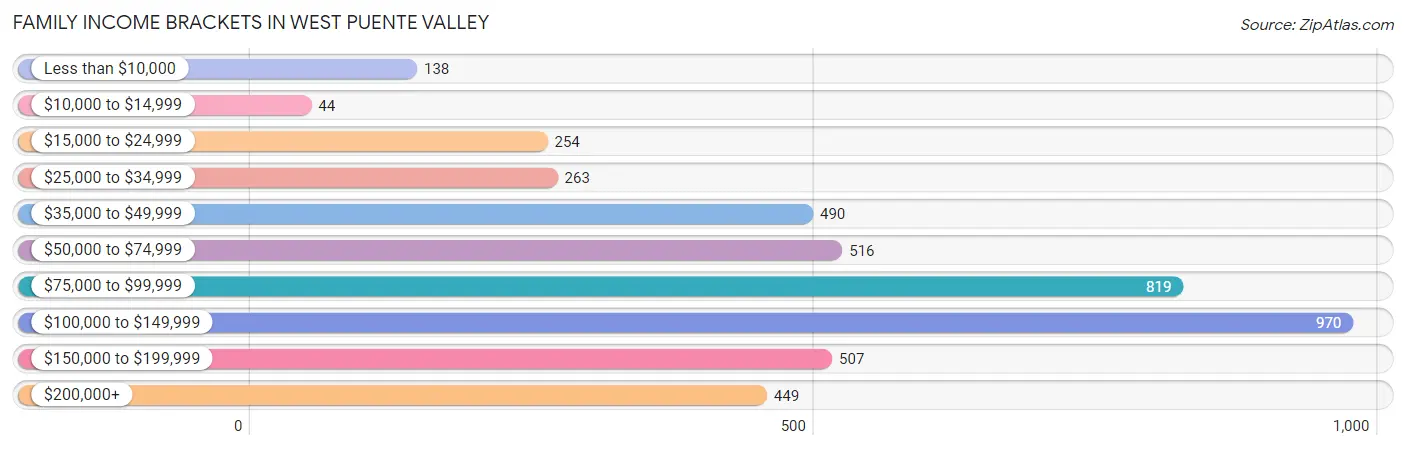
| Income Bracket | # Families | % Families |
| Less than $10,000 | 138 | 3.1% |
| $10,000 to $14,999 | 44 | 1.0% |
| $15,000 to $24,999 | 254 | 5.7% |
| $25,000 to $34,999 | 263 | 5.9% |
| $35,000 to $49,999 | 490 | 11.0% |
| $50,000 to $74,999 | 516 | 11.6% |
| $75,000 to $99,999 | 819 | 18.4% |
| $100,000 to $149,999 | 970 | 21.8% |
| $150,000 to $199,999 | 507 | 11.4% |
| $200,000+ | 449 | 10.1% |
Family Income by Famaliy Size in West Puente Valley
7+ person families (509 | 11.4%) account for the highest median family income in West Puente Valley with $140,156 per family, while 3-person families (906 | 20.4%) have the highest median income of $27,581 per family member.
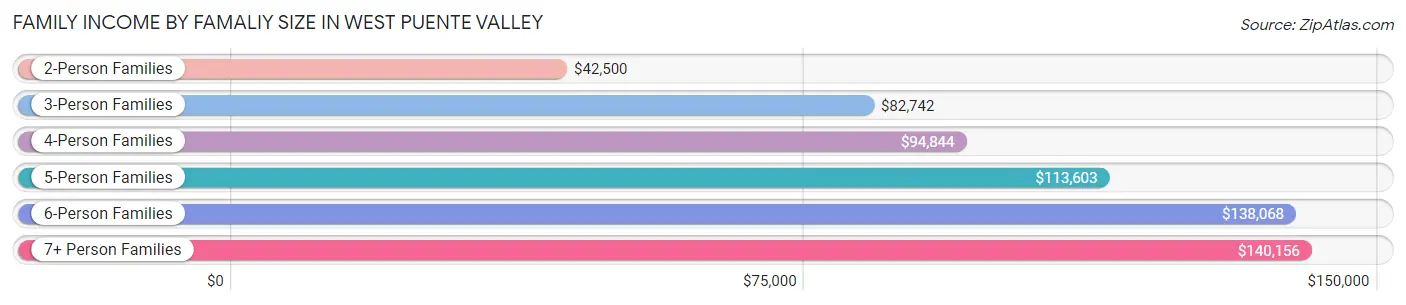
| Income Bracket | # Families | Median Income |
| 2-Person Families | 1,056 (23.7%) | $42,500 |
| 3-Person Families | 906 (20.4%) | $82,742 |
| 4-Person Families | 801 (18.0%) | $94,844 |
| 5-Person Families | 657 (14.8%) | $113,603 |
| 6-Person Families | 521 (11.7%) | $138,068 |
| 7+ Person Families | 509 (11.4%) | $140,156 |
| Total | 4,450 (100.0%) | $88,362 |
Family Income by Number of Earners in West Puente Valley
The median family income in West Puente Valley is $88,362, with families comprising 3+ earners (1,417) having the highest median family income of $142,269, while families with no earners (676) have the lowest median family income of $32,422, accounting for 31.8% and 15.2% of families, respectively.
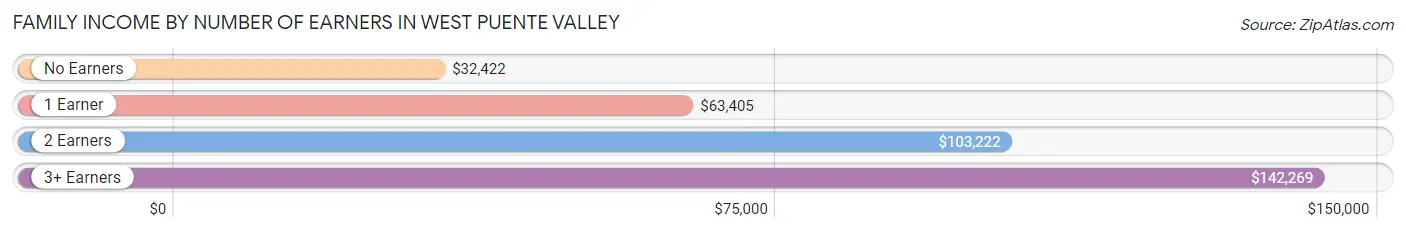
| Number of Earners | # Families | Median Income |
| No Earners | 676 (15.2%) | $32,422 |
| 1 Earner | 1,033 (23.2%) | $63,405 |
| 2 Earners | 1,324 (29.7%) | $103,222 |
| 3+ Earners | 1,417 (31.8%) | $142,269 |
| Total | 4,450 (100.0%) | $88,362 |
Household Income in West Puente Valley
Household Income Brackets in West Puente Valley
With 1,013 households falling in the category, the $100,000 to $149,999 income range is the most frequent in West Puente Valley, accounting for 19.9% of all households. In contrast, only 143 households (2.8%) fall into the $10,000 to $14,999 income bracket, making it the least populous group.
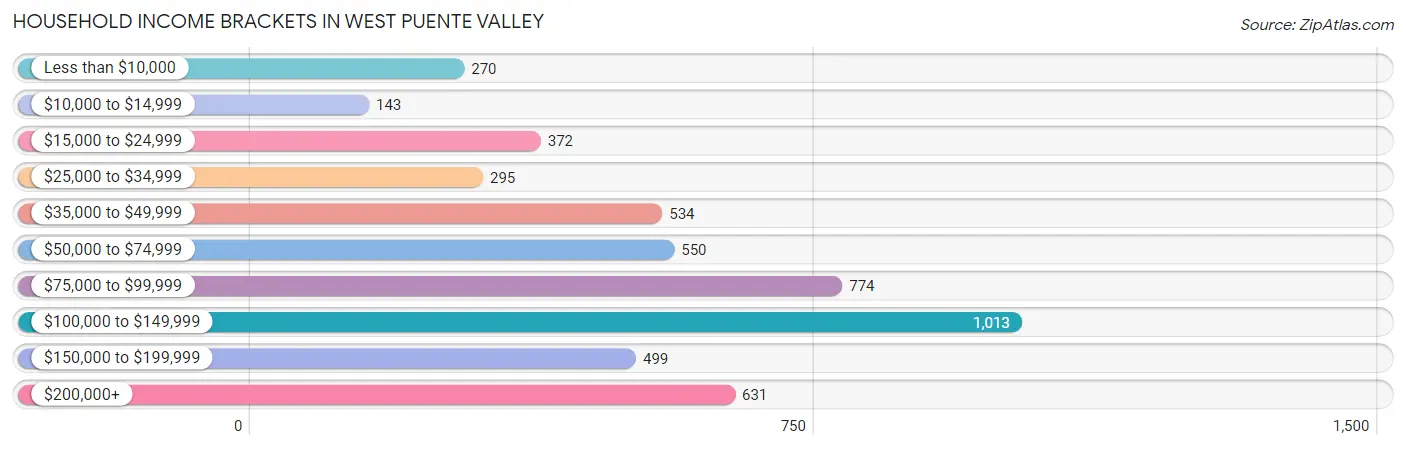
| Income Bracket | # Households | % Households |
| Less than $10,000 | 270 | 5.3% |
| $10,000 to $14,999 | 143 | 2.8% |
| $15,000 to $24,999 | 372 | 7.3% |
| $25,000 to $34,999 | 295 | 5.8% |
| $35,000 to $49,999 | 534 | 10.5% |
| $50,000 to $74,999 | 550 | 10.8% |
| $75,000 to $99,999 | 774 | 15.2% |
| $100,000 to $149,999 | 1,013 | 19.9% |
| $150,000 to $199,999 | 499 | 9.8% |
| $200,000+ | 631 | 12.4% |
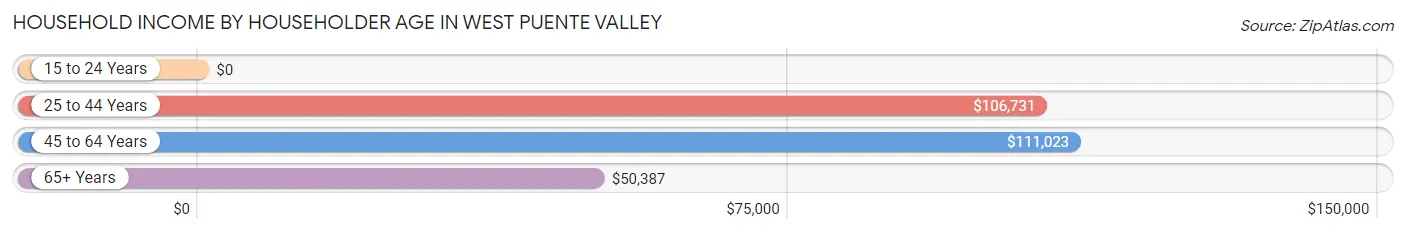
Household Income by Householder Age in West Puente Valley
The median household income in West Puente Valley is $84,365, with the highest median household income of $111,023 found in the 45 to 64 years age bracket for the primary householder. A total of 1,988 households (39.1%) fall into this category. Meanwhile, the 15 to 24 years age bracket for the primary householder has the lowest median household income of $0, with 11 households (0.2%) in this group.
| Income Bracket | # Households | Median Income |
| 15 to 24 Years | 11 (0.2%) | $0 |
| 25 to 44 Years | 1,148 (22.6%) | $106,731 |
| 45 to 64 Years | 1,988 (39.1%) | $111,023 |
| 65+ Years | 1,943 (38.2%) | $50,387 |
| Total | 5,090 (100.0%) | $84,365 |
Poverty in West Puente Valley
Income Below Poverty by Sex and Age in West Puente Valley
With 10.4% poverty level for males and 14.2% for females among the residents of West Puente Valley, 6 to 11 year old males and under 5 year old females are the most vulnerable to poverty, with 192 males (22.2%) and 94 females (23.1%) in their respective age groups living below the poverty level.
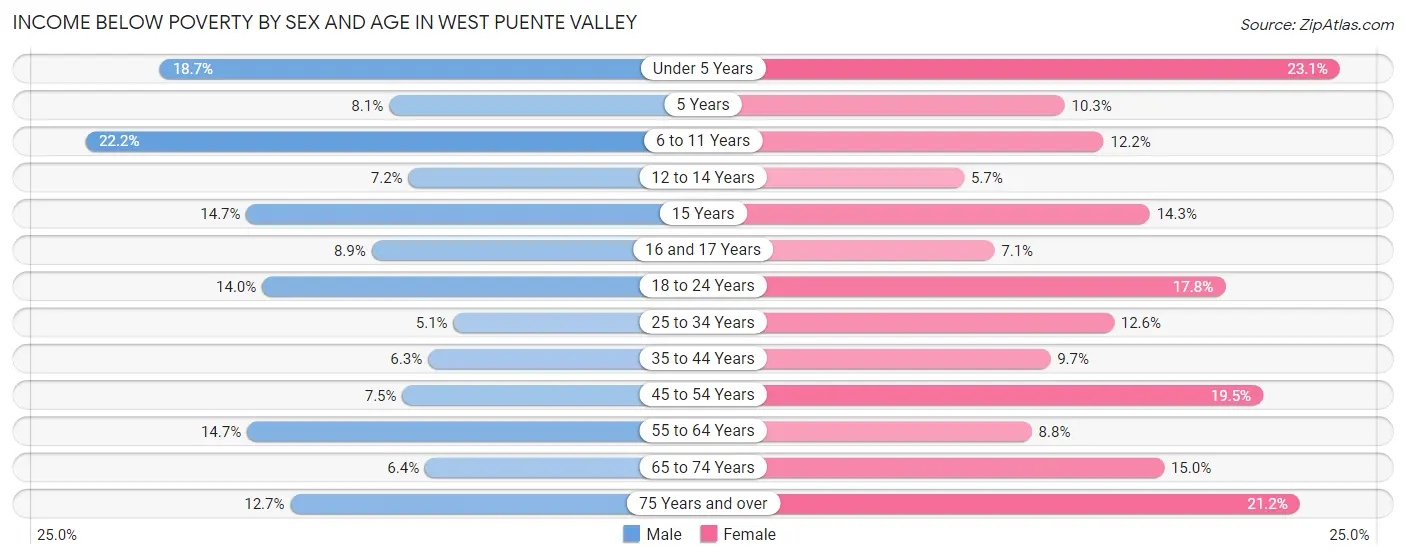
| Age Bracket | Male | Female |
| Under 5 Years | 106 (18.7%) | 94 (23.1%) |
| 5 Years | 14 (8.1%) | 6 (10.3%) |
| 6 to 11 Years | 192 (22.2%) | 90 (12.1%) |
| 12 to 14 Years | 43 (7.2%) | 25 (5.7%) |
| 15 Years | 25 (14.7%) | 26 (14.3%) |
| 16 and 17 Years | 25 (8.9%) | 16 (7.1%) |
| 18 to 24 Years | 162 (14.0%) | 184 (17.8%) |
| 25 to 34 Years | 74 (5.1%) | 135 (12.6%) |
| 35 to 44 Years | 116 (6.3%) | 151 (9.7%) |
| 45 to 54 Years | 108 (7.5%) | 280 (19.5%) |
| 55 to 64 Years | 174 (14.7%) | 105 (8.8%) |
| 65 to 74 Years | 67 (6.4%) | 184 (14.9%) |
| 75 Years and over | 82 (12.7%) | 205 (21.2%) |
| Total | 1,188 (10.4%) | 1,501 (14.2%) |
Income Above Poverty by Sex and Age in West Puente Valley
According to the poverty statistics in West Puente Valley, males aged 25 to 34 years and females aged 12 to 14 years are the age groups that are most secure financially, with 94.9% of males and 94.3% of females in these age groups living above the poverty line.
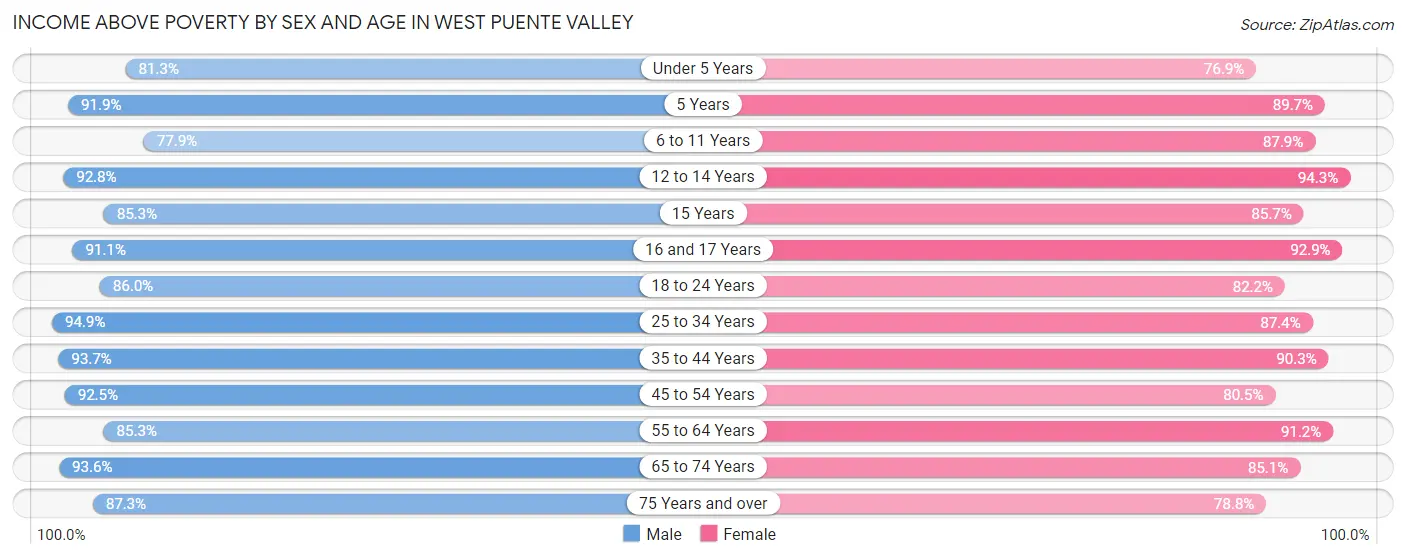
| Age Bracket | Male | Female |
| Under 5 Years | 460 (81.3%) | 313 (76.9%) |
| 5 Years | 159 (91.9%) | 52 (89.7%) |
| 6 to 11 Years | 675 (77.8%) | 651 (87.8%) |
| 12 to 14 Years | 555 (92.8%) | 416 (94.3%) |
| 15 Years | 145 (85.3%) | 156 (85.7%) |
| 16 and 17 Years | 256 (91.1%) | 210 (92.9%) |
| 18 to 24 Years | 997 (86.0%) | 851 (82.2%) |
| 25 to 34 Years | 1,378 (94.9%) | 935 (87.4%) |
| 35 to 44 Years | 1,731 (93.7%) | 1,411 (90.3%) |
| 45 to 54 Years | 1,338 (92.5%) | 1,153 (80.5%) |
| 55 to 64 Years | 1,011 (85.3%) | 1,087 (91.2%) |
| 65 to 74 Years | 976 (93.6%) | 1,047 (85.1%) |
| 75 Years and over | 565 (87.3%) | 760 (78.8%) |
| Total | 10,246 (89.6%) | 9,042 (85.8%) |
Income Below Poverty Among Married-Couple Families in West Puente Valley
The poverty statistics for married-couple families in West Puente Valley show that 5.1% or 157 of the total 3,073 families live below the poverty line. Families with 3 or 4 children have the highest poverty rate of 13.7%, comprising of 59 families. On the other hand, families with 5 or more children have the lowest poverty rate of 0.0%, which includes 0 families.
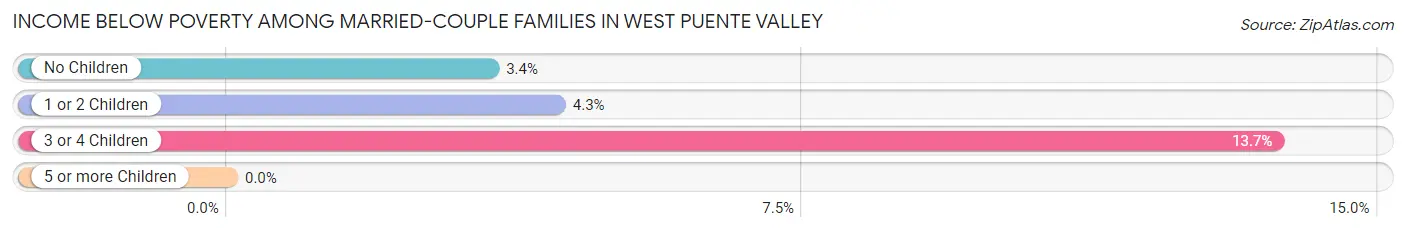
| Children | Above Poverty | Below Poverty |
| No Children | 1,443 (96.6%) | 51 (3.4%) |
| 1 or 2 Children | 1,052 (95.7%) | 47 (4.3%) |
| 3 or 4 Children | 373 (86.3%) | 59 (13.7%) |
| 5 or more Children | 48 (100.0%) | 0 (0.0%) |
| Total | 2,916 (94.9%) | 157 (5.1%) |
Income Below Poverty Among Single-Parent Households in West Puente Valley
According to the poverty data in West Puente Valley, 5.7% or 22 single-father households and 28.0% or 278 single-mother households are living below the poverty line. Among single-father households, those with 1 or 2 children have the highest poverty rate, with 15 households (12.3%) experiencing poverty. Likewise, among single-mother households, those with 5 or more children have the highest poverty rate, with 20 households (76.9%) falling below the poverty line.
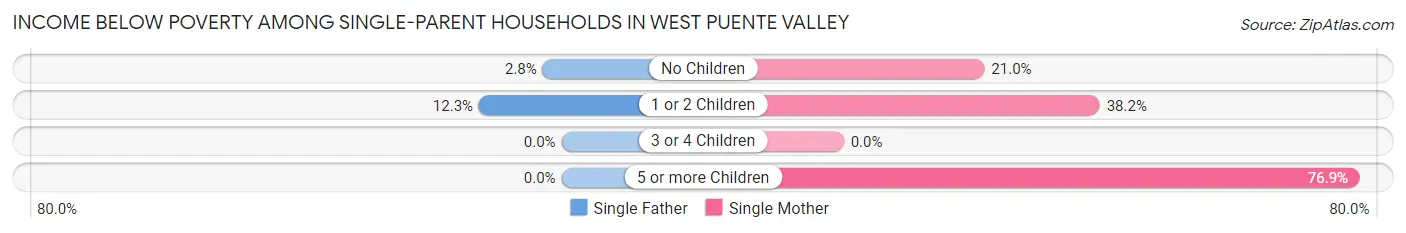
| Children | Single Father | Single Mother |
| No Children | 7 (2.8%) | 121 (21.0%) |
| 1 or 2 Children | 15 (12.3%) | 137 (38.2%) |
| 3 or 4 Children | 0 (0.0%) | 0 (0.0%) |
| 5 or more Children | 0 (0.0%) | 20 (76.9%) |
| Total | 22 (5.7%) | 278 (28.0%) |
Income Below Poverty Among Married-Couple vs Single-Parent Households in West Puente Valley
The poverty data for West Puente Valley shows that 157 of the married-couple family households (5.1%) and 300 of the single-parent households (21.8%) are living below the poverty level. Within the married-couple family households, those with 3 or 4 children have the highest poverty rate, with 59 households (13.7%) falling below the poverty line. Among the single-parent households, those with 5 or more children have the highest poverty rate, with 20 household (57.1%) living below poverty.
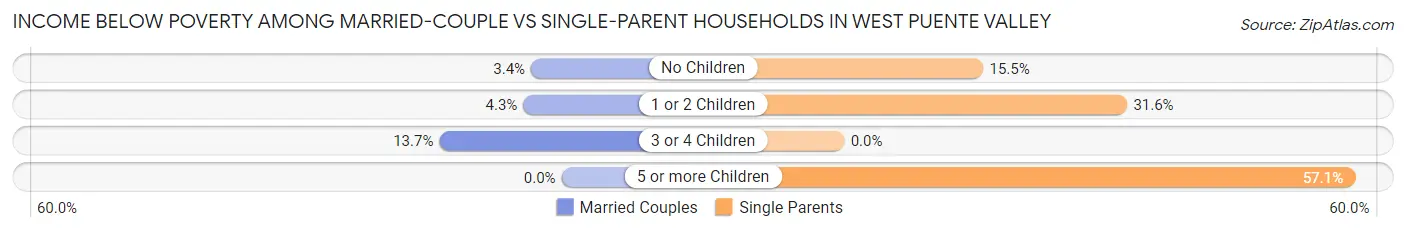
| Children | Married-Couple Families | Single-Parent Households |
| No Children | 51 (3.4%) | 128 (15.5%) |
| 1 or 2 Children | 47 (4.3%) | 152 (31.6%) |
| 3 or 4 Children | 59 (13.7%) | 0 (0.0%) |
| 5 or more Children | 0 (0.0%) | 20 (57.1%) |
| Total | 157 (5.1%) | 300 (21.8%) |
Race in West Puente Valley
The most populous races in West Puente Valley are Hispanic or Latino (17,823 | 80.7%), Some other Race (8,052 | 36.5%), and White / Caucasian (7,275 | 33.0%).
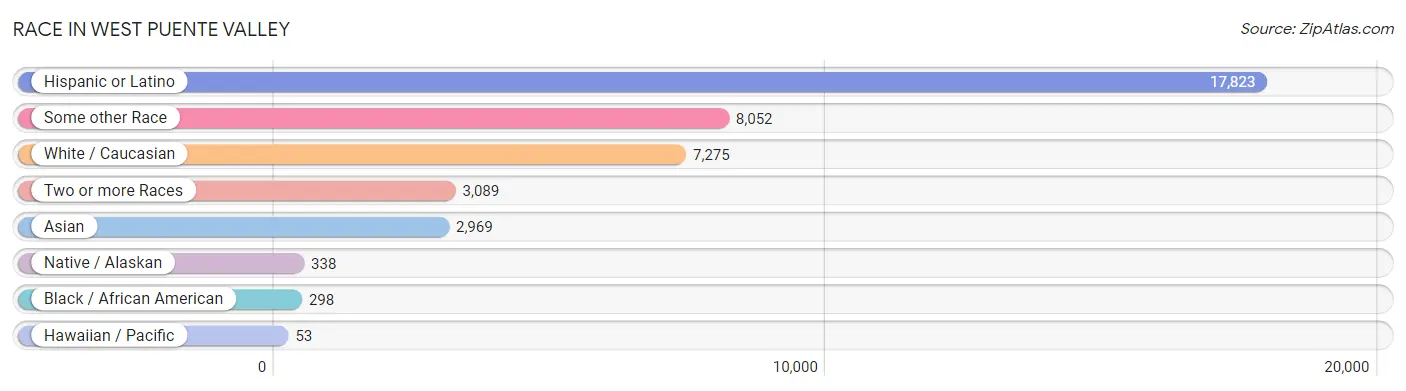
| Race | # Population | % Population |
| Asian | 2,969 | 13.5% |
| Black / African American | 298 | 1.3% |
| Hawaiian / Pacific | 53 | 0.2% |
| Hispanic or Latino | 17,823 | 80.7% |
| Native / Alaskan | 338 | 1.5% |
| White / Caucasian | 7,275 | 33.0% |
| Two or more Races | 3,089 | 14.0% |
| Some other Race | 8,052 | 36.5% |
| Total | 22,074 | 100.0% |
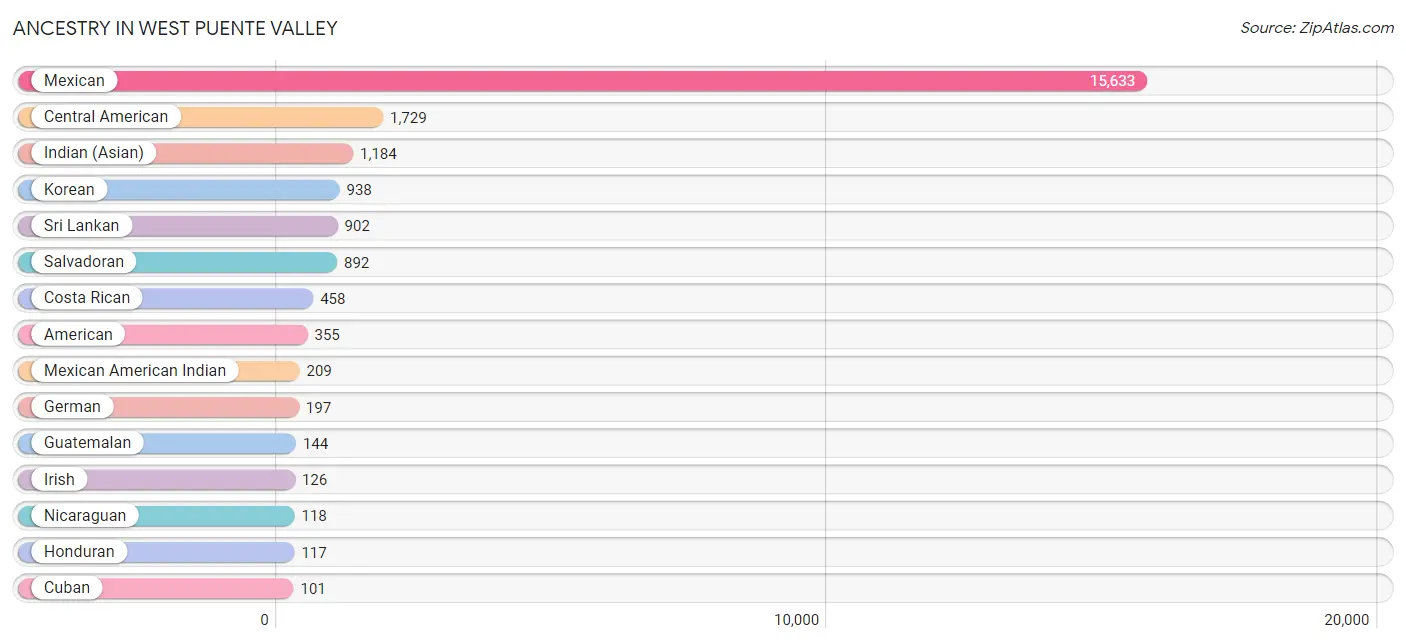
Ancestry in West Puente Valley
The most populous ancestries reported in West Puente Valley are Mexican (15,633 | 70.8%), Central American (1,729 | 7.8%), Indian (Asian) (1,184 | 5.4%), Korean (938 | 4.3%), and Sri Lankan (902 | 4.1%), together accounting for 92.4% of all West Puente Valley residents.
| Ancestry | # Population | % Population |
| African | 3 | 0.0% |
| American | 355 | 1.6% |
| Apache | 5 | 0.0% |
| Belizean | 8 | 0.0% |
| Bhutanese | 13 | 0.1% |
| British | 6 | 0.0% |
| Burmese | 6 | 0.0% |
| Central American | 1,729 | 7.8% |
| Central American Indian | 37 | 0.2% |
| Colombian | 20 | 0.1% |
| Costa Rican | 458 | 2.1% |
| Croatian | 11 | 0.1% |
| Cuban | 101 | 0.5% |
| Czechoslovakian | 8 | 0.0% |
| Dutch | 58 | 0.3% |
| Ecuadorian | 11 | 0.1% |
| English | 77 | 0.4% |
| European | 18 | 0.1% |
| Filipino | 17 | 0.1% |
| French | 21 | 0.1% |
| French Canadian | 14 | 0.1% |
| German | 197 | 0.9% |
| Greek | 37 | 0.2% |
| Guamanian / Chamorro | 46 | 0.2% |
| Guatemalan | 144 | 0.6% |
| Honduran | 117 | 0.5% |
| Indian (Asian) | 1,184 | 5.4% |
| Indonesian | 11 | 0.1% |
| Iranian | 1 | 0.0% |
| Irish | 126 | 0.6% |
| Italian | 50 | 0.2% |
| Japanese | 88 | 0.4% |
| Korean | 938 | 4.3% |
| Laotian | 24 | 0.1% |
| Malaysian | 70 | 0.3% |
| Mexican | 15,633 | 70.8% |
| Mexican American Indian | 209 | 0.9% |
| Native Hawaiian | 7 | 0.0% |
| Nicaraguan | 118 | 0.5% |
| Norwegian | 58 | 0.3% |
| Paraguayan | 1 | 0.0% |
| Peruvian | 22 | 0.1% |
| Polish | 42 | 0.2% |
| Portuguese | 9 | 0.0% |
| Pueblo | 56 | 0.3% |
| Puerto Rican | 46 | 0.2% |
| Russian | 4 | 0.0% |
| Salvadoran | 892 | 4.0% |
| Samoan | 7 | 0.0% |
| Scotch-Irish | 16 | 0.1% |
| Scottish | 16 | 0.1% |
| South American | 54 | 0.2% |
| Spaniard | 58 | 0.3% |
| Sri Lankan | 902 | 4.1% |
| Subsaharan African | 3 | 0.0% |
| Swedish | 60 | 0.3% |
| Yugoslavian | 7 | 0.0% | View All 57 Rows |
Immigrants in West Puente Valley
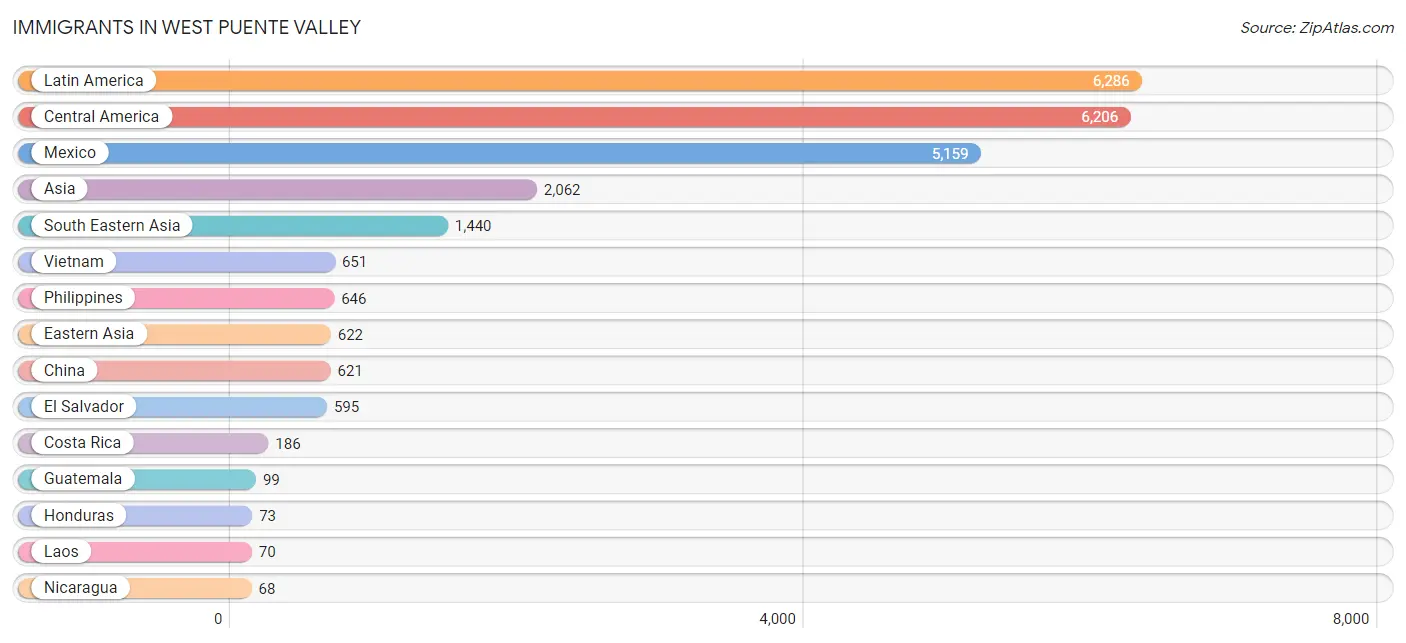
The most numerous immigrant groups reported in West Puente Valley came from Latin America (6,286 | 28.5%), Central America (6,206 | 28.1%), Mexico (5,159 | 23.4%), Asia (2,062 | 9.3%), and South Eastern Asia (1,440 | 6.5%), together accounting for 95.8% of all West Puente Valley residents.
| Immigration Origin | # Population | % Population |
| Argentina | 12 | 0.1% |
| Asia | 2,062 | 9.3% |
| Belize | 8 | 0.0% |
| Cambodia | 40 | 0.2% |
| Canada | 8 | 0.0% |
| Caribbean | 27 | 0.1% |
| Central America | 6,206 | 28.1% |
| China | 621 | 2.8% |
| Colombia | 8 | 0.0% |
| Costa Rica | 186 | 0.8% |
| Cuba | 27 | 0.1% |
| Eastern Asia | 622 | 2.8% |
| Ecuador | 10 | 0.1% |
| El Salvador | 595 | 2.7% |
| England | 6 | 0.0% |
| Europe | 6 | 0.0% |
| Guatemala | 99 | 0.4% |
| Honduras | 73 | 0.3% |
| Hong Kong | 23 | 0.1% |
| Indonesia | 8 | 0.0% |
| Korea | 1 | 0.0% |
| Laos | 70 | 0.3% |
| Latin America | 6,286 | 28.5% |
| Mexico | 5,159 | 23.4% |
| Nicaragua | 68 | 0.3% |
| Northern Europe | 6 | 0.0% |
| Peru | 22 | 0.1% |
| Philippines | 646 | 2.9% |
| South America | 53 | 0.2% |
| South Eastern Asia | 1,440 | 6.5% |
| Taiwan | 63 | 0.3% |
| Thailand | 14 | 0.1% |
| Vietnam | 651 | 2.9% | View All 33 Rows |
Sex and Age in West Puente Valley
Sex and Age in West Puente Valley
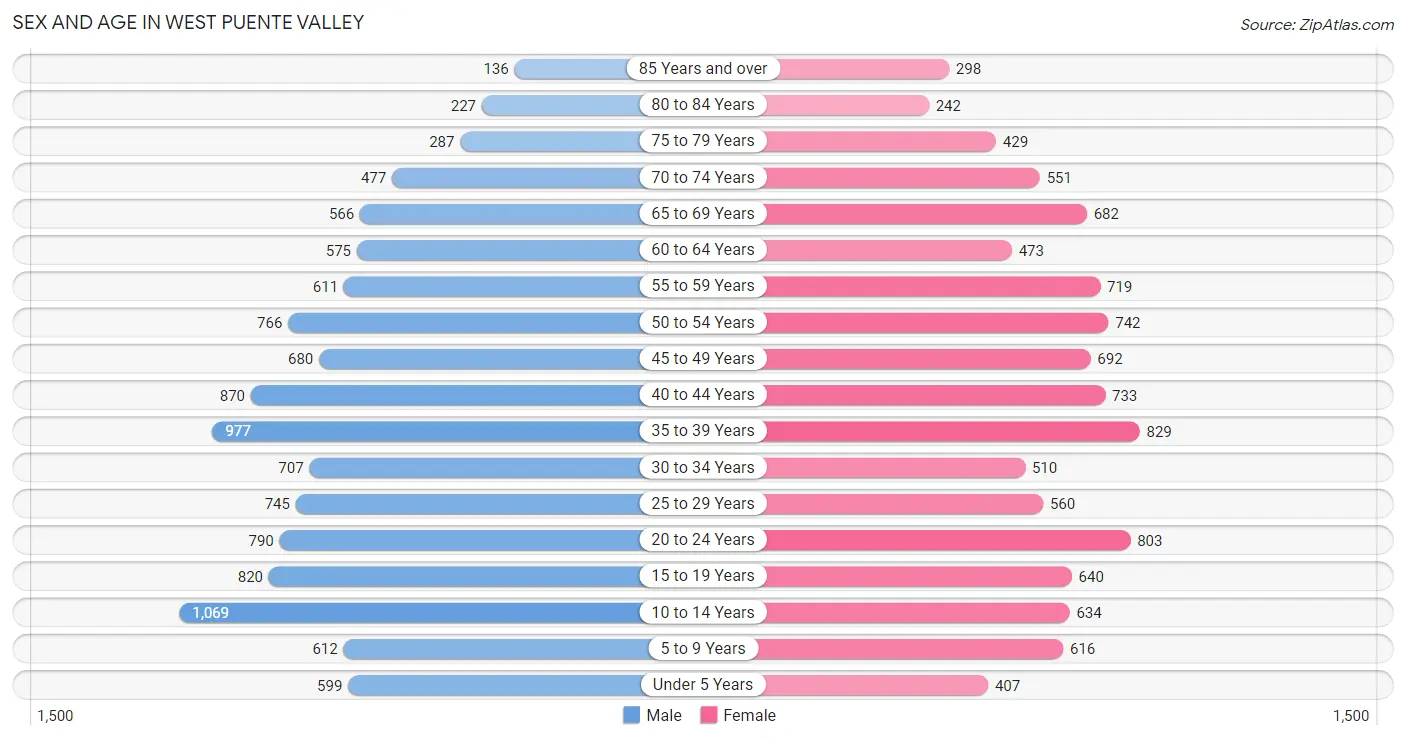
The most populous age groups in West Puente Valley are 10 to 14 Years (1,069 | 9.3%) for men and 35 to 39 Years (829 | 7.9%) for women.
| Age Bracket | Male | Female |
| Under 5 Years | 599 (5.2%) | 407 (3.8%) |
| 5 to 9 Years | 612 (5.3%) | 616 (5.8%) |
| 10 to 14 Years | 1,069 (9.3%) | 634 (6.0%) |
| 15 to 19 Years | 820 (7.1%) | 640 (6.1%) |
| 20 to 24 Years | 790 (6.9%) | 803 (7.6%) |
| 25 to 29 Years | 745 (6.5%) | 560 (5.3%) |
| 30 to 34 Years | 707 (6.1%) | 510 (4.8%) |
| 35 to 39 Years | 977 (8.5%) | 829 (7.9%) |
| 40 to 44 Years | 870 (7.6%) | 733 (6.9%) |
| 45 to 49 Years | 680 (5.9%) | 692 (6.6%) |
| 50 to 54 Years | 766 (6.7%) | 742 (7.0%) |
| 55 to 59 Years | 611 (5.3%) | 719 (6.8%) |
| 60 to 64 Years | 575 (5.0%) | 473 (4.5%) |
| 65 to 69 Years | 566 (4.9%) | 682 (6.5%) |
| 70 to 74 Years | 477 (4.1%) | 551 (5.2%) |
| 75 to 79 Years | 287 (2.5%) | 429 (4.1%) |
| 80 to 84 Years | 227 (2.0%) | 242 (2.3%) |
| 85 Years and over | 136 (1.2%) | 298 (2.8%) |
| Total | 11,514 (100.0%) | 10,560 (100.0%) |
Families and Households in West Puente Valley
Median Family Size in West Puente Valley
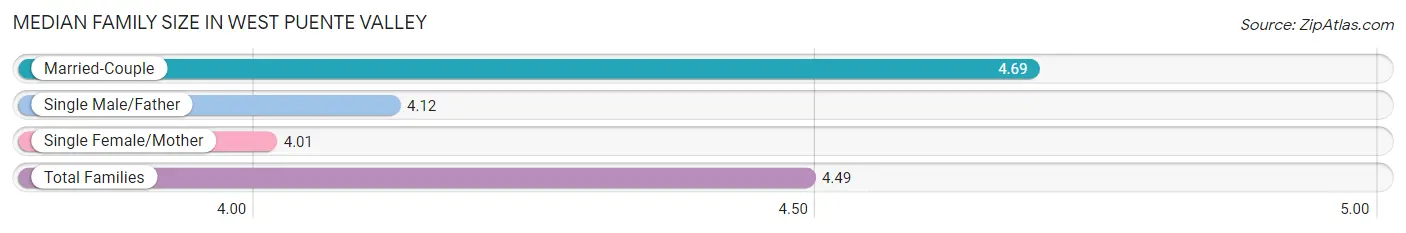
The median family size in West Puente Valley is 4.49 persons per family, with married-couple families (3,073 | 69.1%) accounting for the largest median family size of 4.69 persons per family. On the other hand, single female/mother families (992 | 22.3%) represent the smallest median family size with 4.01 persons per family.
| Family Type | # Families | Family Size |
| Married-Couple | 3,073 (69.1%) | 4.69 |
| Single Male/Father | 385 (8.6%) | 4.12 |
| Single Female/Mother | 992 (22.3%) | 4.01 |
| Total Families | 4,450 (100.0%) | 4.49 |
Median Household Size in West Puente Valley
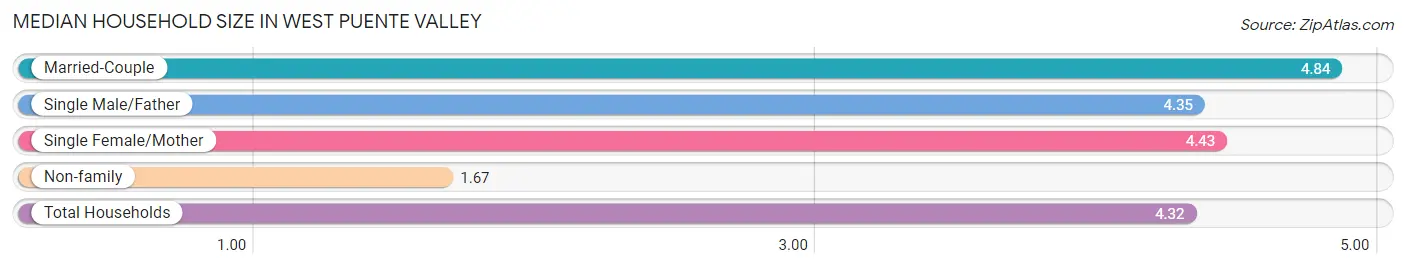
The median household size in West Puente Valley is 4.32 persons per household, with married-couple households (3,073 | 60.4%) accounting for the largest median household size of 4.84 persons per household. non-family households (640 | 12.6%) represent the smallest median household size with 1.67 persons per household.
| Household Type | # Households | Household Size |
| Married-Couple | 3,073 (60.4%) | 4.84 |
| Single Male/Father | 385 (7.6%) | 4.35 |
| Single Female/Mother | 992 (19.5%) | 4.43 |
| Non-family | 640 (12.6%) | 1.67 |
| Total Households | 5,090 (100.0%) | 4.32 |
Household Size by Marriage Status in West Puente Valley
Out of a total of 5,090 households in West Puente Valley, 4,450 (87.4%) are family households, while 640 (12.6%) are nonfamily households. The most numerous type of family households are 2-person households, comprising 951, and the most common type of nonfamily households are 1-person households, comprising 492.
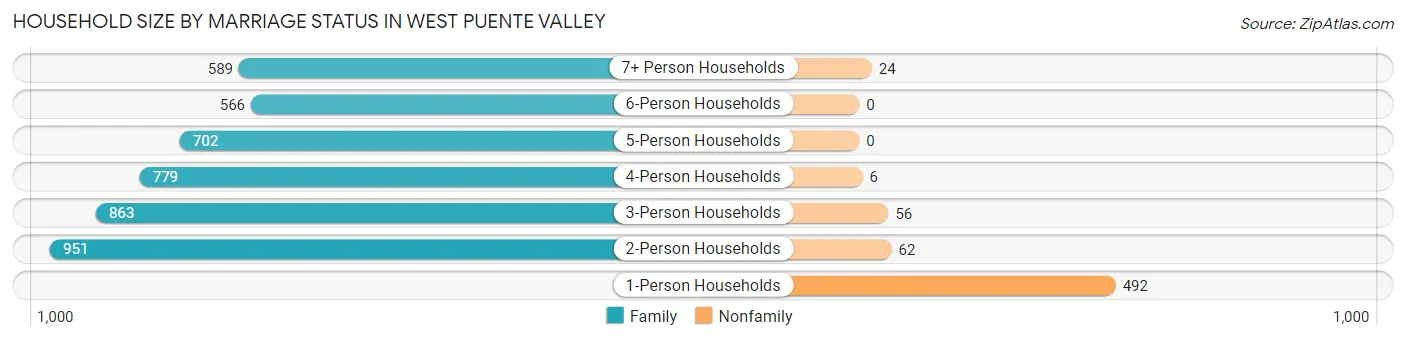
| Household Size | Family Households | Nonfamily Households |
| 1-Person Households | - | 492 (9.7%) |
| 2-Person Households | 951 (18.7%) | 62 (1.2%) |
| 3-Person Households | 863 (17.0%) | 56 (1.1%) |
| 4-Person Households | 779 (15.3%) | 6 (0.1%) |
| 5-Person Households | 702 (13.8%) | 0 (0.0%) |
| 6-Person Households | 566 (11.1%) | 0 (0.0%) |
| 7+ Person Households | 589 (11.6%) | 24 (0.5%) |
| Total | 4,450 (87.4%) | 640 (12.6%) |
Female Fertility in West Puente Valley
Fertility by Age in West Puente Valley
Average fertility rate in West Puente Valley is 58.0 births per 1,000 women. Women in the age bracket of 20 to 34 years have the highest fertility rate with 106.0 births per 1,000 women. Women in the age bracket of 20 to 34 years acount for 69.2% of all women with births.
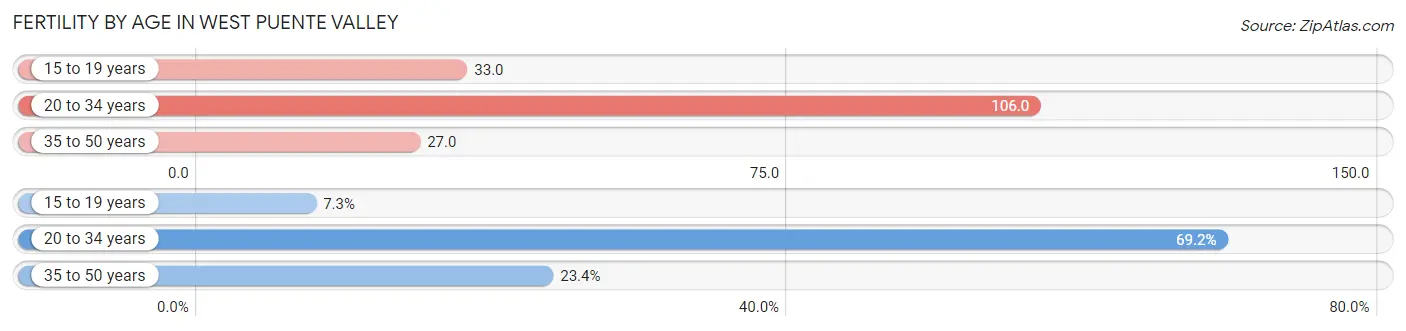
| Age Bracket | Women with Births | Births / 1,000 Women |
| 15 to 19 years | 21 (7.3%) | 33.0 |
| 20 to 34 years | 198 (69.2%) | 106.0 |
| 35 to 50 years | 67 (23.4%) | 27.0 |
| Total | 286 (100.0%) | 58.0 |
Fertility by Age by Marriage Status in West Puente Valley
53.5% of women with births (286) in West Puente Valley are married. The highest percentage of unmarried women with births falls into 15 to 19 years age bracket with 100.0% of them unmarried at the time of birth, while the lowest percentage of unmarried women with births belong to 35 to 50 years age bracket with 13.4% of them unmarried.
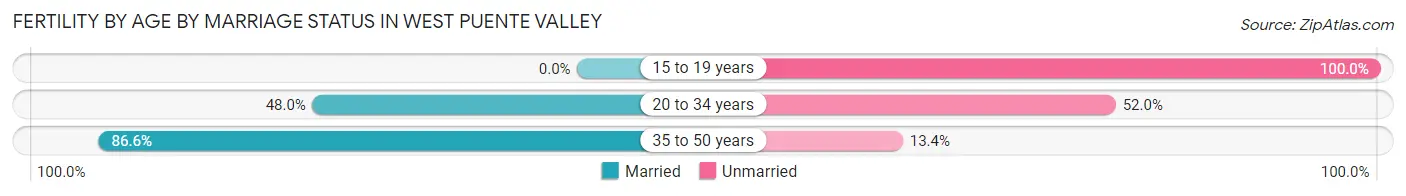
| Age Bracket | Married | Unmarried |
| 15 to 19 years | 0 (0.0%) | 21 (100.0%) |
| 20 to 34 years | 95 (48.0%) | 103 (52.0%) |
| 35 to 50 years | 58 (86.6%) | 9 (13.4%) |
| Total | 153 (53.5%) | 133 (46.5%) |
Fertility by Education in West Puente Valley
Average fertility rate in West Puente Valley is 58.0 births per 1,000 women. Women with the education attainment of graduate degree have the highest fertility rate of 87.0 births per 1,000 women, while women with the education attainment of bachelor's degree have the lowest fertility at 30.0 births per 1,000 women. Women with the education attainment of college or associate's degree represent 40.6% of all women with births.
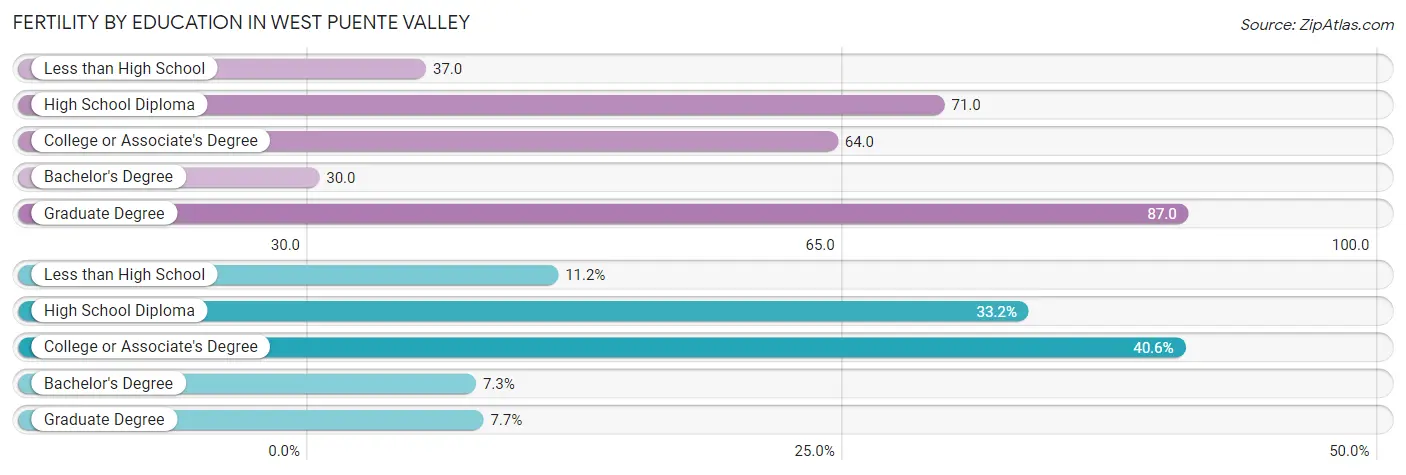
| Educational Attainment | Women with Births | Births / 1,000 Women |
| Less than High School | 32 (11.2%) | 37.0 |
| High School Diploma | 95 (33.2%) | 71.0 |
| College or Associate's Degree | 116 (40.6%) | 64.0 |
| Bachelor's Degree | 21 (7.3%) | 30.0 |
| Graduate Degree | 22 (7.7%) | 87.0 |
| Total | 286 (100.0%) | 58.0 |
Fertility by Education by Marriage Status in West Puente Valley
46.5% of women with births in West Puente Valley are unmarried. Women with the educational attainment of bachelor's degree are most likely to be married with 80.9% of them married at childbirth, while women with the educational attainment of less than high school are least likely to be married with 100.0% of them unmarried at childbirth.
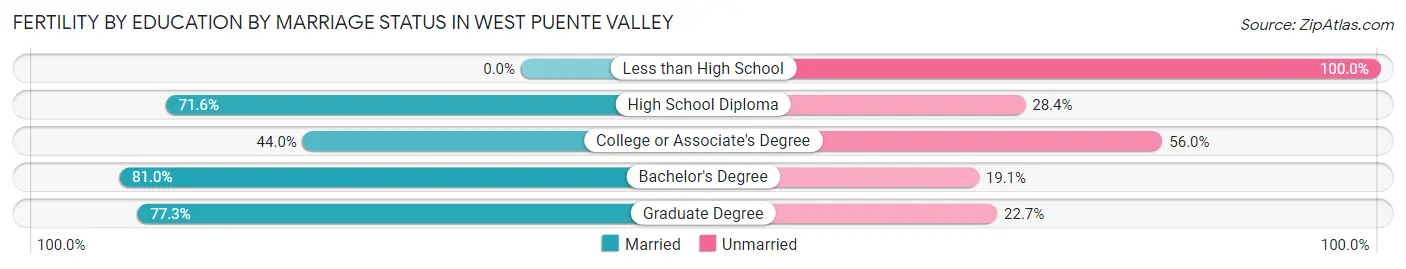
| Educational Attainment | Married | Unmarried |
| Less than High School | 0 (0.0%) | 32 (100.0%) |
| High School Diploma | 68 (71.6%) | 27 (28.4%) |
| College or Associate's Degree | 51 (44.0%) | 65 (56.0%) |
| Bachelor's Degree | 17 (80.9%) | 4 (19.1%) |
| Graduate Degree | 17 (77.3%) | 5 (22.7%) |
| Total | 153 (53.5%) | 133 (46.5%) |
Employment Characteristics in West Puente Valley
Employment by Class of Employer in West Puente Valley
Among the 9,634 employed individuals in West Puente Valley, private company employees (6,465 | 67.1%), local government employees (974 | 10.1%), and not-for-profit organizations (924 | 9.6%) make up the most common classes of employment.
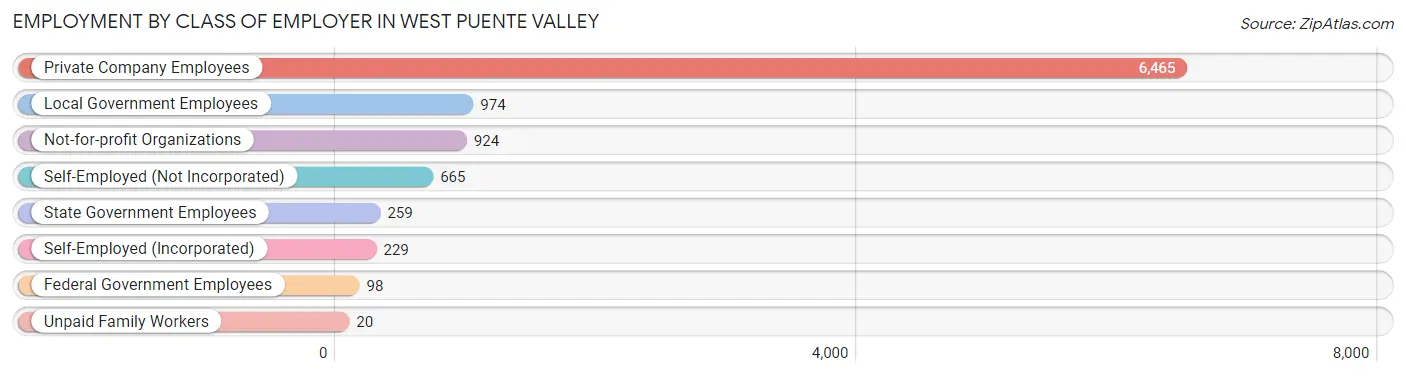
| Employer Class | # Employees | % Employees |
| Private Company Employees | 6,465 | 67.1% |
| Self-Employed (Incorporated) | 229 | 2.4% |
| Self-Employed (Not Incorporated) | 665 | 6.9% |
| Not-for-profit Organizations | 924 | 9.6% |
| Local Government Employees | 974 | 10.1% |
| State Government Employees | 259 | 2.7% |
| Federal Government Employees | 98 | 1.0% |
| Unpaid Family Workers | 20 | 0.2% |
| Total | 9,634 | 100.0% |
Employment Status by Age in West Puente Valley
According to the labor force statistics for West Puente Valley, out of the total population over 16 years of age (17,785), 60.6% or 10,778 individuals are in the labor force, with 7.3% or 787 of them unemployed. The age group with the highest labor force participation rate is 30 to 34 years, with 92.9% or 1,131 individuals in the labor force. Within the labor force, the 16 to 19 years age range has the highest percentage of unemployed individuals, with 19.8% or 55 of them being unemployed.
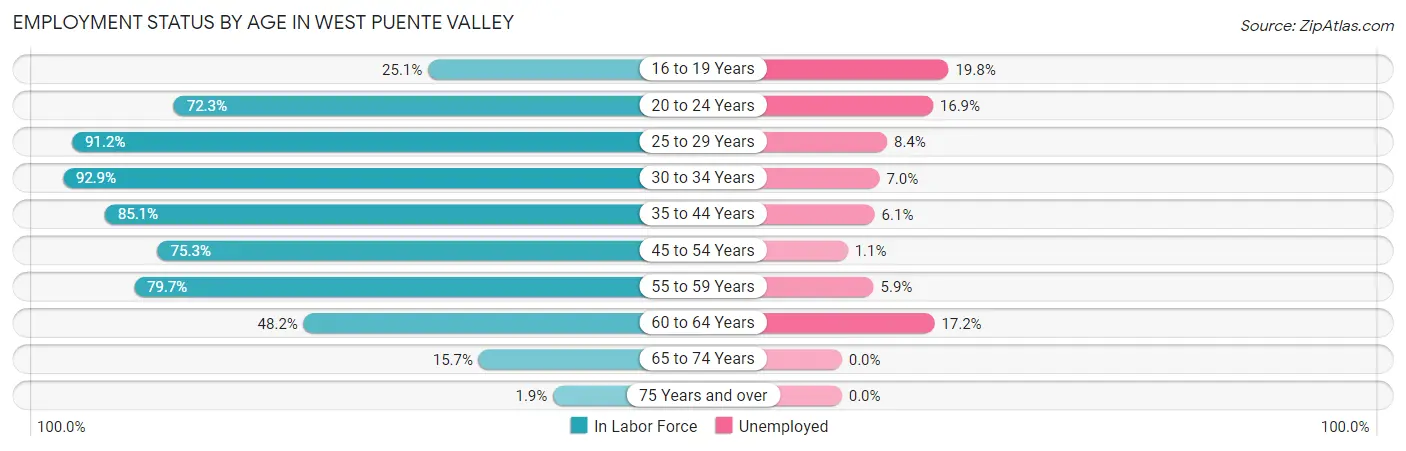
| Age Bracket | In Labor Force | Unemployed |
| 16 to 19 Years | 278 (25.1%) | 55 (19.8%) |
| 20 to 24 Years | 1,152 (72.3%) | 195 (16.9%) |
| 25 to 29 Years | 1,190 (91.2%) | 100 (8.4%) |
| 30 to 34 Years | 1,131 (92.9%) | 79 (7.0%) |
| 35 to 44 Years | 2,901 (85.1%) | 177 (6.1%) |
| 45 to 54 Years | 2,169 (75.3%) | 24 (1.1%) |
| 55 to 59 Years | 1,060 (79.7%) | 63 (5.9%) |
| 60 to 64 Years | 505 (48.2%) | 87 (17.2%) |
| 65 to 74 Years | 357 (15.7%) | 0 (0.0%) |
| 75 Years and over | 31 (1.9%) | 0 (0.0%) |
| Total | 10,778 (60.6%) | 787 (7.3%) |
Employment Status by Educational Attainment in West Puente Valley
According to labor force statistics for West Puente Valley, 80.0% of individuals (8,951) out of the total population between 25 and 64 years of age (11,189) are in the labor force, with 5.9% or 528 of them being unemployed. The group with the highest labor force participation rate are those with the educational attainment of bachelor's degree or higher, with 87.8% or 1,695 individuals in the labor force. Within the labor force, individuals with college / associate degree education have the highest percentage of unemployment, with 9.1% or 241 of them being unemployed.
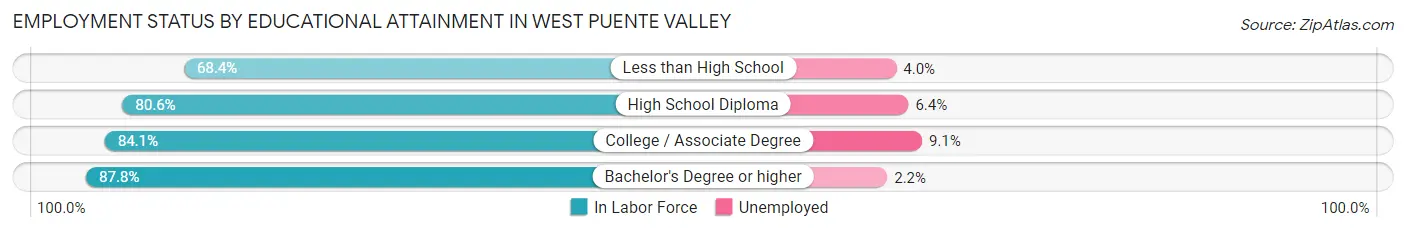
| Educational Attainment | In Labor Force | Unemployed |
| Less than High School | 1,759 (68.4%) | 103 (4.0%) |
| High School Diploma | 2,848 (80.6%) | 226 (6.4%) |
| College / Associate Degree | 2,651 (84.1%) | 287 (9.1%) |
| Bachelor's Degree or higher | 1,695 (87.8%) | 42 (2.2%) |
| Total | 8,951 (80.0%) | 660 (5.9%) |
Employment Occupations by Sex in West Puente Valley
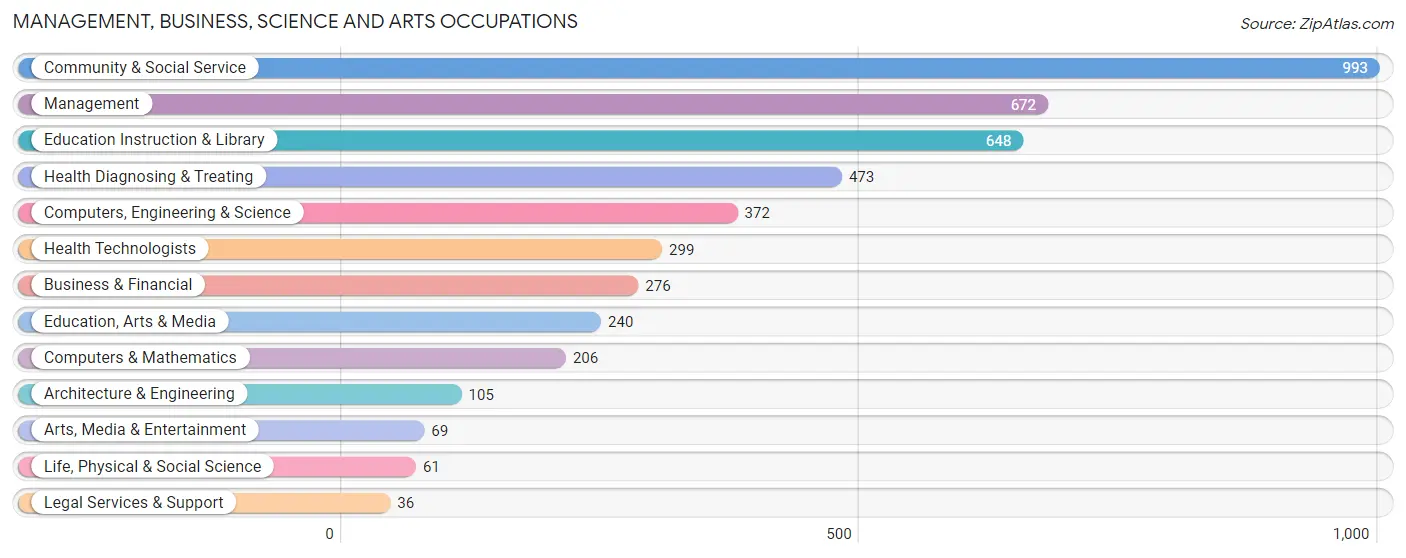
Management, Business, Science and Arts Occupations
The most common Management, Business, Science and Arts occupations in West Puente Valley are Community & Social Service (993 | 9.9%), Management (672 | 6.7%), Education Instruction & Library (648 | 6.5%), Health Diagnosing & Treating (473 | 4.7%), and Computers, Engineering & Science (372 | 3.7%).
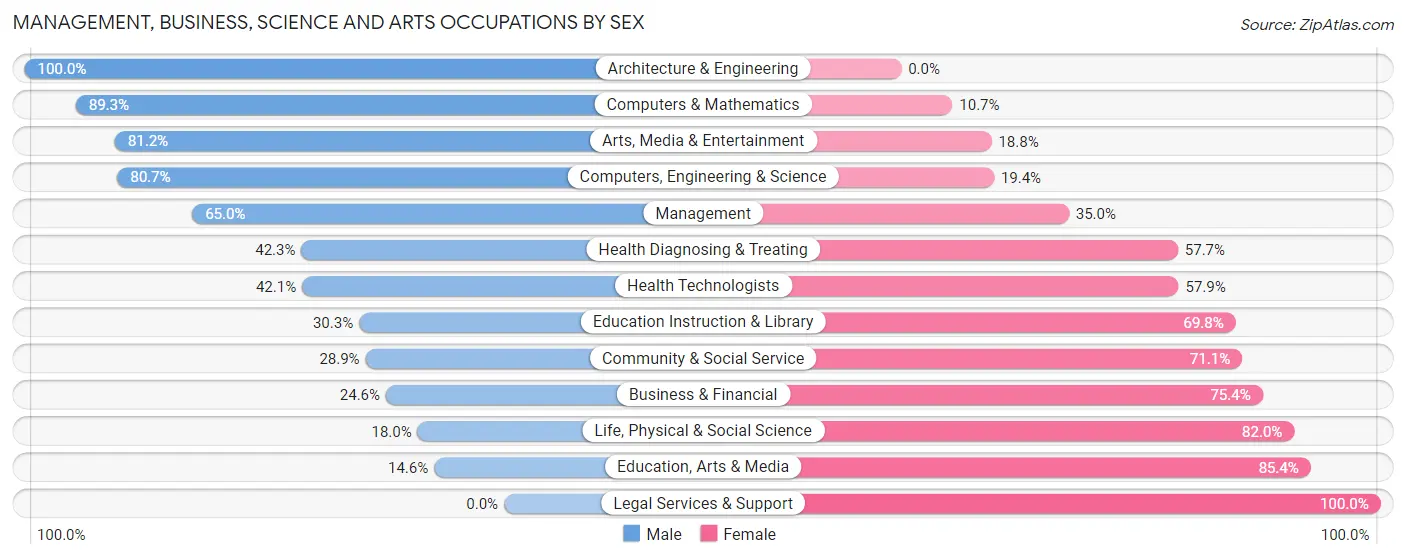
Management, Business, Science and Arts Occupations by Sex
Within the Management, Business, Science and Arts occupations in West Puente Valley, the most male-oriented occupations are Architecture & Engineering (100.0%), Computers & Mathematics (89.3%), and Arts, Media & Entertainment (81.2%), while the most female-oriented occupations are Legal Services & Support (100.0%), Education, Arts & Media (85.4%), and Life, Physical & Social Science (82.0%).
| Occupation | Male | Female |
| Management | 437 (65.0%) | 235 (35.0%) |
| Business & Financial | 68 (24.6%) | 208 (75.4%) |
| Computers, Engineering & Science | 300 (80.6%) | 72 (19.4%) |
| Computers & Mathematics | 184 (89.3%) | 22 (10.7%) |
| Architecture & Engineering | 105 (100.0%) | 0 (0.0%) |
| Life, Physical & Social Science | 11 (18.0%) | 50 (82.0%) |
| Community & Social Service | 287 (28.9%) | 706 (71.1%) |
| Education, Arts & Media | 35 (14.6%) | 205 (85.4%) |
| Legal Services & Support | 0 (0.0%) | 36 (100.0%) |
| Education Instruction & Library | 196 (30.2%) | 452 (69.8%) |
| Arts, Media & Entertainment | 56 (81.2%) | 13 (18.8%) |
| Health Diagnosing & Treating | 200 (42.3%) | 273 (57.7%) |
| Health Technologists | 126 (42.1%) | 173 (57.9%) |
| Total (Category) | 1,292 (46.4%) | 1,494 (53.6%) |
| Total (Overall) | 5,726 (57.3%) | 4,265 (42.7%) |
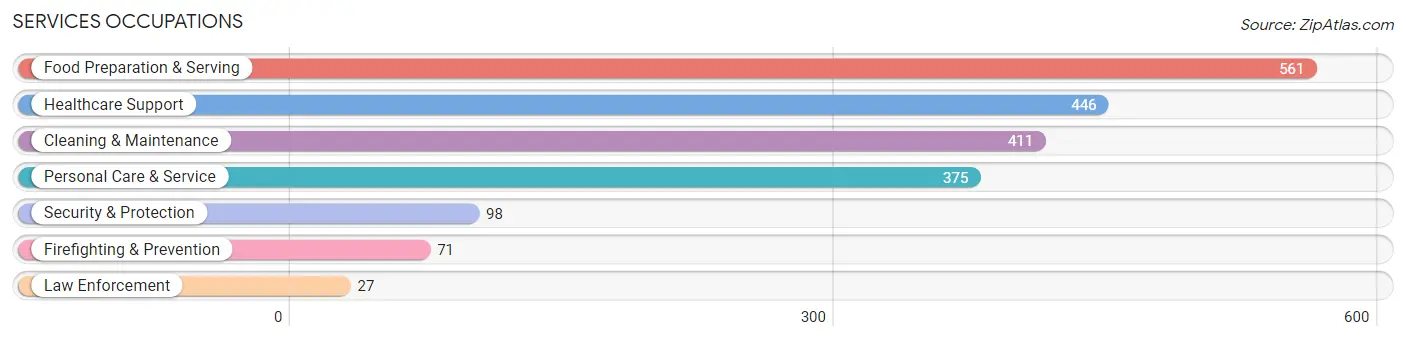
Services Occupations
The most common Services occupations in West Puente Valley are Food Preparation & Serving (561 | 5.6%), Healthcare Support (446 | 4.5%), Cleaning & Maintenance (411 | 4.1%), Personal Care & Service (375 | 3.7%), and Security & Protection (98 | 1.0%).
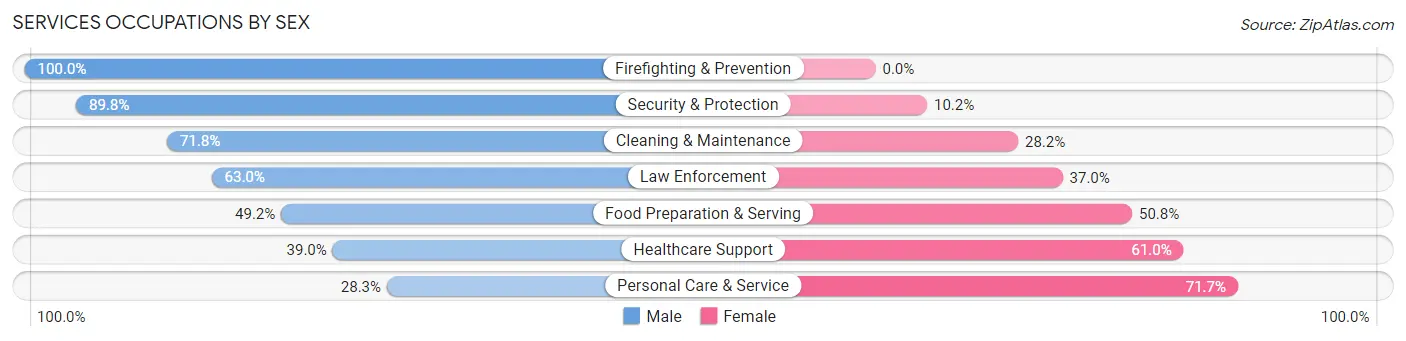
Services Occupations by Sex
Within the Services occupations in West Puente Valley, the most male-oriented occupations are Firefighting & Prevention (100.0%), Security & Protection (89.8%), and Cleaning & Maintenance (71.8%), while the most female-oriented occupations are Personal Care & Service (71.7%), Healthcare Support (61.0%), and Food Preparation & Serving (50.8%).
| Occupation | Male | Female |
| Healthcare Support | 174 (39.0%) | 272 (61.0%) |
| Security & Protection | 88 (89.8%) | 10 (10.2%) |
| Firefighting & Prevention | 71 (100.0%) | 0 (0.0%) |
| Law Enforcement | 17 (63.0%) | 10 (37.0%) |
| Food Preparation & Serving | 276 (49.2%) | 285 (50.8%) |
| Cleaning & Maintenance | 295 (71.8%) | 116 (28.2%) |
| Personal Care & Service | 106 (28.3%) | 269 (71.7%) |
| Total (Category) | 939 (49.7%) | 952 (50.3%) |
| Total (Overall) | 5,726 (57.3%) | 4,265 (42.7%) |
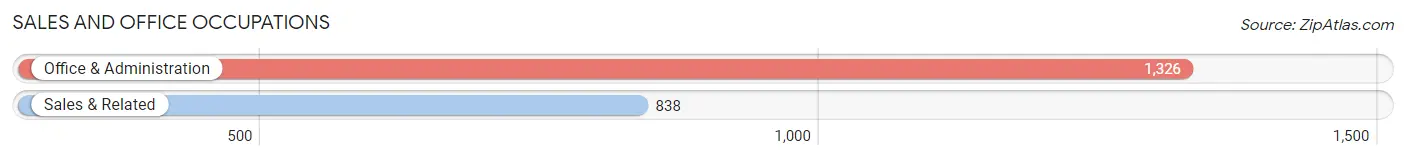
Sales and Office Occupations
The most common Sales and Office occupations in West Puente Valley are Office & Administration (1,326 | 13.3%), and Sales & Related (838 | 8.4%).
Sales and Office Occupations by Sex
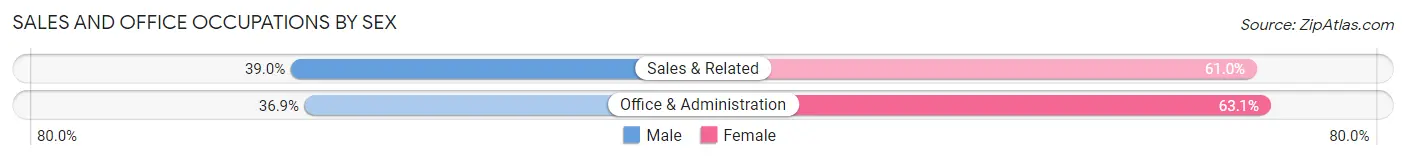
| Occupation | Male | Female |
| Sales & Related | 327 (39.0%) | 511 (61.0%) |
| Office & Administration | 489 (36.9%) | 837 (63.1%) |
| Total (Category) | 816 (37.7%) | 1,348 (62.3%) |
| Total (Overall) | 5,726 (57.3%) | 4,265 (42.7%) |
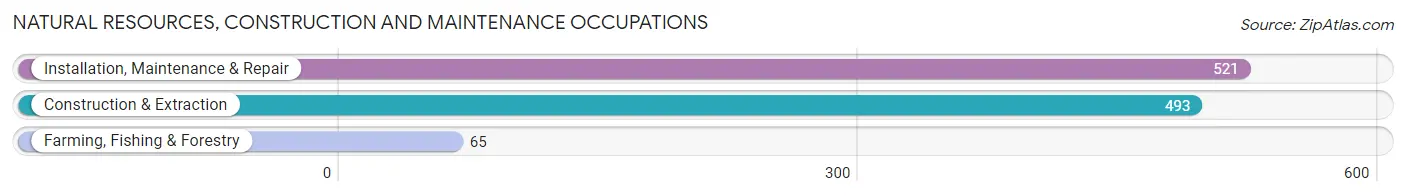
Natural Resources, Construction and Maintenance Occupations
The most common Natural Resources, Construction and Maintenance occupations in West Puente Valley are Installation, Maintenance & Repair (521 | 5.2%), Construction & Extraction (493 | 4.9%), and Farming, Fishing & Forestry (65 | 0.6%).
Natural Resources, Construction and Maintenance Occupations by Sex
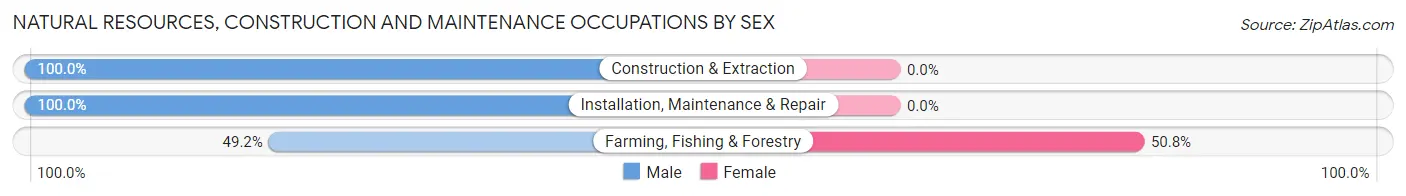
| Occupation | Male | Female |
| Farming, Fishing & Forestry | 32 (49.2%) | 33 (50.8%) |
| Construction & Extraction | 493 (100.0%) | 0 (0.0%) |
| Installation, Maintenance & Repair | 521 (100.0%) | 0 (0.0%) |
| Total (Category) | 1,046 (96.9%) | 33 (3.1%) |
| Total (Overall) | 5,726 (57.3%) | 4,265 (42.7%) |
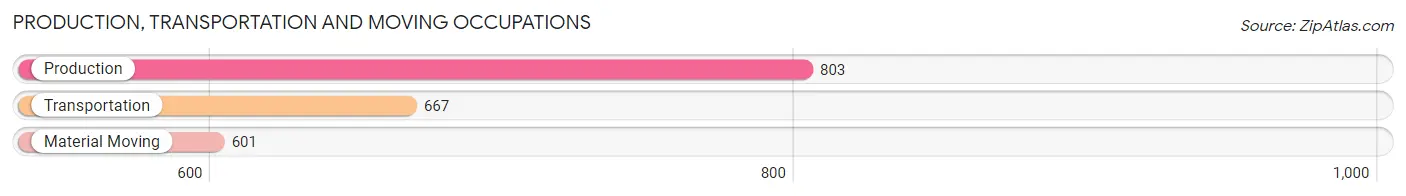
Production, Transportation and Moving Occupations
The most common Production, Transportation and Moving occupations in West Puente Valley are Production (803 | 8.0%), Transportation (667 | 6.7%), and Material Moving (601 | 6.0%).
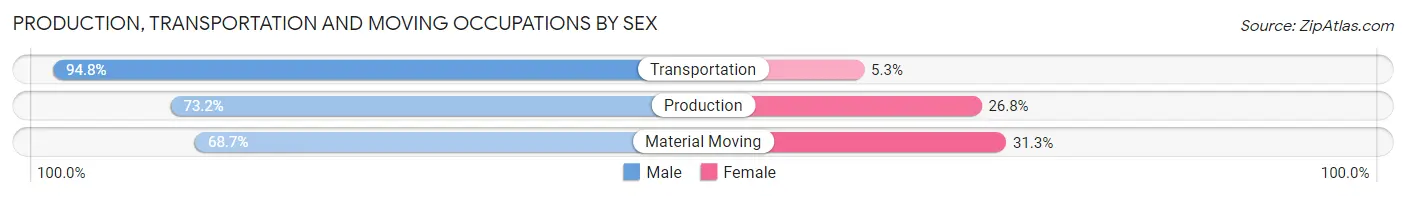
Production, Transportation and Moving Occupations by Sex
| Occupation | Male | Female |
| Production | 588 (73.2%) | 215 (26.8%) |
| Transportation | 632 (94.8%) | 35 (5.2%) |
| Material Moving | 413 (68.7%) | 188 (31.3%) |
| Total (Category) | 1,633 (78.8%) | 438 (21.1%) |
| Total (Overall) | 5,726 (57.3%) | 4,265 (42.7%) |
Employment Industries by Sex in West Puente Valley
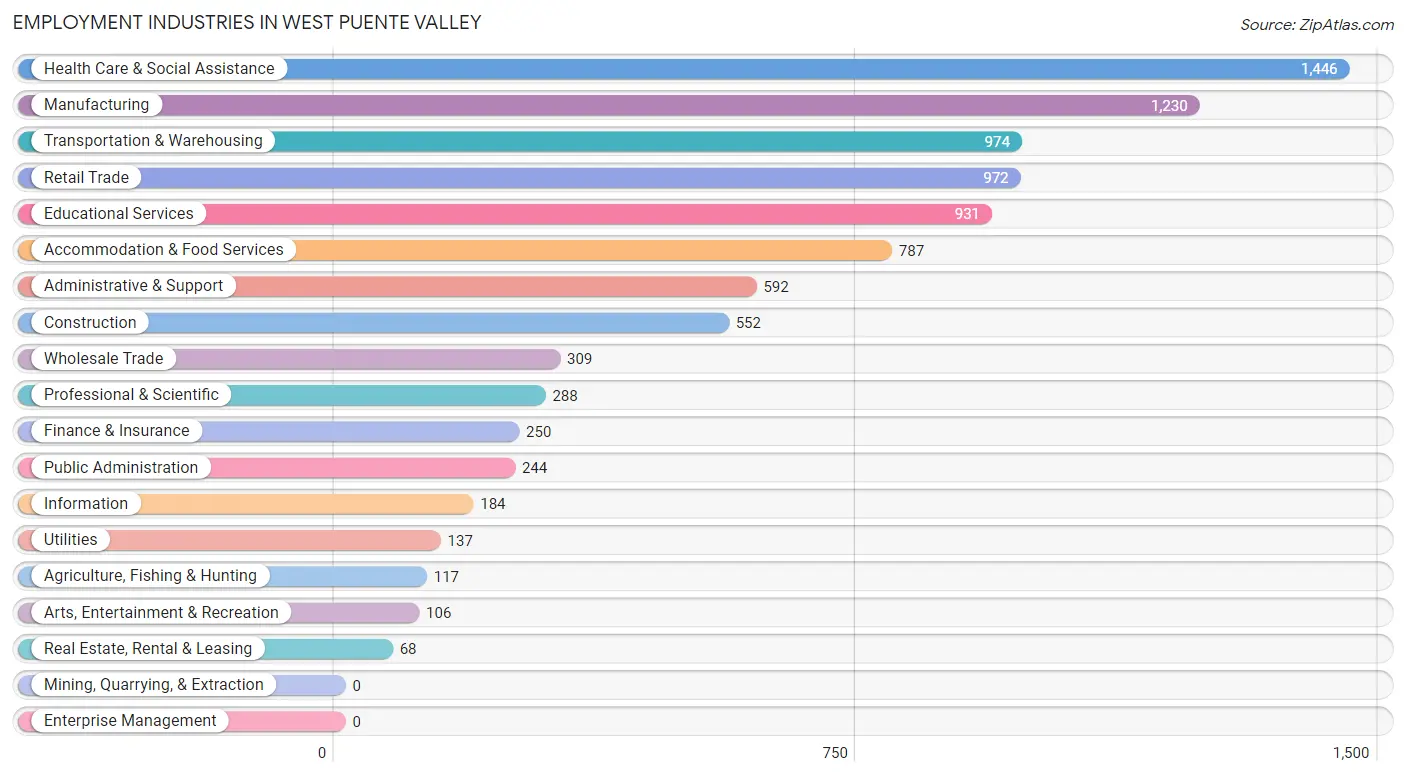
Employment Industries in West Puente Valley
The major employment industries in West Puente Valley include Health Care & Social Assistance (1,446 | 14.5%), Manufacturing (1,230 | 12.3%), Transportation & Warehousing (974 | 9.8%), Retail Trade (972 | 9.7%), and Educational Services (931 | 9.3%).
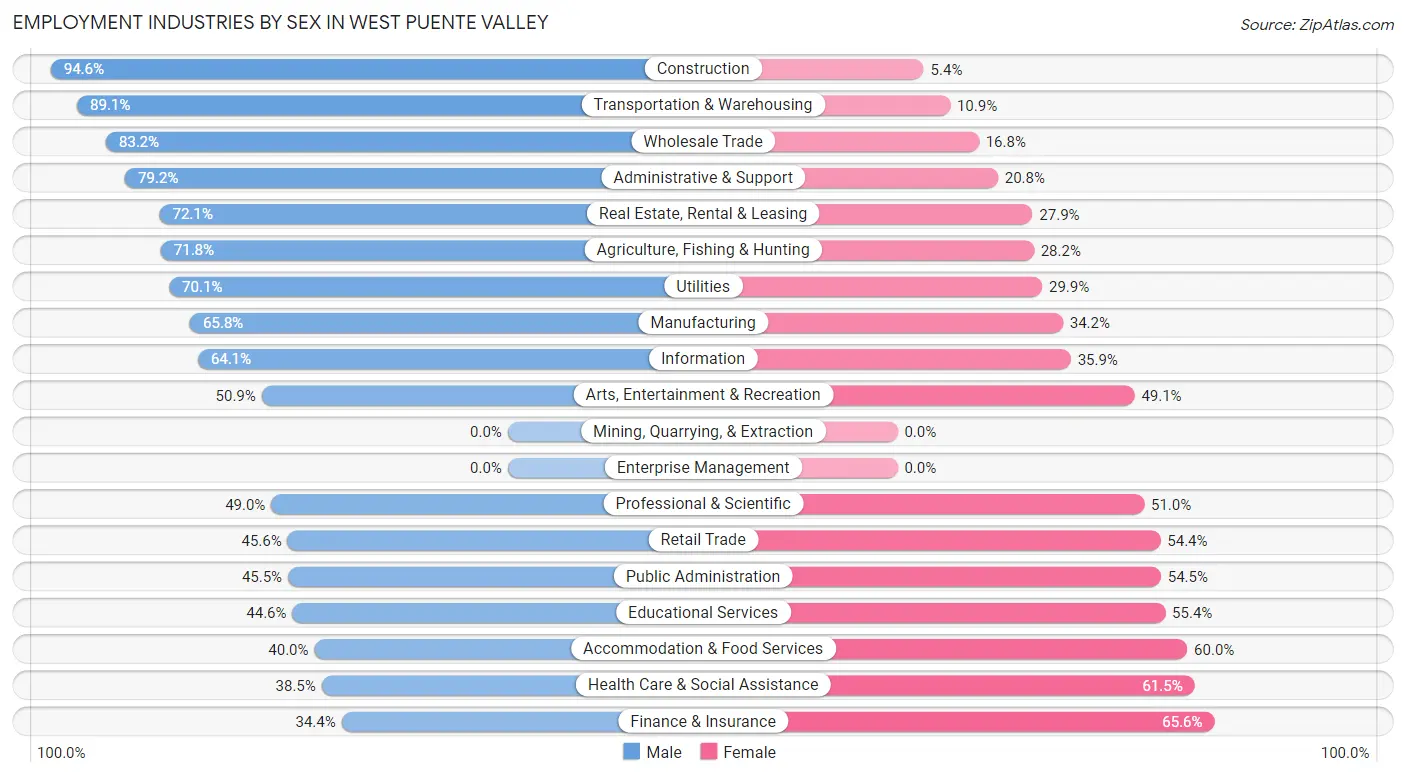
Employment Industries by Sex in West Puente Valley
The West Puente Valley industries that see more men than women are Construction (94.6%), Transportation & Warehousing (89.1%), and Wholesale Trade (83.2%), whereas the industries that tend to have a higher number of women are Finance & Insurance (65.6%), Health Care & Social Assistance (61.5%), and Accommodation & Food Services (60.0%).
| Industry | Male | Female |
| Agriculture, Fishing & Hunting | 84 (71.8%) | 33 (28.2%) |
| Mining, Quarrying, & Extraction | 0 (0.0%) | 0 (0.0%) |
| Construction | 522 (94.6%) | 30 (5.4%) |
| Manufacturing | 809 (65.8%) | 421 (34.2%) |
| Wholesale Trade | 257 (83.2%) | 52 (16.8%) |
| Retail Trade | 443 (45.6%) | 529 (54.4%) |
| Transportation & Warehousing | 868 (89.1%) | 106 (10.9%) |
| Utilities | 96 (70.1%) | 41 (29.9%) |
| Information | 118 (64.1%) | 66 (35.9%) |
| Finance & Insurance | 86 (34.4%) | 164 (65.6%) |
| Real Estate, Rental & Leasing | 49 (72.1%) | 19 (27.9%) |
| Professional & Scientific | 141 (49.0%) | 147 (51.0%) |
| Enterprise Management | 0 (0.0%) | 0 (0.0%) |
| Administrative & Support | 469 (79.2%) | 123 (20.8%) |
| Educational Services | 415 (44.6%) | 516 (55.4%) |
| Health Care & Social Assistance | 557 (38.5%) | 889 (61.5%) |
| Arts, Entertainment & Recreation | 54 (50.9%) | 52 (49.1%) |
| Accommodation & Food Services | 315 (40.0%) | 472 (60.0%) |
| Public Administration | 111 (45.5%) | 133 (54.5%) |
| Total | 5,726 (57.3%) | 4,265 (42.7%) |
Education in West Puente Valley
School Enrollment in West Puente Valley
The most common levels of schooling among the 5,722 students in West Puente Valley are college / undergraduate (1,518 | 26.5%), middle school (1,360 | 23.8%), and high school (1,059 | 18.5%).
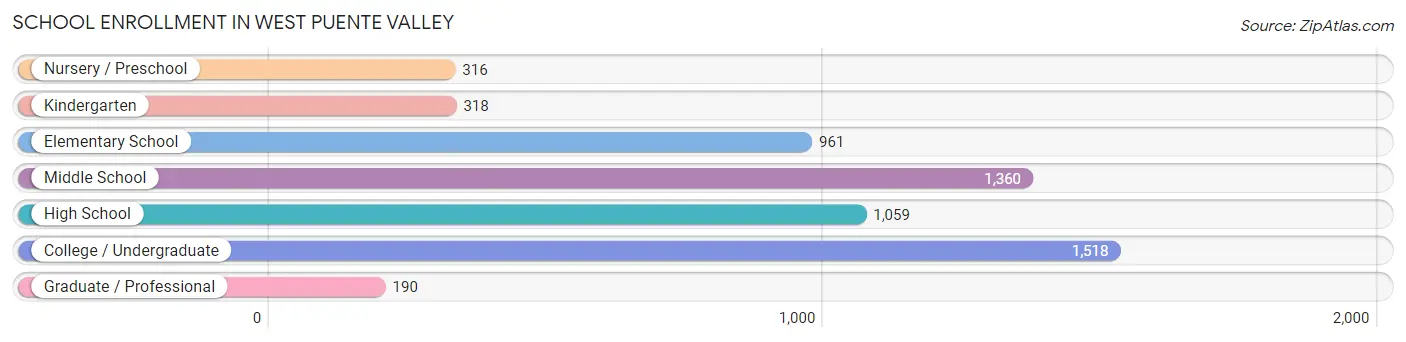
| School Level | # Students | % Students |
| Nursery / Preschool | 316 | 5.5% |
| Kindergarten | 318 | 5.6% |
| Elementary School | 961 | 16.8% |
| Middle School | 1,360 | 23.8% |
| High School | 1,059 | 18.5% |
| College / Undergraduate | 1,518 | 26.5% |
| Graduate / Professional | 190 | 3.3% |
| Total | 5,722 | 100.0% |
School Enrollment by Age by Funding Source in West Puente Valley
Out of a total of 5,722 students who are enrolled in schools in West Puente Valley, 532 (9.3%) attend a private institution, while the remaining 5,190 (90.7%) are enrolled in public schools. The age group of 25 to 34 year olds has the highest likelihood of being enrolled in private schools, with 110 (25.9% in the age bracket) enrolled. Conversely, the age group of 20 to 24 year olds has the lowest likelihood of being enrolled in a private school, with 623 (96.1% in the age bracket) attending a public institution.
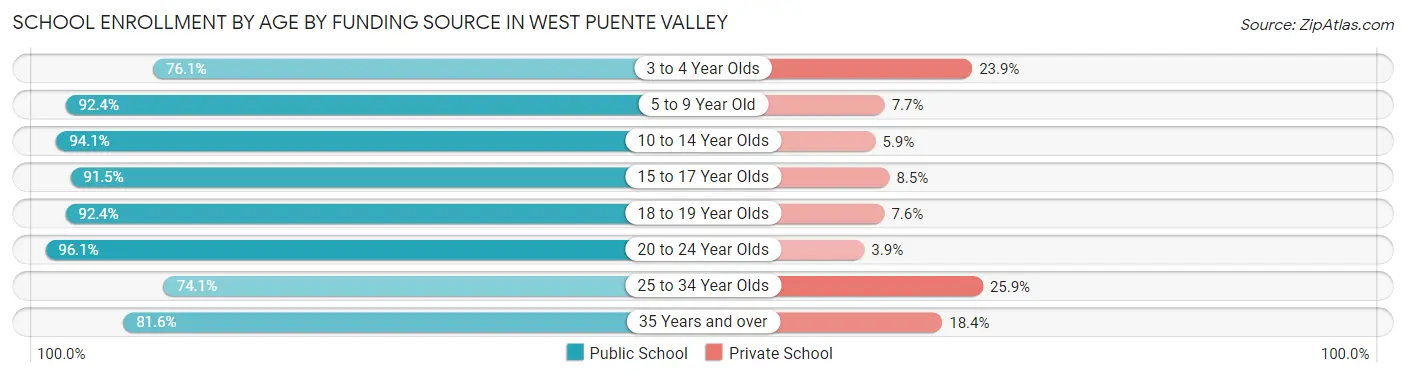
| Age Bracket | Public School | Private School |
| 3 to 4 Year Olds | 143 (76.1%) | 45 (23.9%) |
| 5 to 9 Year Old | 1,134 (92.3%) | 94 (7.6%) |
| 10 to 14 Year Olds | 1,524 (94.1%) | 96 (5.9%) |
| 15 to 17 Year Olds | 772 (91.5%) | 72 (8.5%) |
| 18 to 19 Year Olds | 450 (92.4%) | 37 (7.6%) |
| 20 to 24 Year Olds | 623 (96.1%) | 25 (3.9%) |
| 25 to 34 Year Olds | 314 (74.1%) | 110 (25.9%) |
| 35 Years and over | 231 (81.6%) | 52 (18.4%) |
| Total | 5,190 (90.7%) | 532 (9.3%) |
Educational Attainment by Field of Study in West Puente Valley
Business (436 | 18.5%), social sciences (279 | 11.9%), science & technology (271 | 11.5%), arts & humanities (264 | 11.2%), and education (237 | 10.1%) are the most common fields of study among 2,351 individuals in West Puente Valley who have obtained a bachelor's degree or higher.
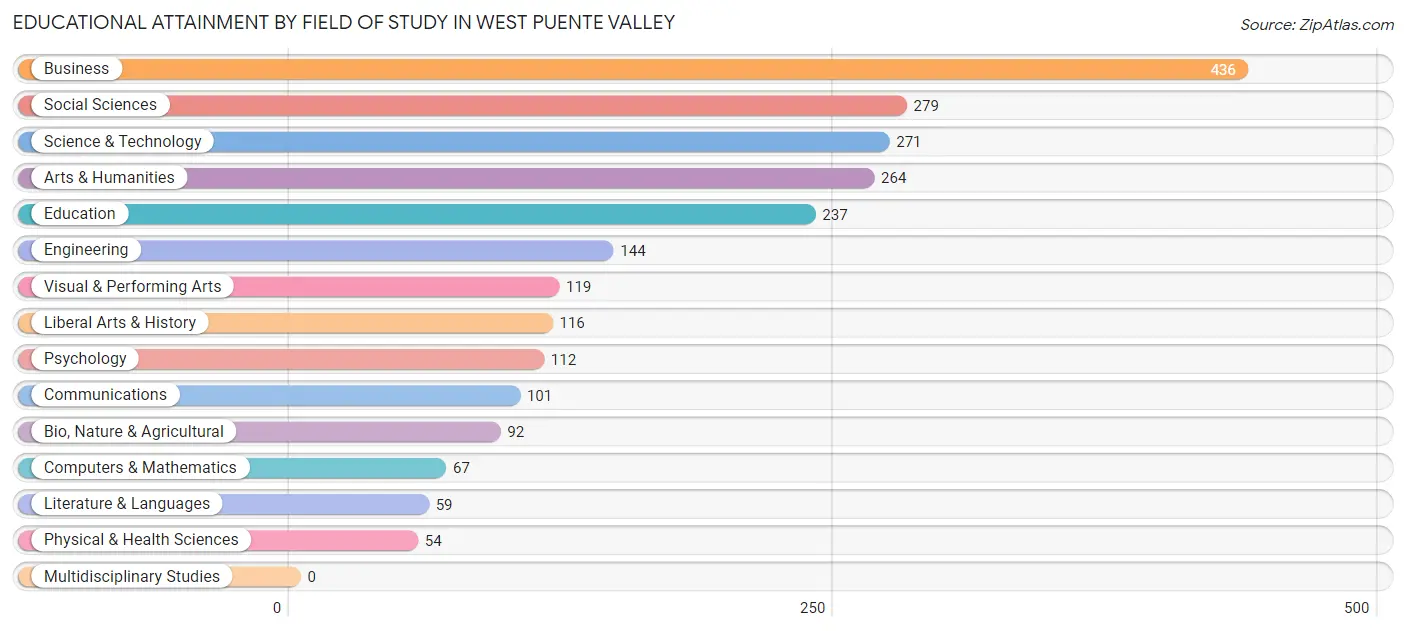
| Field of Study | # Graduates | % Graduates |
| Computers & Mathematics | 67 | 2.9% |
| Bio, Nature & Agricultural | 92 | 3.9% |
| Physical & Health Sciences | 54 | 2.3% |
| Psychology | 112 | 4.8% |
| Social Sciences | 279 | 11.9% |
| Engineering | 144 | 6.1% |
| Multidisciplinary Studies | 0 | 0.0% |
| Science & Technology | 271 | 11.5% |
| Business | 436 | 18.5% |
| Education | 237 | 10.1% |
| Literature & Languages | 59 | 2.5% |
| Liberal Arts & History | 116 | 4.9% |
| Visual & Performing Arts | 119 | 5.1% |
| Communications | 101 | 4.3% |
| Arts & Humanities | 264 | 11.2% |
| Total | 2,351 | 100.0% |
Transportation & Commute in West Puente Valley
Vehicle Availability by Sex in West Puente Valley
The most prevalent vehicle ownership categories in West Puente Valley are males with 3 vehicles (1,740, accounting for 32.0%) and females with 3 vehicles (1,261, making up 41.5%).
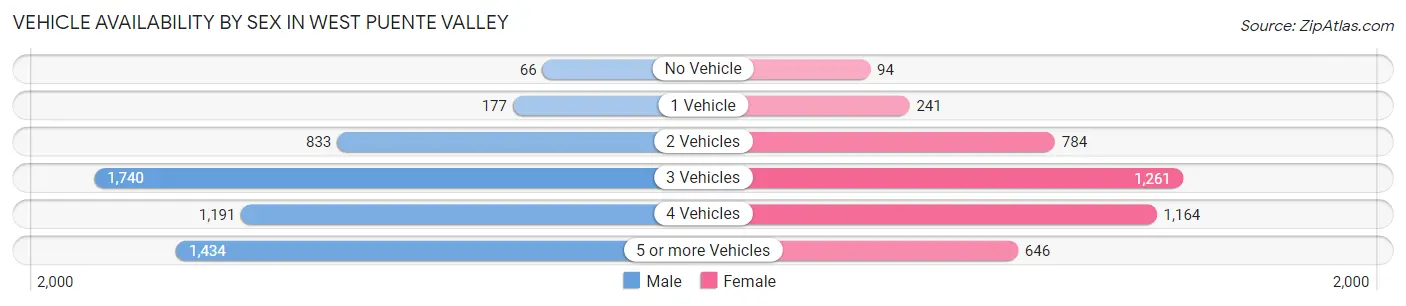
| Vehicles Available | Male | Female |
| No Vehicle | 66 (1.2%) | 94 (2.2%) |
| 1 Vehicle | 177 (3.3%) | 241 (5.8%) |
| 2 Vehicles | 833 (15.3%) | 784 (18.7%) |
| 3 Vehicles | 1,740 (32.0%) | 1,261 (30.1%) |
| 4 Vehicles | 1,191 (21.9%) | 1,164 (27.8%) |
| 5 or more Vehicles | 1,434 (26.4%) | 646 (15.4%) |
| Total | 5,441 (100.0%) | 4,190 (100.0%) |
Commute Time in West Puente Valley
The most frequently occuring commute durations in West Puente Valley are 30 to 34 minutes (1,482 commuters, 16.4%), 45 to 59 minutes (1,345 commuters, 14.9%), and 20 to 24 minutes (1,317 commuters, 14.6%).
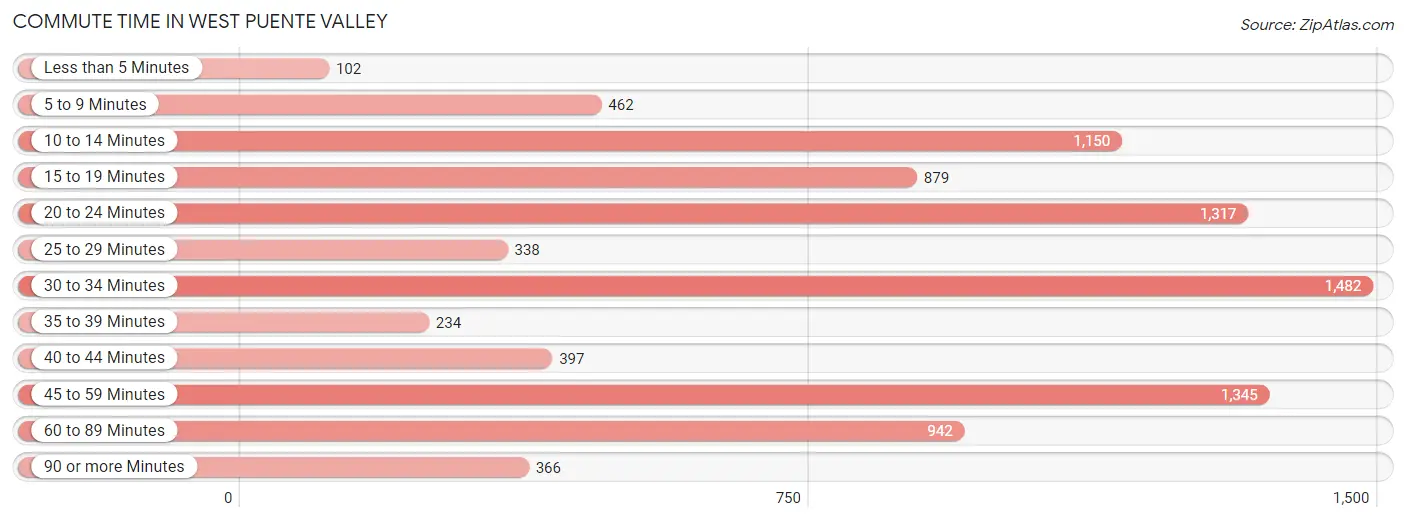
| Commute Time | # Commuters | % Commuters |
| Less than 5 Minutes | 102 | 1.1% |
| 5 to 9 Minutes | 462 | 5.1% |
| 10 to 14 Minutes | 1,150 | 12.8% |
| 15 to 19 Minutes | 879 | 9.8% |
| 20 to 24 Minutes | 1,317 | 14.6% |
| 25 to 29 Minutes | 338 | 3.7% |
| 30 to 34 Minutes | 1,482 | 16.4% |
| 35 to 39 Minutes | 234 | 2.6% |
| 40 to 44 Minutes | 397 | 4.4% |
| 45 to 59 Minutes | 1,345 | 14.9% |
| 60 to 89 Minutes | 942 | 10.4% |
| 90 or more Minutes | 366 | 4.1% |
Commute Time by Sex in West Puente Valley
The most common commute times in West Puente Valley are 30 to 34 minutes (867 commuters, 16.8%) for males and 30 to 34 minutes (615 commuters, 15.9%) for females.
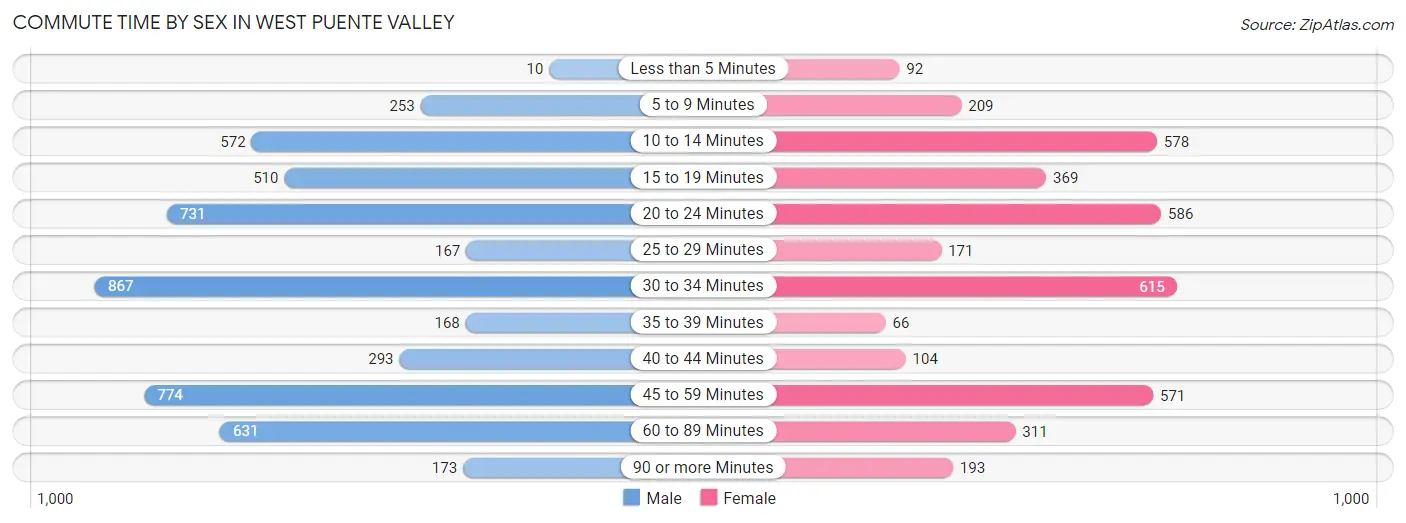
| Commute Time | Male | Female |
| Less than 5 Minutes | 10 (0.2%) | 92 (2.4%) |
| 5 to 9 Minutes | 253 (4.9%) | 209 (5.4%) |
| 10 to 14 Minutes | 572 (11.1%) | 578 (14.9%) |
| 15 to 19 Minutes | 510 (9.9%) | 369 (9.6%) |
| 20 to 24 Minutes | 731 (14.2%) | 586 (15.2%) |
| 25 to 29 Minutes | 167 (3.2%) | 171 (4.4%) |
| 30 to 34 Minutes | 867 (16.8%) | 615 (15.9%) |
| 35 to 39 Minutes | 168 (3.3%) | 66 (1.7%) |
| 40 to 44 Minutes | 293 (5.7%) | 104 (2.7%) |
| 45 to 59 Minutes | 774 (15.0%) | 571 (14.8%) |
| 60 to 89 Minutes | 631 (12.2%) | 311 (8.1%) |
| 90 or more Minutes | 173 (3.4%) | 193 (5.0%) |
Time of Departure to Work by Sex in West Puente Valley
The most frequent times of departure to work in West Puente Valley are 12:00 AM to 4:59 AM (768, 14.9%) for males and 8:00 AM to 8:29 AM (590, 15.3%) for females.
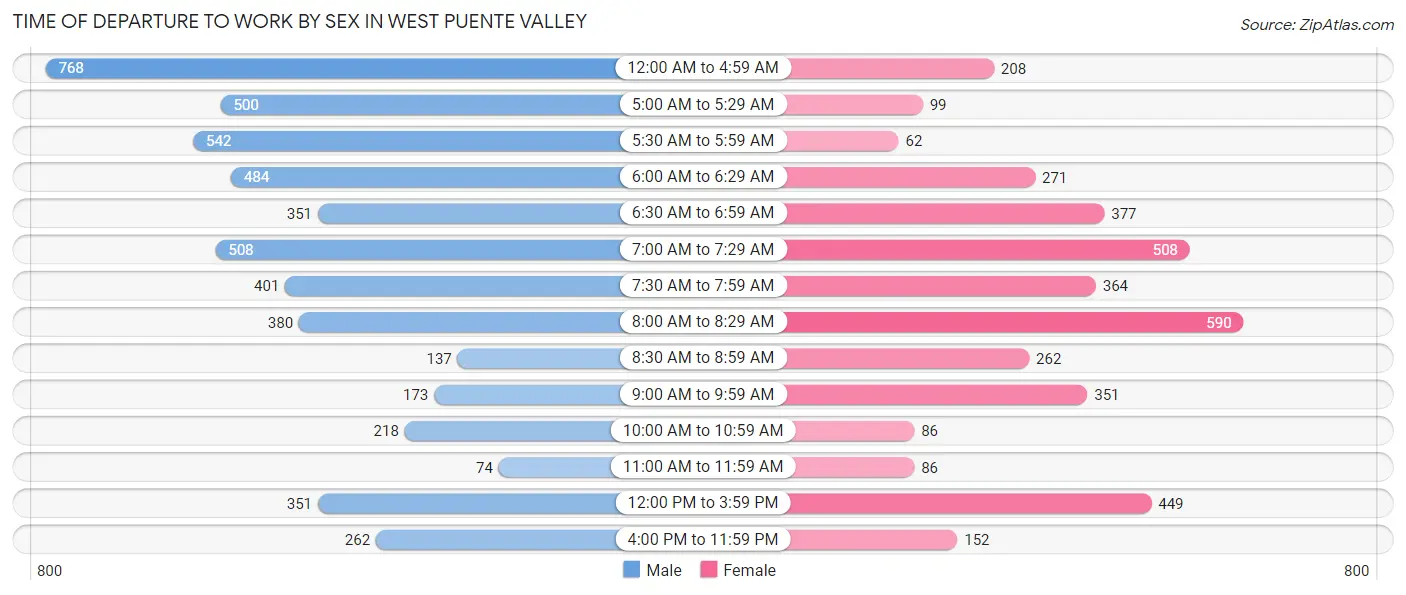
| Time of Departure | Male | Female |
| 12:00 AM to 4:59 AM | 768 (14.9%) | 208 (5.4%) |
| 5:00 AM to 5:29 AM | 500 (9.7%) | 99 (2.6%) |
| 5:30 AM to 5:59 AM | 542 (10.5%) | 62 (1.6%) |
| 6:00 AM to 6:29 AM | 484 (9.4%) | 271 (7.0%) |
| 6:30 AM to 6:59 AM | 351 (6.8%) | 377 (9.8%) |
| 7:00 AM to 7:29 AM | 508 (9.9%) | 508 (13.1%) |
| 7:30 AM to 7:59 AM | 401 (7.8%) | 364 (9.4%) |
| 8:00 AM to 8:29 AM | 380 (7.4%) | 590 (15.3%) |
| 8:30 AM to 8:59 AM | 137 (2.7%) | 262 (6.8%) |
| 9:00 AM to 9:59 AM | 173 (3.4%) | 351 (9.1%) |
| 10:00 AM to 10:59 AM | 218 (4.2%) | 86 (2.2%) |
| 11:00 AM to 11:59 AM | 74 (1.4%) | 86 (2.2%) |
| 12:00 PM to 3:59 PM | 351 (6.8%) | 449 (11.6%) |
| 4:00 PM to 11:59 PM | 262 (5.1%) | 152 (3.9%) |
| Total | 5,149 (100.0%) | 3,865 (100.0%) |
Housing Occupancy in West Puente Valley
Occupancy by Ownership in West Puente Valley
Of the total 5,090 dwellings in West Puente Valley, owner-occupied units account for 4,161 (81.8%), while renter-occupied units make up 929 (18.2%).
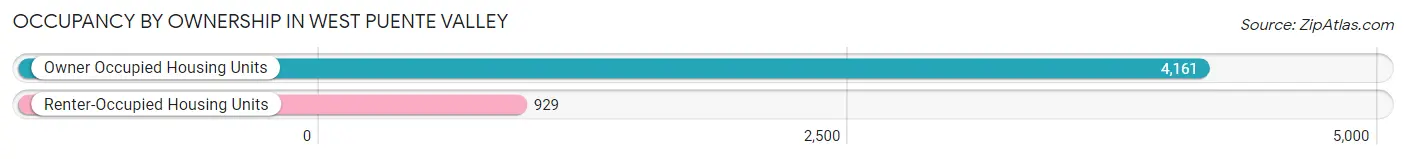
| Occupancy | # Housing Units | % Housing Units |
| Owner Occupied Housing Units | 4,161 | 81.8% |
| Renter-Occupied Housing Units | 929 | 18.2% |
| Total Occupied Housing Units | 5,090 | 100.0% |
Occupancy by Household Size in West Puente Valley
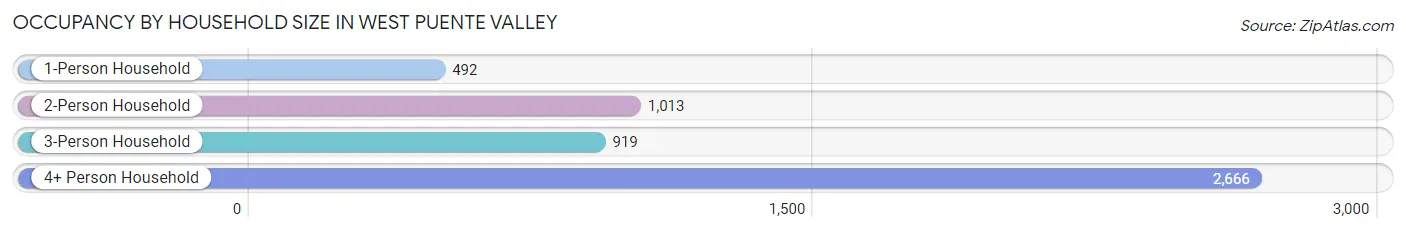
| Household Size | # Housing Units | % Housing Units |
| 1-Person Household | 492 | 9.7% |
| 2-Person Household | 1,013 | 19.9% |
| 3-Person Household | 919 | 18.1% |
| 4+ Person Household | 2,666 | 52.4% |
| Total Housing Units | 5,090 | 100.0% |
Occupancy by Ownership by Household Size in West Puente Valley
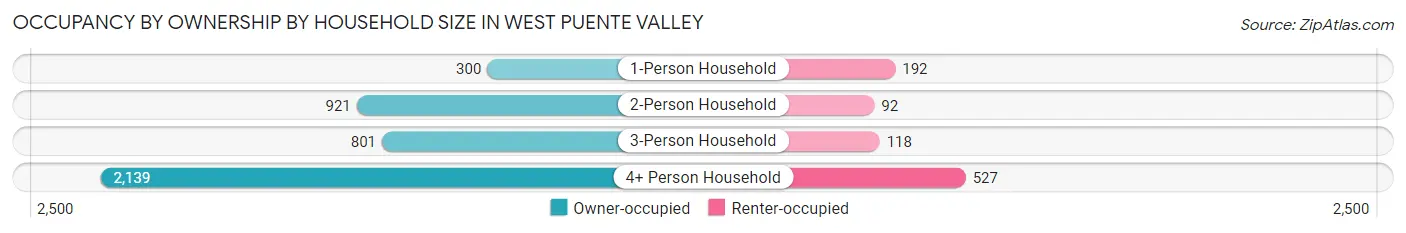
| Household Size | Owner-occupied | Renter-occupied |
| 1-Person Household | 300 (61.0%) | 192 (39.0%) |
| 2-Person Household | 921 (90.9%) | 92 (9.1%) |
| 3-Person Household | 801 (87.2%) | 118 (12.8%) |
| 4+ Person Household | 2,139 (80.2%) | 527 (19.8%) |
| Total Housing Units | 4,161 (81.8%) | 929 (18.2%) |
Occupancy by Educational Attainment in West Puente Valley
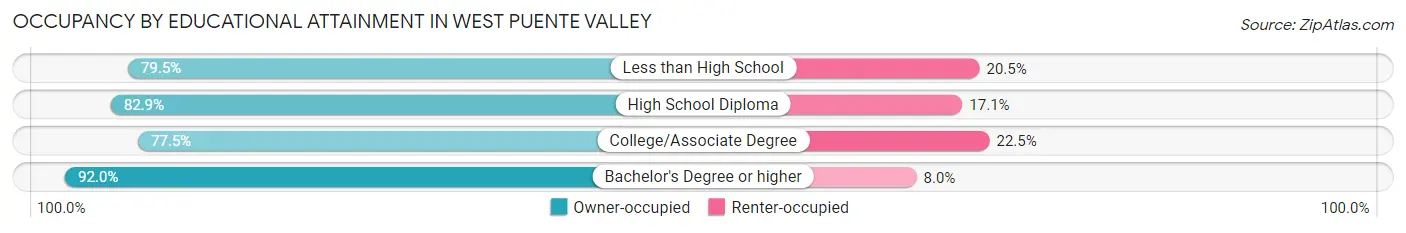
| Household Size | Owner-occupied | Renter-occupied |
| Less than High School | 1,253 (79.5%) | 323 (20.5%) |
| High School Diploma | 1,139 (82.9%) | 235 (17.1%) |
| College/Associate Degree | 1,069 (77.5%) | 310 (22.5%) |
| Bachelor's Degree or higher | 700 (92.0%) | 61 (8.0%) |
Occupancy by Age of Householder in West Puente Valley
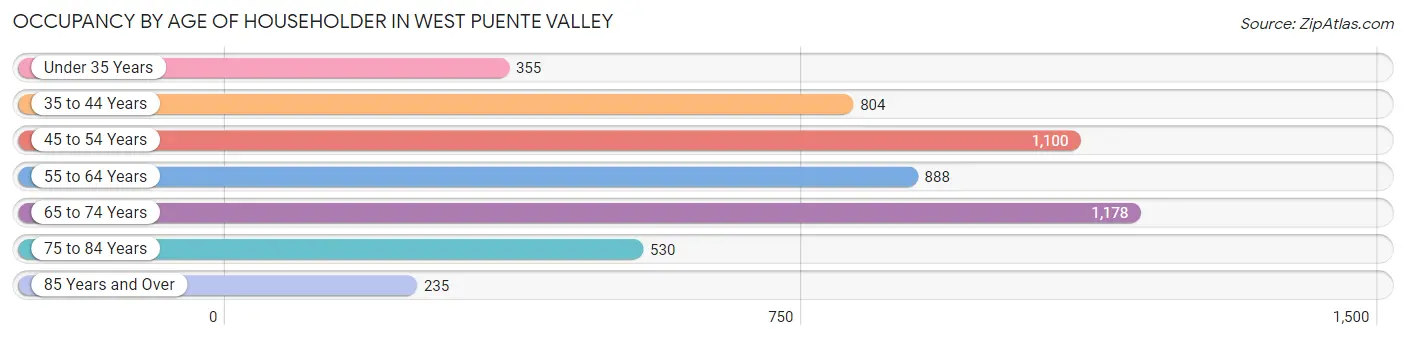
| Age Bracket | # Households | % Households |
| Under 35 Years | 355 | 7.0% |
| 35 to 44 Years | 804 | 15.8% |
| 45 to 54 Years | 1,100 | 21.6% |
| 55 to 64 Years | 888 | 17.4% |
| 65 to 74 Years | 1,178 | 23.1% |
| 75 to 84 Years | 530 | 10.4% |
| 85 Years and Over | 235 | 4.6% |
| Total | 5,090 | 100.0% |
Housing Finances in West Puente Valley
Median Income by Occupancy in West Puente Valley
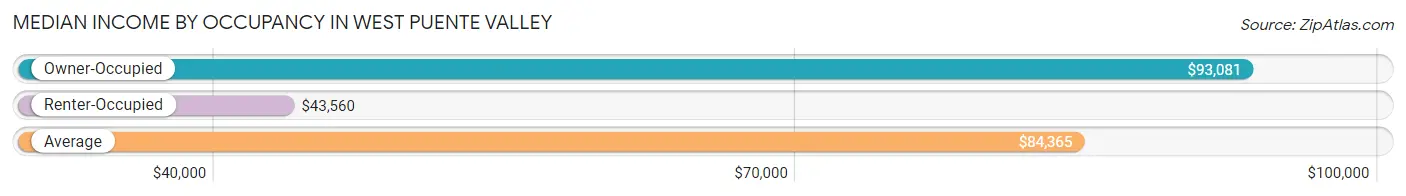
| Occupancy Type | # Households | Median Income |
| Owner-Occupied | 4,161 (81.8%) | $93,081 |
| Renter-Occupied | 929 (18.2%) | $43,560 |
| Average | 5,090 (100.0%) | $84,365 |
Occupancy by Householder Income Bracket in West Puente Valley
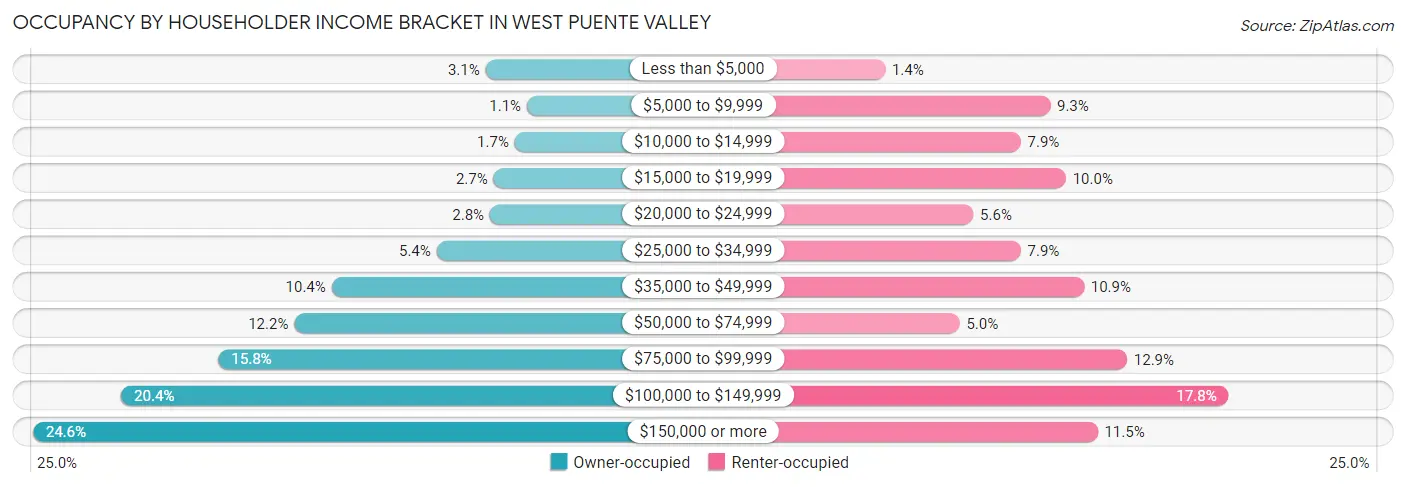
| Income Bracket | Owner-occupied | Renter-occupied |
| Less than $5,000 | 127 (3.0%) | 13 (1.4%) |
| $5,000 to $9,999 | 45 (1.1%) | 86 (9.3%) |
| $10,000 to $14,999 | 69 (1.7%) | 73 (7.9%) |
| $15,000 to $19,999 | 111 (2.7%) | 93 (10.0%) |
| $20,000 to $24,999 | 118 (2.8%) | 52 (5.6%) |
| $25,000 to $34,999 | 224 (5.4%) | 73 (7.9%) |
| $35,000 to $49,999 | 432 (10.4%) | 101 (10.9%) |
| $50,000 to $74,999 | 506 (12.2%) | 46 (5.0%) |
| $75,000 to $99,999 | 656 (15.8%) | 120 (12.9%) |
| $100,000 to $149,999 | 849 (20.4%) | 165 (17.8%) |
| $150,000 or more | 1,024 (24.6%) | 107 (11.5%) |
| Total | 4,161 (100.0%) | 929 (100.0%) |
Monthly Housing Cost Tiers in West Puente Valley
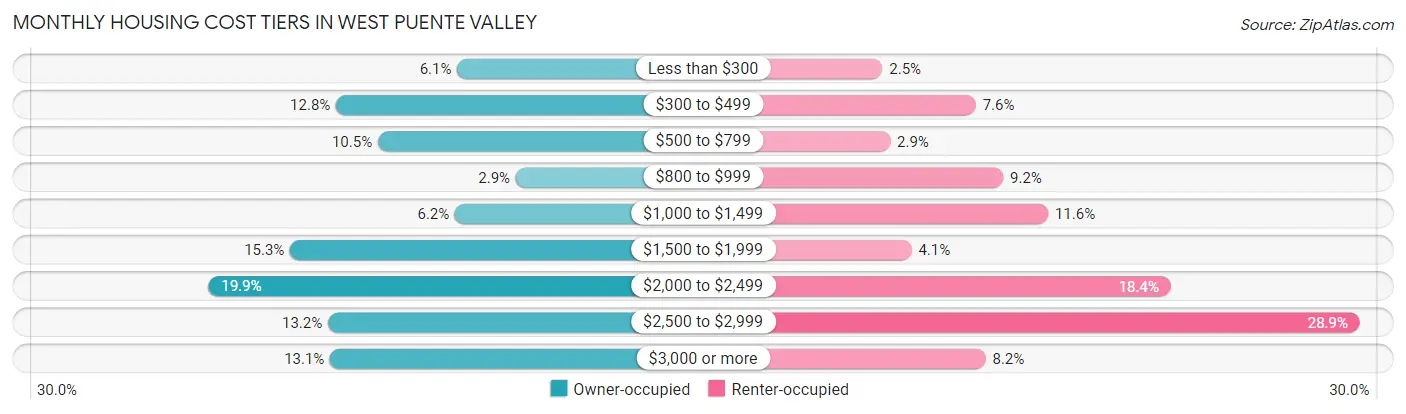
| Monthly Cost | Owner-occupied | Renter-occupied |
| Less than $300 | 254 (6.1%) | 23 (2.5%) |
| $300 to $499 | 532 (12.8%) | 71 (7.6%) |
| $500 to $799 | 436 (10.5%) | 27 (2.9%) |
| $800 to $999 | 119 (2.9%) | 85 (9.1%) |
| $1,000 to $1,499 | 259 (6.2%) | 108 (11.6%) |
| $1,500 to $1,999 | 638 (15.3%) | 38 (4.1%) |
| $2,000 to $2,499 | 826 (19.9%) | 171 (18.4%) |
| $2,500 to $2,999 | 551 (13.2%) | 268 (28.8%) |
| $3,000 or more | 546 (13.1%) | 76 (8.2%) |
| Total | 4,161 (100.0%) | 929 (100.0%) |
Physical Housing Characteristics in West Puente Valley
Housing Structures in West Puente Valley
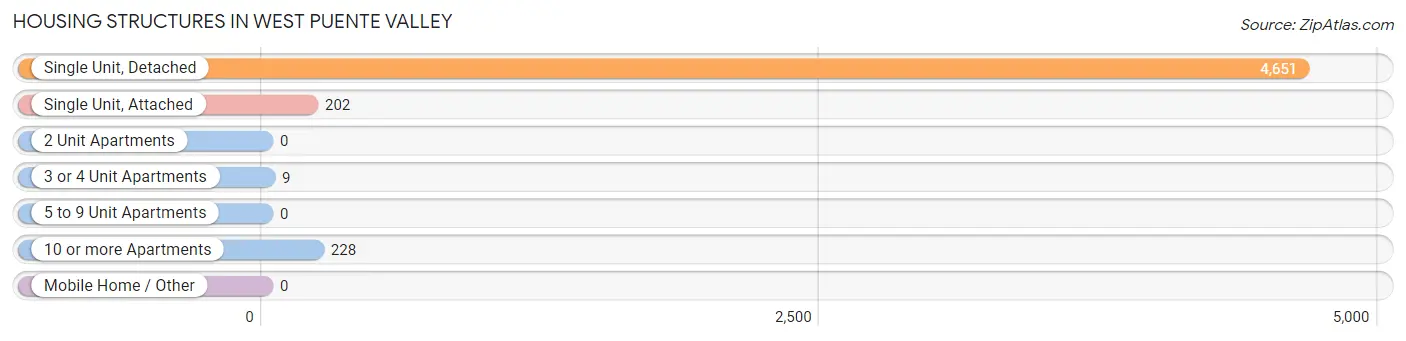
| Structure Type | # Housing Units | % Housing Units |
| Single Unit, Detached | 4,651 | 91.4% |
| Single Unit, Attached | 202 | 4.0% |
| 2 Unit Apartments | 0 | 0.0% |
| 3 or 4 Unit Apartments | 9 | 0.2% |
| 5 to 9 Unit Apartments | 0 | 0.0% |
| 10 or more Apartments | 228 | 4.5% |
| Mobile Home / Other | 0 | 0.0% |
| Total | 5,090 | 100.0% |
Housing Structures by Occupancy in West Puente Valley
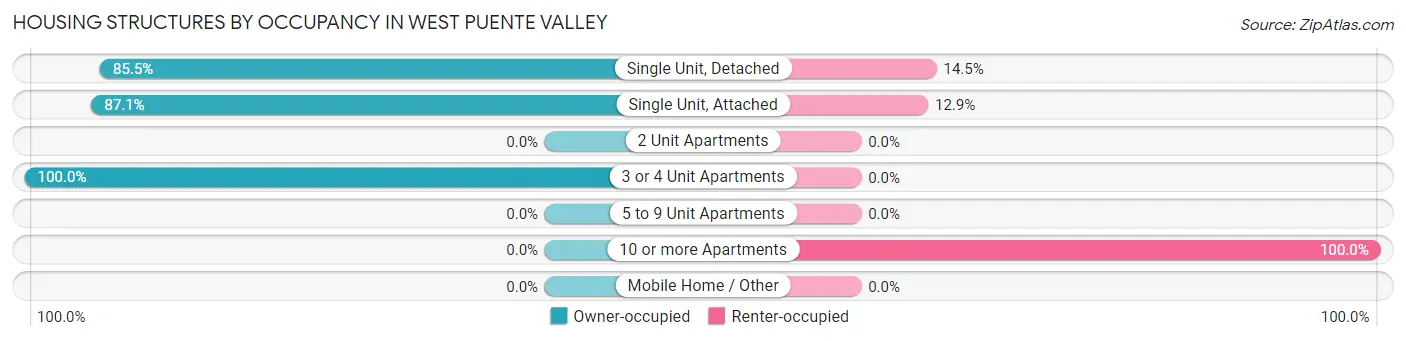
| Structure Type | Owner-occupied | Renter-occupied |
| Single Unit, Detached | 3,976 (85.5%) | 675 (14.5%) |
| Single Unit, Attached | 176 (87.1%) | 26 (12.9%) |
| 2 Unit Apartments | 0 (0.0%) | 0 (0.0%) |
| 3 or 4 Unit Apartments | 9 (100.0%) | 0 (0.0%) |
| 5 to 9 Unit Apartments | 0 (0.0%) | 0 (0.0%) |
| 10 or more Apartments | 0 (0.0%) | 228 (100.0%) |
| Mobile Home / Other | 0 (0.0%) | 0 (0.0%) |
| Total | 4,161 (81.8%) | 929 (18.2%) |
Housing Structures by Number of Rooms in West Puente Valley
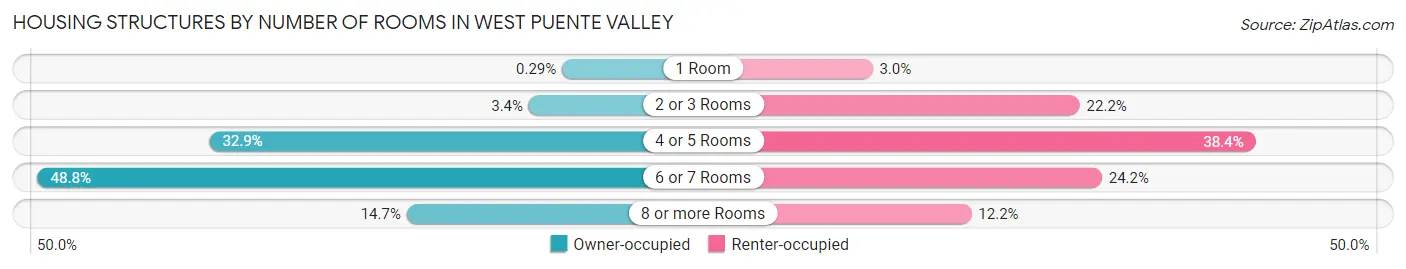
| Number of Rooms | Owner-occupied | Renter-occupied |
| 1 Room | 12 (0.3%) | 28 (3.0%) |
| 2 or 3 Rooms | 140 (3.4%) | 206 (22.2%) |
| 4 or 5 Rooms | 1,369 (32.9%) | 357 (38.4%) |
| 6 or 7 Rooms | 2,030 (48.8%) | 225 (24.2%) |
| 8 or more Rooms | 610 (14.7%) | 113 (12.2%) |
| Total | 4,161 (100.0%) | 929 (100.0%) |
Housing Structure by Heating Type in West Puente Valley
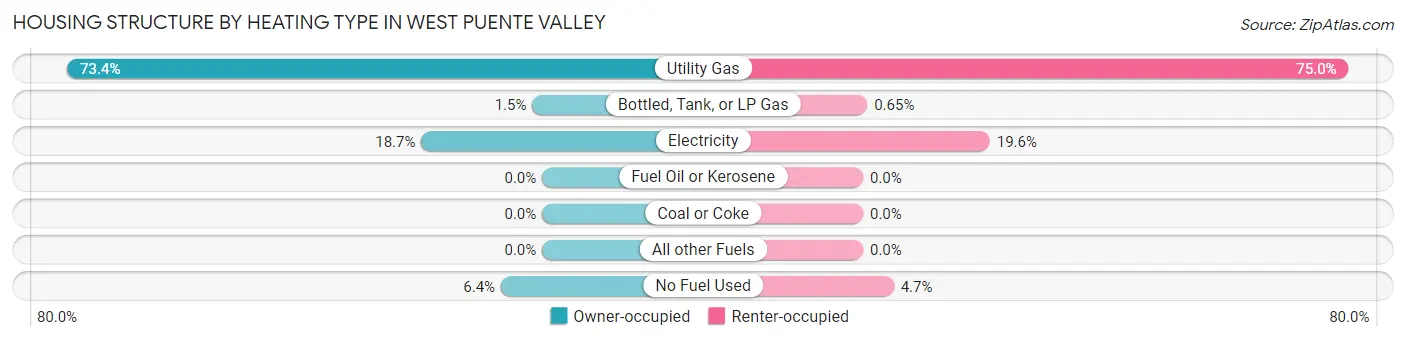
| Heating Type | Owner-occupied | Renter-occupied |
| Utility Gas | 3,056 (73.4%) | 697 (75.0%) |
| Bottled, Tank, or LP Gas | 63 (1.5%) | 6 (0.6%) |
| Electricity | 777 (18.7%) | 182 (19.6%) |
| Fuel Oil or Kerosene | 0 (0.0%) | 0 (0.0%) |
| Coal or Coke | 0 (0.0%) | 0 (0.0%) |
| All other Fuels | 0 (0.0%) | 0 (0.0%) |
| No Fuel Used | 265 (6.4%) | 44 (4.7%) |
| Total | 4,161 (100.0%) | 929 (100.0%) |
Household Vehicle Usage in West Puente Valley
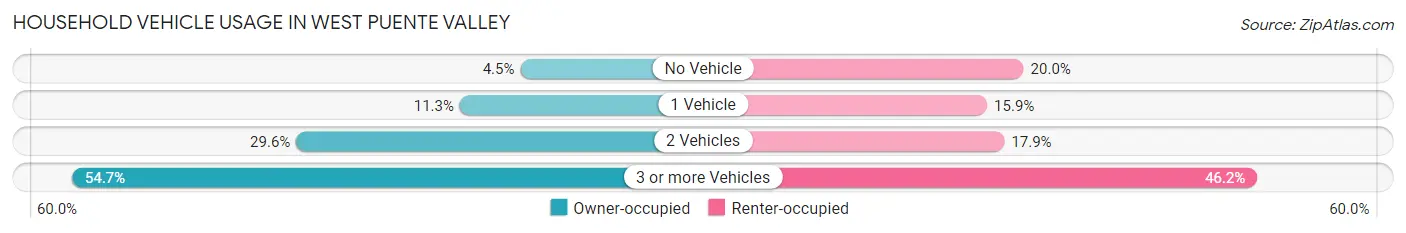
| Vehicles per Household | Owner-occupied | Renter-occupied |
| No Vehicle | 186 (4.5%) | 186 (20.0%) |
| 1 Vehicle | 468 (11.3%) | 148 (15.9%) |
| 2 Vehicles | 1,231 (29.6%) | 166 (17.9%) |
| 3 or more Vehicles | 2,276 (54.7%) | 429 (46.2%) |
| Total | 4,161 (100.0%) | 929 (100.0%) |
Real Estate & Mortgages in West Puente Valley
Real Estate and Mortgage Overview in West Puente Valley
| Characteristic | Without Mortgage | With Mortgage |
| Housing Units | 1,277 | 2,884 |
| Median Property Value | $579,200 | $577,600 |
| Median Household Income | $71,190 | $871 |
| Monthly Housing Costs | $472 | $546 |
| Real Estate Taxes | $2,460 | $24 |
Property Value by Mortgage Status in West Puente Valley
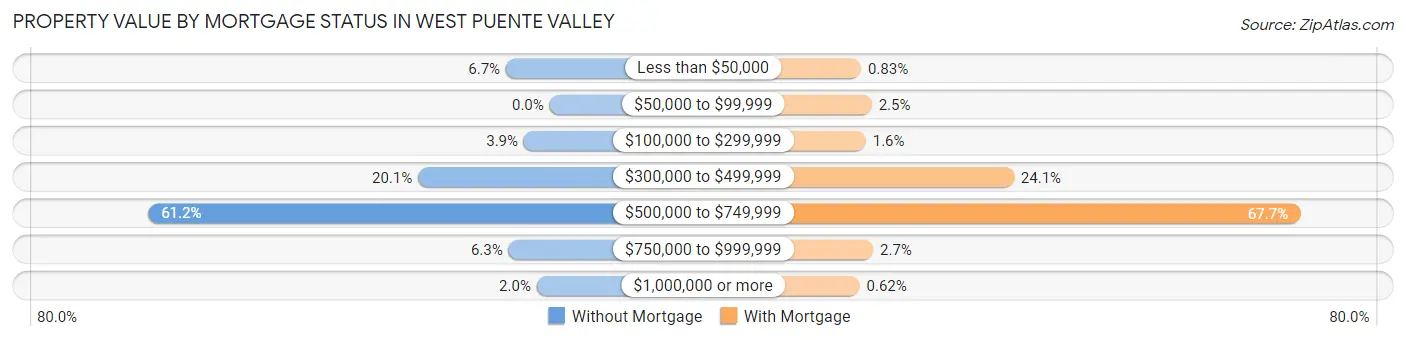
| Property Value | Without Mortgage | With Mortgage |
| Less than $50,000 | 85 (6.7%) | 24 (0.8%) |
| $50,000 to $99,999 | 0 (0.0%) | 71 (2.5%) |
| $100,000 to $299,999 | 50 (3.9%) | 45 (1.6%) |
| $300,000 to $499,999 | 256 (20.1%) | 696 (24.1%) |
| $500,000 to $749,999 | 781 (61.2%) | 1,953 (67.7%) |
| $750,000 to $999,999 | 80 (6.3%) | 77 (2.7%) |
| $1,000,000 or more | 25 (2.0%) | 18 (0.6%) |
| Total | 1,277 (100.0%) | 2,884 (100.0%) |
Household Income by Mortgage Status in West Puente Valley
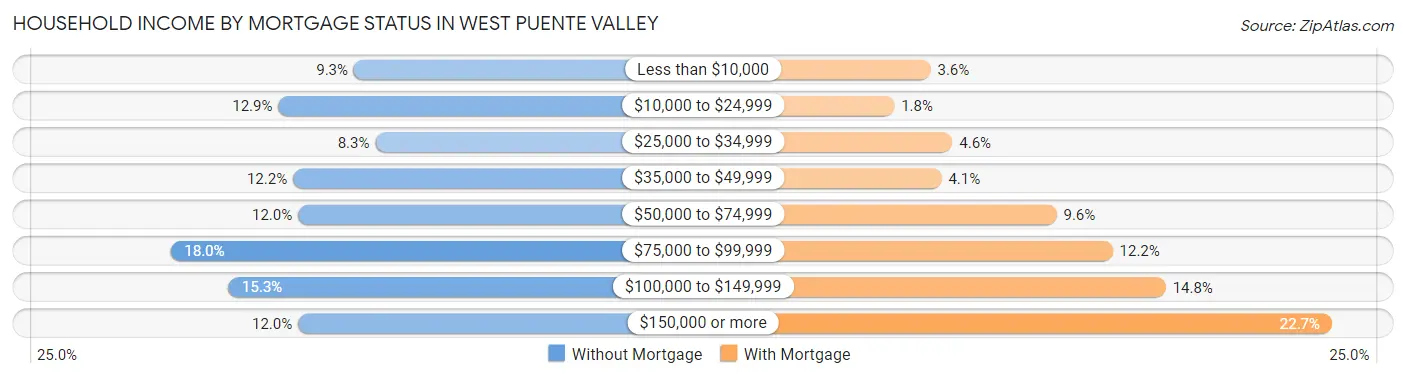
| Household Income | Without Mortgage | With Mortgage |
| Less than $10,000 | 119 (9.3%) | 103 (3.6%) |
| $10,000 to $24,999 | 165 (12.9%) | 53 (1.8%) |
| $25,000 to $34,999 | 106 (8.3%) | 133 (4.6%) |
| $35,000 to $49,999 | 156 (12.2%) | 118 (4.1%) |
| $50,000 to $74,999 | 153 (12.0%) | 276 (9.6%) |
| $75,000 to $99,999 | 230 (18.0%) | 353 (12.2%) |
| $100,000 to $149,999 | 195 (15.3%) | 426 (14.8%) |
| $150,000 or more | 153 (12.0%) | 654 (22.7%) |
| Total | 1,277 (100.0%) | 2,884 (100.0%) |
Property Value to Household Income Ratio in West Puente Valley
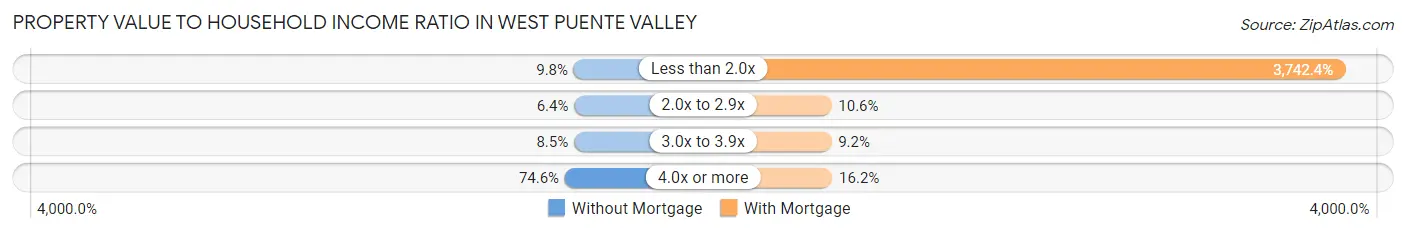
| Value-to-Income Ratio | Without Mortgage | With Mortgage |
| Less than 2.0x | 125 (9.8%) | 107,931 (3,742.4%) |
| 2.0x to 2.9x | 82 (6.4%) | 307 (10.6%) |
| 3.0x to 3.9x | 108 (8.5%) | 264 (9.1%) |
| 4.0x or more | 952 (74.6%) | 466 (16.2%) |
| Total | 1,277 (100.0%) | 2,884 (100.0%) |
Real Estate Taxes by Mortgage Status in West Puente Valley
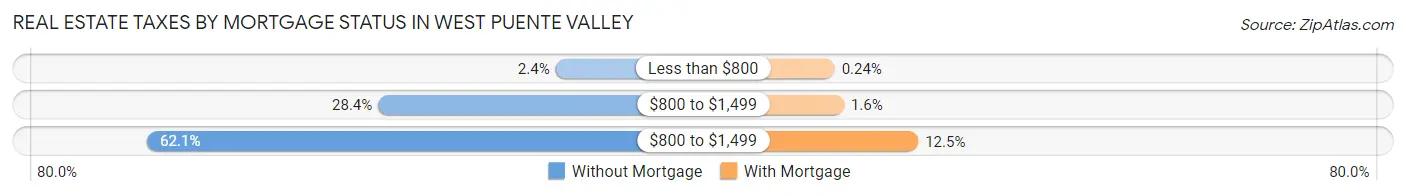
| Property Taxes | Without Mortgage | With Mortgage |
| Less than $800 | 31 (2.4%) | 7 (0.2%) |
| $800 to $1,499 | 362 (28.3%) | 46 (1.6%) |
| $800 to $1,499 | 793 (62.1%) | 359 (12.4%) |
| Total | 1,277 (100.0%) | 2,884 (100.0%) |
Health & Disability in West Puente Valley
Health Insurance Coverage by Age in West Puente Valley
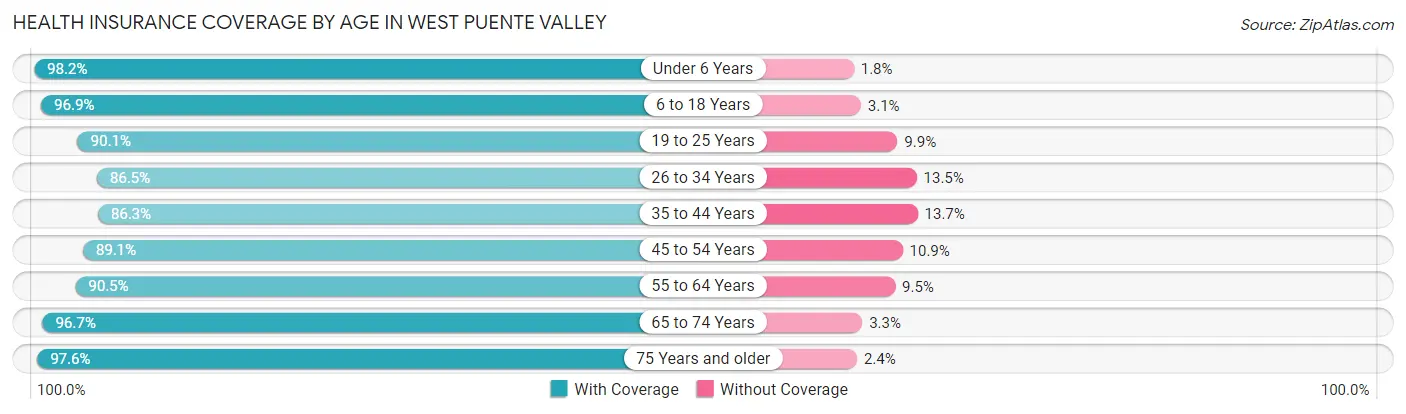
| Age Bracket | With Coverage | Without Coverage |
| Under 6 Years | 1,222 (98.2%) | 22 (1.8%) |
| 6 to 18 Years | 3,670 (96.9%) | 117 (3.1%) |
| 19 to 25 Years | 2,066 (90.1%) | 227 (9.9%) |
| 26 to 34 Years | 1,893 (86.5%) | 295 (13.5%) |
| 35 to 44 Years | 2,943 (86.3%) | 466 (13.7%) |
| 45 to 54 Years | 2,566 (89.1%) | 313 (10.9%) |
| 55 to 64 Years | 2,152 (90.5%) | 225 (9.5%) |
| 65 to 74 Years | 2,198 (96.7%) | 76 (3.3%) |
| 75 Years and older | 1,574 (97.6%) | 38 (2.4%) |
| Total | 20,284 (91.9%) | 1,779 (8.1%) |
Health Insurance Coverage by Citizenship Status in West Puente Valley
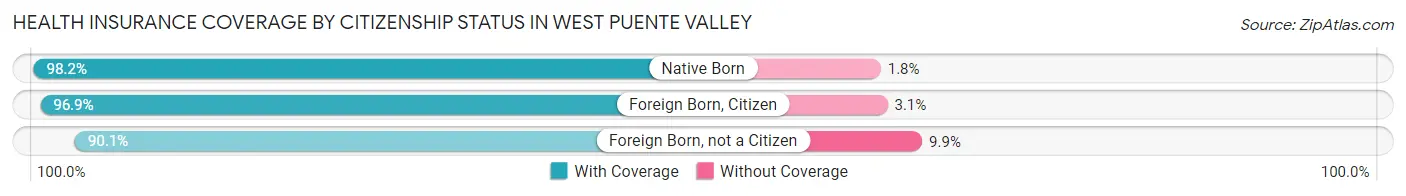
| Citizenship Status | With Coverage | Without Coverage |
| Native Born | 1,222 (98.2%) | 22 (1.8%) |
| Foreign Born, Citizen | 3,670 (96.9%) | 117 (3.1%) |
| Foreign Born, not a Citizen | 2,066 (90.1%) | 227 (9.9%) |
Health Insurance Coverage by Household Income in West Puente Valley
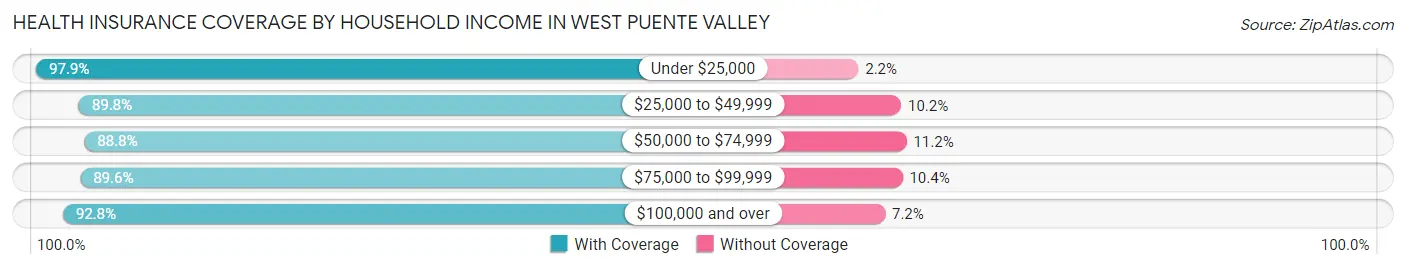
| Household Income | With Coverage | Without Coverage |
| Under $25,000 | 1,590 (97.9%) | 35 (2.1%) |
| $25,000 to $49,999 | 2,597 (89.8%) | 294 (10.2%) |
| $50,000 to $74,999 | 1,621 (88.8%) | 204 (11.2%) |
| $75,000 to $99,999 | 3,246 (89.6%) | 378 (10.4%) |
| $100,000 and over | 11,181 (92.8%) | 862 (7.2%) |
Public vs Private Health Insurance Coverage by Age in West Puente Valley
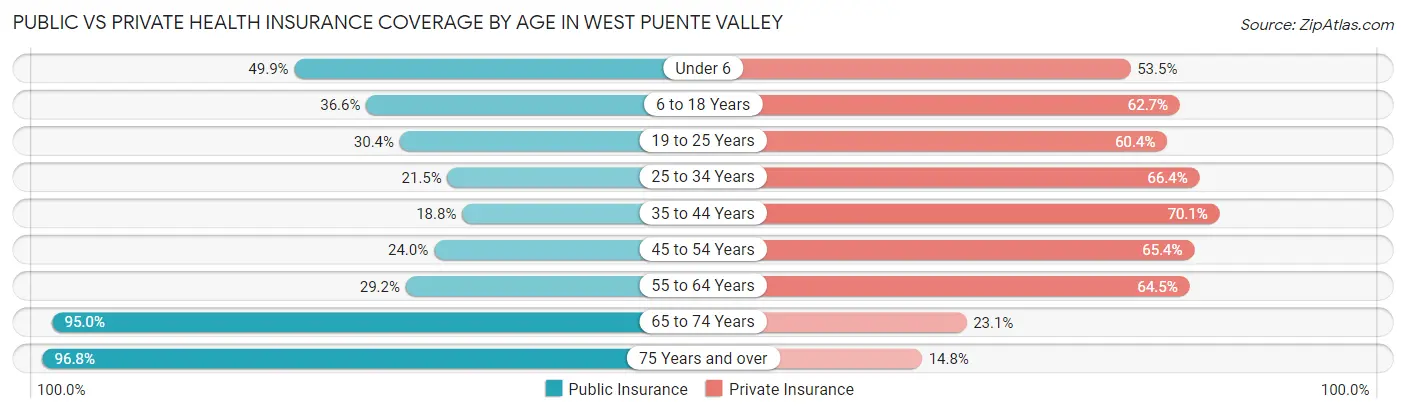
| Age Bracket | Public Insurance | Private Insurance |
| Under 6 | 621 (49.9%) | 666 (53.5%) |
| 6 to 18 Years | 1,385 (36.6%) | 2,376 (62.7%) |
| 19 to 25 Years | 696 (30.3%) | 1,385 (60.4%) |
| 25 to 34 Years | 470 (21.5%) | 1,453 (66.4%) |
| 35 to 44 Years | 640 (18.8%) | 2,391 (70.1%) |
| 45 to 54 Years | 691 (24.0%) | 1,884 (65.4%) |
| 55 to 64 Years | 695 (29.2%) | 1,534 (64.5%) |
| 65 to 74 Years | 2,160 (95.0%) | 525 (23.1%) |
| 75 Years and over | 1,561 (96.8%) | 239 (14.8%) |
| Total | 8,919 (40.4%) | 12,453 (56.4%) |
Disability Status by Sex by Age in West Puente Valley
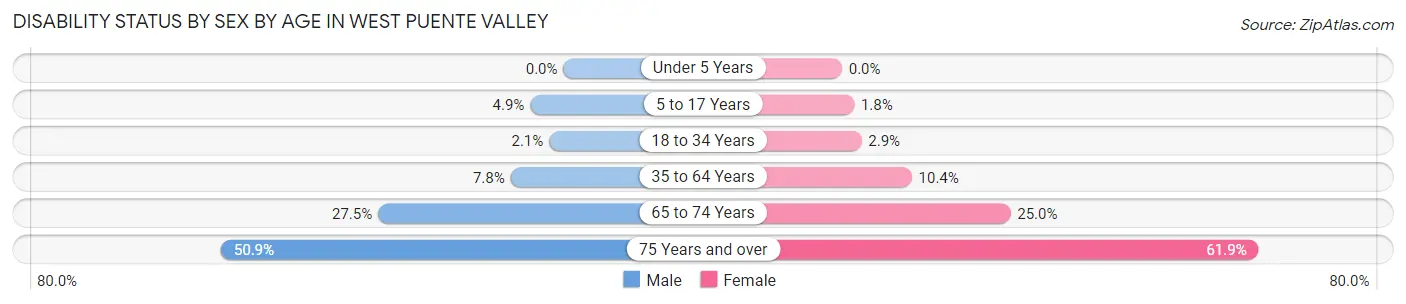
| Age Bracket | Male | Female |
| Under 5 Years | 0 (0.0%) | 0 (0.0%) |
| 5 to 17 Years | 105 (4.9%) | 30 (1.8%) |
| 18 to 34 Years | 55 (2.1%) | 61 (2.9%) |
| 35 to 64 Years | 351 (7.8%) | 434 (10.4%) |
| 65 to 74 Years | 287 (27.5%) | 308 (25.0%) |
| 75 Years and over | 329 (50.8%) | 597 (61.9%) |
Disability Class by Sex by Age in West Puente Valley
Disability Class: Hearing Difficulty
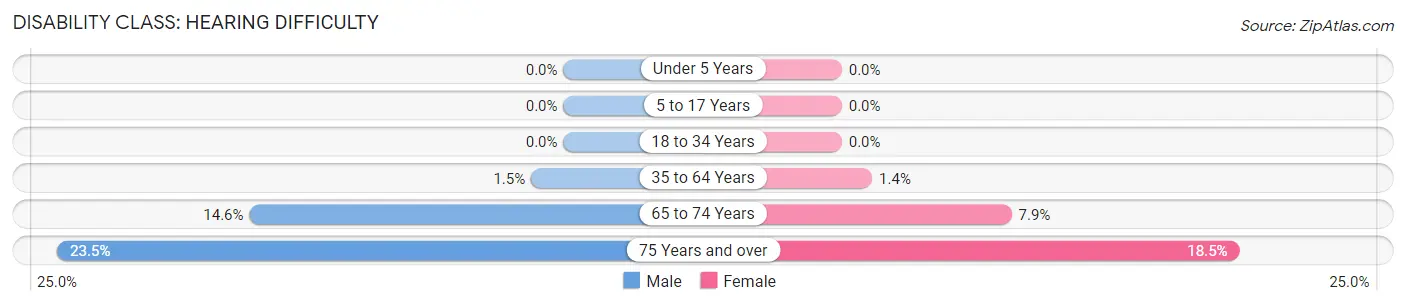
| Age Bracket | Male | Female |
| Under 5 Years | 0 (0.0%) | 0 (0.0%) |
| 5 to 17 Years | 0 (0.0%) | 0 (0.0%) |
| 18 to 34 Years | 0 (0.0%) | 0 (0.0%) |
| 35 to 64 Years | 67 (1.5%) | 59 (1.4%) |
| 65 to 74 Years | 152 (14.6%) | 97 (7.9%) |
| 75 Years and over | 152 (23.5%) | 178 (18.4%) |
Disability Class: Vision Difficulty
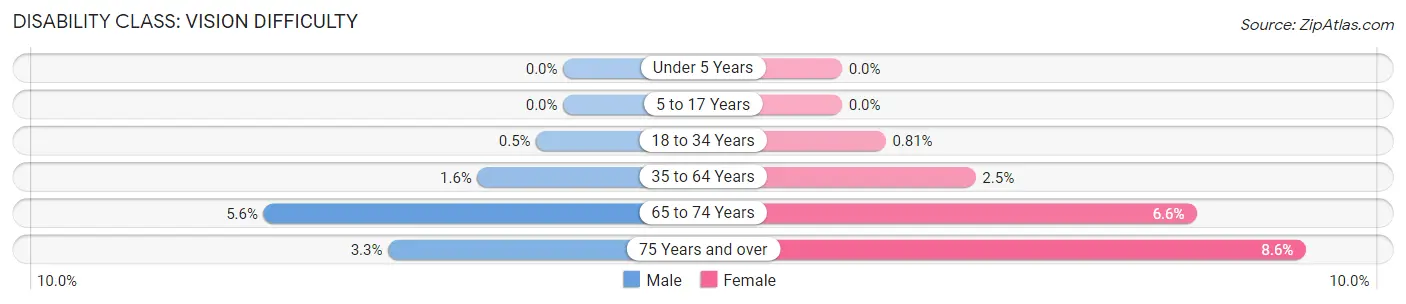
| Age Bracket | Male | Female |
| Under 5 Years | 0 (0.0%) | 0 (0.0%) |
| 5 to 17 Years | 0 (0.0%) | 0 (0.0%) |
| 18 to 34 Years | 13 (0.5%) | 17 (0.8%) |
| 35 to 64 Years | 71 (1.6%) | 104 (2.5%) |
| 65 to 74 Years | 58 (5.6%) | 81 (6.6%) |
| 75 Years and over | 21 (3.3%) | 83 (8.6%) |
Disability Class: Cognitive Difficulty
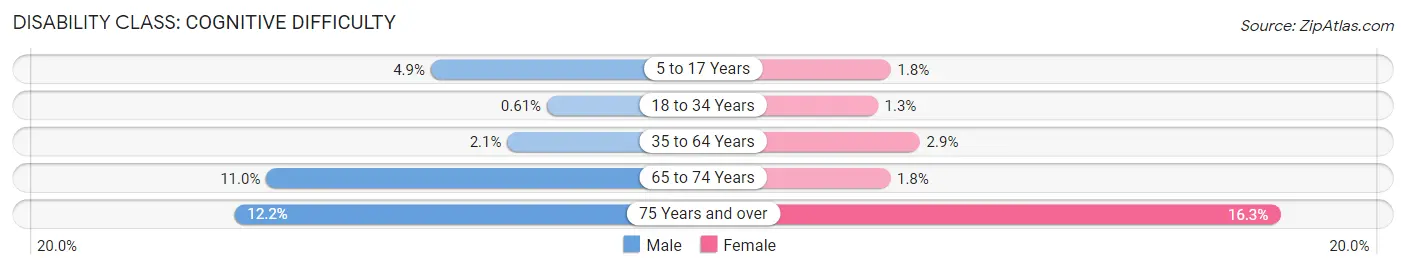
| Age Bracket | Male | Female |
| 5 to 17 Years | 105 (4.9%) | 30 (1.8%) |
| 18 to 34 Years | 16 (0.6%) | 28 (1.3%) |
| 35 to 64 Years | 93 (2.1%) | 121 (2.9%) |
| 65 to 74 Years | 115 (11.0%) | 22 (1.8%) |
| 75 Years and over | 79 (12.2%) | 157 (16.3%) |
Disability Class: Ambulatory Difficulty
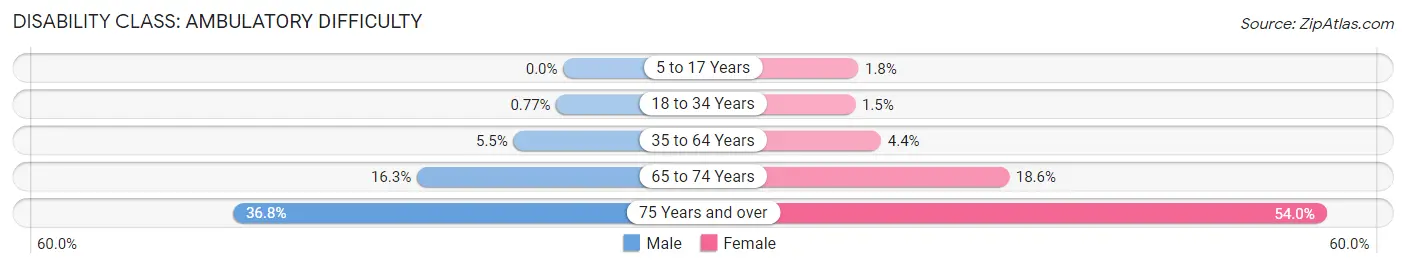
| Age Bracket | Male | Female |
| 5 to 17 Years | 0 (0.0%) | 30 (1.8%) |
| 18 to 34 Years | 20 (0.8%) | 31 (1.5%) |
| 35 to 64 Years | 248 (5.5%) | 182 (4.3%) |
| 65 to 74 Years | 170 (16.3%) | 229 (18.6%) |
| 75 Years and over | 238 (36.8%) | 521 (54.0%) |
Disability Class: Self-Care Difficulty
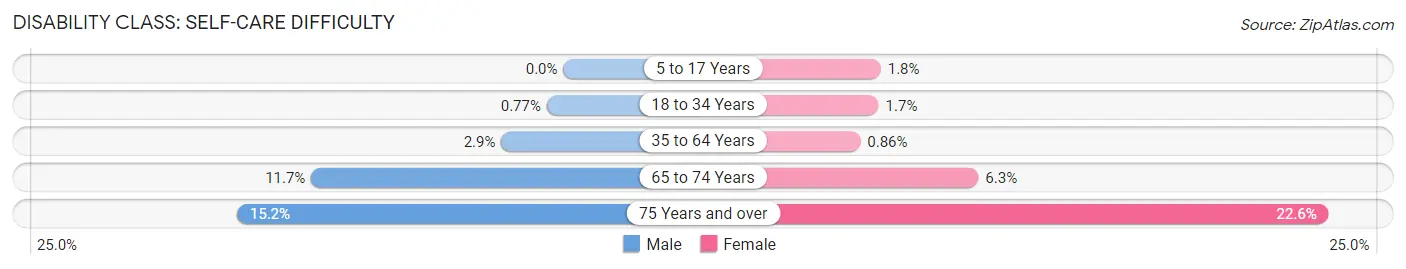
| Age Bracket | Male | Female |
| 5 to 17 Years | 0 (0.0%) | 30 (1.8%) |
| 18 to 34 Years | 20 (0.8%) | 36 (1.7%) |
| 35 to 64 Years | 129 (2.9%) | 36 (0.9%) |
| 65 to 74 Years | 122 (11.7%) | 78 (6.3%) |
| 75 Years and over | 98 (15.1%) | 218 (22.6%) |
Technology Access in West Puente Valley
Computing Device Access in West Puente Valley
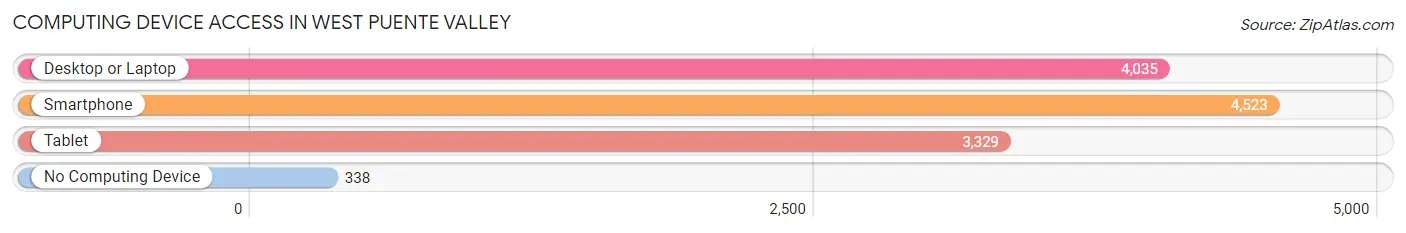
| Device Type | # Households | % Households |
| Desktop or Laptop | 4,035 | 79.3% |
| Smartphone | 4,523 | 88.9% |
| Tablet | 3,329 | 65.4% |
| No Computing Device | 338 | 6.6% |
| Total | 5,090 | 100.0% |
Internet Access in West Puente Valley
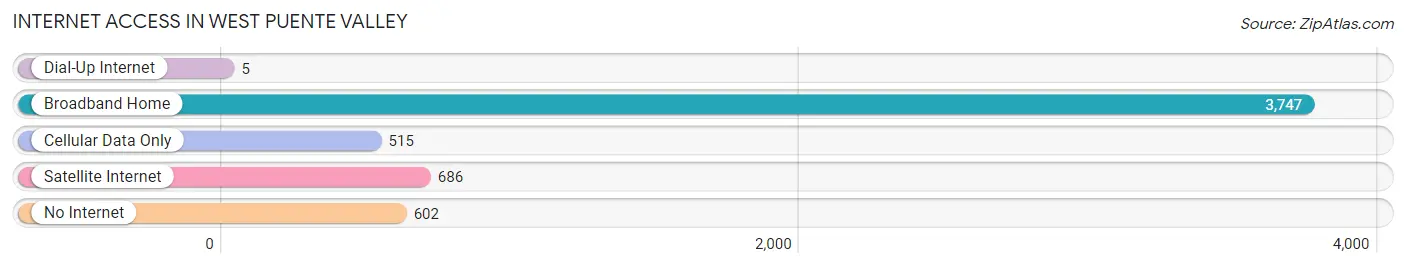
| Internet Type | # Households | % Households |
| Dial-Up Internet | 5 | 0.1% |
| Broadband Home | 3,747 | 73.6% |
| Cellular Data Only | 515 | 10.1% |
| Satellite Internet | 686 | 13.5% |
| No Internet | 602 | 11.8% |
| Total | 5,090 | 100.0% |
West Puente Valley Summary
West Puente Valley is a census-designated place (CDP) located in Los Angeles County, California. It is situated in the San Gabriel Valley, approximately 20 miles east of downtown Los Angeles. The population of West Puente Valley was estimated to be 24,817 in 2019.
Geography
West Puente Valley is located at 34°3'25"N 117°57'45"W (34.0569, -117.9625). It is bordered by the cities of La Puente to the north, Industry to the east, and Hacienda Heights to the south. The CDP has a total area of 2.3 square miles, all of which is land.
The terrain of West Puente Valley is mostly flat, with some rolling hills in the northern part of the CDP. The area is located in the San Gabriel Valley, which is part of the larger Los Angeles Basin. The climate is Mediterranean, with hot, dry summers and mild, wet winters.
History
West Puente Valley was originally inhabited by the Tongva people, who were the original inhabitants of the Los Angeles Basin. The area was part of the Rancho La Puente land grant, which was granted to John Rowland and William Workman in 1842. The area was later developed for agriculture, and the first subdivisions were built in the 1920s.
The area was incorporated as the City of West Puente Valley in 1957. The city was annexed by the City of La Puente in 1961. The area was then re-designated as a census-designated place in the 1970s.
Economy
West Puente Valley is primarily a residential area, with some light industrial and commercial development. The major employers in the area are the Los Angeles County Department of Public Works, the Los Angeles County Fire Department, and the Los Angeles County Sheriff's Department.
The median household income in West Puente Valley was $60,945 in 2019, which is higher than the median household income for Los Angeles County ($62,879). The unemployment rate in the CDP was 4.2% in 2019, which is lower than the unemployment rate for Los Angeles County (4.7%).
Demographics
West Puente Valley is a diverse community, with a population that is majority Hispanic (77.3%). The other major ethnic groups in the CDP are White (14.2%), Asian (4.7%), and African American (2.3%).
The median age in West Puente Valley is 33.7, which is lower than the median age for Los Angeles County (36.2). The CDP has a higher percentage of people under the age of 18 (27.2%) than Los Angeles County (24.2%).
Conclusion
West Puente Valley is a census-designated place located in Los Angeles County, California. It is situated in the San Gabriel Valley, approximately 20 miles east of downtown Los Angeles. The population of West Puente Valley was estimated to be 24,817 in 2019. The CDP has a diverse population, with a majority Hispanic population (77.3%). The economy of West Puente Valley is primarily residential, with some light industrial and commercial development. The median household income in West Puente Valley was $60,945 in 2019, which is higher than the median household income for Los Angeles County.
Common Questions
What is Per Capita Income in West Puente Valley?
Per Capita income in West Puente Valley is $25,030.
What is the Median Family Income in West Puente Valley?
Median Family Income in West Puente Valley is $88,362.
What is the Median Household income in West Puente Valley?
Median Household Income in West Puente Valley is $84,365.
What is Income or Wage Gap in West Puente Valley?
Income or Wage Gap in West Puente Valley is 19.8%.
Women in West Puente Valley earn 80.2 cents for every dollar earned by a man.
What is Family Income Deficit in West Puente Valley?
Family Income Deficit in West Puente Valley is $10,578.
Families that are below poverty line in West Puente Valley earn $10,578 less on average than the poverty threshold level.
What is Inequality or Gini Index in West Puente Valley?
Inequality or Gini Index in West Puente Valley is 0.42.
What is the Total Population of West Puente Valley?
Total Population of West Puente Valley is 22,074.
What is the Total Male Population of West Puente Valley?
Total Male Population of West Puente Valley is 11,514.
What is the Total Female Population of West Puente Valley?
Total Female Population of West Puente Valley is 10,560.
What is the Ratio of Males per 100 Females in West Puente Valley?
There are 109.03 Males per 100 Females in West Puente Valley.
What is the Ratio of Females per 100 Males in West Puente Valley?
There are 91.71 Females per 100 Males in West Puente Valley.
What is the Median Population Age in West Puente Valley?
Median Population Age in West Puente Valley is 39.1 Years.
What is the Average Family Size in West Puente Valley
Average Family Size in West Puente Valley is 4.5 People.
What is the Average Household Size in West Puente Valley
Average Household Size in West Puente Valley is 4.3 People.
How Large is the Labor Force in West Puente Valley?
There are 10,778 People in the Labor Forcein in West Puente Valley.
What is the Percentage of People in the Labor Force in West Puente Valley?
60.6% of People are in the Labor Force in West Puente Valley.
What is the Unemployment Rate in West Puente Valley?
Unemployment Rate in West Puente Valley is 7.3%.