Tracy, CA Map & Demographics
Tracy Map
Tracy Overview
$40,041
PER CAPITA INCOME
$120,421
AVG FAMILY INCOME
$111,717
AVG HOUSEHOLD INCOME
39.0%
WAGE / INCOME GAP [ % ]
61.0¢/ $1
WAGE / INCOME GAP [ $ ]
$9,992
FAMILY INCOME DEFICIT
0.37
INEQUALITY / GINI INDEX
94,027
TOTAL POPULATION
47,651
MALE POPULATION
46,376
FEMALE POPULATION
102.75
MALES / 100 FEMALES
97.32
FEMALES / 100 MALES
34.4
MEDIAN AGE
3.7
AVG FAMILY SIZE
3.4
AVG HOUSEHOLD SIZE
48,813
LABOR FORCE [ PEOPLE ]
68.3%
PERCENT IN LABOR FORCE
5.4%
UNEMPLOYMENT RATE
Tracy Area Codes
Income in Tracy
Income Overview in Tracy
Per Capita Income in Tracy is $40,041, while median incomes of families and households are $120,421 and $111,717 respectively.
| Characteristic | Number | Measure |
| Per Capita Income | 94,027 | $40,041 |
| Median Family Income | 22,032 | $120,421 |
| Mean Family Income | 22,032 | $137,433 |
| Median Household Income | 27,645 | $111,717 |
| Mean Household Income | 27,645 | $131,566 |
| Income Deficit | 22,032 | $9,992 |
| Wage / Income Gap (%) | 94,027 | 39.04% |
| Wage / Income Gap ($) | 94,027 | 60.96¢ per $1 |
| Gini / Inequality Index | 94,027 | 0.37 |
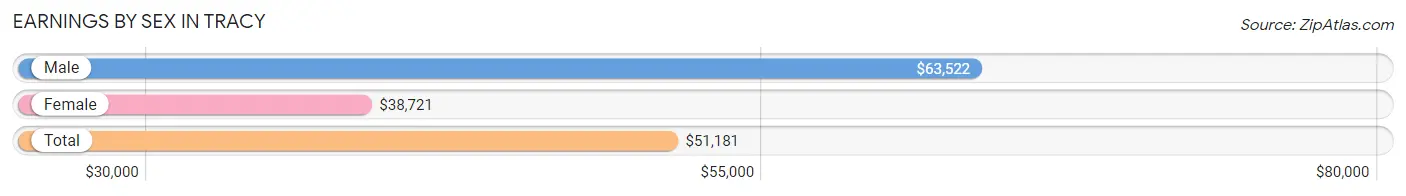
Earnings by Sex in Tracy
Average Earnings in Tracy are $51,181, $63,522 for men and $38,721 for women, a difference of 39.0%.
| Sex | Number | Average Earnings |
| Male | 27,064 (54.3%) | $63,522 |
| Female | 22,750 (45.7%) | $38,721 |
| Total | 49,814 (100.0%) | $51,181 |
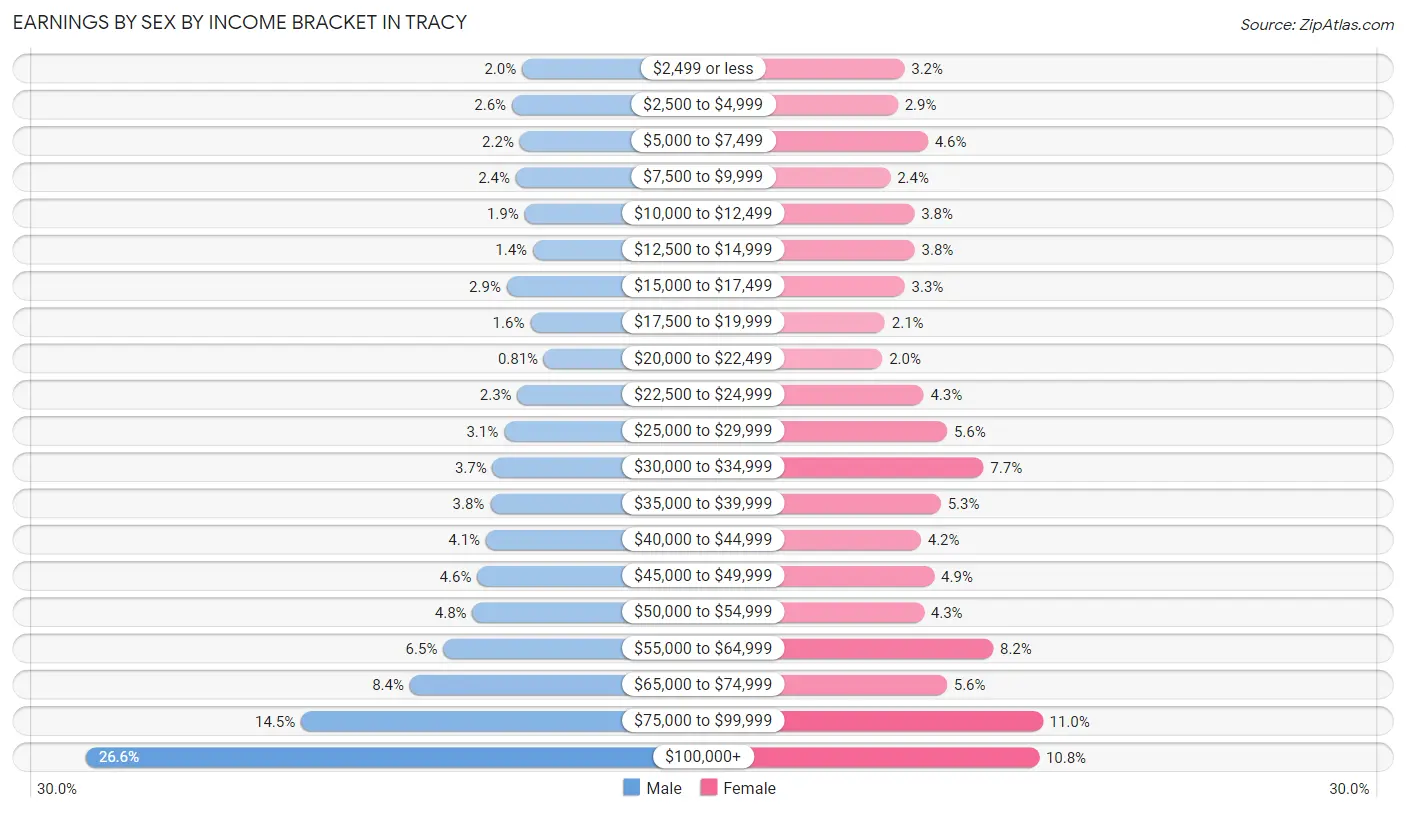
Earnings by Sex by Income Bracket in Tracy
The most common earnings brackets in Tracy are $100,000+ for men (7,187 | 26.6%) and $75,000 to $99,999 for women (2,503 | 11.0%).
| Income | Male | Female |
| $2,499 or less | 552 (2.0%) | 735 (3.2%) |
| $2,500 to $4,999 | 707 (2.6%) | 650 (2.9%) |
| $5,000 to $7,499 | 586 (2.2%) | 1,036 (4.5%) |
| $7,500 to $9,999 | 646 (2.4%) | 554 (2.4%) |
| $10,000 to $12,499 | 513 (1.9%) | 863 (3.8%) |
| $12,500 to $14,999 | 388 (1.4%) | 866 (3.8%) |
| $15,000 to $17,499 | 785 (2.9%) | 740 (3.3%) |
| $17,500 to $19,999 | 427 (1.6%) | 486 (2.1%) |
| $20,000 to $22,499 | 219 (0.8%) | 452 (2.0%) |
| $22,500 to $24,999 | 623 (2.3%) | 980 (4.3%) |
| $25,000 to $29,999 | 826 (3.0%) | 1,281 (5.6%) |
| $30,000 to $34,999 | 1,002 (3.7%) | 1,748 (7.7%) |
| $35,000 to $39,999 | 1,037 (3.8%) | 1,202 (5.3%) |
| $40,000 to $44,999 | 1,101 (4.1%) | 946 (4.2%) |
| $45,000 to $49,999 | 1,233 (4.6%) | 1,118 (4.9%) |
| $50,000 to $54,999 | 1,307 (4.8%) | 986 (4.3%) |
| $55,000 to $64,999 | 1,752 (6.5%) | 1,869 (8.2%) |
| $65,000 to $74,999 | 2,259 (8.4%) | 1,279 (5.6%) |
| $75,000 to $99,999 | 3,914 (14.5%) | 2,503 (11.0%) |
| $100,000+ | 7,187 (26.6%) | 2,456 (10.8%) |
| Total | 27,064 (100.0%) | 22,750 (100.0%) |
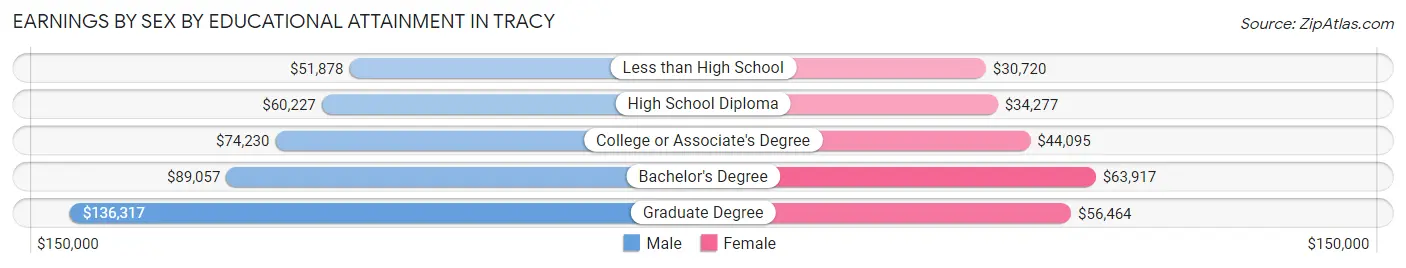
Earnings by Sex by Educational Attainment in Tracy
Average earnings in Tracy are $72,066 for men and $44,296 for women, a difference of 38.5%. Men with an educational attainment of graduate degree enjoy the highest average annual earnings of $136,317, while those with less than high school education earn the least with $51,878. Women with an educational attainment of bachelor's degree earn the most with the average annual earnings of $63,917, while those with less than high school education have the smallest earnings of $30,720.
| Educational Attainment | Male Income | Female Income |
| Less than High School | $51,878 | $30,720 |
| High School Diploma | $60,227 | $34,277 |
| College or Associate's Degree | $74,230 | $44,095 |
| Bachelor's Degree | $89,057 | $63,917 |
| Graduate Degree | $136,317 | $56,464 |
| Total | $72,066 | $44,296 |
Family Income in Tracy
Family Income Brackets in Tracy
According to the Tracy family income data, there are 5,838 families falling into the $100,000 to $149,999 income range, which is the most common income bracket and makes up 26.5% of all families. Conversely, the $10,000 to $14,999 income bracket is the least frequent group with only 220 families (1.0%) belonging to this category.
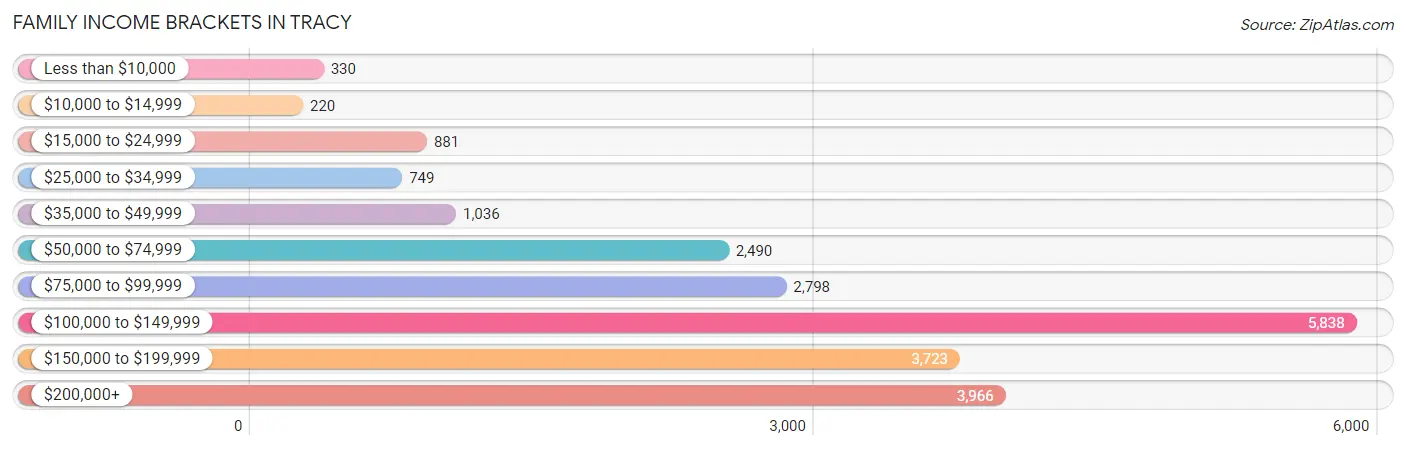
| Income Bracket | # Families | % Families |
| Less than $10,000 | 330 | 1.5% |
| $10,000 to $14,999 | 220 | 1.0% |
| $15,000 to $24,999 | 881 | 4.0% |
| $25,000 to $34,999 | 749 | 3.4% |
| $35,000 to $49,999 | 1,036 | 4.7% |
| $50,000 to $74,999 | 2,490 | 11.3% |
| $75,000 to $99,999 | 2,798 | 12.7% |
| $100,000 to $149,999 | 5,838 | 26.5% |
| $150,000 to $199,999 | 3,723 | 16.9% |
| $200,000+ | 3,966 | 18.0% |
Family Income by Famaliy Size in Tracy
6-person families (1,315 | 6.0%) account for the highest median family income in Tracy with $132,443 per family, while 2-person families (6,729 | 30.5%) have the highest median income of $53,125 per family member.
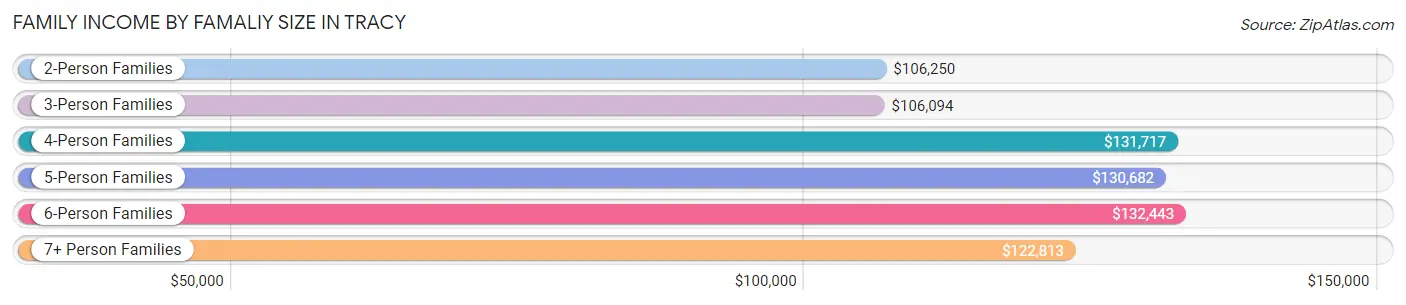
| Income Bracket | # Families | Median Income |
| 2-Person Families | 6,729 (30.5%) | $106,250 |
| 3-Person Families | 4,575 (20.8%) | $106,094 |
| 4-Person Families | 5,438 (24.7%) | $131,717 |
| 5-Person Families | 3,412 (15.5%) | $130,682 |
| 6-Person Families | 1,315 (6.0%) | $132,443 |
| 7+ Person Families | 563 (2.6%) | $122,813 |
| Total | 22,032 (100.0%) | $120,421 |
Family Income by Number of Earners in Tracy
The median family income in Tracy is $120,421, with families comprising 3+ earners (4,050) having the highest median family income of $174,329, while families with no earners (1,441) have the lowest median family income of $59,299, accounting for 18.4% and 6.5% of families, respectively.
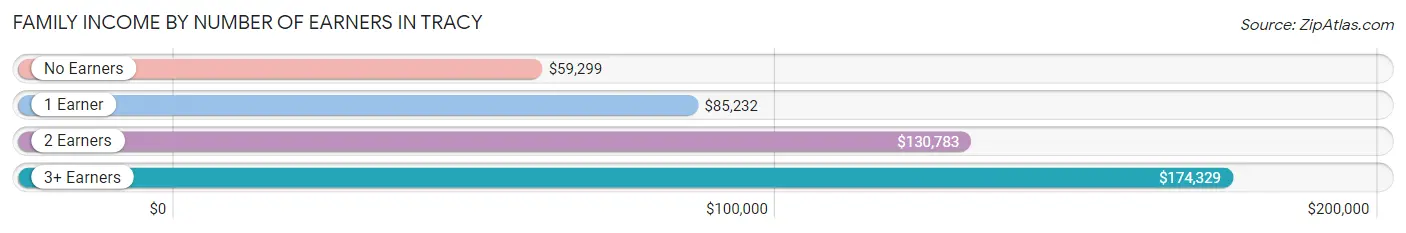
| Number of Earners | # Families | Median Income |
| No Earners | 1,441 (6.5%) | $59,299 |
| 1 Earner | 7,001 (31.8%) | $85,232 |
| 2 Earners | 9,540 (43.3%) | $130,783 |
| 3+ Earners | 4,050 (18.4%) | $174,329 |
| Total | 22,032 (100.0%) | $120,421 |
Household Income in Tracy
Household Income Brackets in Tracy
With 7,437 households falling in the category, the $100,000 to $149,999 income range is the most frequent in Tracy, accounting for 26.9% of all households. In contrast, only 332 households (1.2%) fall into the $10,000 to $14,999 income bracket, making it the least populous group.
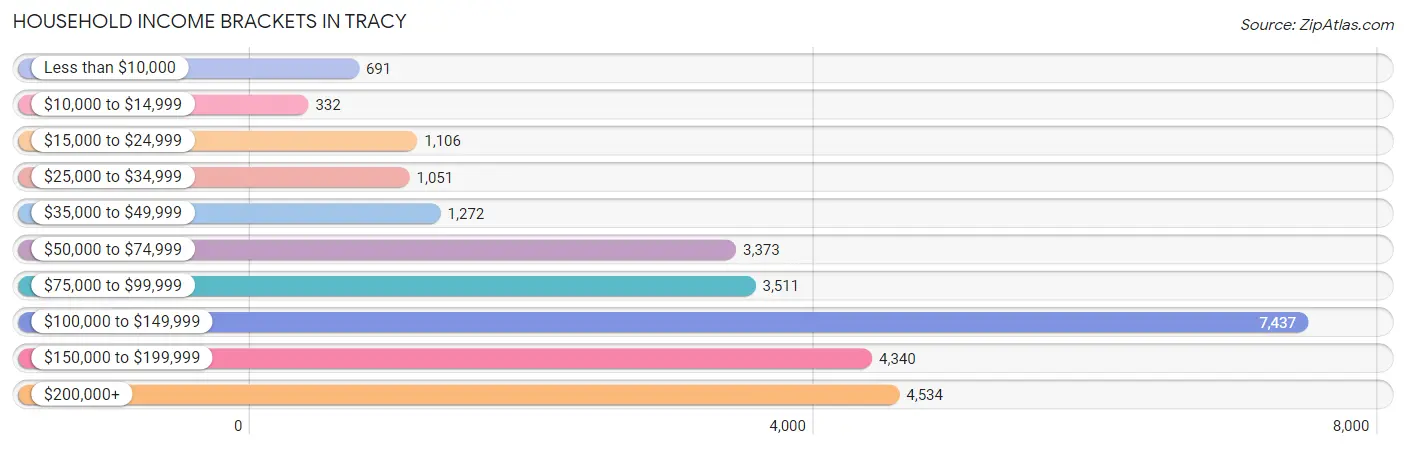
| Income Bracket | # Households | % Households |
| Less than $10,000 | 691 | 2.5% |
| $10,000 to $14,999 | 332 | 1.2% |
| $15,000 to $24,999 | 1,106 | 4.0% |
| $25,000 to $34,999 | 1,051 | 3.8% |
| $35,000 to $49,999 | 1,272 | 4.6% |
| $50,000 to $74,999 | 3,373 | 12.2% |
| $75,000 to $99,999 | 3,511 | 12.7% |
| $100,000 to $149,999 | 7,437 | 26.9% |
| $150,000 to $199,999 | 4,340 | 15.7% |
| $200,000+ | 4,534 | 16.4% |
Household Income by Householder Age in Tracy
The median household income in Tracy is $111,717, with the highest median household income of $129,598 found in the 45 to 64 years age bracket for the primary householder. A total of 12,232 households (44.3%) fall into this category. Meanwhile, the 65+ years age bracket for the primary householder has the lowest median household income of $72,950, with 4,188 households (15.1%) in this group.
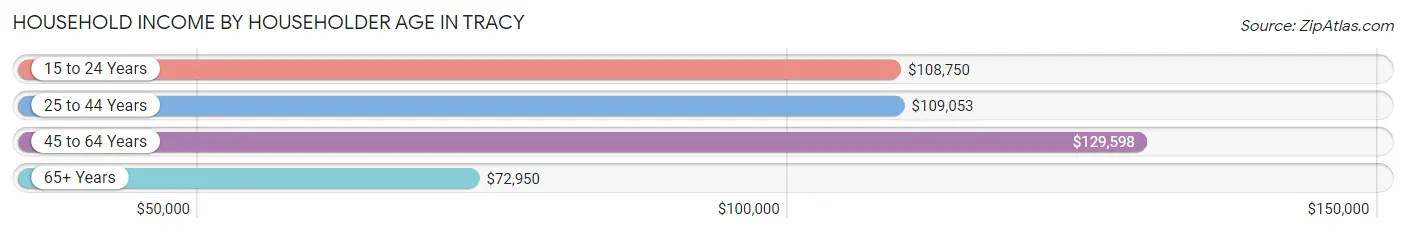
| Income Bracket | # Households | Median Income |
| 15 to 24 Years | 298 (1.1%) | $108,750 |
| 25 to 44 Years | 10,927 (39.5%) | $109,053 |
| 45 to 64 Years | 12,232 (44.3%) | $129,598 |
| 65+ Years | 4,188 (15.1%) | $72,950 |
| Total | 27,645 (100.0%) | $111,717 |
Poverty in Tracy
Income Below Poverty by Sex and Age in Tracy
With 7.9% poverty level for males and 9.6% for females among the residents of Tracy, 6 to 11 year old males and 5 year old females are the most vulnerable to poverty, with 706 males (14.4%) and 197 females (29.6%) in their respective age groups living below the poverty level.
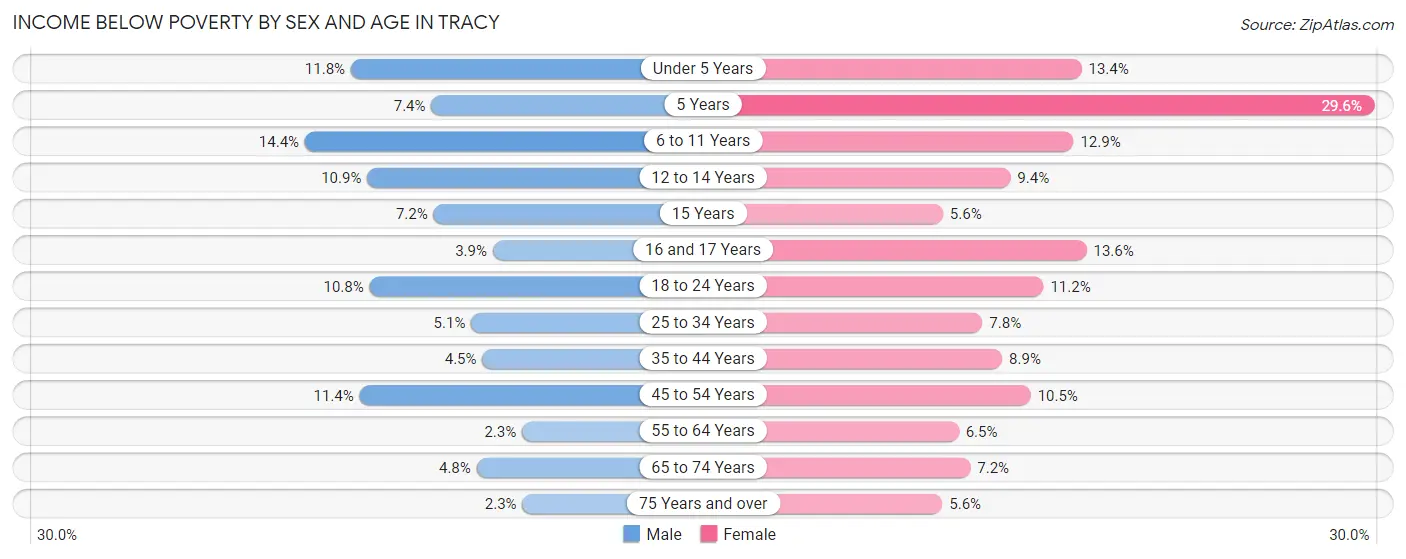
| Age Bracket | Male | Female |
| Under 5 Years | 366 (11.8%) | 391 (13.4%) |
| 5 Years | 35 (7.3%) | 197 (29.6%) |
| 6 to 11 Years | 706 (14.4%) | 441 (12.9%) |
| 12 to 14 Years | 336 (10.9%) | 194 (9.4%) |
| 15 Years | 36 (7.2%) | 50 (5.6%) |
| 16 and 17 Years | 54 (3.9%) | 148 (13.6%) |
| 18 to 24 Years | 542 (10.8%) | 487 (11.2%) |
| 25 to 34 Years | 317 (5.1%) | 549 (7.8%) |
| 35 to 44 Years | 303 (4.5%) | 616 (8.9%) |
| 45 to 54 Years | 743 (11.4%) | 711 (10.5%) |
| 55 to 64 Years | 122 (2.3%) | 332 (6.5%) |
| 65 to 74 Years | 124 (4.8%) | 221 (7.2%) |
| 75 Years and over | 34 (2.3%) | 100 (5.6%) |
| Total | 3,718 (7.9%) | 4,437 (9.6%) |
Income Above Poverty by Sex and Age in Tracy
According to the poverty statistics in Tracy, males aged 75 years and over and females aged 75 years and over are the age groups that are most secure financially, with 97.7% of males and 94.4% of females in these age groups living above the poverty line.
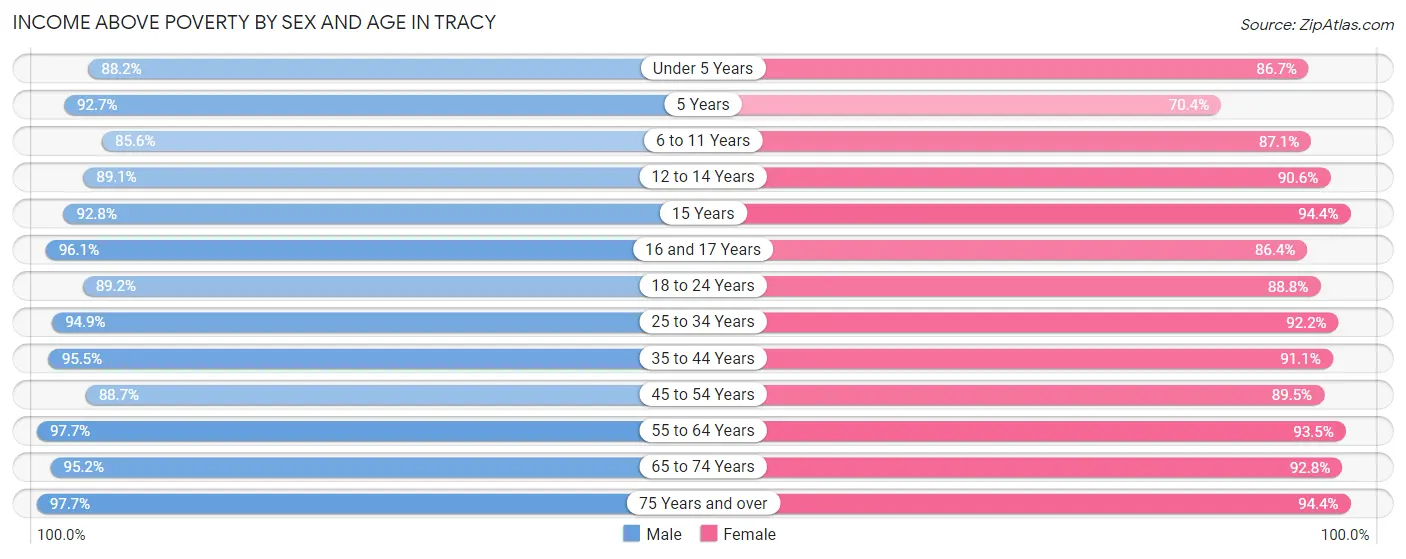
| Age Bracket | Male | Female |
| Under 5 Years | 2,729 (88.2%) | 2,537 (86.7%) |
| 5 Years | 441 (92.6%) | 468 (70.4%) |
| 6 to 11 Years | 4,200 (85.6%) | 2,977 (87.1%) |
| 12 to 14 Years | 2,742 (89.1%) | 1,871 (90.6%) |
| 15 Years | 462 (92.8%) | 838 (94.4%) |
| 16 and 17 Years | 1,320 (96.1%) | 938 (86.4%) |
| 18 to 24 Years | 4,480 (89.2%) | 3,851 (88.8%) |
| 25 to 34 Years | 5,865 (94.9%) | 6,459 (92.2%) |
| 35 to 44 Years | 6,421 (95.5%) | 6,283 (91.1%) |
| 45 to 54 Years | 5,805 (88.6%) | 6,045 (89.5%) |
| 55 to 64 Years | 5,176 (97.7%) | 4,771 (93.5%) |
| 65 to 74 Years | 2,442 (95.2%) | 2,867 (92.8%) |
| 75 Years and over | 1,454 (97.7%) | 1,687 (94.4%) |
| Total | 43,537 (92.1%) | 41,592 (90.4%) |
Income Below Poverty Among Married-Couple Families in Tracy
The poverty statistics for married-couple families in Tracy show that 3.1% or 511 of the total 16,495 families live below the poverty line. Families with 3 or 4 children have the highest poverty rate of 11.0%, comprising of 238 families. On the other hand, families with 5 or more children have the lowest poverty rate of 0.0%, which includes 0 families.
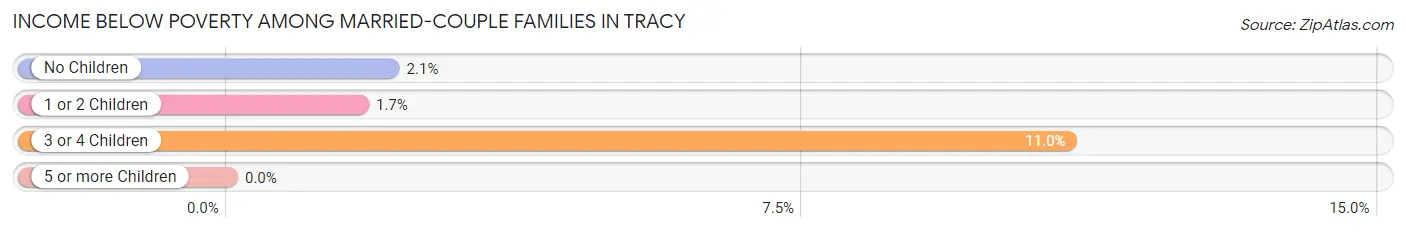
| Children | Above Poverty | Below Poverty |
| No Children | 7,280 (97.9%) | 157 (2.1%) |
| 1 or 2 Children | 6,678 (98.3%) | 116 (1.7%) |
| 3 or 4 Children | 1,933 (89.0%) | 238 (11.0%) |
| 5 or more Children | 93 (100.0%) | 0 (0.0%) |
| Total | 15,984 (96.9%) | 511 (3.1%) |
Income Below Poverty Among Single-Parent Households in Tracy
According to the poverty data in Tracy, 7.8% or 154 single-father households and 21.6% or 769 single-mother households are living below the poverty line. Among single-father households, those with 1 or 2 children have the highest poverty rate, with 79 households (13.1%) experiencing poverty. Likewise, among single-mother households, those with 3 or 4 children have the highest poverty rate, with 328 households (60.1%) falling below the poverty line.
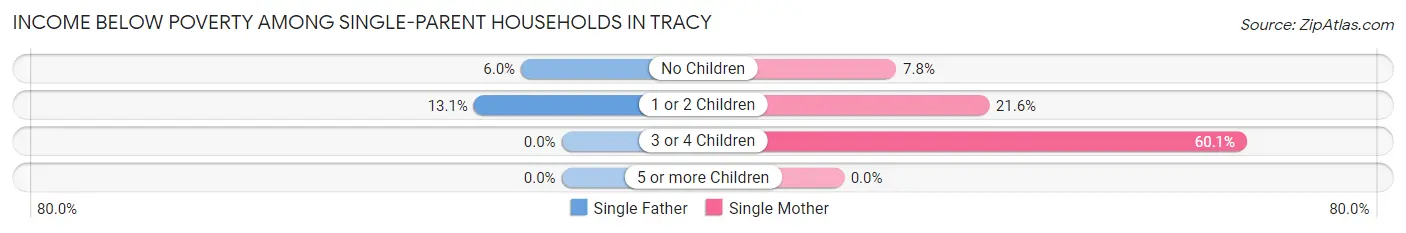
| Children | Single Father | Single Mother |
| No Children | 75 (6.0%) | 119 (7.8%) |
| 1 or 2 Children | 79 (13.1%) | 322 (21.6%) |
| 3 or 4 Children | 0 (0.0%) | 328 (60.1%) |
| 5 or more Children | 0 (0.0%) | 0 (0.0%) |
| Total | 154 (7.8%) | 769 (21.6%) |
Income Below Poverty Among Married-Couple vs Single-Parent Households in Tracy
The poverty data for Tracy shows that 511 of the married-couple family households (3.1%) and 923 of the single-parent households (16.7%) are living below the poverty level. Within the married-couple family households, those with 3 or 4 children have the highest poverty rate, with 238 households (11.0%) falling below the poverty line. Among the single-parent households, those with 3 or 4 children have the highest poverty rate, with 328 household (48.6%) living below poverty.
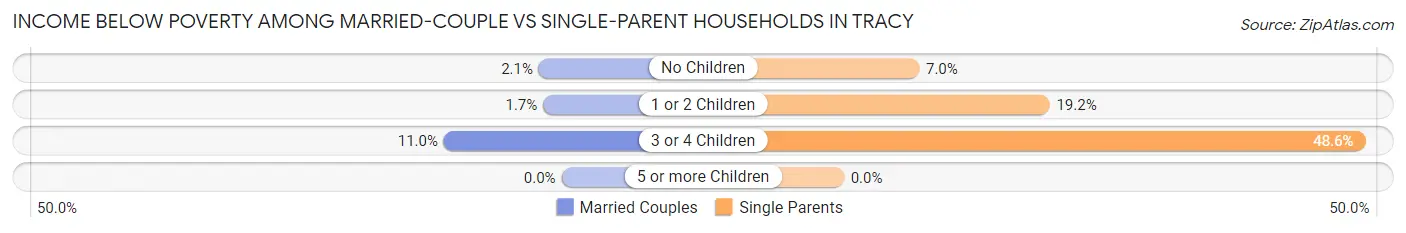
| Children | Married-Couple Families | Single-Parent Households |
| No Children | 157 (2.1%) | 194 (7.0%) |
| 1 or 2 Children | 116 (1.7%) | 401 (19.2%) |
| 3 or 4 Children | 238 (11.0%) | 328 (48.6%) |
| 5 or more Children | 0 (0.0%) | 0 (0.0%) |
| Total | 511 (3.1%) | 923 (16.7%) |
Race in Tracy
The most populous races in Tracy are White / Caucasian (38,778 | 41.2%), Hispanic or Latino (38,531 | 41.0%), and Asian (18,924 | 20.1%).
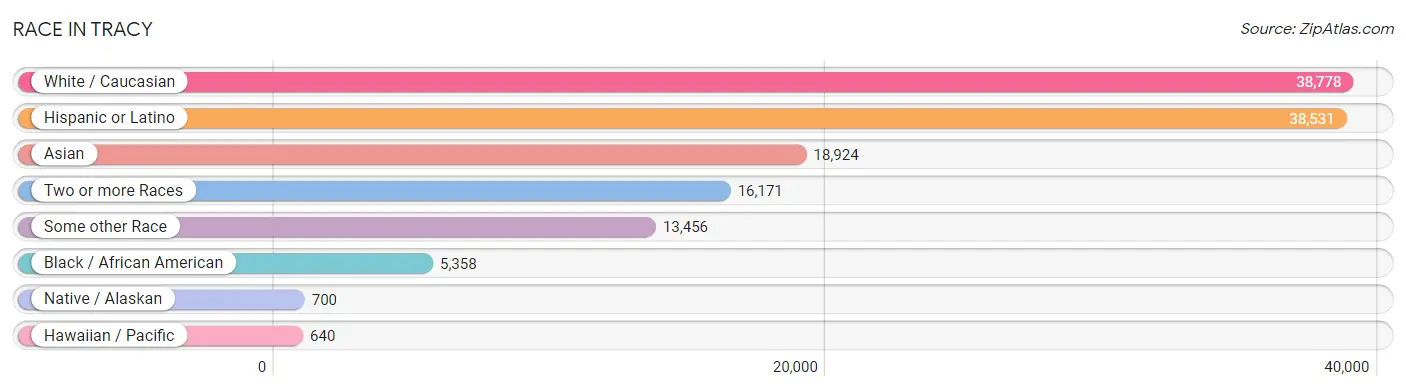
| Race | # Population | % Population |
| Asian | 18,924 | 20.1% |
| Black / African American | 5,358 | 5.7% |
| Hawaiian / Pacific | 640 | 0.7% |
| Hispanic or Latino | 38,531 | 41.0% |
| Native / Alaskan | 700 | 0.7% |
| White / Caucasian | 38,778 | 41.2% |
| Two or more Races | 16,171 | 17.2% |
| Some other Race | 13,456 | 14.3% |
| Total | 94,027 | 100.0% |
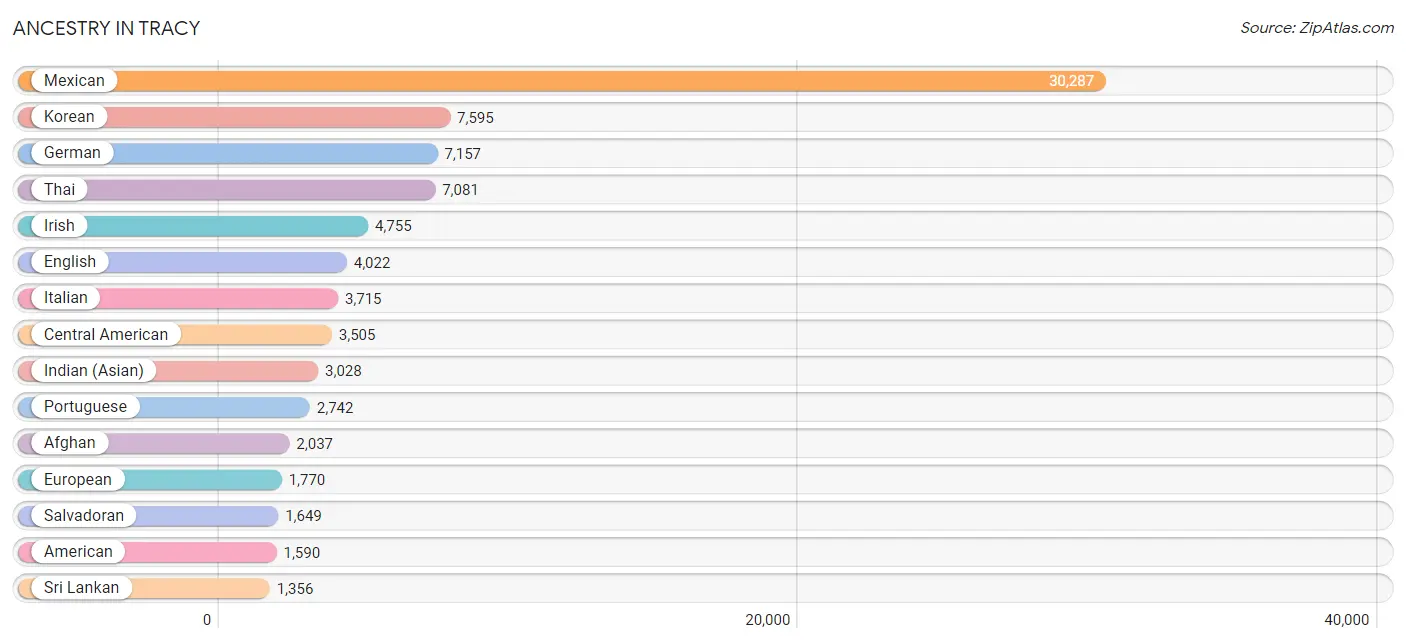
Ancestry in Tracy
The most populous ancestries reported in Tracy are Mexican (30,287 | 32.2%), Korean (7,595 | 8.1%), German (7,157 | 7.6%), Thai (7,081 | 7.5%), and Irish (4,755 | 5.1%), together accounting for 60.5% of all Tracy residents.
| Ancestry | # Population | % Population |
| Afghan | 2,037 | 2.2% |
| African | 288 | 0.3% |
| Alaskan Athabascan | 65 | 0.1% |
| American | 1,590 | 1.7% |
| Apache | 59 | 0.1% |
| Arab | 520 | 0.5% |
| Argentinean | 80 | 0.1% |
| Armenian | 39 | 0.0% |
| Australian | 178 | 0.2% |
| Austrian | 119 | 0.1% |
| Basque | 49 | 0.1% |
| Belgian | 17 | 0.0% |
| Bhutanese | 1,045 | 1.1% |
| Blackfeet | 139 | 0.2% |
| Brazilian | 79 | 0.1% |
| British | 474 | 0.5% |
| Burmese | 286 | 0.3% |
| Canadian | 118 | 0.1% |
| Central American | 3,505 | 3.7% |
| Central American Indian | 69 | 0.1% |
| Cherokee | 1,066 | 1.1% |
| Chickasaw | 26 | 0.0% |
| Chilean | 135 | 0.1% |
| Choctaw | 74 | 0.1% |
| Colombian | 264 | 0.3% |
| Comanche | 83 | 0.1% |
| Costa Rican | 10 | 0.0% |
| Croatian | 56 | 0.1% |
| Cuban | 772 | 0.8% |
| Czech | 97 | 0.1% |
| Czechoslovakian | 103 | 0.1% |
| Danish | 452 | 0.5% |
| Dominican | 12 | 0.0% |
| Dutch | 371 | 0.4% |
| Eastern European | 77 | 0.1% |
| Ecuadorian | 17 | 0.0% |
| Egyptian | 188 | 0.2% |
| English | 4,022 | 4.3% |
| Ethiopian | 33 | 0.0% |
| European | 1,770 | 1.9% |
| Filipino | 11 | 0.0% |
| Finnish | 173 | 0.2% |
| French | 1,243 | 1.3% |
| French Canadian | 360 | 0.4% |
| German | 7,157 | 7.6% |
| Ghanaian | 12 | 0.0% |
| Greek | 210 | 0.2% |
| Guamanian / Chamorro | 292 | 0.3% |
| Guatemalan | 466 | 0.5% |
| Guyanese | 9 | 0.0% |
| Haitian | 22 | 0.0% |
| Honduran | 243 | 0.3% |
| Hungarian | 79 | 0.1% |
| Indian (Asian) | 3,028 | 3.2% |
| Inupiat | 24 | 0.0% |
| Iranian | 142 | 0.2% |
| Iraqi | 121 | 0.1% |
| Irish | 4,755 | 5.1% |
| Iroquois | 11 | 0.0% |
| Italian | 3,715 | 4.0% |
| Japanese | 481 | 0.5% |
| Korean | 7,595 | 8.1% |
| Laotian | 141 | 0.2% |
| Lebanese | 31 | 0.0% |
| Malaysian | 196 | 0.2% |
| Mexican | 30,287 | 32.2% |
| Mexican American Indian | 294 | 0.3% |
| Moroccan | 6 | 0.0% |
| Native Hawaiian | 1,187 | 1.3% |
| Navajo | 82 | 0.1% |
| Nicaraguan | 1,122 | 1.2% |
| Nigerian | 371 | 0.4% |
| Northern European | 39 | 0.0% |
| Norwegian | 549 | 0.6% |
| Paiute | 64 | 0.1% |
| Pakistani | 236 | 0.3% |
| Palestinian | 78 | 0.1% |
| Panamanian | 15 | 0.0% |
| Pennsylvania German | 18 | 0.0% |
| Peruvian | 289 | 0.3% |
| Polish | 633 | 0.7% |
| Portuguese | 2,742 | 2.9% |
| Puerto Rican | 875 | 0.9% |
| Romanian | 17 | 0.0% |
| Russian | 272 | 0.3% |
| Salvadoran | 1,649 | 1.8% |
| Samoan | 72 | 0.1% |
| Scandinavian | 141 | 0.2% |
| Scotch-Irish | 313 | 0.3% |
| Scottish | 900 | 1.0% |
| Seminole | 93 | 0.1% |
| Sierra Leonean | 31 | 0.0% |
| Sioux | 28 | 0.0% |
| Slavic | 9 | 0.0% |
| Slovak | 63 | 0.1% |
| Slovene | 20 | 0.0% |
| South American | 962 | 1.0% |
| South American Indian | 5 | 0.0% |
| Spaniard | 489 | 0.5% |
| Spanish | 729 | 0.8% |
| Spanish American | 11 | 0.0% |
| Sri Lankan | 1,356 | 1.4% |
| Subsaharan African | 735 | 0.8% |
| Swedish | 588 | 0.6% |
| Swiss | 124 | 0.1% |
| Syrian | 12 | 0.0% |
| Thai | 7,081 | 7.5% |
| Tlingit-Haida | 4 | 0.0% |
| Tohono O'Odham | 15 | 0.0% |
| Trinidadian and Tobagonian | 90 | 0.1% |
| Ukrainian | 24 | 0.0% |
| Venezuelan | 177 | 0.2% |
| Vietnamese | 16 | 0.0% |
| Welsh | 304 | 0.3% |
| West Indian | 23 | 0.0% |
| Yaqui | 8 | 0.0% |
| Yugoslavian | 44 | 0.1% | View All 117 Rows |
Immigrants in Tracy
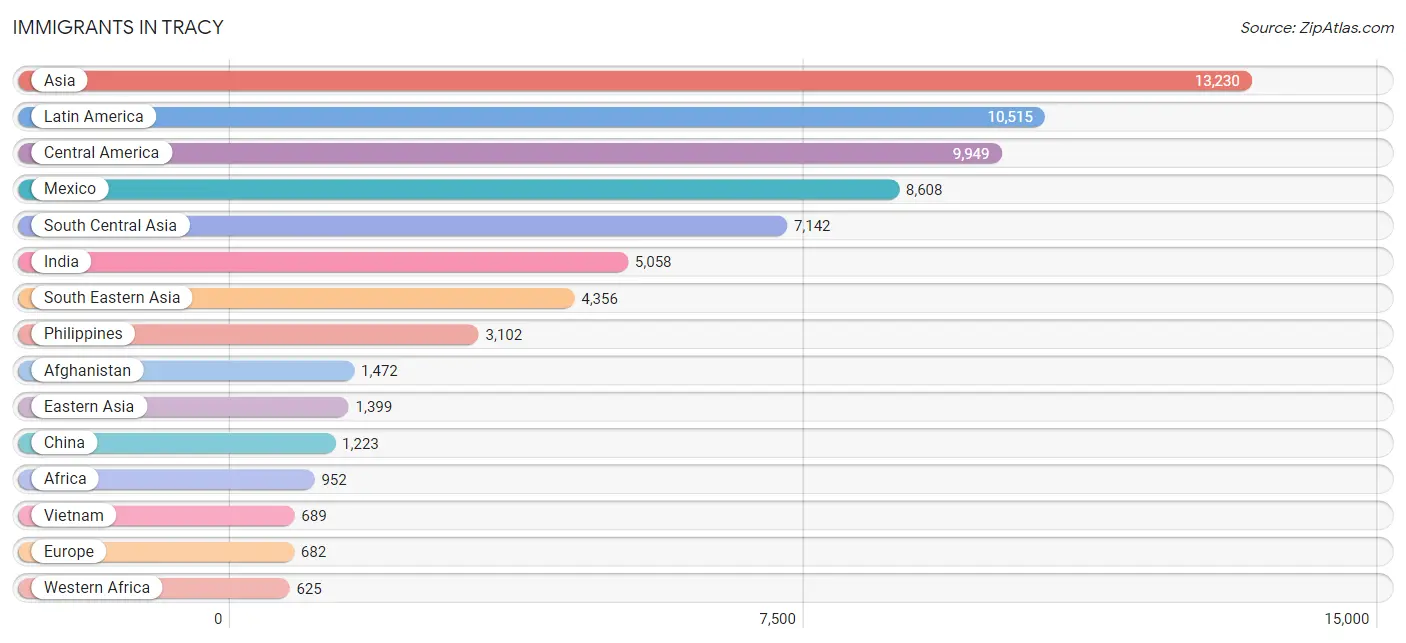
The most numerous immigrant groups reported in Tracy came from Asia (13,230 | 14.1%), Latin America (10,515 | 11.2%), Central America (9,949 | 10.6%), Mexico (8,608 | 9.1%), and South Central Asia (7,142 | 7.6%), together accounting for 52.6% of all Tracy residents.
| Immigration Origin | # Population | % Population |
| Afghanistan | 1,472 | 1.6% |
| Africa | 952 | 1.0% |
| Argentina | 43 | 0.1% |
| Asia | 13,230 | 14.1% |
| Australia | 190 | 0.2% |
| Austria | 10 | 0.0% |
| Azores | 97 | 0.1% |
| Bangladesh | 16 | 0.0% |
| Barbados | 15 | 0.0% |
| Belgium | 9 | 0.0% |
| Bosnia and Herzegovina | 8 | 0.0% |
| Brazil | 79 | 0.1% |
| Cambodia | 230 | 0.2% |
| Canada | 226 | 0.2% |
| Caribbean | 172 | 0.2% |
| Central America | 9,949 | 10.6% |
| China | 1,223 | 1.3% |
| Colombia | 93 | 0.1% |
| Costa Rica | 233 | 0.3% |
| Cuba | 100 | 0.1% |
| Czechoslovakia | 25 | 0.0% |
| Eastern Africa | 19 | 0.0% |
| Eastern Asia | 1,399 | 1.5% |
| Eastern Europe | 168 | 0.2% |
| Ecuador | 17 | 0.0% |
| Egypt | 132 | 0.1% |
| El Salvador | 478 | 0.5% |
| England | 67 | 0.1% |
| Eritrea | 19 | 0.0% |
| Europe | 682 | 0.7% |
| Fiji | 285 | 0.3% |
| France | 13 | 0.0% |
| Germany | 45 | 0.1% |
| Ghana | 257 | 0.3% |
| Greece | 29 | 0.0% |
| Guatemala | 190 | 0.2% |
| Honduras | 162 | 0.2% |
| Hong Kong | 158 | 0.2% |
| India | 5,058 | 5.4% |
| Indonesia | 64 | 0.1% |
| Iran | 123 | 0.1% |
| Iraq | 136 | 0.1% |
| Ireland | 9 | 0.0% |
| Italy | 21 | 0.0% |
| Japan | 62 | 0.1% |
| Korea | 114 | 0.1% |
| Kuwait | 71 | 0.1% |
| Laos | 87 | 0.1% |
| Latin America | 10,515 | 11.2% |
| Malaysia | 48 | 0.1% |
| Mexico | 8,608 | 9.1% |
| Middle Africa | 73 | 0.1% |
| Morocco | 22 | 0.0% |
| Netherlands | 60 | 0.1% |
| Nicaragua | 251 | 0.3% |
| Nigeria | 255 | 0.3% |
| Northern Africa | 219 | 0.2% |
| Northern Europe | 86 | 0.1% |
| Oceania | 538 | 0.6% |
| Pakistan | 473 | 0.5% |
| Panama | 15 | 0.0% |
| Peru | 149 | 0.2% |
| Philippines | 3,102 | 3.3% |
| Poland | 70 | 0.1% |
| Portugal | 227 | 0.2% |
| Romania | 24 | 0.0% |
| Russia | 41 | 0.0% |
| Sierra Leone | 113 | 0.1% |
| Singapore | 30 | 0.0% |
| South Africa | 16 | 0.0% |
| South America | 394 | 0.4% |
| South Central Asia | 7,142 | 7.6% |
| South Eastern Asia | 4,356 | 4.6% |
| Southern Europe | 291 | 0.3% |
| Spain | 14 | 0.0% |
| Sudan | 65 | 0.1% |
| Taiwan | 31 | 0.0% |
| Thailand | 58 | 0.1% |
| Trinidad and Tobago | 57 | 0.1% |
| Vietnam | 689 | 0.7% |
| Western Africa | 625 | 0.7% |
| Western Asia | 276 | 0.3% |
| Western Europe | 137 | 0.2% |
| Yemen | 32 | 0.0% | View All 84 Rows |
Sex and Age in Tracy
Sex and Age in Tracy
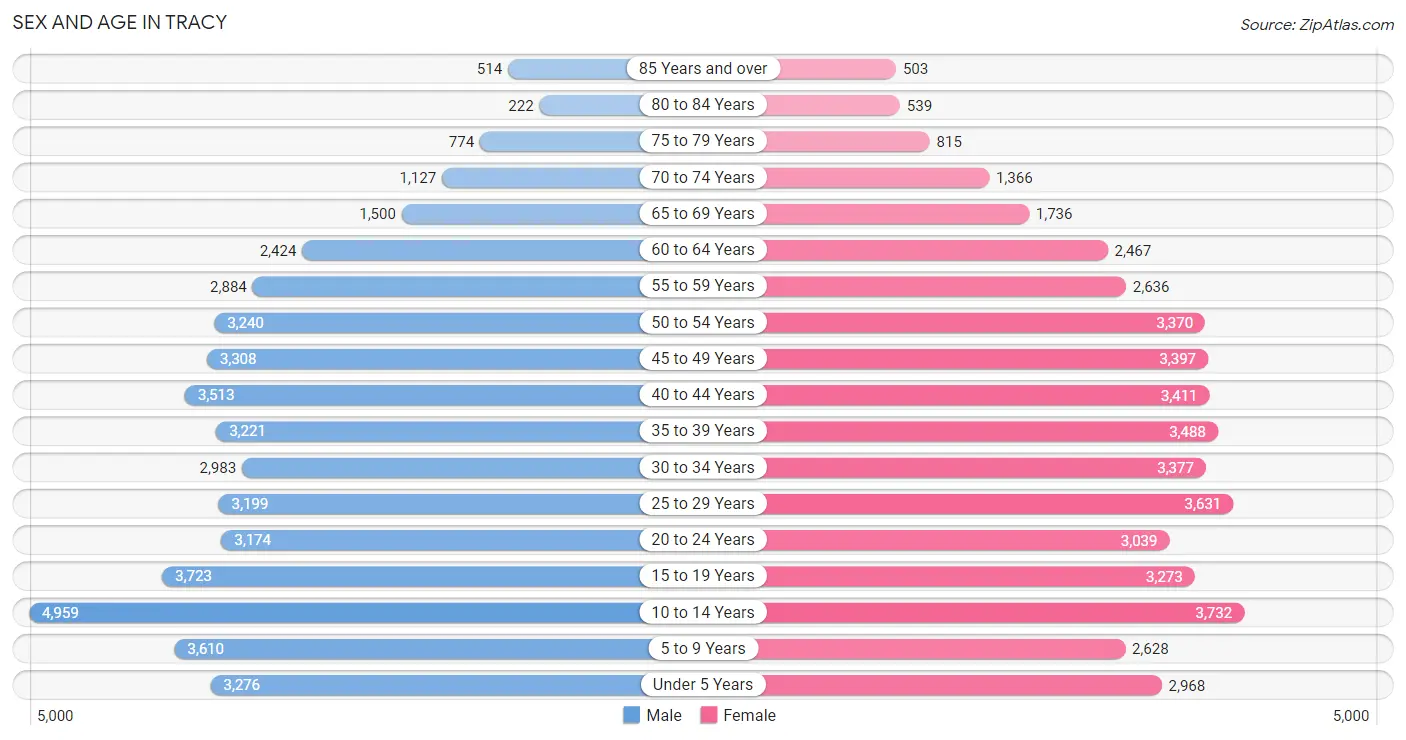
The most populous age groups in Tracy are 10 to 14 Years (4,959 | 10.4%) for men and 10 to 14 Years (3,732 | 8.1%) for women.
| Age Bracket | Male | Female |
| Under 5 Years | 3,276 (6.9%) | 2,968 (6.4%) |
| 5 to 9 Years | 3,610 (7.6%) | 2,628 (5.7%) |
| 10 to 14 Years | 4,959 (10.4%) | 3,732 (8.1%) |
| 15 to 19 Years | 3,723 (7.8%) | 3,273 (7.1%) |
| 20 to 24 Years | 3,174 (6.7%) | 3,039 (6.6%) |
| 25 to 29 Years | 3,199 (6.7%) | 3,631 (7.8%) |
| 30 to 34 Years | 2,983 (6.3%) | 3,377 (7.3%) |
| 35 to 39 Years | 3,221 (6.8%) | 3,488 (7.5%) |
| 40 to 44 Years | 3,513 (7.4%) | 3,411 (7.4%) |
| 45 to 49 Years | 3,308 (6.9%) | 3,397 (7.3%) |
| 50 to 54 Years | 3,240 (6.8%) | 3,370 (7.3%) |
| 55 to 59 Years | 2,884 (6.0%) | 2,636 (5.7%) |
| 60 to 64 Years | 2,424 (5.1%) | 2,467 (5.3%) |
| 65 to 69 Years | 1,500 (3.2%) | 1,736 (3.7%) |
| 70 to 74 Years | 1,127 (2.4%) | 1,366 (2.9%) |
| 75 to 79 Years | 774 (1.6%) | 815 (1.8%) |
| 80 to 84 Years | 222 (0.5%) | 539 (1.2%) |
| 85 Years and over | 514 (1.1%) | 503 (1.1%) |
| Total | 47,651 (100.0%) | 46,376 (100.0%) |
Families and Households in Tracy
Median Family Size in Tracy
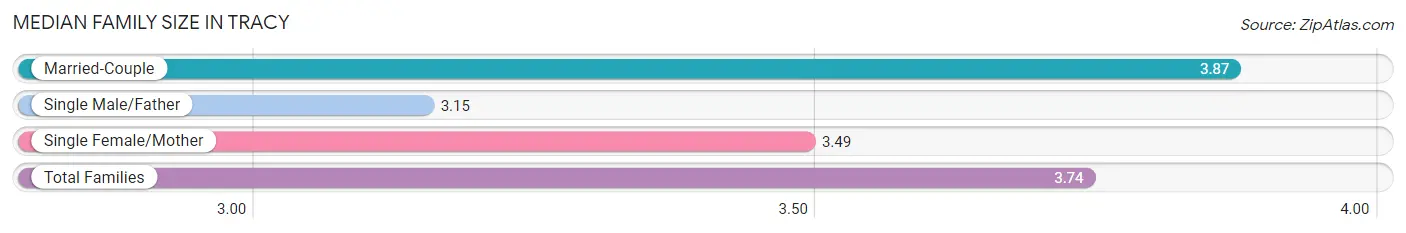
The median family size in Tracy is 3.74 persons per family, with married-couple families (16,495 | 74.9%) accounting for the largest median family size of 3.87 persons per family. On the other hand, single male/father families (1,982 | 9.0%) represent the smallest median family size with 3.15 persons per family.
| Family Type | # Families | Family Size |
| Married-Couple | 16,495 (74.9%) | 3.87 |
| Single Male/Father | 1,982 (9.0%) | 3.15 |
| Single Female/Mother | 3,555 (16.1%) | 3.49 |
| Total Families | 22,032 (100.0%) | 3.74 |
Median Household Size in Tracy
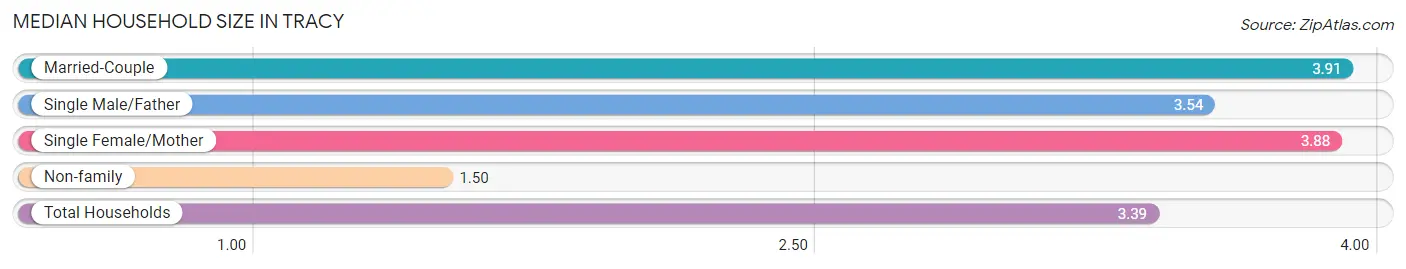
The median household size in Tracy is 3.39 persons per household, with married-couple households (16,495 | 59.7%) accounting for the largest median household size of 3.91 persons per household. non-family households (5,613 | 20.3%) represent the smallest median household size with 1.50 persons per household.
| Household Type | # Households | Household Size |
| Married-Couple | 16,495 (59.7%) | 3.91 |
| Single Male/Father | 1,982 (7.2%) | 3.54 |
| Single Female/Mother | 3,555 (12.9%) | 3.88 |
| Non-family | 5,613 (20.3%) | 1.50 |
| Total Households | 27,645 (100.0%) | 3.39 |
Household Size by Marriage Status in Tracy
Out of a total of 27,645 households in Tracy, 22,032 (79.7%) are family households, while 5,613 (20.3%) are nonfamily households. The most numerous type of family households are 2-person households, comprising 6,001, and the most common type of nonfamily households are 1-person households, comprising 4,153.
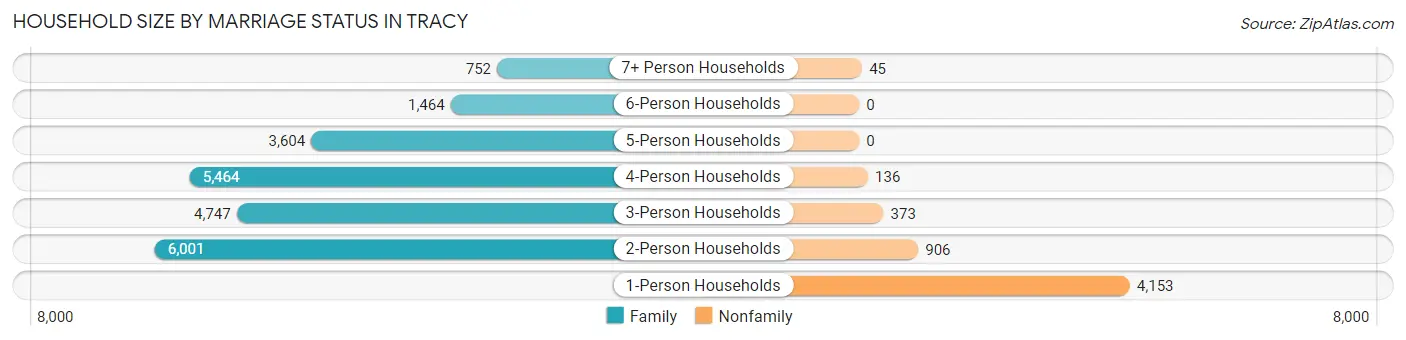
| Household Size | Family Households | Nonfamily Households |
| 1-Person Households | - | 4,153 (15.0%) |
| 2-Person Households | 6,001 (21.7%) | 906 (3.3%) |
| 3-Person Households | 4,747 (17.2%) | 373 (1.3%) |
| 4-Person Households | 5,464 (19.8%) | 136 (0.5%) |
| 5-Person Households | 3,604 (13.0%) | 0 (0.0%) |
| 6-Person Households | 1,464 (5.3%) | 0 (0.0%) |
| 7+ Person Households | 752 (2.7%) | 45 (0.2%) |
| Total | 22,032 (79.7%) | 5,613 (20.3%) |
Female Fertility in Tracy
Fertility by Age in Tracy
Average fertility rate in Tracy is 48.0 births per 1,000 women. Women in the age bracket of 20 to 34 years have the highest fertility rate with 89.0 births per 1,000 women. Women in the age bracket of 20 to 34 years acount for 77.0% of all women with births.
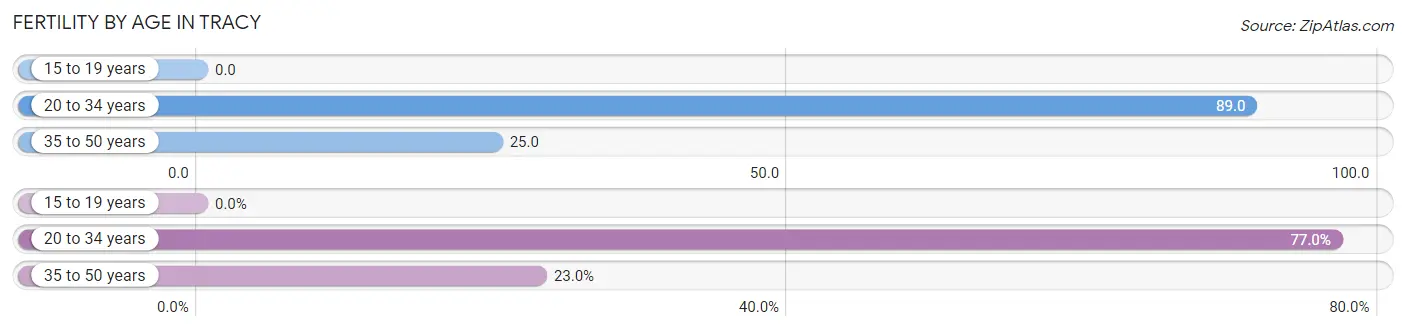
| Age Bracket | Women with Births | Births / 1,000 Women |
| 15 to 19 years | 0 (0.0%) | 0.0 |
| 20 to 34 years | 897 (77.0%) | 89.0 |
| 35 to 50 years | 268 (23.0%) | 25.0 |
| Total | 1,165 (100.0%) | 48.0 |
Fertility by Age by Marriage Status in Tracy
84.5% of women with births (1,165) in Tracy are married. The highest percentage of unmarried women with births falls into 20 to 34 years age bracket with 19.4% of them unmarried at the time of birth, while the lowest percentage of unmarried women with births belong to 35 to 50 years age bracket with 2.2% of them unmarried.
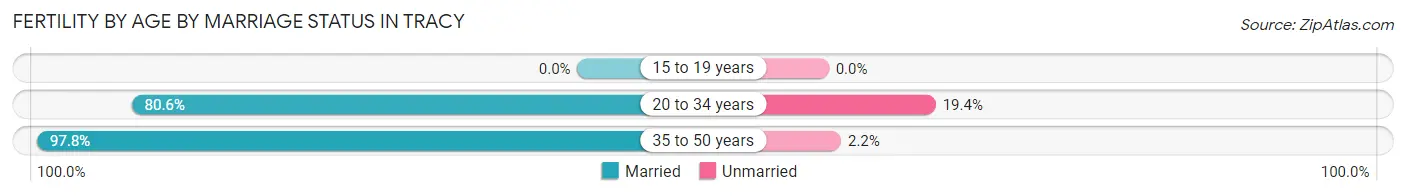
| Age Bracket | Married | Unmarried |
| 15 to 19 years | 0 (0.0%) | 0 (0.0%) |
| 20 to 34 years | 723 (80.6%) | 174 (19.4%) |
| 35 to 50 years | 262 (97.8%) | 6 (2.2%) |
| Total | 984 (84.5%) | 181 (15.5%) |
Fertility by Education in Tracy
Average fertility rate in Tracy is 48.0 births per 1,000 women. Women with the education attainment of graduate degree have the highest fertility rate of 107.0 births per 1,000 women, while women with the education attainment of less than high school have the lowest fertility at 21.0 births per 1,000 women. Women with the education attainment of college or associate's degree represent 34.1% of all women with births.
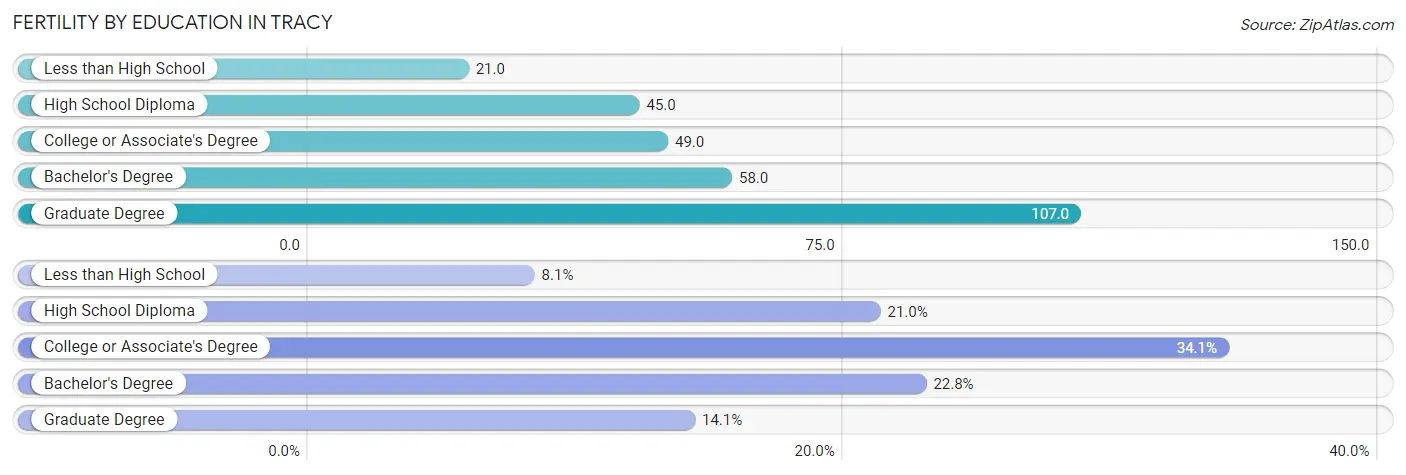
| Educational Attainment | Women with Births | Births / 1,000 Women |
| Less than High School | 94 (8.1%) | 21.0 |
| High School Diploma | 245 (21.0%) | 45.0 |
| College or Associate's Degree | 397 (34.1%) | 49.0 |
| Bachelor's Degree | 265 (22.8%) | 58.0 |
| Graduate Degree | 164 (14.1%) | 107.0 |
| Total | 1,165 (100.0%) | 48.0 |
Fertility by Education by Marriage Status in Tracy
15.5% of women with births in Tracy are unmarried. Women with the educational attainment of bachelor's degree are most likely to be married with 100.0% of them married at childbirth, while women with the educational attainment of less than high school are least likely to be married with 27.7% of them unmarried at childbirth.
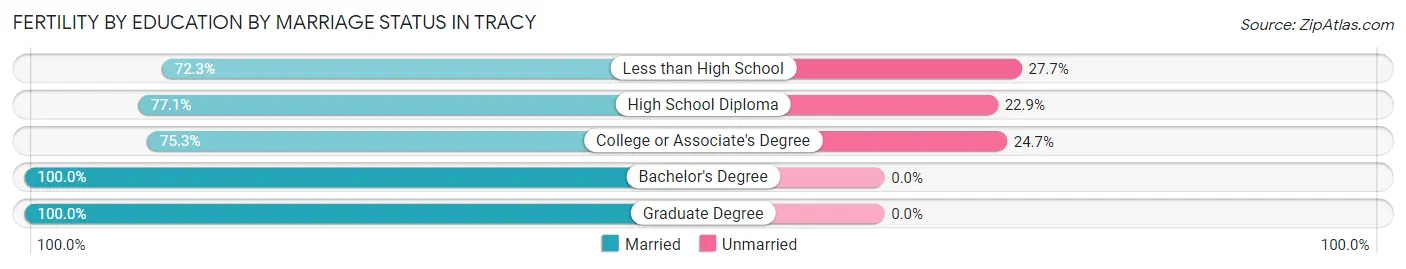
| Educational Attainment | Married | Unmarried |
| Less than High School | 68 (72.3%) | 26 (27.7%) |
| High School Diploma | 189 (77.1%) | 56 (22.9%) |
| College or Associate's Degree | 299 (75.3%) | 98 (24.7%) |
| Bachelor's Degree | 265 (100.0%) | 0 (0.0%) |
| Graduate Degree | 164 (100.0%) | 0 (0.0%) |
| Total | 984 (84.5%) | 181 (15.5%) |
Employment Characteristics in Tracy
Employment by Class of Employer in Tracy
Among the 43,993 employed individuals in Tracy, private company employees (31,823 | 72.3%), not-for-profit organizations (3,044 | 6.9%), and local government employees (3,021 | 6.9%) make up the most common classes of employment.
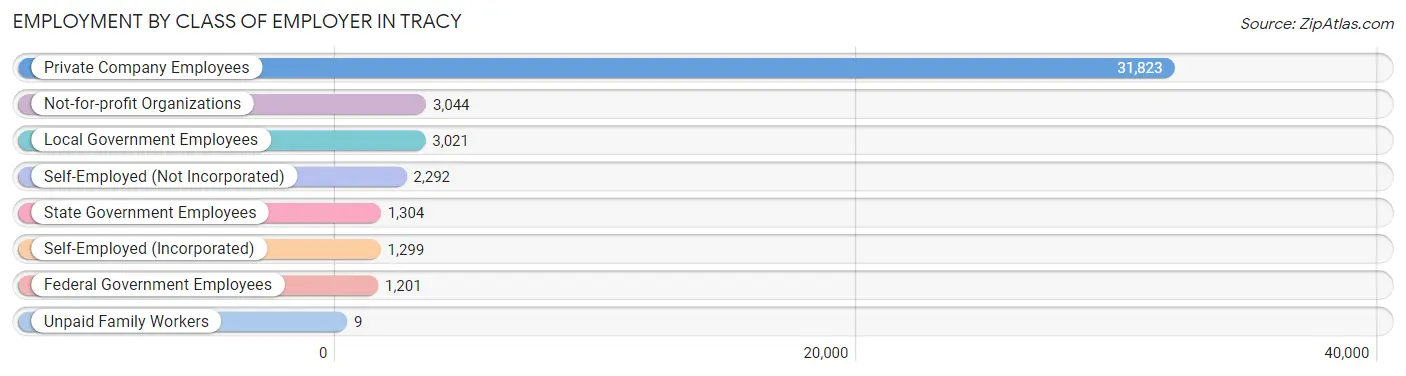
| Employer Class | # Employees | % Employees |
| Private Company Employees | 31,823 | 72.3% |
| Self-Employed (Incorporated) | 1,299 | 2.9% |
| Self-Employed (Not Incorporated) | 2,292 | 5.2% |
| Not-for-profit Organizations | 3,044 | 6.9% |
| Local Government Employees | 3,021 | 6.9% |
| State Government Employees | 1,304 | 3.0% |
| Federal Government Employees | 1,201 | 2.7% |
| Unpaid Family Workers | 9 | 0.0% |
| Total | 43,993 | 100.0% |
Employment Status by Age in Tracy
According to the labor force statistics for Tracy, out of the total population over 16 years of age (71,468), 68.3% or 48,813 individuals are in the labor force, with 5.4% or 2,636 of them unemployed. The age group with the highest labor force participation rate is 25 to 29 years, with 83.7% or 5,717 individuals in the labor force. Within the labor force, the 16 to 19 years age range has the highest percentage of unemployed individuals, with 16.7% or 306 of them being unemployed.
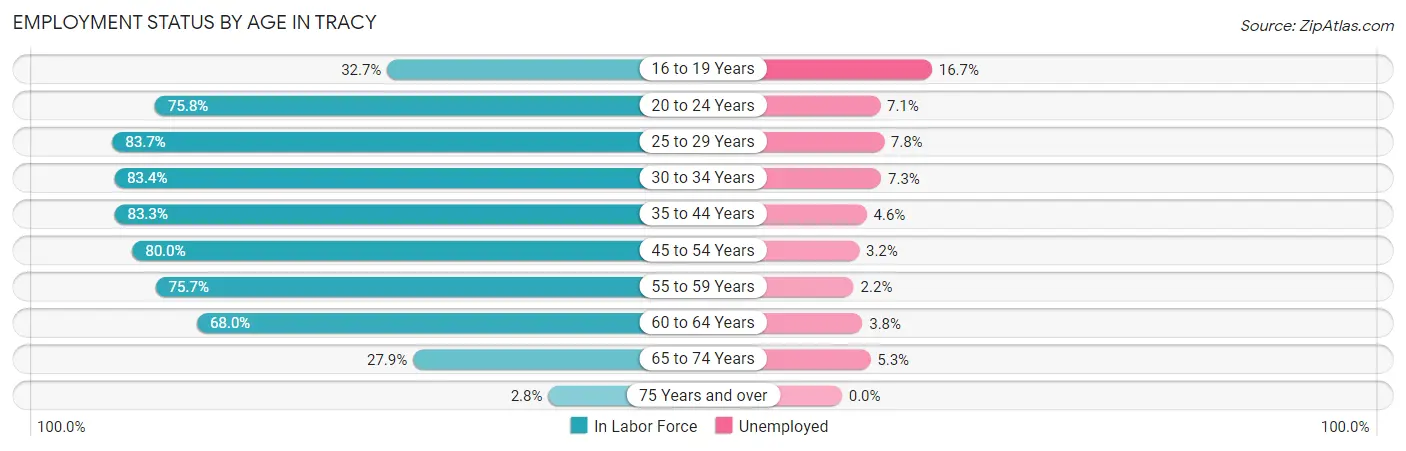
| Age Bracket | In Labor Force | Unemployed |
| 16 to 19 Years | 1,834 (32.7%) | 306 (16.7%) |
| 20 to 24 Years | 4,709 (75.8%) | 334 (7.1%) |
| 25 to 29 Years | 5,717 (83.7%) | 446 (7.8%) |
| 30 to 34 Years | 5,304 (83.4%) | 387 (7.3%) |
| 35 to 44 Years | 11,356 (83.3%) | 522 (4.6%) |
| 45 to 54 Years | 10,652 (80.0%) | 341 (3.2%) |
| 55 to 59 Years | 4,179 (75.7%) | 92 (2.2%) |
| 60 to 64 Years | 3,326 (68.0%) | 126 (3.8%) |
| 65 to 74 Years | 1,598 (27.9%) | 85 (5.3%) |
| 75 Years and over | 94 (2.8%) | 0 (0.0%) |
| Total | 48,813 (68.3%) | 2,636 (5.4%) |
Employment Status by Educational Attainment in Tracy
According to labor force statistics for Tracy, 80.2% of individuals (40,540) out of the total population between 25 and 64 years of age (50,549) are in the labor force, with 4.7% or 1,905 of them being unemployed. The group with the highest labor force participation rate are those with the educational attainment of bachelor's degree or higher, with 87.4% or 11,058 individuals in the labor force. Within the labor force, individuals with high school diploma education have the highest percentage of unemployment, with 6.1% or 580 of them being unemployed.
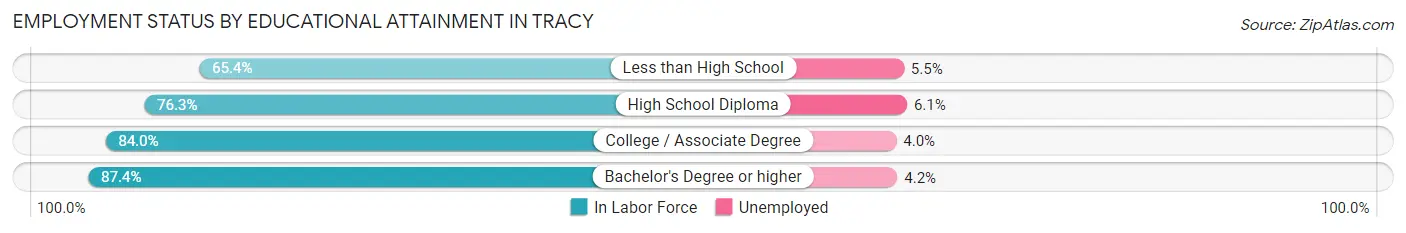
| Educational Attainment | In Labor Force | Unemployed |
| Less than High School | 4,834 (65.4%) | 407 (5.5%) |
| High School Diploma | 9,503 (76.3%) | 760 (6.1%) |
| College / Associate Degree | 15,162 (84.0%) | 722 (4.0%) |
| Bachelor's Degree or higher | 11,058 (87.4%) | 531 (4.2%) |
| Total | 40,540 (80.2%) | 2,376 (4.7%) |
Employment Occupations by Sex in Tracy
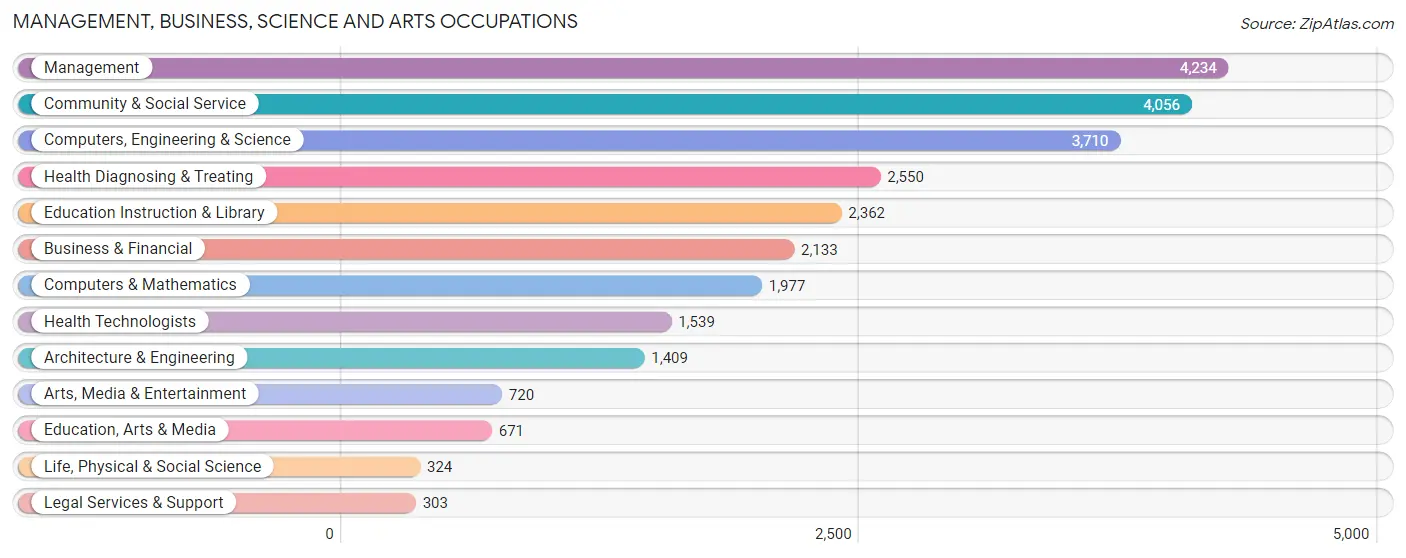
Management, Business, Science and Arts Occupations
The most common Management, Business, Science and Arts occupations in Tracy are Management (4,234 | 9.2%), Community & Social Service (4,056 | 8.8%), Computers, Engineering & Science (3,710 | 8.1%), Health Diagnosing & Treating (2,550 | 5.5%), and Education Instruction & Library (2,362 | 5.1%).
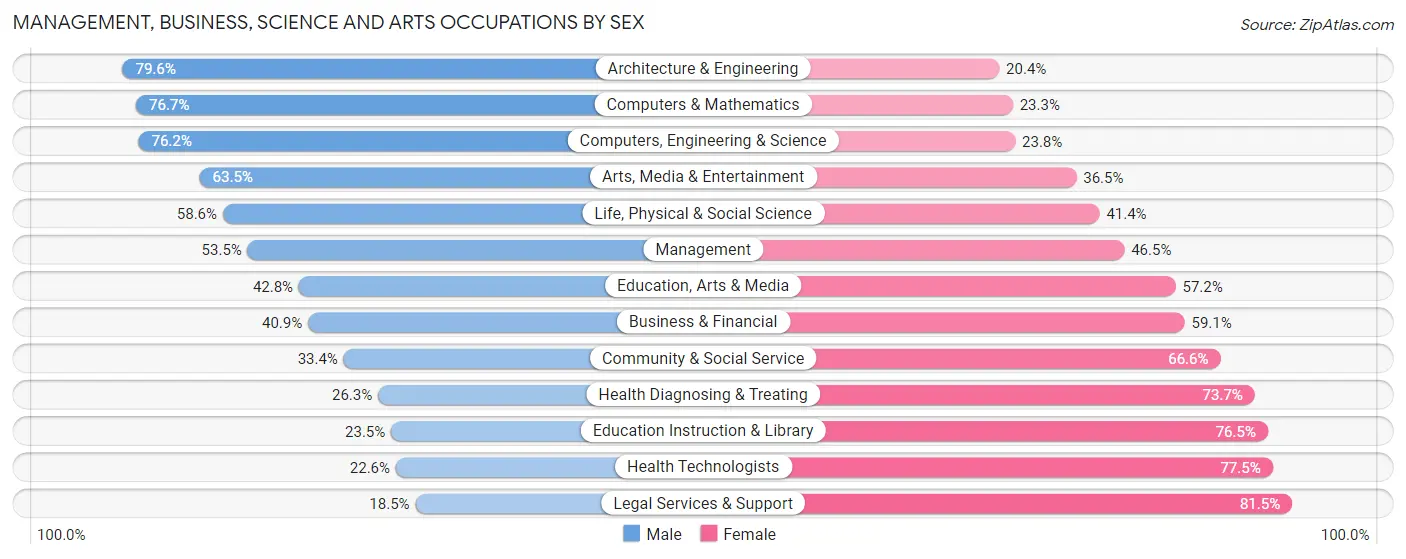
Management, Business, Science and Arts Occupations by Sex
Within the Management, Business, Science and Arts occupations in Tracy, the most male-oriented occupations are Architecture & Engineering (79.6%), Computers & Mathematics (76.7%), and Computers, Engineering & Science (76.2%), while the most female-oriented occupations are Legal Services & Support (81.5%), Health Technologists (77.4%), and Education Instruction & Library (76.5%).
| Occupation | Male | Female |
| Management | 2,264 (53.5%) | 1,970 (46.5%) |
| Business & Financial | 872 (40.9%) | 1,261 (59.1%) |
| Computers, Engineering & Science | 2,828 (76.2%) | 882 (23.8%) |
| Computers & Mathematics | 1,517 (76.7%) | 460 (23.3%) |
| Architecture & Engineering | 1,121 (79.6%) | 288 (20.4%) |
| Life, Physical & Social Science | 190 (58.6%) | 134 (41.4%) |
| Community & Social Service | 1,356 (33.4%) | 2,700 (66.6%) |
| Education, Arts & Media | 287 (42.8%) | 384 (57.2%) |
| Legal Services & Support | 56 (18.5%) | 247 (81.5%) |
| Education Instruction & Library | 556 (23.5%) | 1,806 (76.5%) |
| Arts, Media & Entertainment | 457 (63.5%) | 263 (36.5%) |
| Health Diagnosing & Treating | 670 (26.3%) | 1,880 (73.7%) |
| Health Technologists | 347 (22.6%) | 1,192 (77.4%) |
| Total (Category) | 7,990 (47.9%) | 8,693 (52.1%) |
| Total (Overall) | 25,441 (55.2%) | 20,646 (44.8%) |
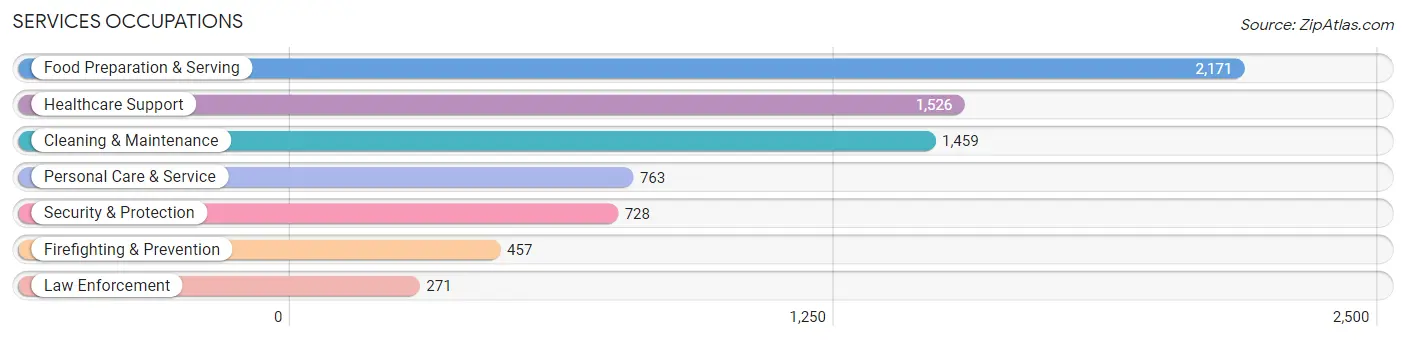
Services Occupations
The most common Services occupations in Tracy are Food Preparation & Serving (2,171 | 4.7%), Healthcare Support (1,526 | 3.3%), Cleaning & Maintenance (1,459 | 3.2%), Personal Care & Service (763 | 1.7%), and Security & Protection (728 | 1.6%).
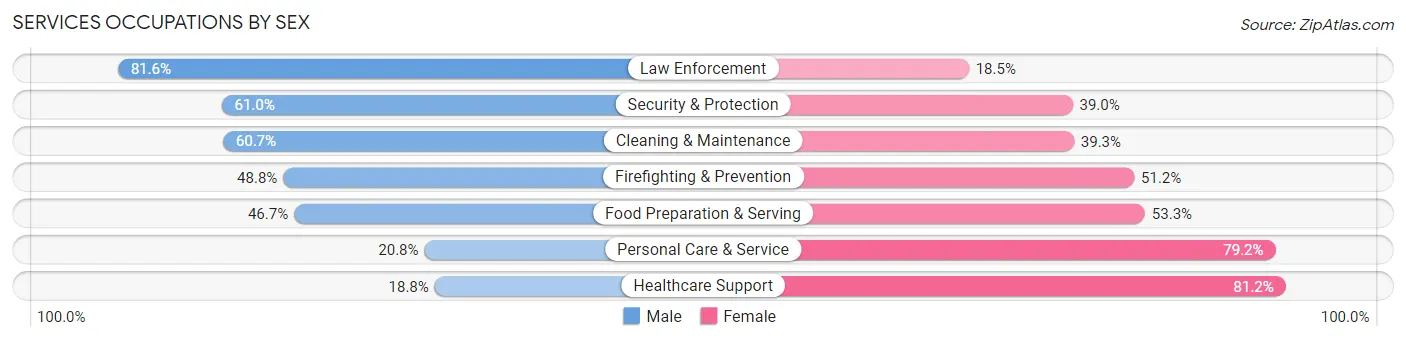
Services Occupations by Sex
Within the Services occupations in Tracy, the most male-oriented occupations are Law Enforcement (81.6%), Security & Protection (61.0%), and Cleaning & Maintenance (60.7%), while the most female-oriented occupations are Healthcare Support (81.2%), Personal Care & Service (79.2%), and Food Preparation & Serving (53.3%).
| Occupation | Male | Female |
| Healthcare Support | 287 (18.8%) | 1,239 (81.2%) |
| Security & Protection | 444 (61.0%) | 284 (39.0%) |
| Firefighting & Prevention | 223 (48.8%) | 234 (51.2%) |
| Law Enforcement | 221 (81.6%) | 50 (18.4%) |
| Food Preparation & Serving | 1,013 (46.7%) | 1,158 (53.3%) |
| Cleaning & Maintenance | 886 (60.7%) | 573 (39.3%) |
| Personal Care & Service | 159 (20.8%) | 604 (79.2%) |
| Total (Category) | 2,789 (42.0%) | 3,858 (58.0%) |
| Total (Overall) | 25,441 (55.2%) | 20,646 (44.8%) |
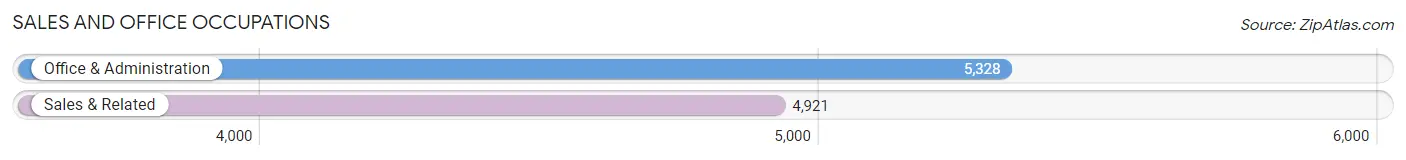
Sales and Office Occupations
The most common Sales and Office occupations in Tracy are Office & Administration (5,328 | 11.6%), and Sales & Related (4,921 | 10.7%).
Sales and Office Occupations by Sex
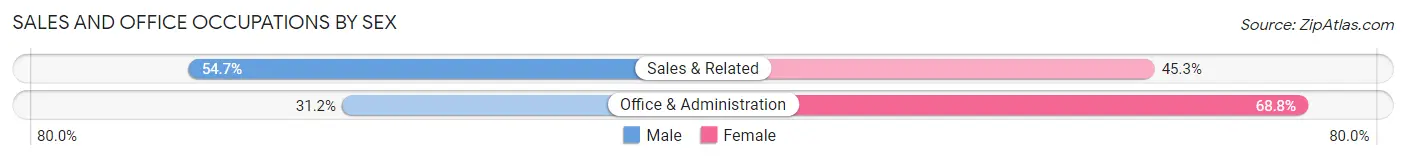
| Occupation | Male | Female |
| Sales & Related | 2,694 (54.7%) | 2,227 (45.3%) |
| Office & Administration | 1,662 (31.2%) | 3,666 (68.8%) |
| Total (Category) | 4,356 (42.5%) | 5,893 (57.5%) |
| Total (Overall) | 25,441 (55.2%) | 20,646 (44.8%) |
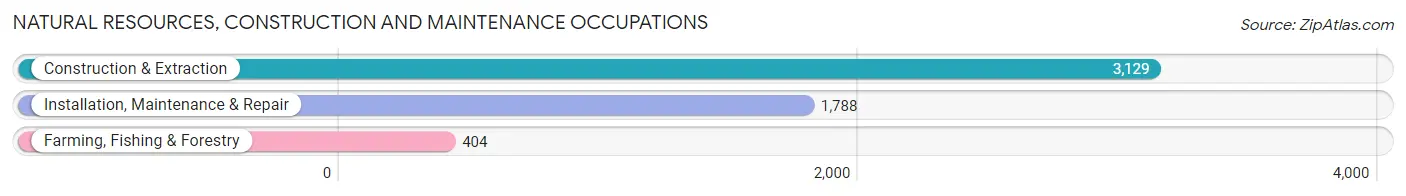
Natural Resources, Construction and Maintenance Occupations
The most common Natural Resources, Construction and Maintenance occupations in Tracy are Construction & Extraction (3,129 | 6.8%), Installation, Maintenance & Repair (1,788 | 3.9%), and Farming, Fishing & Forestry (404 | 0.9%).
Natural Resources, Construction and Maintenance Occupations by Sex
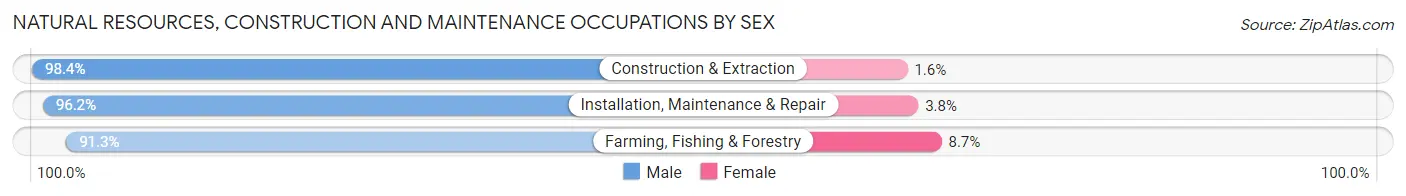
| Occupation | Male | Female |
| Farming, Fishing & Forestry | 369 (91.3%) | 35 (8.7%) |
| Construction & Extraction | 3,080 (98.4%) | 49 (1.6%) |
| Installation, Maintenance & Repair | 1,720 (96.2%) | 68 (3.8%) |
| Total (Category) | 5,169 (97.1%) | 152 (2.9%) |
| Total (Overall) | 25,441 (55.2%) | 20,646 (44.8%) |
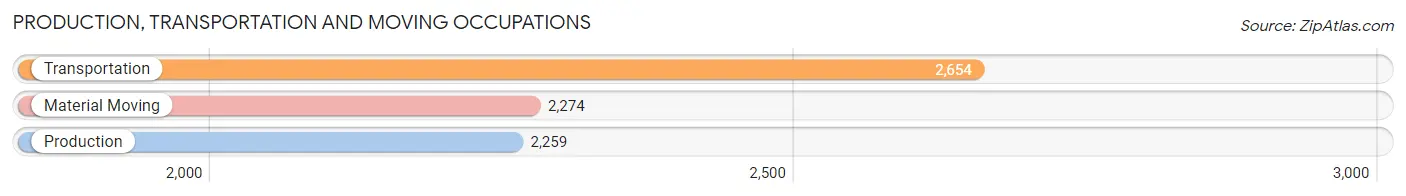
Production, Transportation and Moving Occupations
The most common Production, Transportation and Moving occupations in Tracy are Transportation (2,654 | 5.8%), Material Moving (2,274 | 4.9%), and Production (2,259 | 4.9%).
Production, Transportation and Moving Occupations by Sex
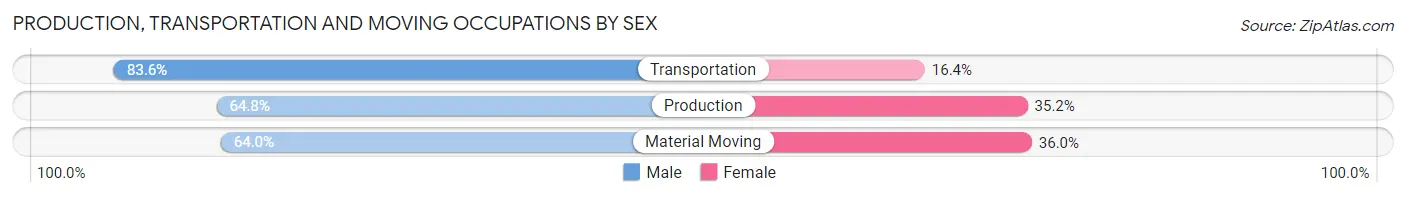
| Occupation | Male | Female |
| Production | 1,463 (64.8%) | 796 (35.2%) |
| Transportation | 2,219 (83.6%) | 435 (16.4%) |
| Material Moving | 1,455 (64.0%) | 819 (36.0%) |
| Total (Category) | 5,137 (71.5%) | 2,050 (28.5%) |
| Total (Overall) | 25,441 (55.2%) | 20,646 (44.8%) |
Employment Industries by Sex in Tracy
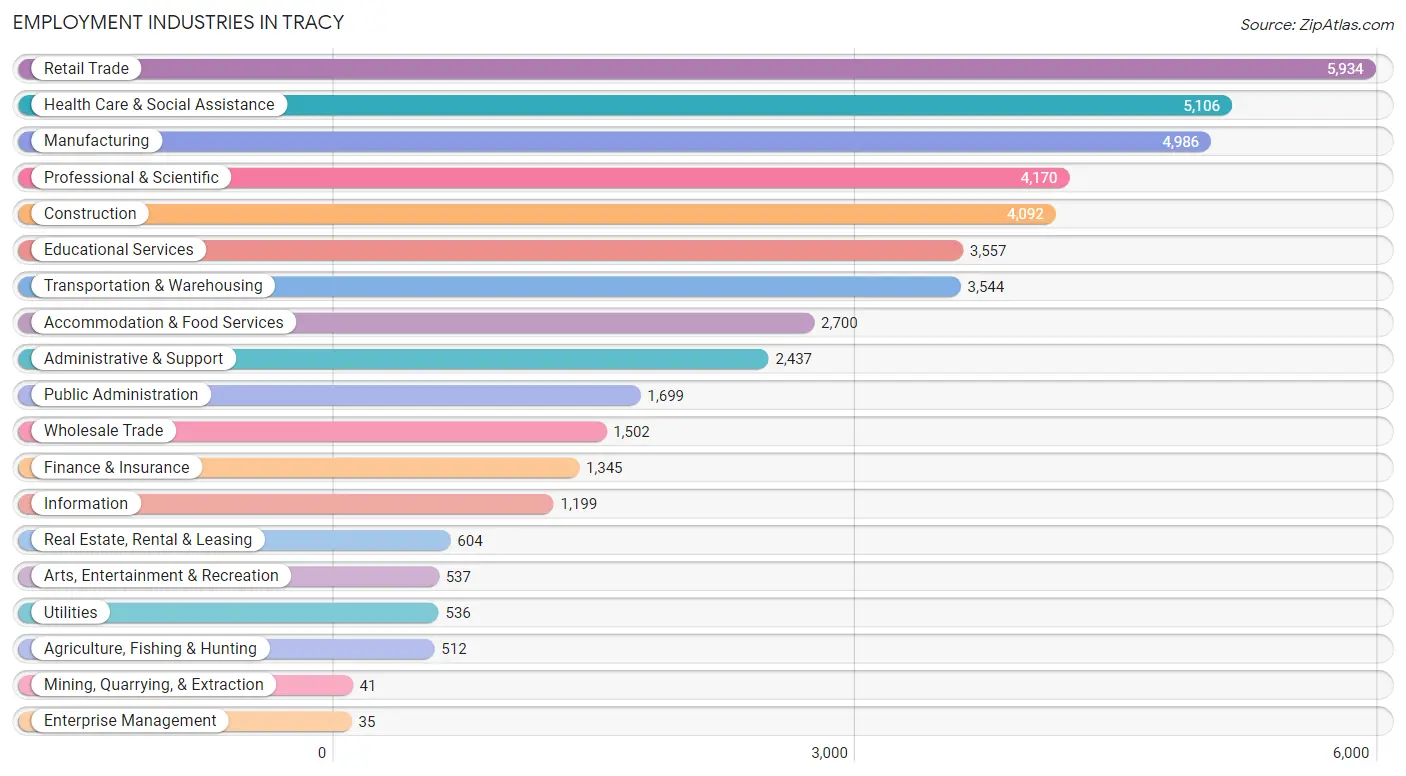
Employment Industries in Tracy
The major employment industries in Tracy include Retail Trade (5,934 | 12.9%), Health Care & Social Assistance (5,106 | 11.1%), Manufacturing (4,986 | 10.8%), Professional & Scientific (4,170 | 9.0%), and Construction (4,092 | 8.9%).
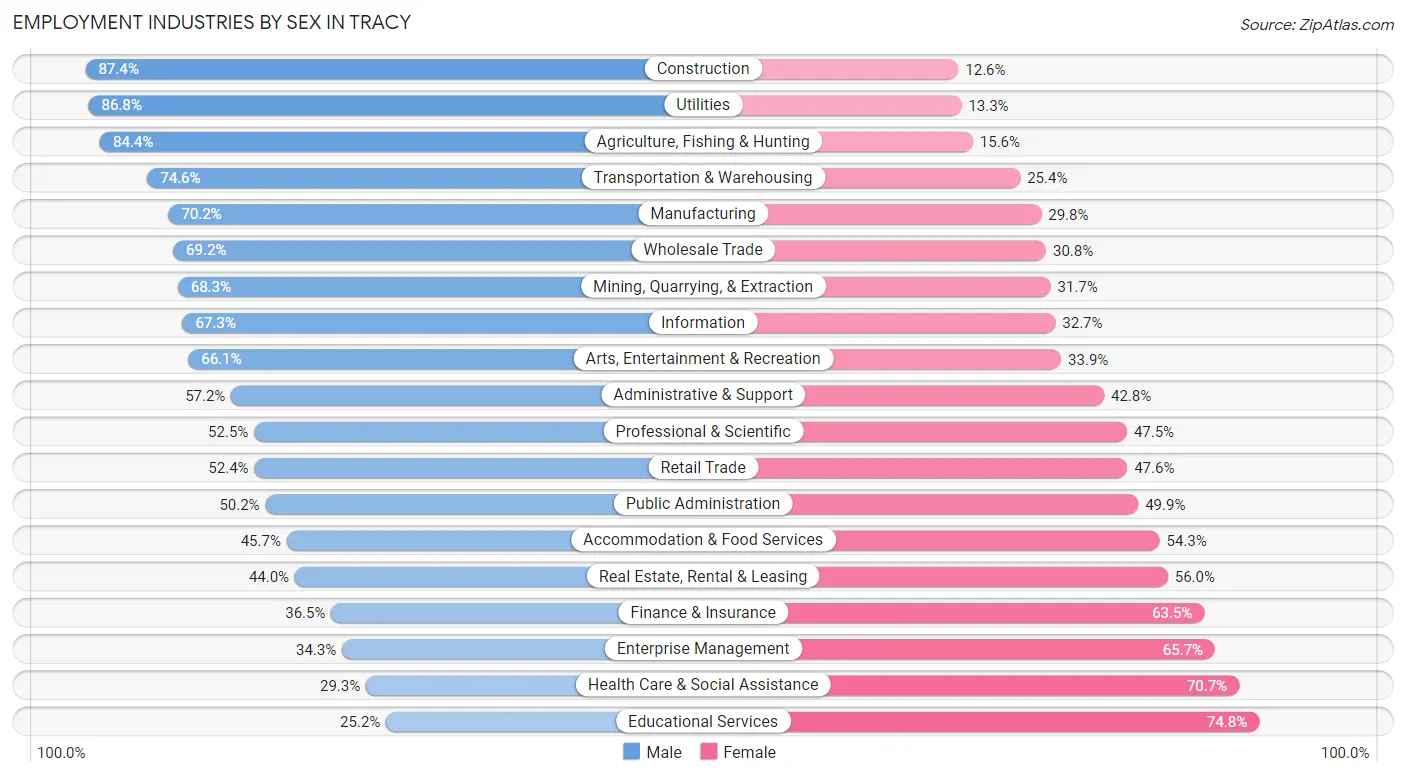
Employment Industries by Sex in Tracy
The Tracy industries that see more men than women are Construction (87.4%), Utilities (86.8%), and Agriculture, Fishing & Hunting (84.4%), whereas the industries that tend to have a higher number of women are Educational Services (74.8%), Health Care & Social Assistance (70.7%), and Enterprise Management (65.7%).
| Industry | Male | Female |
| Agriculture, Fishing & Hunting | 432 (84.4%) | 80 (15.6%) |
| Mining, Quarrying, & Extraction | 28 (68.3%) | 13 (31.7%) |
| Construction | 3,576 (87.4%) | 516 (12.6%) |
| Manufacturing | 3,501 (70.2%) | 1,485 (29.8%) |
| Wholesale Trade | 1,040 (69.2%) | 462 (30.8%) |
| Retail Trade | 3,111 (52.4%) | 2,823 (47.6%) |
| Transportation & Warehousing | 2,643 (74.6%) | 901 (25.4%) |
| Utilities | 465 (86.8%) | 71 (13.3%) |
| Information | 807 (67.3%) | 392 (32.7%) |
| Finance & Insurance | 491 (36.5%) | 854 (63.5%) |
| Real Estate, Rental & Leasing | 266 (44.0%) | 338 (56.0%) |
| Professional & Scientific | 2,189 (52.5%) | 1,981 (47.5%) |
| Enterprise Management | 12 (34.3%) | 23 (65.7%) |
| Administrative & Support | 1,395 (57.2%) | 1,042 (42.8%) |
| Educational Services | 895 (25.2%) | 2,662 (74.8%) |
| Health Care & Social Assistance | 1,497 (29.3%) | 3,609 (70.7%) |
| Arts, Entertainment & Recreation | 355 (66.1%) | 182 (33.9%) |
| Accommodation & Food Services | 1,235 (45.7%) | 1,465 (54.3%) |
| Public Administration | 852 (50.1%) | 847 (49.8%) |
| Total | 25,441 (55.2%) | 20,646 (44.8%) |
Education in Tracy
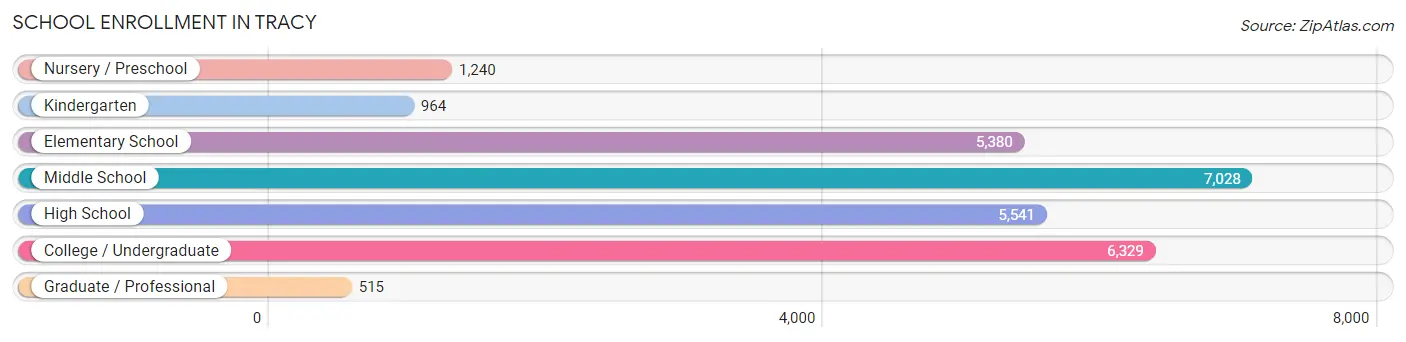
School Enrollment in Tracy
The most common levels of schooling among the 26,997 students in Tracy are middle school (7,028 | 26.0%), college / undergraduate (6,329 | 23.4%), and high school (5,541 | 20.5%).
| School Level | # Students | % Students |
| Nursery / Preschool | 1,240 | 4.6% |
| Kindergarten | 964 | 3.6% |
| Elementary School | 5,380 | 19.9% |
| Middle School | 7,028 | 26.0% |
| High School | 5,541 | 20.5% |
| College / Undergraduate | 6,329 | 23.4% |
| Graduate / Professional | 515 | 1.9% |
| Total | 26,997 | 100.0% |
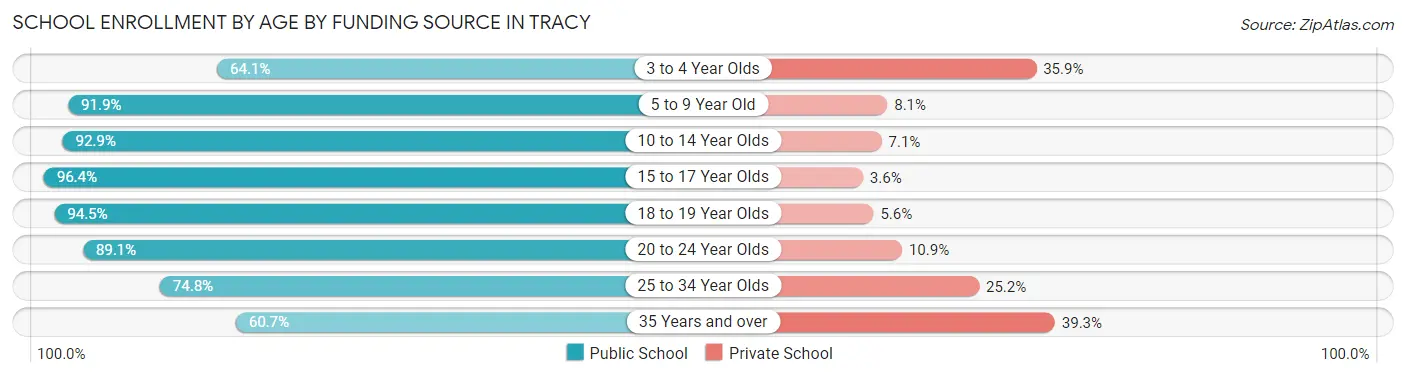
School Enrollment by Age by Funding Source in Tracy
Out of a total of 26,997 students who are enrolled in schools in Tracy, 2,889 (10.7%) attend a private institution, while the remaining 24,108 (89.3%) are enrolled in public schools. The age group of 35 years and over has the highest likelihood of being enrolled in private schools, with 443 (39.3% in the age bracket) enrolled. Conversely, the age group of 15 to 17 year olds has the lowest likelihood of being enrolled in a private school, with 3,664 (96.4% in the age bracket) attending a public institution.
| Age Bracket | Public School | Private School |
| 3 to 4 Year Olds | 699 (64.1%) | 391 (35.9%) |
| 5 to 9 Year Old | 5,216 (91.9%) | 461 (8.1%) |
| 10 to 14 Year Olds | 8,029 (92.9%) | 611 (7.1%) |
| 15 to 17 Year Olds | 3,664 (96.4%) | 136 (3.6%) |
| 18 to 19 Year Olds | 2,178 (94.5%) | 128 (5.6%) |
| 20 to 24 Year Olds | 2,322 (89.1%) | 283 (10.9%) |
| 25 to 34 Year Olds | 1,311 (74.8%) | 442 (25.2%) |
| 35 Years and over | 683 (60.7%) | 443 (39.3%) |
| Total | 24,108 (89.3%) | 2,889 (10.7%) |
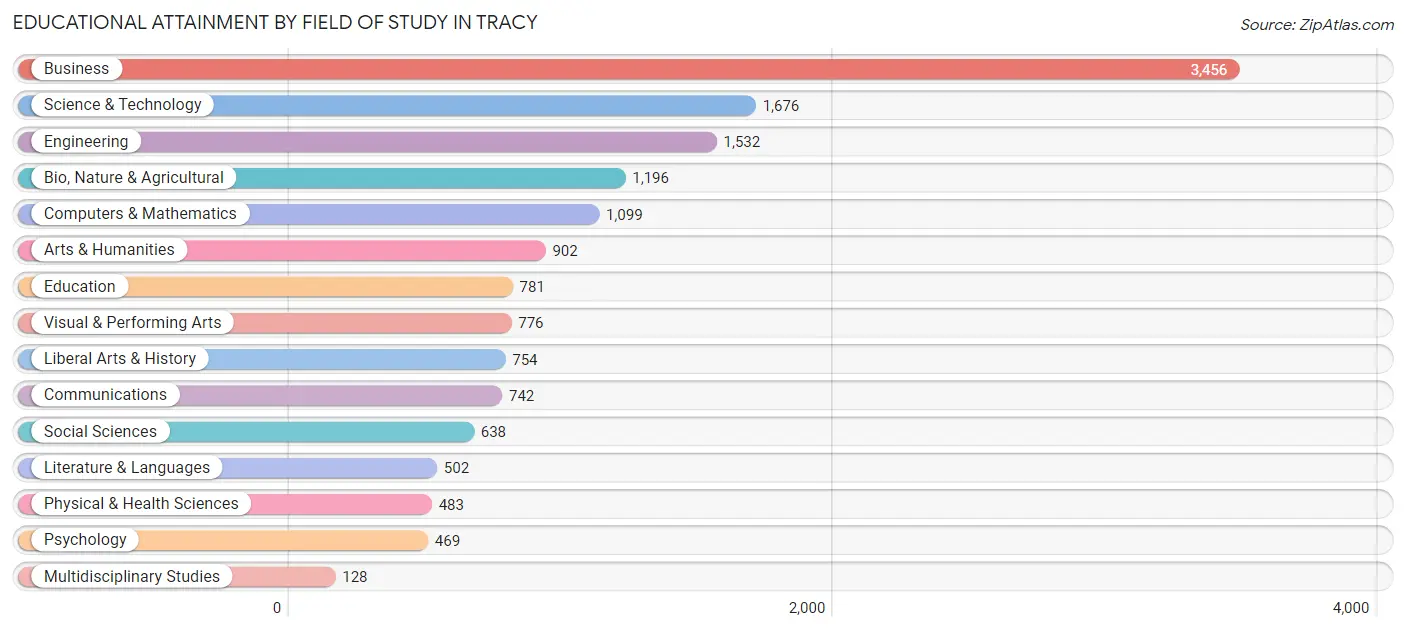
Educational Attainment by Field of Study in Tracy
Business (3,456 | 22.8%), science & technology (1,676 | 11.1%), engineering (1,532 | 10.1%), bio, nature & agricultural (1,196 | 7.9%), and computers & mathematics (1,099 | 7.3%) are the most common fields of study among 15,134 individuals in Tracy who have obtained a bachelor's degree or higher.
| Field of Study | # Graduates | % Graduates |
| Computers & Mathematics | 1,099 | 7.3% |
| Bio, Nature & Agricultural | 1,196 | 7.9% |
| Physical & Health Sciences | 483 | 3.2% |
| Psychology | 469 | 3.1% |
| Social Sciences | 638 | 4.2% |
| Engineering | 1,532 | 10.1% |
| Multidisciplinary Studies | 128 | 0.9% |
| Science & Technology | 1,676 | 11.1% |
| Business | 3,456 | 22.8% |
| Education | 781 | 5.2% |
| Literature & Languages | 502 | 3.3% |
| Liberal Arts & History | 754 | 5.0% |
| Visual & Performing Arts | 776 | 5.1% |
| Communications | 742 | 4.9% |
| Arts & Humanities | 902 | 6.0% |
| Total | 15,134 | 100.0% |
Transportation & Commute in Tracy
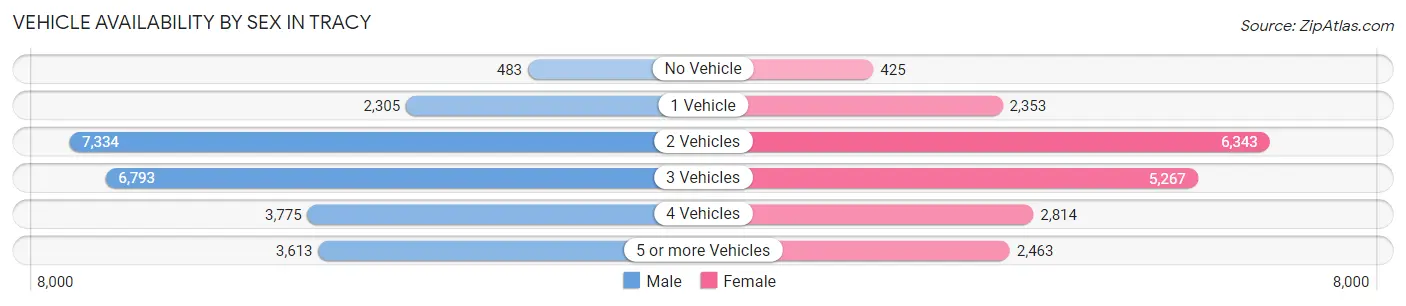
Vehicle Availability by Sex in Tracy
The most prevalent vehicle ownership categories in Tracy are males with 2 vehicles (7,334, accounting for 30.2%) and females with 2 vehicles (6,343, making up 37.3%).
| Vehicles Available | Male | Female |
| No Vehicle | 483 (2.0%) | 425 (2.2%) |
| 1 Vehicle | 2,305 (9.5%) | 2,353 (12.0%) |
| 2 Vehicles | 7,334 (30.2%) | 6,343 (32.3%) |
| 3 Vehicles | 6,793 (28.0%) | 5,267 (26.8%) |
| 4 Vehicles | 3,775 (15.5%) | 2,814 (14.3%) |
| 5 or more Vehicles | 3,613 (14.9%) | 2,463 (12.5%) |
| Total | 24,303 (100.0%) | 19,665 (100.0%) |
Commute Time in Tracy
The most frequently occuring commute durations in Tracy are 60 to 89 minutes (7,849 commuters, 20.1%), 90 or more minutes (5,621 commuters, 14.4%), and 45 to 59 minutes (4,731 commuters, 12.1%).
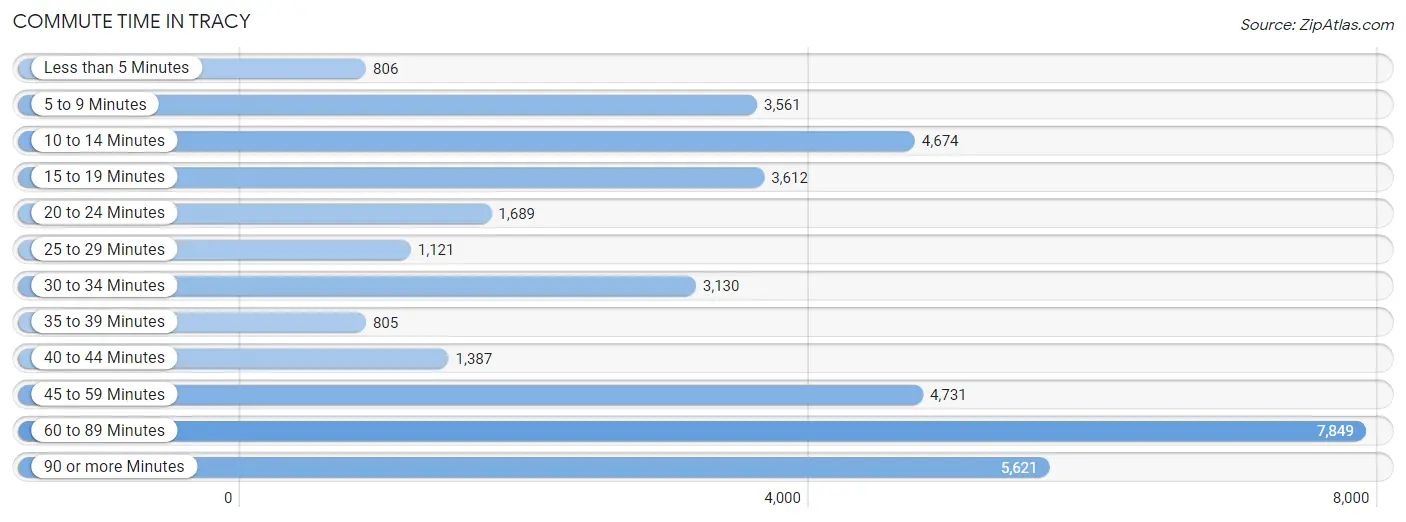
| Commute Time | # Commuters | % Commuters |
| Less than 5 Minutes | 806 | 2.1% |
| 5 to 9 Minutes | 3,561 | 9.1% |
| 10 to 14 Minutes | 4,674 | 12.0% |
| 15 to 19 Minutes | 3,612 | 9.3% |
| 20 to 24 Minutes | 1,689 | 4.3% |
| 25 to 29 Minutes | 1,121 | 2.9% |
| 30 to 34 Minutes | 3,130 | 8.0% |
| 35 to 39 Minutes | 805 | 2.1% |
| 40 to 44 Minutes | 1,387 | 3.6% |
| 45 to 59 Minutes | 4,731 | 12.1% |
| 60 to 89 Minutes | 7,849 | 20.1% |
| 90 or more Minutes | 5,621 | 14.4% |
Commute Time by Sex in Tracy
The most common commute times in Tracy are 60 to 89 minutes (5,358 commuters, 24.4%) for males and 45 to 59 minutes (2,504 commuters, 14.7%) for females.
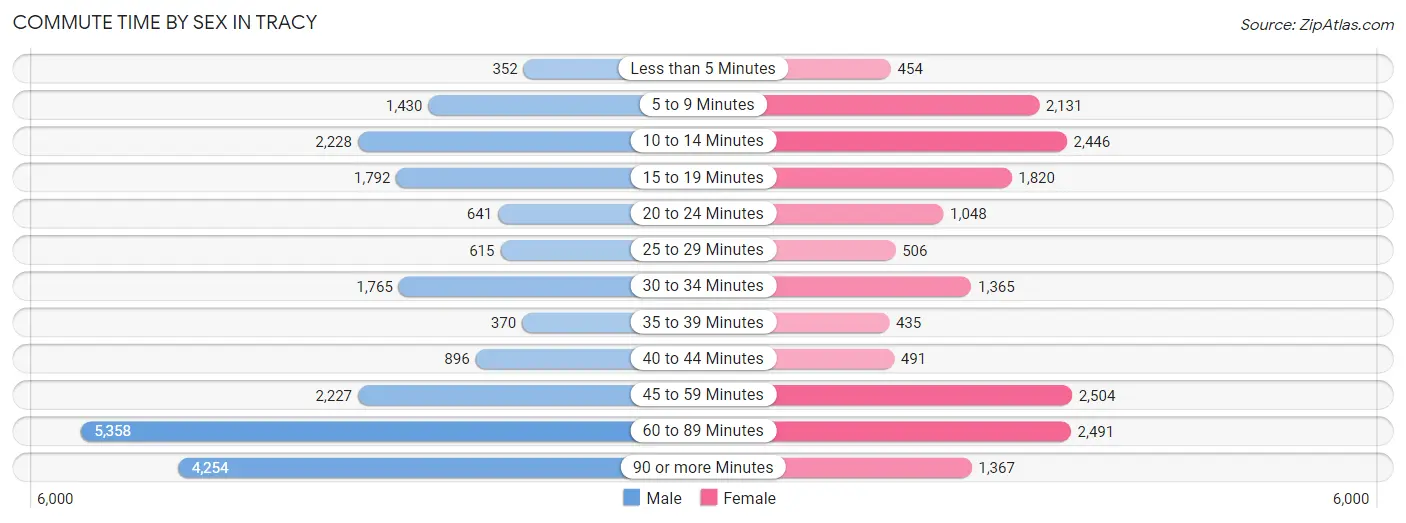
| Commute Time | Male | Female |
| Less than 5 Minutes | 352 (1.6%) | 454 (2.7%) |
| 5 to 9 Minutes | 1,430 (6.5%) | 2,131 (12.5%) |
| 10 to 14 Minutes | 2,228 (10.2%) | 2,446 (14.3%) |
| 15 to 19 Minutes | 1,792 (8.2%) | 1,820 (10.7%) |
| 20 to 24 Minutes | 641 (2.9%) | 1,048 (6.1%) |
| 25 to 29 Minutes | 615 (2.8%) | 506 (3.0%) |
| 30 to 34 Minutes | 1,765 (8.1%) | 1,365 (8.0%) |
| 35 to 39 Minutes | 370 (1.7%) | 435 (2.5%) |
| 40 to 44 Minutes | 896 (4.1%) | 491 (2.9%) |
| 45 to 59 Minutes | 2,227 (10.2%) | 2,504 (14.7%) |
| 60 to 89 Minutes | 5,358 (24.4%) | 2,491 (14.6%) |
| 90 or more Minutes | 4,254 (19.4%) | 1,367 (8.0%) |
Time of Departure to Work by Sex in Tracy
The most frequent times of departure to work in Tracy are 12:00 AM to 4:59 AM (6,102, 27.8%) for males and 8:00 AM to 8:29 AM (2,081, 12.2%) for females.
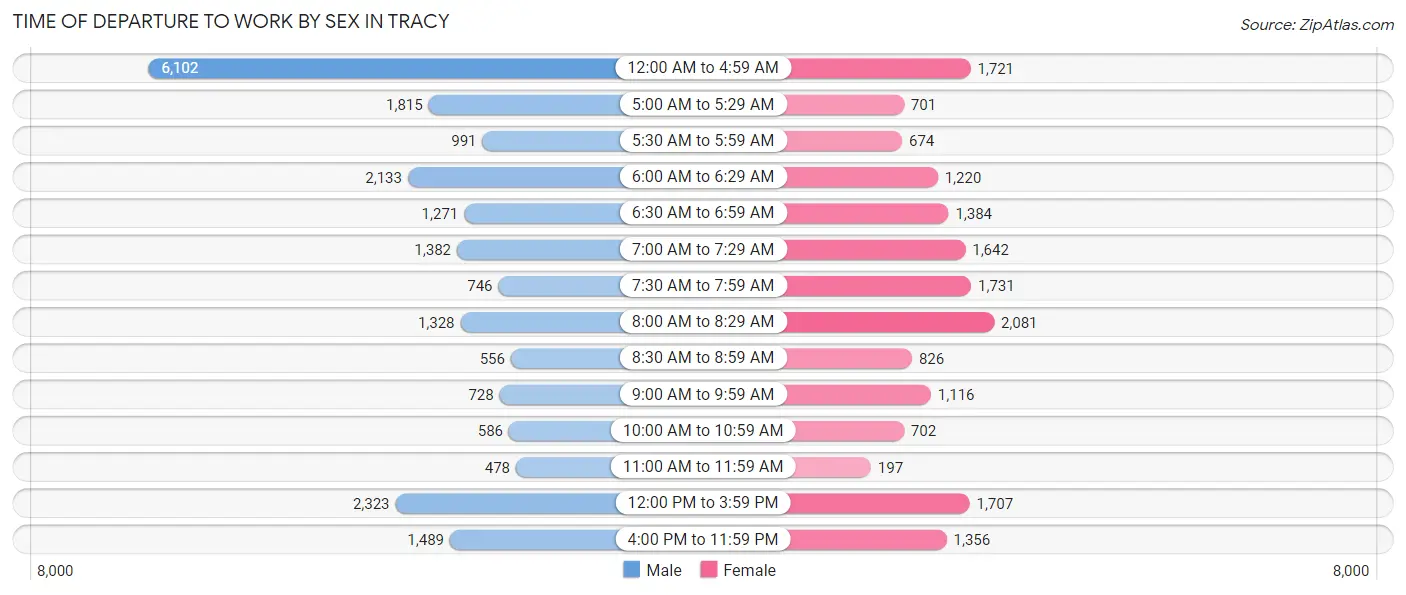
| Time of Departure | Male | Female |
| 12:00 AM to 4:59 AM | 6,102 (27.8%) | 1,721 (10.1%) |
| 5:00 AM to 5:29 AM | 1,815 (8.3%) | 701 (4.1%) |
| 5:30 AM to 5:59 AM | 991 (4.5%) | 674 (4.0%) |
| 6:00 AM to 6:29 AM | 2,133 (9.7%) | 1,220 (7.1%) |
| 6:30 AM to 6:59 AM | 1,271 (5.8%) | 1,384 (8.1%) |
| 7:00 AM to 7:29 AM | 1,382 (6.3%) | 1,642 (9.6%) |
| 7:30 AM to 7:59 AM | 746 (3.4%) | 1,731 (10.2%) |
| 8:00 AM to 8:29 AM | 1,328 (6.1%) | 2,081 (12.2%) |
| 8:30 AM to 8:59 AM | 556 (2.5%) | 826 (4.8%) |
| 9:00 AM to 9:59 AM | 728 (3.3%) | 1,116 (6.5%) |
| 10:00 AM to 10:59 AM | 586 (2.7%) | 702 (4.1%) |
| 11:00 AM to 11:59 AM | 478 (2.2%) | 197 (1.1%) |
| 12:00 PM to 3:59 PM | 2,323 (10.6%) | 1,707 (10.0%) |
| 4:00 PM to 11:59 PM | 1,489 (6.8%) | 1,356 (8.0%) |
| Total | 21,928 (100.0%) | 17,058 (100.0%) |
Housing Occupancy in Tracy
Occupancy by Ownership in Tracy
Of the total 27,645 dwellings in Tracy, owner-occupied units account for 17,682 (64.0%), while renter-occupied units make up 9,963 (36.0%).
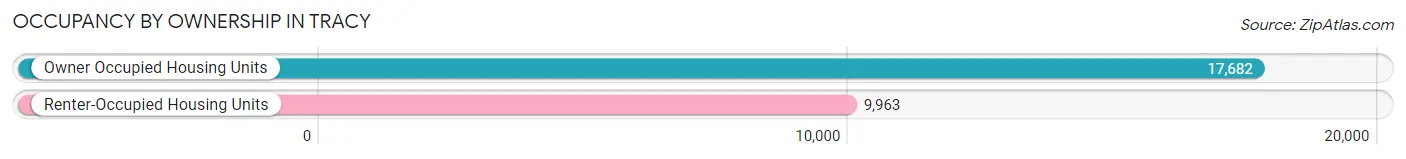
| Occupancy | # Housing Units | % Housing Units |
| Owner Occupied Housing Units | 17,682 | 64.0% |
| Renter-Occupied Housing Units | 9,963 | 36.0% |
| Total Occupied Housing Units | 27,645 | 100.0% |
Occupancy by Household Size in Tracy
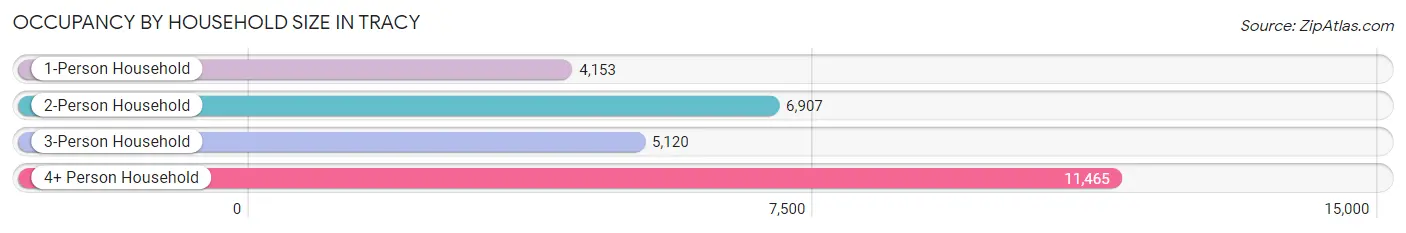
| Household Size | # Housing Units | % Housing Units |
| 1-Person Household | 4,153 | 15.0% |
| 2-Person Household | 6,907 | 25.0% |
| 3-Person Household | 5,120 | 18.5% |
| 4+ Person Household | 11,465 | 41.5% |
| Total Housing Units | 27,645 | 100.0% |
Occupancy by Ownership by Household Size in Tracy
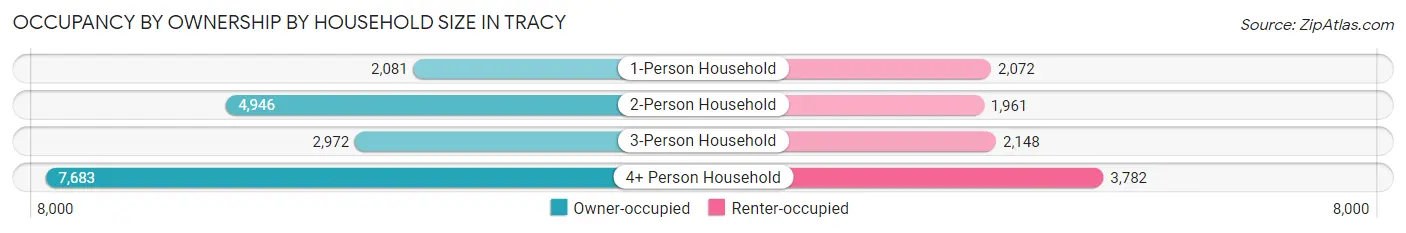
| Household Size | Owner-occupied | Renter-occupied |
| 1-Person Household | 2,081 (50.1%) | 2,072 (49.9%) |
| 2-Person Household | 4,946 (71.6%) | 1,961 (28.4%) |
| 3-Person Household | 2,972 (58.1%) | 2,148 (41.9%) |
| 4+ Person Household | 7,683 (67.0%) | 3,782 (33.0%) |
| Total Housing Units | 17,682 (64.0%) | 9,963 (36.0%) |
Occupancy by Educational Attainment in Tracy
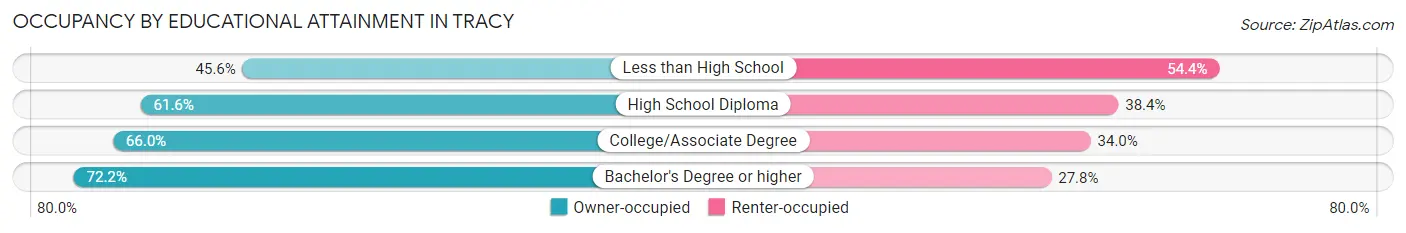
| Household Size | Owner-occupied | Renter-occupied |
| Less than High School | 1,615 (45.6%) | 1,928 (54.4%) |
| High School Diploma | 3,939 (61.6%) | 2,456 (38.4%) |
| College/Associate Degree | 6,992 (66.0%) | 3,603 (34.0%) |
| Bachelor's Degree or higher | 5,136 (72.2%) | 1,976 (27.8%) |
Occupancy by Age of Householder in Tracy
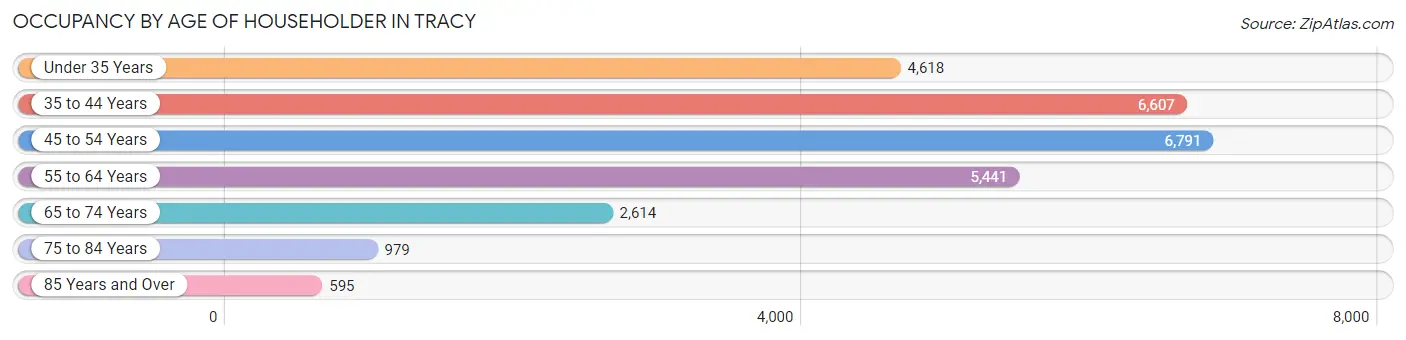
| Age Bracket | # Households | % Households |
| Under 35 Years | 4,618 | 16.7% |
| 35 to 44 Years | 6,607 | 23.9% |
| 45 to 54 Years | 6,791 | 24.6% |
| 55 to 64 Years | 5,441 | 19.7% |
| 65 to 74 Years | 2,614 | 9.5% |
| 75 to 84 Years | 979 | 3.5% |
| 85 Years and Over | 595 | 2.1% |
| Total | 27,645 | 100.0% |
Housing Finances in Tracy
Median Income by Occupancy in Tracy
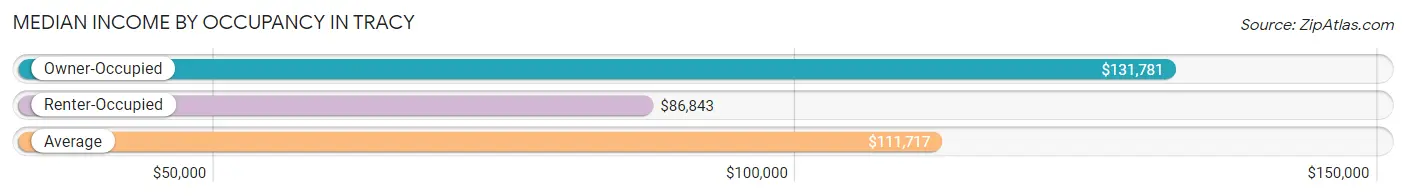
| Occupancy Type | # Households | Median Income |
| Owner-Occupied | 17,682 (64.0%) | $131,781 |
| Renter-Occupied | 9,963 (36.0%) | $86,843 |
| Average | 27,645 (100.0%) | $111,717 |
Occupancy by Householder Income Bracket in Tracy
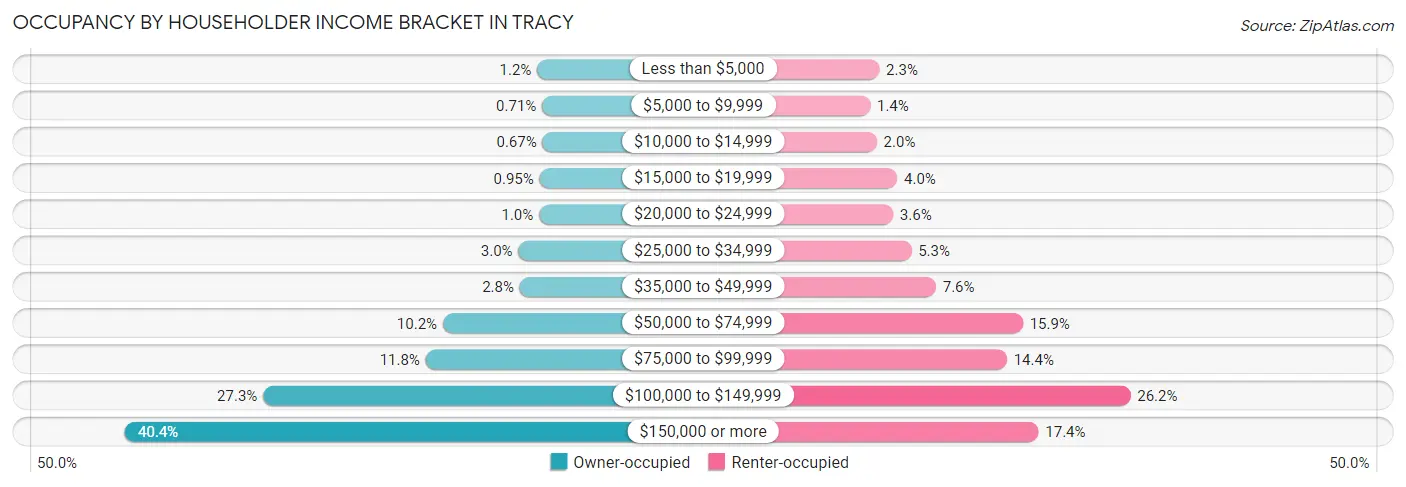
| Income Bracket | Owner-occupied | Renter-occupied |
| Less than $5,000 | 209 (1.2%) | 224 (2.2%) |
| $5,000 to $9,999 | 126 (0.7%) | 137 (1.4%) |
| $10,000 to $14,999 | 119 (0.7%) | 200 (2.0%) |
| $15,000 to $19,999 | 168 (0.9%) | 395 (4.0%) |
| $20,000 to $24,999 | 176 (1.0%) | 355 (3.6%) |
| $25,000 to $34,999 | 526 (3.0%) | 528 (5.3%) |
| $35,000 to $49,999 | 503 (2.8%) | 761 (7.6%) |
| $50,000 to $74,999 | 1,796 (10.2%) | 1,586 (15.9%) |
| $75,000 to $99,999 | 2,086 (11.8%) | 1,435 (14.4%) |
| $100,000 to $149,999 | 4,823 (27.3%) | 2,607 (26.2%) |
| $150,000 or more | 7,150 (40.4%) | 1,735 (17.4%) |
| Total | 17,682 (100.0%) | 9,963 (100.0%) |
Monthly Housing Cost Tiers in Tracy
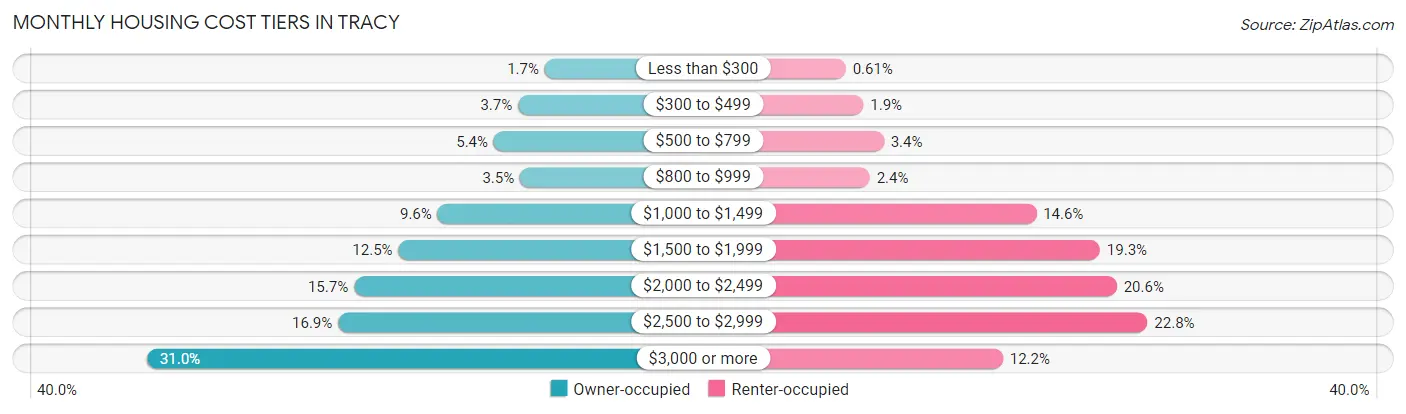
| Monthly Cost | Owner-occupied | Renter-occupied |
| Less than $300 | 298 (1.7%) | 61 (0.6%) |
| $300 to $499 | 648 (3.7%) | 190 (1.9%) |
| $500 to $799 | 962 (5.4%) | 340 (3.4%) |
| $800 to $999 | 621 (3.5%) | 237 (2.4%) |
| $1,000 to $1,499 | 1,694 (9.6%) | 1,459 (14.6%) |
| $1,500 to $1,999 | 2,205 (12.5%) | 1,926 (19.3%) |
| $2,000 to $2,499 | 2,784 (15.7%) | 2,049 (20.6%) |
| $2,500 to $2,999 | 2,990 (16.9%) | 2,275 (22.8%) |
| $3,000 or more | 5,480 (31.0%) | 1,213 (12.2%) |
| Total | 17,682 (100.0%) | 9,963 (100.0%) |
Physical Housing Characteristics in Tracy
Housing Structures in Tracy
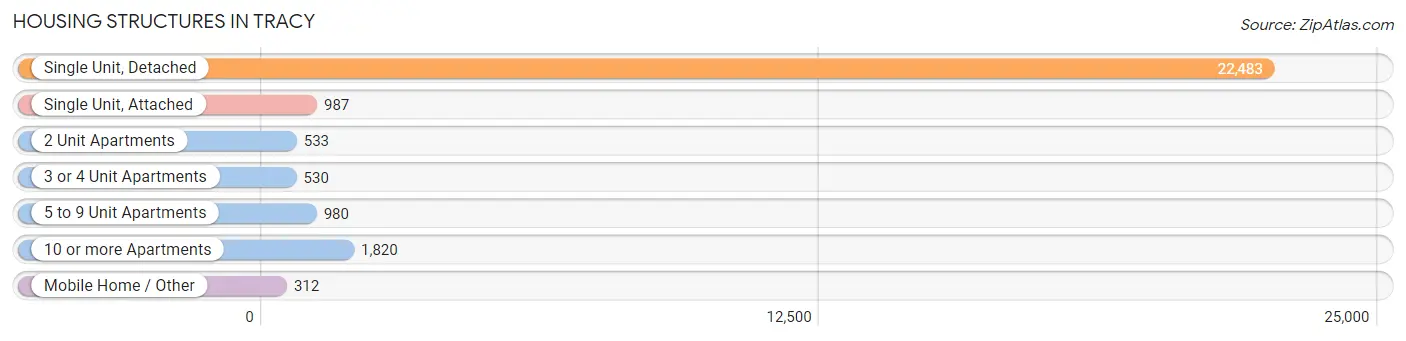
| Structure Type | # Housing Units | % Housing Units |
| Single Unit, Detached | 22,483 | 81.3% |
| Single Unit, Attached | 987 | 3.6% |
| 2 Unit Apartments | 533 | 1.9% |
| 3 or 4 Unit Apartments | 530 | 1.9% |
| 5 to 9 Unit Apartments | 980 | 3.5% |
| 10 or more Apartments | 1,820 | 6.6% |
| Mobile Home / Other | 312 | 1.1% |
| Total | 27,645 | 100.0% |
Housing Structures by Occupancy in Tracy
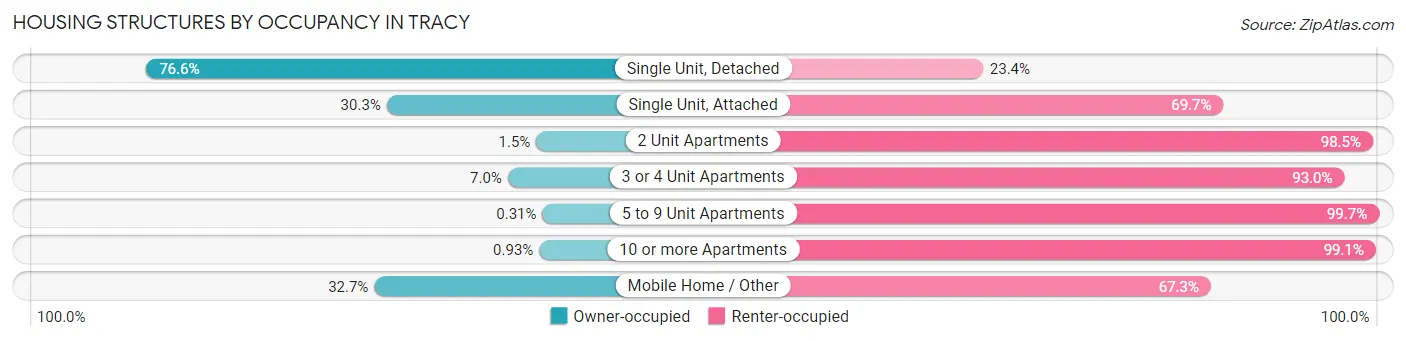
| Structure Type | Owner-occupied | Renter-occupied |
| Single Unit, Detached | 17,216 (76.6%) | 5,267 (23.4%) |
| Single Unit, Attached | 299 (30.3%) | 688 (69.7%) |
| 2 Unit Apartments | 8 (1.5%) | 525 (98.5%) |
| 3 or 4 Unit Apartments | 37 (7.0%) | 493 (93.0%) |
| 5 to 9 Unit Apartments | 3 (0.3%) | 977 (99.7%) |
| 10 or more Apartments | 17 (0.9%) | 1,803 (99.1%) |
| Mobile Home / Other | 102 (32.7%) | 210 (67.3%) |
| Total | 17,682 (64.0%) | 9,963 (36.0%) |
Housing Structures by Number of Rooms in Tracy
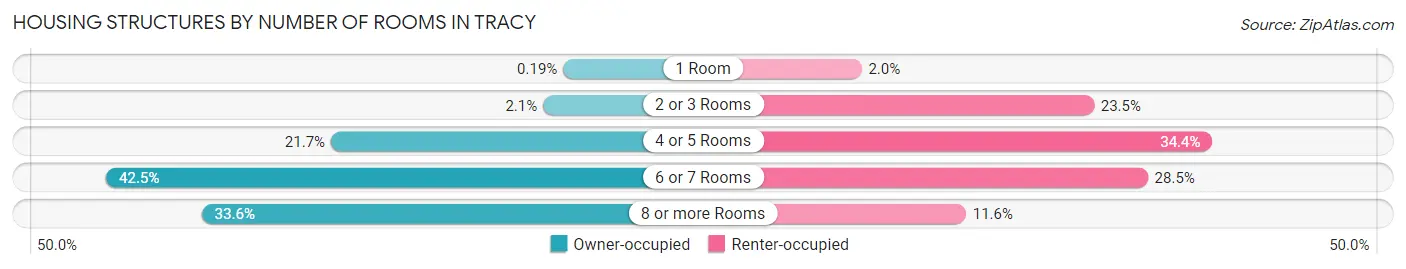
| Number of Rooms | Owner-occupied | Renter-occupied |
| 1 Room | 33 (0.2%) | 198 (2.0%) |
| 2 or 3 Rooms | 363 (2.1%) | 2,339 (23.5%) |
| 4 or 5 Rooms | 3,831 (21.7%) | 3,431 (34.4%) |
| 6 or 7 Rooms | 7,510 (42.5%) | 2,835 (28.5%) |
| 8 or more Rooms | 5,945 (33.6%) | 1,160 (11.6%) |
| Total | 17,682 (100.0%) | 9,963 (100.0%) |
Housing Structure by Heating Type in Tracy
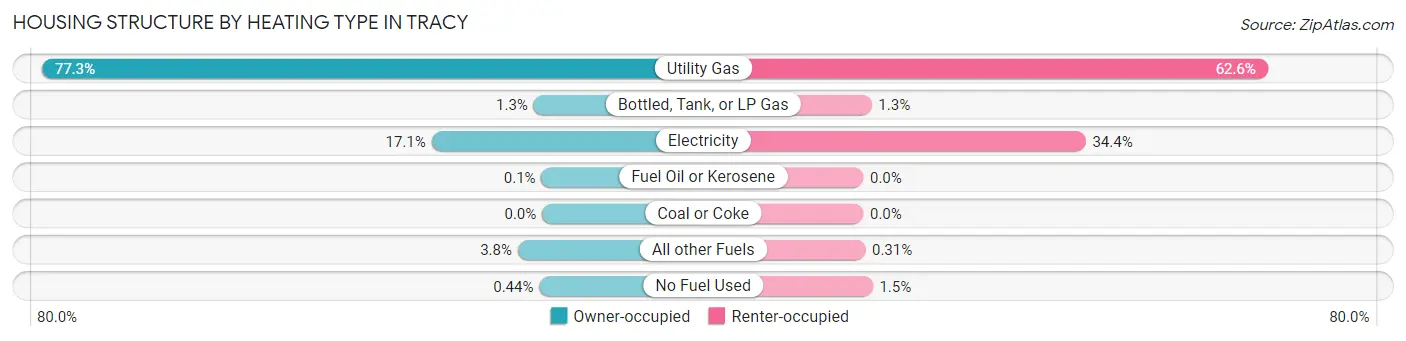
| Heating Type | Owner-occupied | Renter-occupied |
| Utility Gas | 13,675 (77.3%) | 6,232 (62.5%) |
| Bottled, Tank, or LP Gas | 229 (1.3%) | 129 (1.3%) |
| Electricity | 3,021 (17.1%) | 3,426 (34.4%) |
| Fuel Oil or Kerosene | 17 (0.1%) | 0 (0.0%) |
| Coal or Coke | 0 (0.0%) | 0 (0.0%) |
| All other Fuels | 663 (3.7%) | 31 (0.3%) |
| No Fuel Used | 77 (0.4%) | 145 (1.5%) |
| Total | 17,682 (100.0%) | 9,963 (100.0%) |
Household Vehicle Usage in Tracy
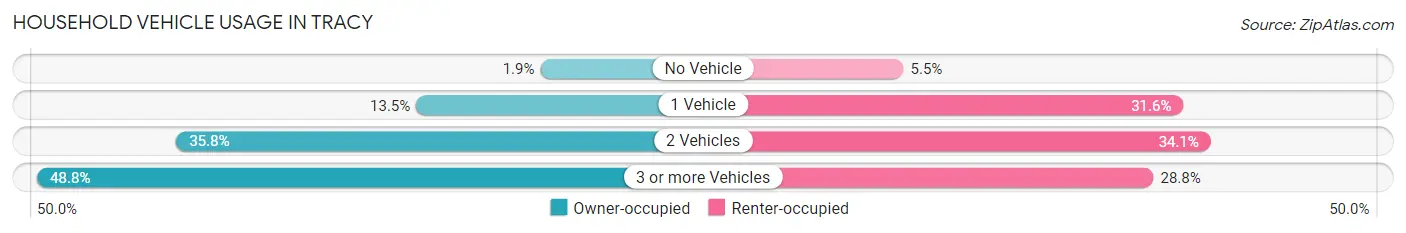
| Vehicles per Household | Owner-occupied | Renter-occupied |
| No Vehicle | 329 (1.9%) | 546 (5.5%) |
| 1 Vehicle | 2,379 (13.5%) | 3,146 (31.6%) |
| 2 Vehicles | 6,338 (35.8%) | 3,401 (34.1%) |
| 3 or more Vehicles | 8,636 (48.8%) | 2,870 (28.8%) |
| Total | 17,682 (100.0%) | 9,963 (100.0%) |
Real Estate & Mortgages in Tracy
Real Estate and Mortgage Overview in Tracy
| Characteristic | Without Mortgage | With Mortgage |
| Housing Units | 2,999 | 14,683 |
| Median Property Value | $557,400 | $626,100 |
| Median Household Income | $93,125 | $6,391 |
| Monthly Housing Costs | $716 | $5,480 |
| Real Estate Taxes | $4,102 | $222 |
Property Value by Mortgage Status in Tracy
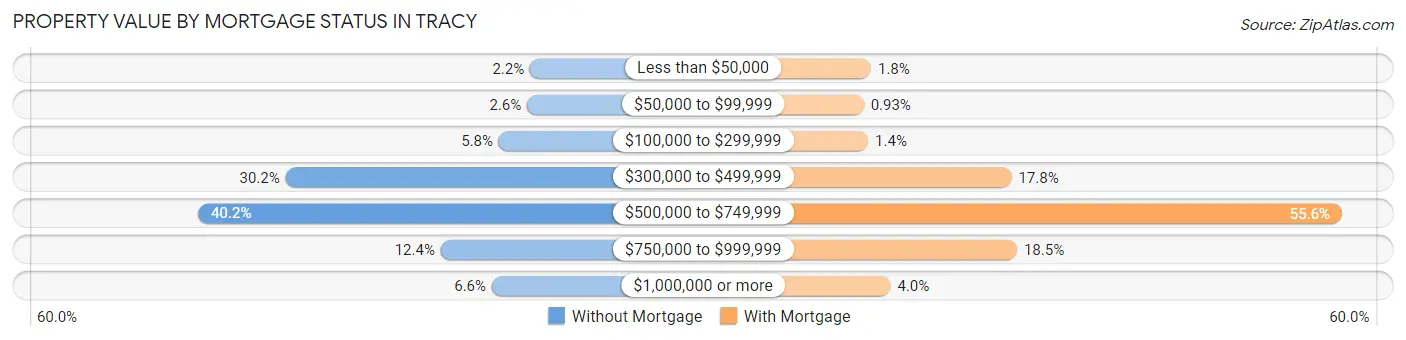
| Property Value | Without Mortgage | With Mortgage |
| Less than $50,000 | 67 (2.2%) | 260 (1.8%) |
| $50,000 to $99,999 | 77 (2.6%) | 136 (0.9%) |
| $100,000 to $299,999 | 174 (5.8%) | 212 (1.4%) |
| $300,000 to $499,999 | 905 (30.2%) | 2,617 (17.8%) |
| $500,000 to $749,999 | 1,205 (40.2%) | 8,161 (55.6%) |
| $750,000 to $999,999 | 373 (12.4%) | 2,709 (18.4%) |
| $1,000,000 or more | 198 (6.6%) | 588 (4.0%) |
| Total | 2,999 (100.0%) | 14,683 (100.0%) |
Household Income by Mortgage Status in Tracy
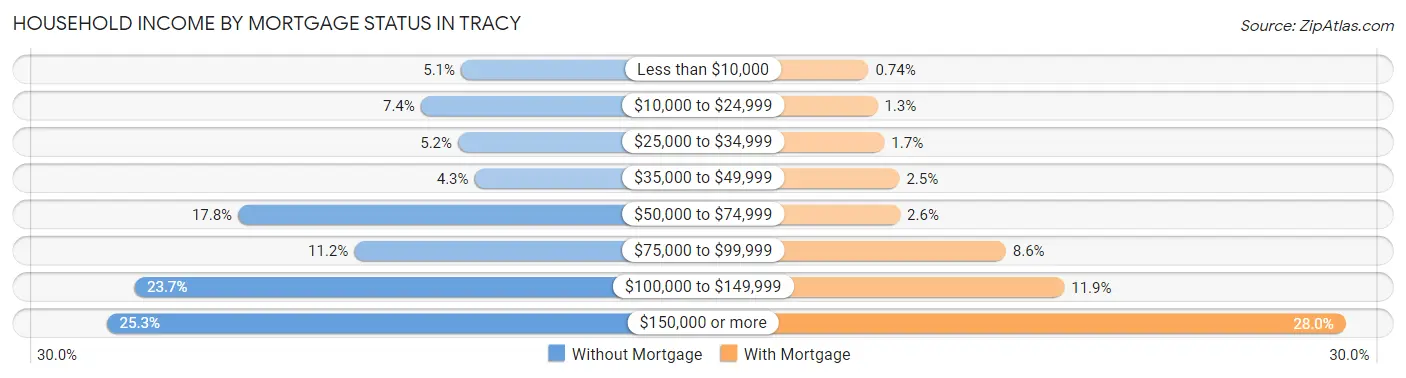
| Household Income | Without Mortgage | With Mortgage |
| Less than $10,000 | 152 (5.1%) | 109 (0.7%) |
| $10,000 to $24,999 | 221 (7.4%) | 183 (1.3%) |
| $25,000 to $34,999 | 157 (5.2%) | 242 (1.7%) |
| $35,000 to $49,999 | 129 (4.3%) | 369 (2.5%) |
| $50,000 to $74,999 | 534 (17.8%) | 374 (2.5%) |
| $75,000 to $99,999 | 335 (11.2%) | 1,262 (8.6%) |
| $100,000 to $149,999 | 712 (23.7%) | 1,751 (11.9%) |
| $150,000 or more | 759 (25.3%) | 4,111 (28.0%) |
| Total | 2,999 (100.0%) | 14,683 (100.0%) |
Property Value to Household Income Ratio in Tracy
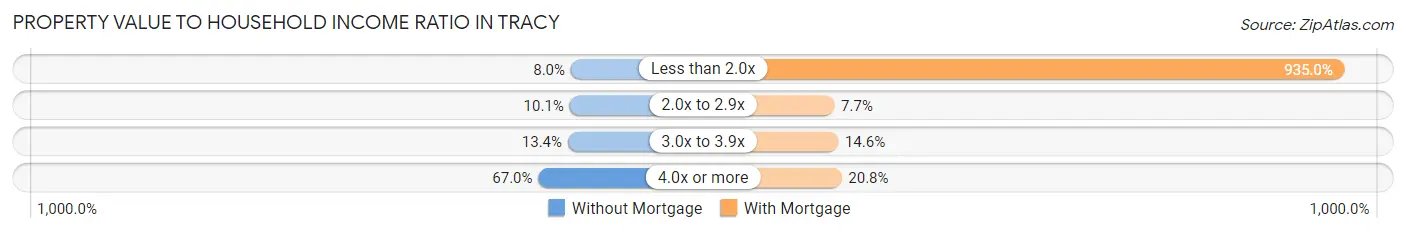
| Value-to-Income Ratio | Without Mortgage | With Mortgage |
| Less than 2.0x | 239 (8.0%) | 137,288 (935.0%) |
| 2.0x to 2.9x | 304 (10.1%) | 1,126 (7.7%) |
| 3.0x to 3.9x | 402 (13.4%) | 2,147 (14.6%) |
| 4.0x or more | 2,008 (67.0%) | 3,049 (20.8%) |
| Total | 2,999 (100.0%) | 14,683 (100.0%) |
Real Estate Taxes by Mortgage Status in Tracy
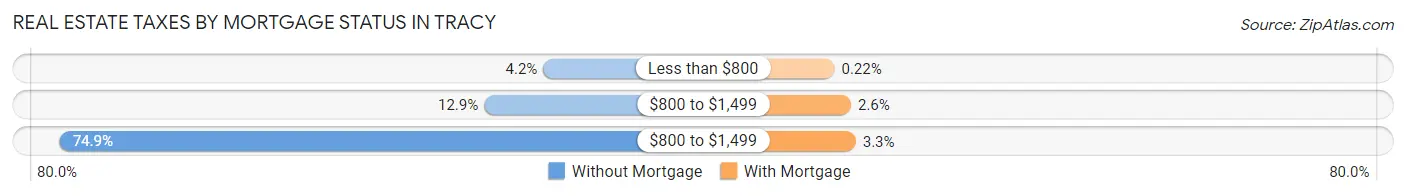
| Property Taxes | Without Mortgage | With Mortgage |
| Less than $800 | 127 (4.2%) | 33 (0.2%) |
| $800 to $1,499 | 386 (12.9%) | 386 (2.6%) |
| $800 to $1,499 | 2,245 (74.9%) | 488 (3.3%) |
| Total | 2,999 (100.0%) | 14,683 (100.0%) |
Health & Disability in Tracy
Health Insurance Coverage by Age in Tracy
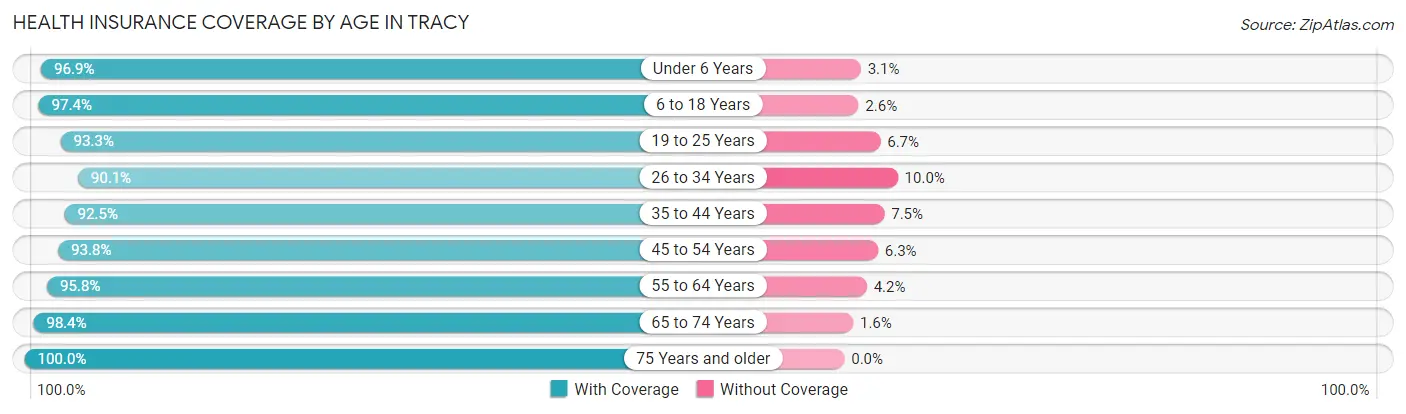
| Age Bracket | With Coverage | Without Coverage |
| Under 6 Years | 7,208 (96.9%) | 228 (3.1%) |
| 6 to 18 Years | 18,814 (97.4%) | 509 (2.6%) |
| 19 to 25 Years | 8,217 (93.3%) | 591 (6.7%) |
| 26 to 34 Years | 10,795 (90.0%) | 1,193 (10.0%) |
| 35 to 44 Years | 12,571 (92.5%) | 1,013 (7.5%) |
| 45 to 54 Years | 12,459 (93.8%) | 831 (6.2%) |
| 55 to 64 Years | 9,966 (95.8%) | 435 (4.2%) |
| 65 to 74 Years | 5,562 (98.4%) | 92 (1.6%) |
| 75 Years and older | 3,275 (100.0%) | 0 (0.0%) |
| Total | 88,867 (94.8%) | 4,892 (5.2%) |
Health Insurance Coverage by Citizenship Status in Tracy
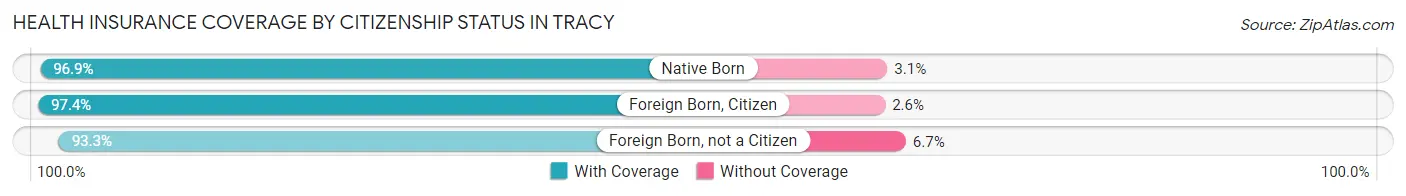
| Citizenship Status | With Coverage | Without Coverage |
| Native Born | 7,208 (96.9%) | 228 (3.1%) |
| Foreign Born, Citizen | 18,814 (97.4%) | 509 (2.6%) |
| Foreign Born, not a Citizen | 8,217 (93.3%) | 591 (6.7%) |
Health Insurance Coverage by Household Income in Tracy
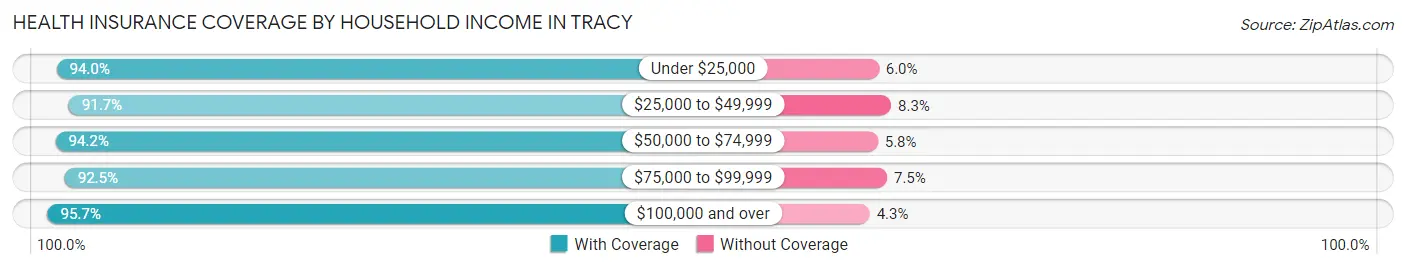
| Household Income | With Coverage | Without Coverage |
| Under $25,000 | 4,707 (94.0%) | 300 (6.0%) |
| $25,000 to $49,999 | 5,460 (91.7%) | 494 (8.3%) |
| $50,000 to $74,999 | 10,331 (94.2%) | 637 (5.8%) |
| $75,000 to $99,999 | 10,368 (92.5%) | 846 (7.5%) |
| $100,000 and over | 57,917 (95.7%) | 2,600 (4.3%) |
Public vs Private Health Insurance Coverage by Age in Tracy
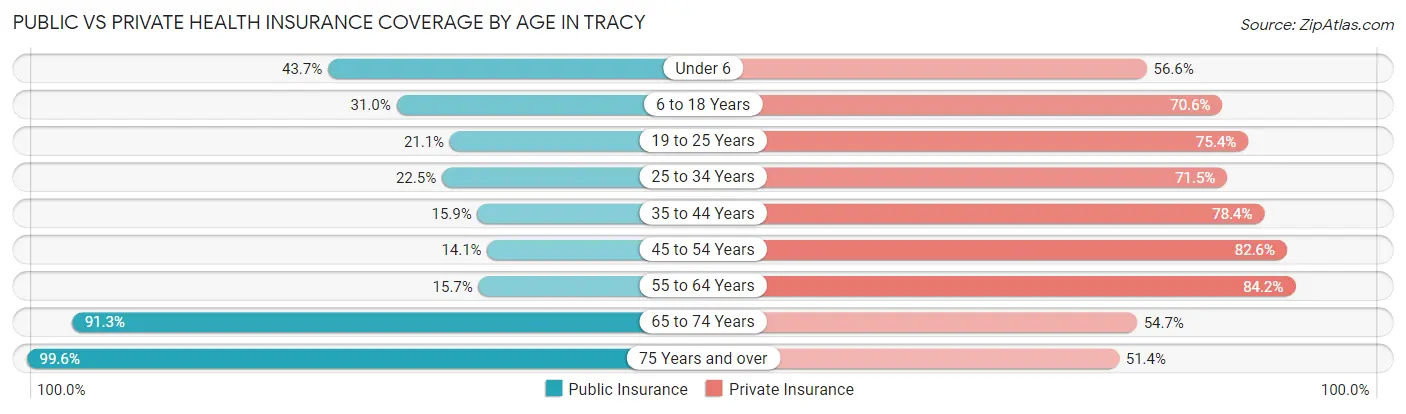
| Age Bracket | Public Insurance | Private Insurance |
| Under 6 | 3,248 (43.7%) | 4,207 (56.6%) |
| 6 to 18 Years | 5,982 (31.0%) | 13,650 (70.6%) |
| 19 to 25 Years | 1,854 (21.0%) | 6,643 (75.4%) |
| 25 to 34 Years | 2,701 (22.5%) | 8,575 (71.5%) |
| 35 to 44 Years | 2,164 (15.9%) | 10,654 (78.4%) |
| 45 to 54 Years | 1,872 (14.1%) | 10,977 (82.6%) |
| 55 to 64 Years | 1,636 (15.7%) | 8,752 (84.2%) |
| 65 to 74 Years | 5,159 (91.2%) | 3,095 (54.7%) |
| 75 Years and over | 3,263 (99.6%) | 1,684 (51.4%) |
| Total | 27,879 (29.7%) | 68,237 (72.8%) |
Disability Status by Sex by Age in Tracy
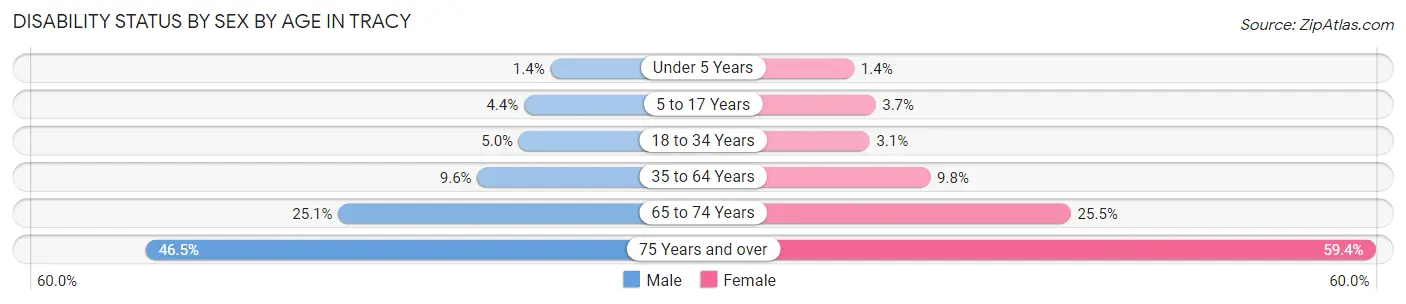
| Age Bracket | Male | Female |
| Under 5 Years | 47 (1.4%) | 40 (1.3%) |
| 5 to 17 Years | 456 (4.4%) | 311 (3.7%) |
| 18 to 34 Years | 554 (5.0%) | 350 (3.1%) |
| 35 to 64 Years | 1,773 (9.6%) | 1,845 (9.8%) |
| 65 to 74 Years | 643 (25.1%) | 787 (25.5%) |
| 75 Years and over | 692 (46.5%) | 1,062 (59.4%) |
Disability Class by Sex by Age in Tracy
Disability Class: Hearing Difficulty
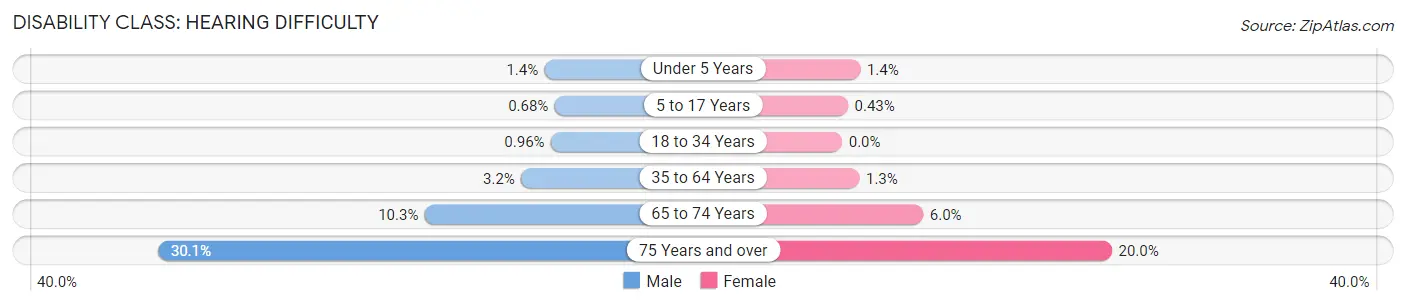
| Age Bracket | Male | Female |
| Under 5 Years | 47 (1.4%) | 40 (1.3%) |
| 5 to 17 Years | 71 (0.7%) | 36 (0.4%) |
| 18 to 34 Years | 107 (1.0%) | 0 (0.0%) |
| 35 to 64 Years | 587 (3.2%) | 241 (1.3%) |
| 65 to 74 Years | 265 (10.3%) | 186 (6.0%) |
| 75 Years and over | 448 (30.1%) | 358 (20.0%) |
Disability Class: Vision Difficulty
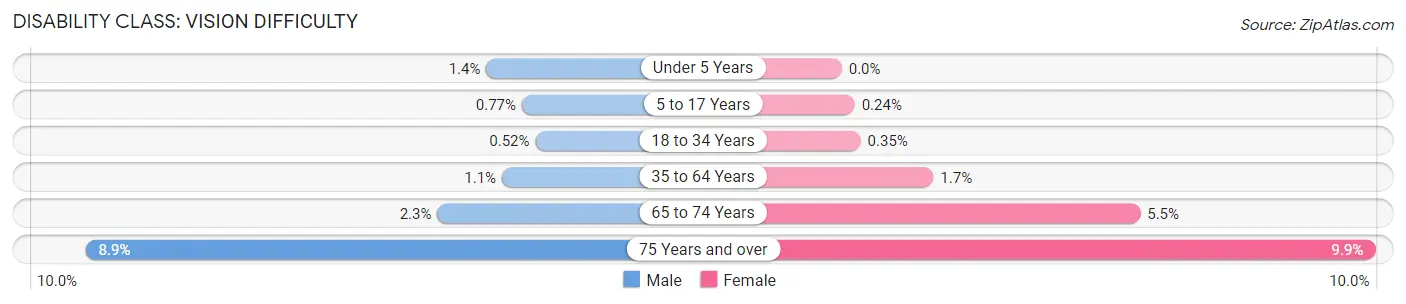
| Age Bracket | Male | Female |
| Under 5 Years | 47 (1.4%) | 0 (0.0%) |
| 5 to 17 Years | 80 (0.8%) | 20 (0.2%) |
| 18 to 34 Years | 58 (0.5%) | 40 (0.4%) |
| 35 to 64 Years | 212 (1.1%) | 319 (1.7%) |
| 65 to 74 Years | 60 (2.3%) | 171 (5.5%) |
| 75 Years and over | 132 (8.9%) | 177 (9.9%) |
Disability Class: Cognitive Difficulty
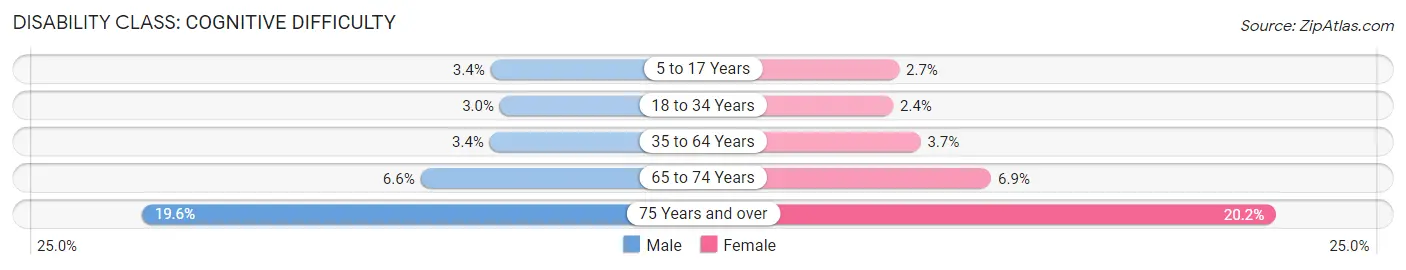
| Age Bracket | Male | Female |
| 5 to 17 Years | 353 (3.4%) | 222 (2.7%) |
| 18 to 34 Years | 330 (2.9%) | 270 (2.4%) |
| 35 to 64 Years | 634 (3.4%) | 684 (3.6%) |
| 65 to 74 Years | 170 (6.6%) | 214 (6.9%) |
| 75 Years and over | 291 (19.6%) | 360 (20.2%) |
Disability Class: Ambulatory Difficulty
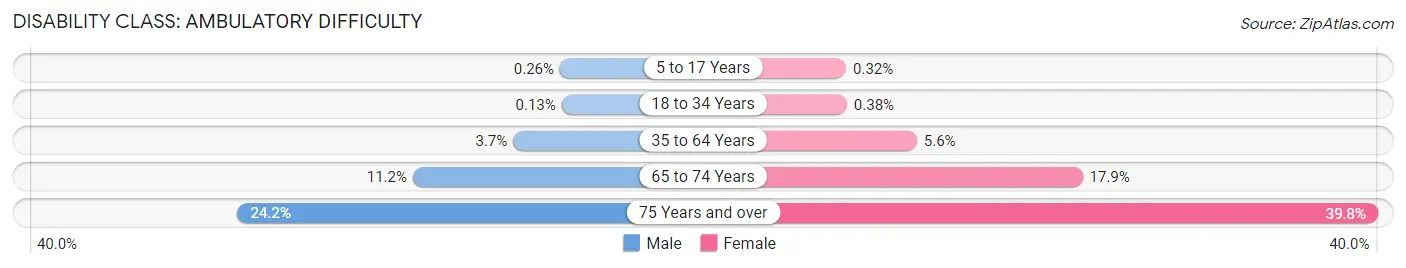
| Age Bracket | Male | Female |
| 5 to 17 Years | 27 (0.3%) | 27 (0.3%) |
| 18 to 34 Years | 15 (0.1%) | 43 (0.4%) |
| 35 to 64 Years | 691 (3.7%) | 1,044 (5.6%) |
| 65 to 74 Years | 287 (11.2%) | 552 (17.9%) |
| 75 Years and over | 360 (24.2%) | 711 (39.8%) |
Disability Class: Self-Care Difficulty
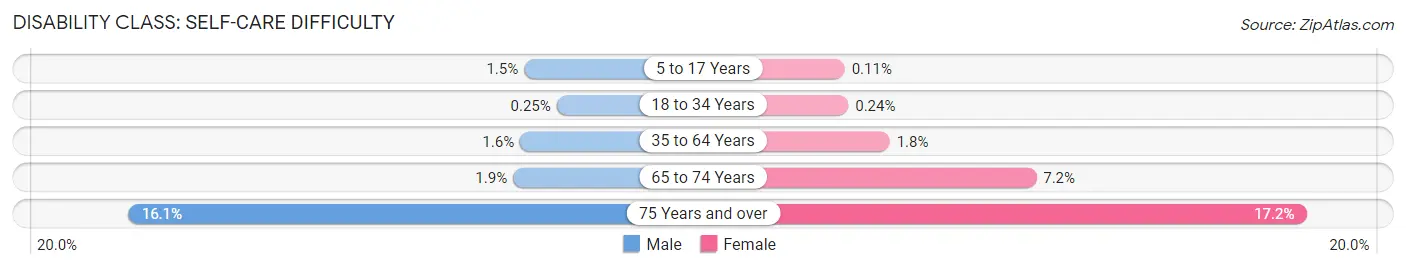
| Age Bracket | Male | Female |
| 5 to 17 Years | 152 (1.5%) | 9 (0.1%) |
| 18 to 34 Years | 28 (0.3%) | 27 (0.2%) |
| 35 to 64 Years | 299 (1.6%) | 333 (1.8%) |
| 65 to 74 Years | 48 (1.9%) | 223 (7.2%) |
| 75 Years and over | 240 (16.1%) | 308 (17.2%) |
Technology Access in Tracy
Computing Device Access in Tracy
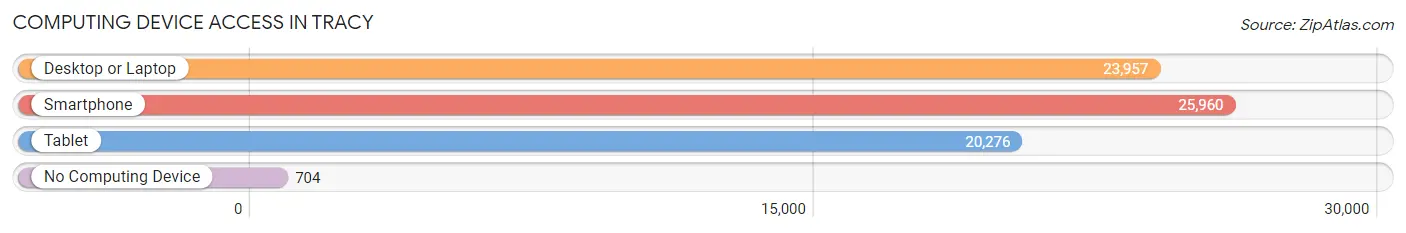
| Device Type | # Households | % Households |
| Desktop or Laptop | 23,957 | 86.7% |
| Smartphone | 25,960 | 93.9% |
| Tablet | 20,276 | 73.3% |
| No Computing Device | 704 | 2.5% |
| Total | 27,645 | 100.0% |
Internet Access in Tracy
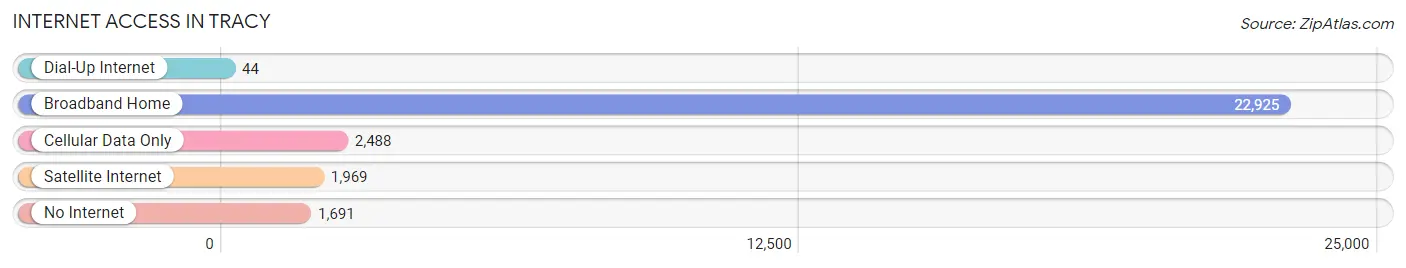
| Internet Type | # Households | % Households |
| Dial-Up Internet | 44 | 0.2% |
| Broadband Home | 22,925 | 82.9% |
| Cellular Data Only | 2,488 | 9.0% |
| Satellite Internet | 1,969 | 7.1% |
| No Internet | 1,691 | 6.1% |
| Total | 27,645 | 100.0% |
Tracy Summary
Tracy is a city located in San Joaquin County, California, United States. It is situated in the Central Valley, approximately 60 miles east of San Francisco and 40 miles south of Sacramento. The city has a population of approximately 82,000 people, making it the second-largest city in San Joaquin County.
History
Tracy was founded in 1878 by John B. Tracy, a former Union Army soldier who had served in the Civil War. He purchased a large tract of land in the area and began to develop it into a farming community. The city was incorporated in 1910 and has since grown to become a major hub for the Central Valley.
Geography
Tracy is located in the Central Valley of California, approximately 60 miles east of San Francisco and 40 miles south of Sacramento. The city is situated on the San Joaquin River, which provides a natural border between Tracy and the neighboring cities of Stockton and Lathrop. The city is surrounded by rolling hills and farmland, and is located in the heart of the Central Valley.
Economy
Tracy is a major hub for the Central Valley, and is home to a variety of industries. The city is home to several large companies, including Amazon, Walmart, and Target. The city is also home to a number of smaller businesses, including restaurants, retail stores, and service providers. The city is also home to a number of manufacturing and distribution centers, including the Tracy Distribution Center, which is the largest distribution center in the Central Valley.
Demographics
As of the 2010 census, Tracy had a population of 82,922 people. The racial makeup of the city was 57.2% White, 5.3% African American, 1.2% Native American, 8.2% Asian, 0.3% Pacific Islander, 24.2% from other races, and 3.7% from two or more races. Hispanic or Latino of any race were 44.2% of the population.
The median income for a household in the city was $60,945, and the median income for a family was $71,837. The per capita income for the city was $25,945. About 11.2% of families and 14.3% of the population were below the poverty line, including 19.2% of those under age 18 and 8.2% of those age 65 or over.
Conclusion
Tracy is a city located in San Joaquin County, California, United States. It is situated in the Central Valley, approximately 60 miles east of San Francisco and 40 miles south of Sacramento. The city has a population of approximately 82,000 people, making it the second-largest city in San Joaquin County. Tracy is a major hub for the Central Valley, and is home to a variety of industries. The city is home to several large companies, including Amazon, Walmart, and Target. The city is also home to a number of smaller businesses, including restaurants, retail stores, and service providers. The city is also home to a number of manufacturing and distribution centers. As of the 2010 census, Tracy had a population of 82,922 people. The racial makeup of the city was 57.2% White, 5.3% African American, 1.2% Native American, 8.2% Asian, 0.3% Pacific Islander, 24.2% from other races, and 3.7% from two or more races. Hispanic or Latino of any race were 44.2% of the population. The median income for a household in the city was $60,945, and the median income for a family was $71,837. The per capita income for the city was $25,945. Tracy is a vibrant city with a rich history and a bright future.
Common Questions
What is Per Capita Income in Tracy?
Per Capita income in Tracy is $40,041.
What is the Median Family Income in Tracy?
Median Family Income in Tracy is $120,421.
What is the Median Household income in Tracy?
Median Household Income in Tracy is $111,717.
What is Income or Wage Gap in Tracy?
Income or Wage Gap in Tracy is 39.0%.
Women in Tracy earn 61.0 cents for every dollar earned by a man.
What is Family Income Deficit in Tracy?
Family Income Deficit in Tracy is $9,992.
Families that are below poverty line in Tracy earn $9,992 less on average than the poverty threshold level.
What is Inequality or Gini Index in Tracy?
Inequality or Gini Index in Tracy is 0.37.
What is the Total Population of Tracy?
Total Population of Tracy is 94,027.
What is the Total Male Population of Tracy?
Total Male Population of Tracy is 47,651.
What is the Total Female Population of Tracy?
Total Female Population of Tracy is 46,376.
What is the Ratio of Males per 100 Females in Tracy?
There are 102.75 Males per 100 Females in Tracy.
What is the Ratio of Females per 100 Males in Tracy?
There are 97.32 Females per 100 Males in Tracy.
What is the Median Population Age in Tracy?
Median Population Age in Tracy is 34.4 Years.
What is the Average Family Size in Tracy
Average Family Size in Tracy is 3.7 People.
What is the Average Household Size in Tracy
Average Household Size in Tracy is 3.4 People.
How Large is the Labor Force in Tracy?
There are 48,813 People in the Labor Forcein in Tracy.
What is the Percentage of People in the Labor Force in Tracy?
68.3% of People are in the Labor Force in Tracy.
What is the Unemployment Rate in Tracy?
Unemployment Rate in Tracy is 5.4%.