Richmond, CA Map & Demographics
Richmond Map
Richmond Overview
$38,522
PER CAPITA INCOME
$92,312
AVG FAMILY INCOME
$86,618
AVG HOUSEHOLD INCOME
20.1%
WAGE / INCOME GAP [ % ]
79.9¢/ $1
WAGE / INCOME GAP [ $ ]
$13,405
FAMILY INCOME DEFICIT
0.44
INEQUALITY / GINI INDEX
115,619
TOTAL POPULATION
57,131
MALE POPULATION
58,488
FEMALE POPULATION
97.68
MALES / 100 FEMALES
102.38
FEMALES / 100 MALES
37.1
MEDIAN AGE
3.5
AVG FAMILY SIZE
2.9
AVG HOUSEHOLD SIZE
62,690
LABOR FORCE [ PEOPLE ]
66.6%
PERCENT IN LABOR FORCE
6.9%
UNEMPLOYMENT RATE
Richmond Area Codes
Income in Richmond
Income Overview in Richmond
Per Capita Income in Richmond is $38,522, while median incomes of families and households are $92,312 and $86,618 respectively.
| Characteristic | Number | Measure |
| Per Capita Income | 115,619 | $38,522 |
| Median Family Income | 26,516 | $92,312 |
| Mean Family Income | 26,516 | $116,360 |
| Median Household Income | 39,618 | $86,618 |
| Mean Household Income | 39,618 | $108,861 |
| Income Deficit | 26,516 | $13,405 |
| Wage / Income Gap (%) | 115,619 | 20.12% |
| Wage / Income Gap ($) | 115,619 | 79.88¢ per $1 |
| Gini / Inequality Index | 115,619 | 0.44 |
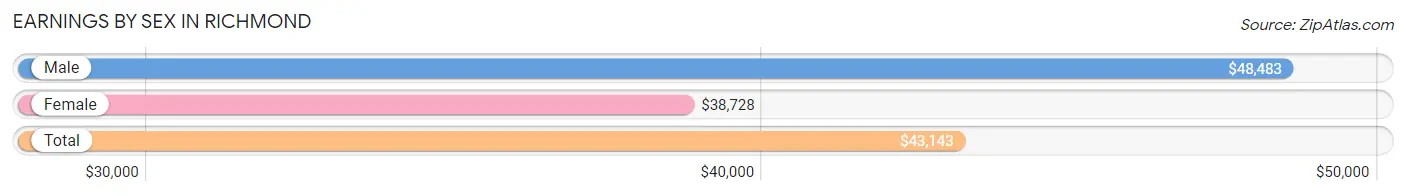
Earnings by Sex in Richmond
Average Earnings in Richmond are $43,143, $48,483 for men and $38,728 for women, a difference of 20.1%.
| Sex | Number | Average Earnings |
| Male | 32,151 (51.1%) | $48,483 |
| Female | 30,741 (48.9%) | $38,728 |
| Total | 62,892 (100.0%) | $43,143 |
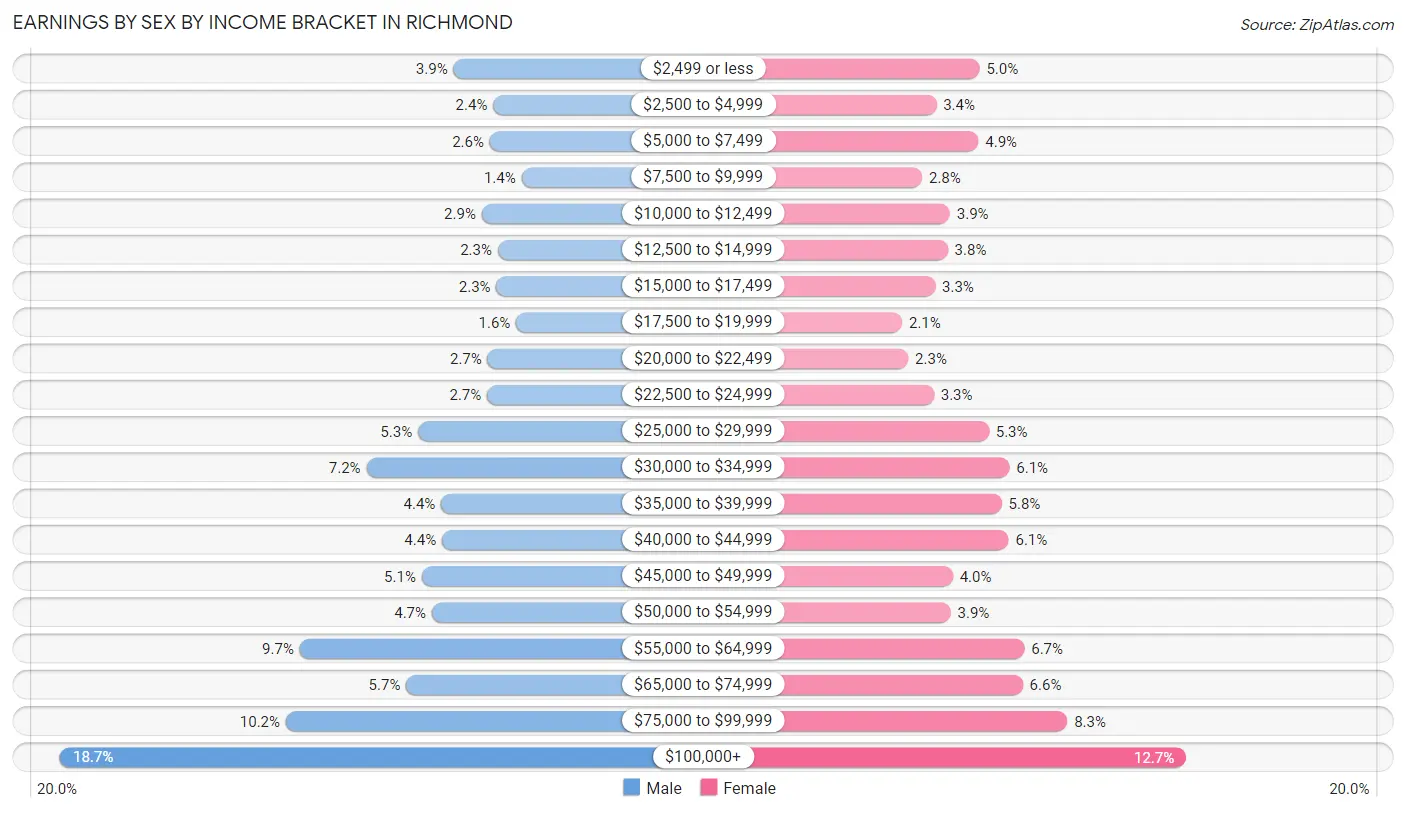
Earnings by Sex by Income Bracket in Richmond
The most common earnings brackets in Richmond are $100,000+ for men (6,002 | 18.7%) and $100,000+ for women (3,908 | 12.7%).
| Income | Male | Female |
| $2,499 or less | 1,265 (3.9%) | 1,528 (5.0%) |
| $2,500 to $4,999 | 786 (2.4%) | 1,030 (3.4%) |
| $5,000 to $7,499 | 825 (2.6%) | 1,517 (4.9%) |
| $7,500 to $9,999 | 443 (1.4%) | 867 (2.8%) |
| $10,000 to $12,499 | 924 (2.9%) | 1,188 (3.9%) |
| $12,500 to $14,999 | 730 (2.3%) | 1,163 (3.8%) |
| $15,000 to $17,499 | 746 (2.3%) | 1,017 (3.3%) |
| $17,500 to $19,999 | 507 (1.6%) | 636 (2.1%) |
| $20,000 to $22,499 | 852 (2.6%) | 707 (2.3%) |
| $22,500 to $24,999 | 859 (2.7%) | 1,001 (3.3%) |
| $25,000 to $29,999 | 1,691 (5.3%) | 1,634 (5.3%) |
| $30,000 to $34,999 | 2,313 (7.2%) | 1,873 (6.1%) |
| $35,000 to $39,999 | 1,410 (4.4%) | 1,782 (5.8%) |
| $40,000 to $44,999 | 1,401 (4.4%) | 1,864 (6.1%) |
| $45,000 to $49,999 | 1,645 (5.1%) | 1,221 (4.0%) |
| $50,000 to $54,999 | 1,523 (4.7%) | 1,196 (3.9%) |
| $55,000 to $64,999 | 3,114 (9.7%) | 2,045 (6.7%) |
| $65,000 to $74,999 | 1,831 (5.7%) | 2,026 (6.6%) |
| $75,000 to $99,999 | 3,284 (10.2%) | 2,538 (8.3%) |
| $100,000+ | 6,002 (18.7%) | 3,908 (12.7%) |
| Total | 32,151 (100.0%) | 30,741 (100.0%) |
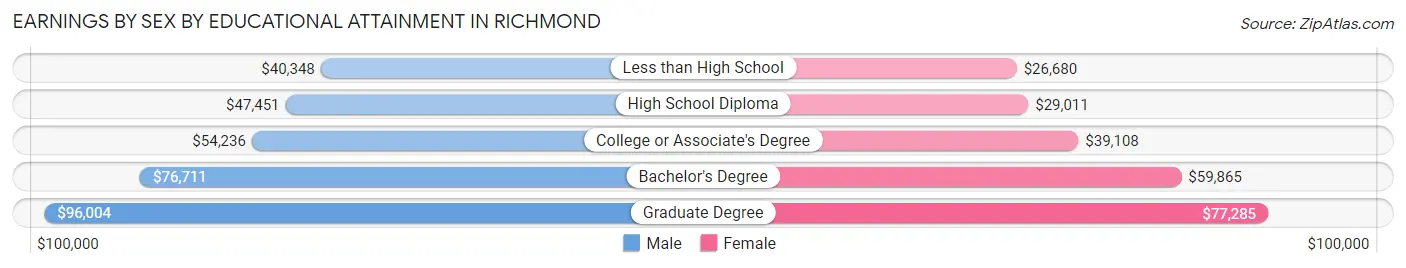
Earnings by Sex by Educational Attainment in Richmond
Average earnings in Richmond are $55,013 for men and $41,958 for women, a difference of 23.7%. Men with an educational attainment of graduate degree enjoy the highest average annual earnings of $96,004, while those with less than high school education earn the least with $40,348. Women with an educational attainment of graduate degree earn the most with the average annual earnings of $77,285, while those with less than high school education have the smallest earnings of $26,680.
| Educational Attainment | Male Income | Female Income |
| Less than High School | $40,348 | $26,680 |
| High School Diploma | $47,451 | $29,011 |
| College or Associate's Degree | $54,236 | $39,108 |
| Bachelor's Degree | $76,711 | $59,865 |
| Graduate Degree | $96,004 | $77,285 |
| Total | $55,013 | $41,958 |
Family Income in Richmond
Family Income Brackets in Richmond
According to the Richmond family income data, there are 5,409 families falling into the $100,000 to $149,999 income range, which is the most common income bracket and makes up 20.4% of all families. Conversely, the $10,000 to $14,999 income bracket is the least frequent group with only 504 families (1.9%) belonging to this category.
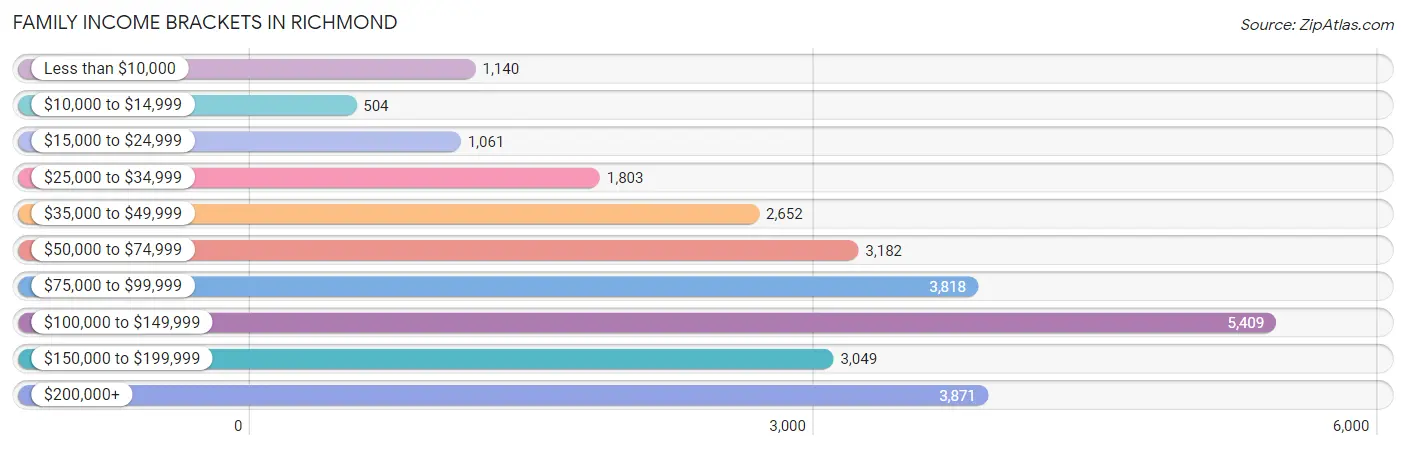
| Income Bracket | # Families | % Families |
| Less than $10,000 | 1,140 | 4.3% |
| $10,000 to $14,999 | 504 | 1.9% |
| $15,000 to $24,999 | 1,061 | 4.0% |
| $25,000 to $34,999 | 1,803 | 6.8% |
| $35,000 to $49,999 | 2,652 | 10.0% |
| $50,000 to $74,999 | 3,182 | 12.0% |
| $75,000 to $99,999 | 3,818 | 14.4% |
| $100,000 to $149,999 | 5,409 | 20.4% |
| $150,000 to $199,999 | 3,049 | 11.5% |
| $200,000+ | 3,871 | 14.6% |
Family Income by Famaliy Size in Richmond
7+ person families (1,008 | 3.8%) account for the highest median family income in Richmond with $146,573 per family, while 2-person families (9,267 | 34.9%) have the highest median income of $41,425 per family member.
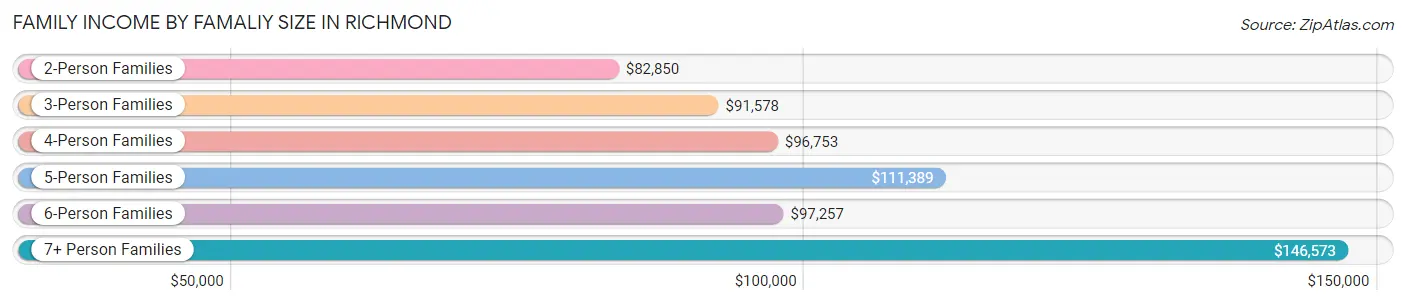
| Income Bracket | # Families | Median Income |
| 2-Person Families | 9,267 (34.9%) | $82,850 |
| 3-Person Families | 6,887 (26.0%) | $91,578 |
| 4-Person Families | 5,286 (19.9%) | $96,753 |
| 5-Person Families | 2,636 (9.9%) | $111,389 |
| 6-Person Families | 1,432 (5.4%) | $97,257 |
| 7+ Person Families | 1,008 (3.8%) | $146,573 |
| Total | 26,516 (100.0%) | $92,312 |
Family Income by Number of Earners in Richmond
The median family income in Richmond is $92,312, with families comprising 3+ earners (4,915) having the highest median family income of $146,198, while families with no earners (2,904) have the lowest median family income of $29,784, accounting for 18.5% and 11.0% of families, respectively.
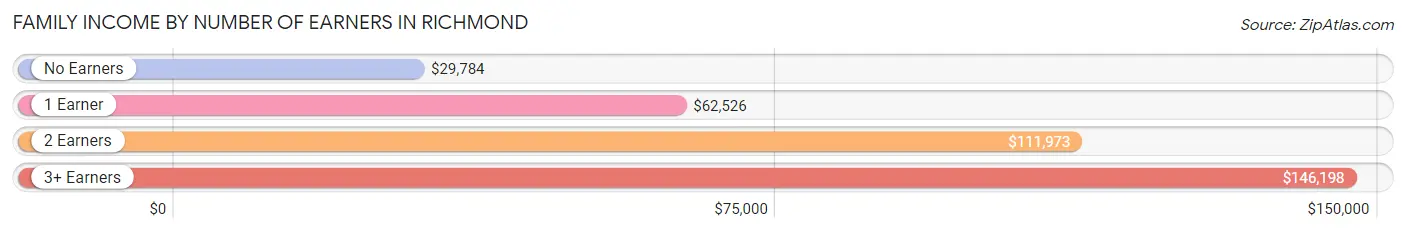
| Number of Earners | # Families | Median Income |
| No Earners | 2,904 (11.0%) | $29,784 |
| 1 Earner | 8,421 (31.8%) | $62,526 |
| 2 Earners | 10,276 (38.8%) | $111,973 |
| 3+ Earners | 4,915 (18.5%) | $146,198 |
| Total | 26,516 (100.0%) | $92,312 |
Household Income in Richmond
Household Income Brackets in Richmond
With 7,726 households falling in the category, the $100,000 to $149,999 income range is the most frequent in Richmond, accounting for 19.5% of all households. In contrast, only 1,783 households (4.5%) fall into the $10,000 to $14,999 income bracket, making it the least populous group.
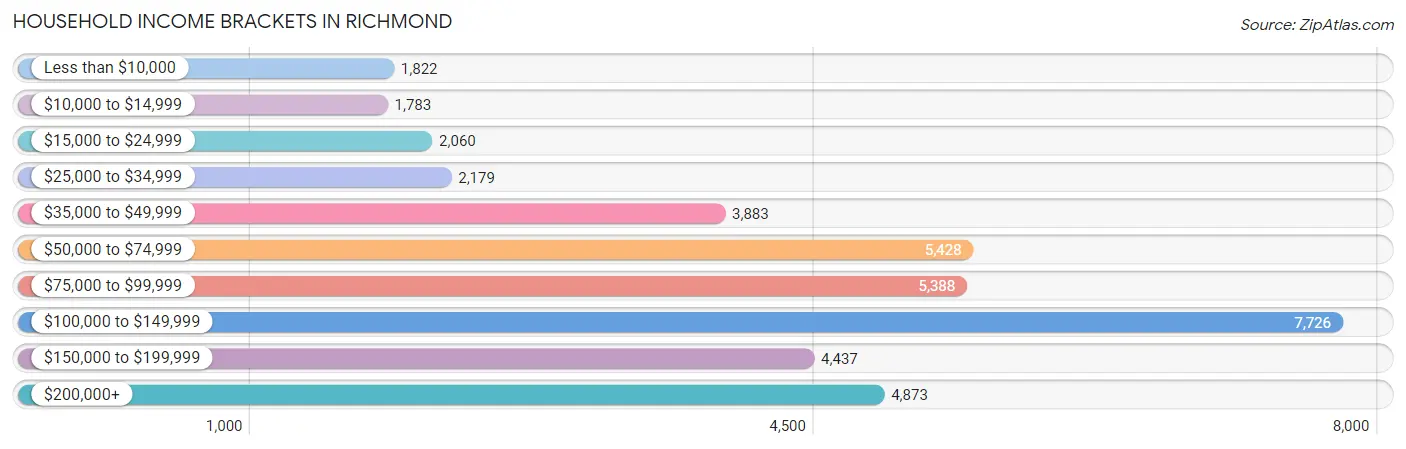
| Income Bracket | # Households | % Households |
| Less than $10,000 | 1,822 | 4.6% |
| $10,000 to $14,999 | 1,783 | 4.5% |
| $15,000 to $24,999 | 2,060 | 5.2% |
| $25,000 to $34,999 | 2,179 | 5.5% |
| $35,000 to $49,999 | 3,883 | 9.8% |
| $50,000 to $74,999 | 5,428 | 13.7% |
| $75,000 to $99,999 | 5,388 | 13.6% |
| $100,000 to $149,999 | 7,726 | 19.5% |
| $150,000 to $199,999 | 4,437 | 11.2% |
| $200,000+ | 4,873 | 12.3% |
Household Income by Householder Age in Richmond
The median household income in Richmond is $86,618, with the highest median household income of $95,816 found in the 45 to 64 years age bracket for the primary householder. A total of 15,219 households (38.4%) fall into this category. Meanwhile, the 65+ years age bracket for the primary householder has the lowest median household income of $63,182, with 9,867 households (24.9%) in this group.
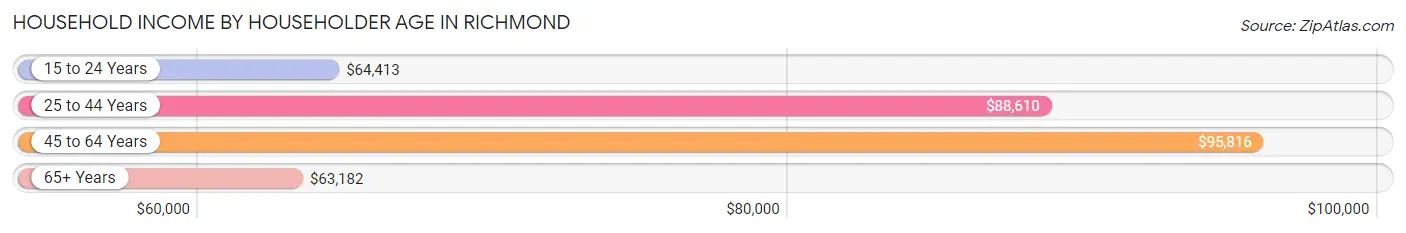
| Income Bracket | # Households | Median Income |
| 15 to 24 Years | 1,193 (3.0%) | $64,413 |
| 25 to 44 Years | 13,339 (33.7%) | $88,610 |
| 45 to 64 Years | 15,219 (38.4%) | $95,816 |
| 65+ Years | 9,867 (24.9%) | $63,182 |
| Total | 39,618 (100.0%) | $86,618 |
Poverty in Richmond
Income Below Poverty by Sex and Age in Richmond
With 13.4% poverty level for males and 15.2% for females among the residents of Richmond, 15 year old males and 5 year old females are the most vulnerable to poverty, with 234 males (35.2%) and 288 females (37.0%) in their respective age groups living below the poverty level.
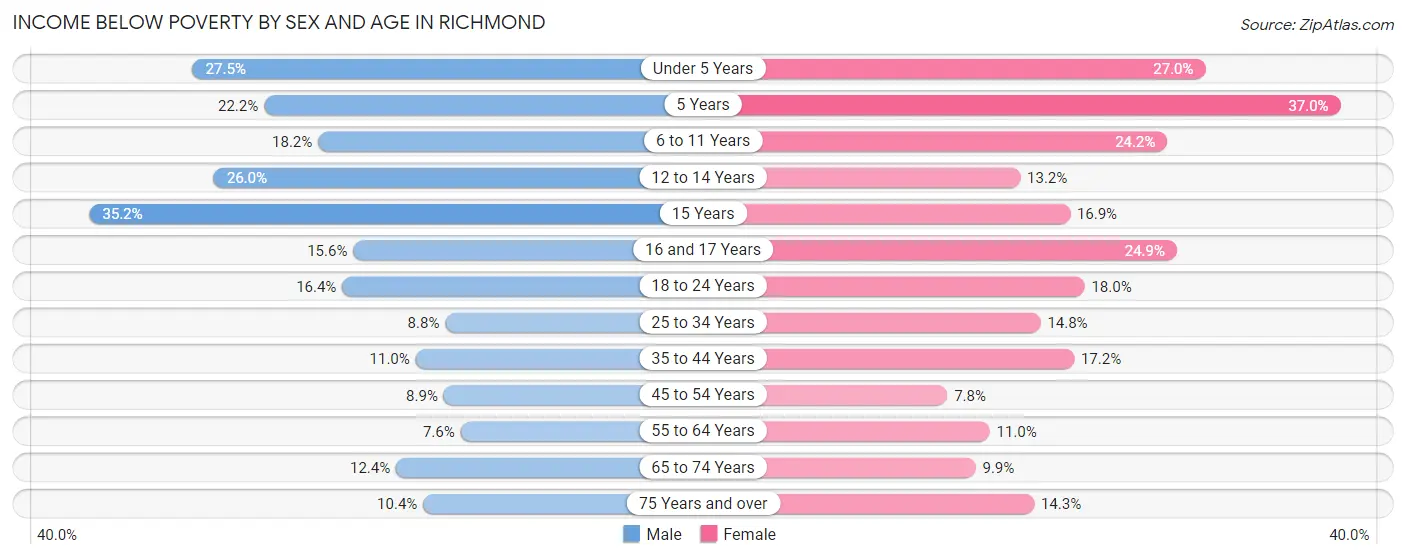
| Age Bracket | Male | Female |
| Under 5 Years | 959 (27.5%) | 733 (27.0%) |
| 5 Years | 116 (22.2%) | 288 (37.0%) |
| 6 to 11 Years | 733 (18.2%) | 926 (24.2%) |
| 12 to 14 Years | 620 (26.0%) | 254 (13.2%) |
| 15 Years | 234 (35.2%) | 126 (16.9%) |
| 16 and 17 Years | 321 (15.6%) | 294 (24.9%) |
| 18 to 24 Years | 947 (16.4%) | 952 (18.0%) |
| 25 to 34 Years | 747 (8.8%) | 1,396 (14.7%) |
| 35 to 44 Years | 874 (11.0%) | 1,455 (17.2%) |
| 45 to 54 Years | 682 (8.9%) | 614 (7.8%) |
| 55 to 64 Years | 481 (7.6%) | 726 (11.0%) |
| 65 to 74 Years | 600 (12.4%) | 591 (9.9%) |
| 75 Years and over | 236 (10.4%) | 468 (14.3%) |
| Total | 7,550 (13.4%) | 8,823 (15.2%) |
Income Above Poverty by Sex and Age in Richmond
According to the poverty statistics in Richmond, males aged 55 to 64 years and females aged 45 to 54 years are the age groups that are most secure financially, with 92.4% of males and 92.2% of females in these age groups living above the poverty line.
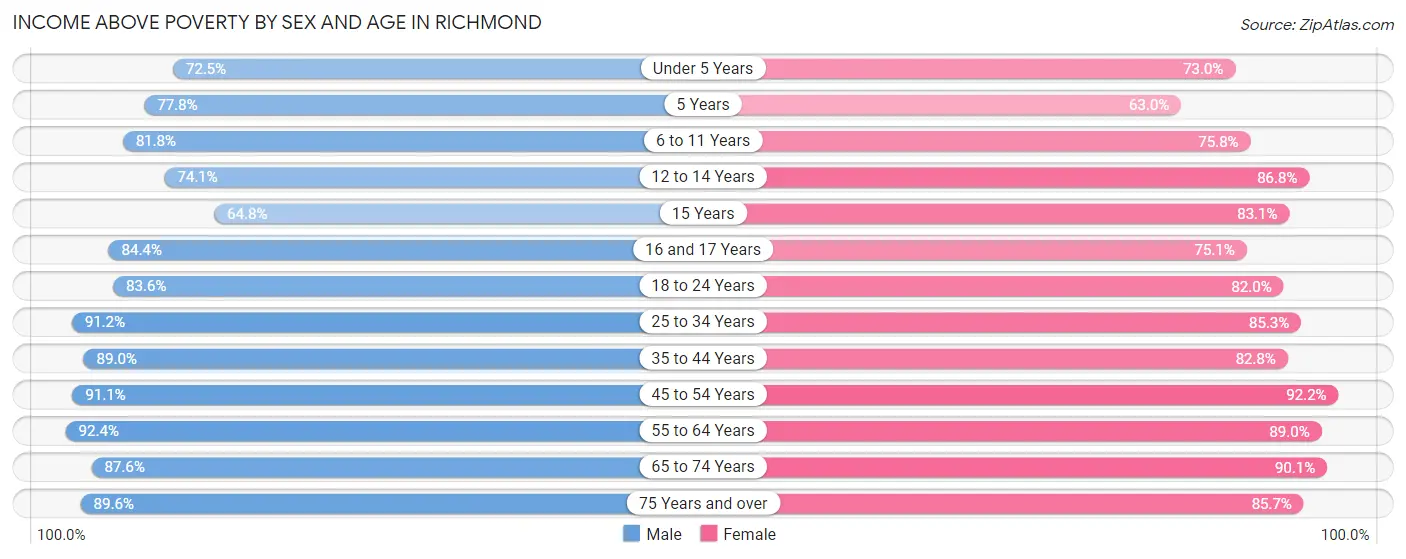
| Age Bracket | Male | Female |
| Under 5 Years | 2,526 (72.5%) | 1,983 (73.0%) |
| 5 Years | 406 (77.8%) | 490 (63.0%) |
| 6 to 11 Years | 3,292 (81.8%) | 2,906 (75.8%) |
| 12 to 14 Years | 1,769 (74.1%) | 1,665 (86.8%) |
| 15 Years | 431 (64.8%) | 618 (83.1%) |
| 16 and 17 Years | 1,737 (84.4%) | 888 (75.1%) |
| 18 to 24 Years | 4,819 (83.6%) | 4,330 (82.0%) |
| 25 to 34 Years | 7,768 (91.2%) | 8,066 (85.3%) |
| 35 to 44 Years | 7,093 (89.0%) | 6,985 (82.8%) |
| 45 to 54 Years | 6,994 (91.1%) | 7,224 (92.2%) |
| 55 to 64 Years | 5,822 (92.4%) | 5,893 (89.0%) |
| 65 to 74 Years | 4,231 (87.6%) | 5,358 (90.1%) |
| 75 Years and over | 2,030 (89.6%) | 2,811 (85.7%) |
| Total | 48,918 (86.6%) | 49,217 (84.8%) |
Income Below Poverty Among Married-Couple Families in Richmond
The poverty statistics for married-couple families in Richmond show that 6.0% or 1,023 of the total 17,084 families live below the poverty line. Families with 3 or 4 children have the highest poverty rate of 30.1%, comprising of 326 families. On the other hand, families with 5 or more children have the lowest poverty rate of 0.0%, which includes 0 families.
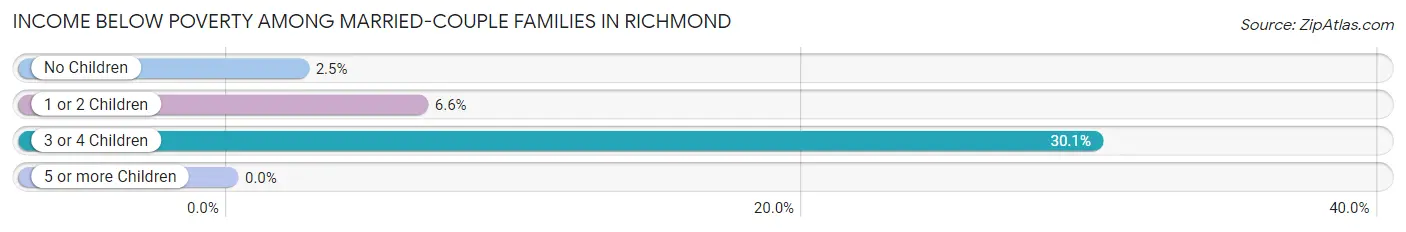
| Children | Above Poverty | Below Poverty |
| No Children | 8,402 (97.5%) | 212 (2.5%) |
| 1 or 2 Children | 6,850 (93.4%) | 485 (6.6%) |
| 3 or 4 Children | 757 (69.9%) | 326 (30.1%) |
| 5 or more Children | 52 (100.0%) | 0 (0.0%) |
| Total | 16,061 (94.0%) | 1,023 (6.0%) |
Income Below Poverty Among Single-Parent Households in Richmond
According to the poverty data in Richmond, 9.5% or 287 single-father households and 23.6% or 1,508 single-mother households are living below the poverty line. Among single-father households, those with 5 or more children have the highest poverty rate, with 22 households (84.6%) experiencing poverty. Likewise, among single-mother households, those with 5 or more children have the highest poverty rate, with 96 households (100.0%) falling below the poverty line.
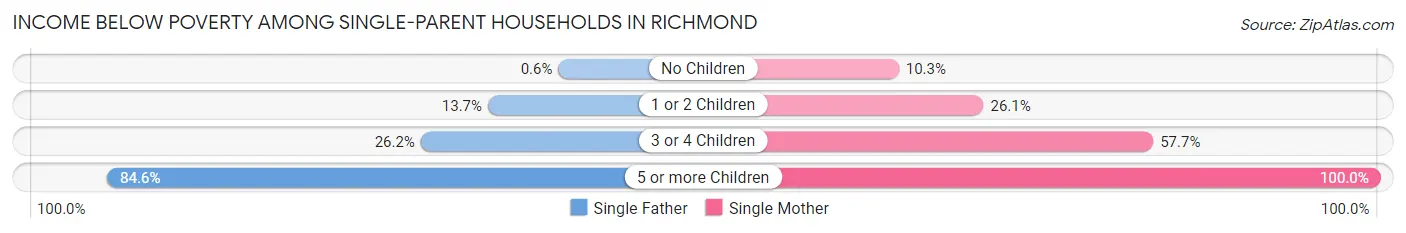
| Children | Single Father | Single Mother |
| No Children | 8 (0.6%) | 259 (10.3%) |
| 1 or 2 Children | 198 (13.7%) | 848 (26.1%) |
| 3 or 4 Children | 59 (26.2%) | 305 (57.7%) |
| 5 or more Children | 22 (84.6%) | 96 (100.0%) |
| Total | 287 (9.5%) | 1,508 (23.6%) |
Income Below Poverty Among Married-Couple vs Single-Parent Households in Richmond
The poverty data for Richmond shows that 1,023 of the married-couple family households (6.0%) and 1,795 of the single-parent households (19.0%) are living below the poverty level. Within the married-couple family households, those with 3 or 4 children have the highest poverty rate, with 326 households (30.1%) falling below the poverty line. Among the single-parent households, those with 5 or more children have the highest poverty rate, with 118 household (96.7%) living below poverty.
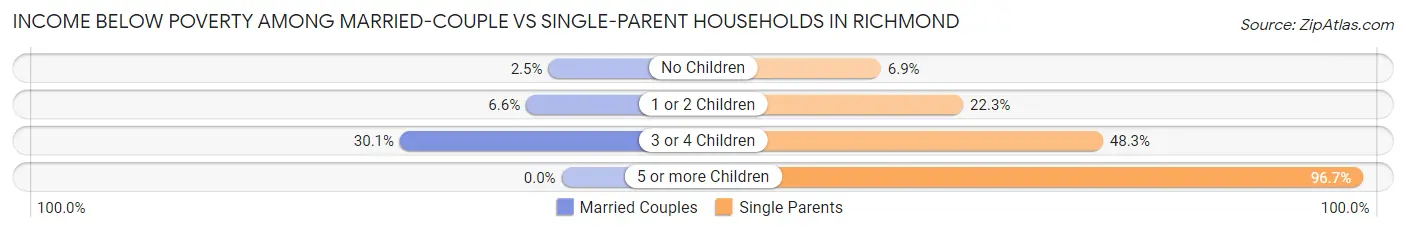
| Children | Married-Couple Families | Single-Parent Households |
| No Children | 212 (2.5%) | 267 (6.9%) |
| 1 or 2 Children | 485 (6.6%) | 1,046 (22.3%) |
| 3 or 4 Children | 326 (30.1%) | 364 (48.3%) |
| 5 or more Children | 0 (0.0%) | 118 (96.7%) |
| Total | 1,023 (6.0%) | 1,795 (19.0%) |
Race in Richmond
The most populous races in Richmond are Hispanic or Latino (50,886 | 44.0%), Some other Race (32,710 | 28.3%), and White / Caucasian (28,007 | 24.2%).
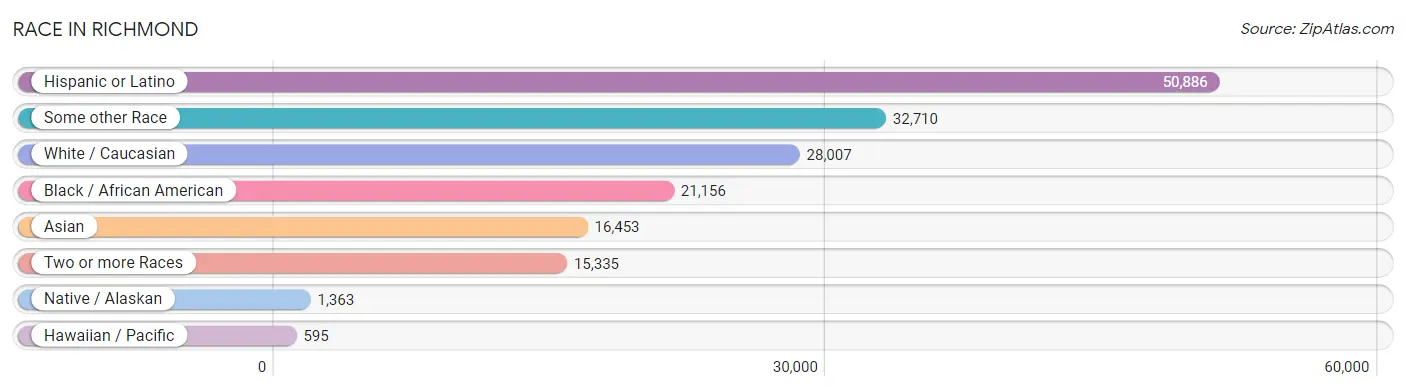
| Race | # Population | % Population |
| Asian | 16,453 | 14.2% |
| Black / African American | 21,156 | 18.3% |
| Hawaiian / Pacific | 595 | 0.5% |
| Hispanic or Latino | 50,886 | 44.0% |
| Native / Alaskan | 1,363 | 1.2% |
| White / Caucasian | 28,007 | 24.2% |
| Two or more Races | 15,335 | 13.3% |
| Some other Race | 32,710 | 28.3% |
| Total | 115,619 | 100.0% |
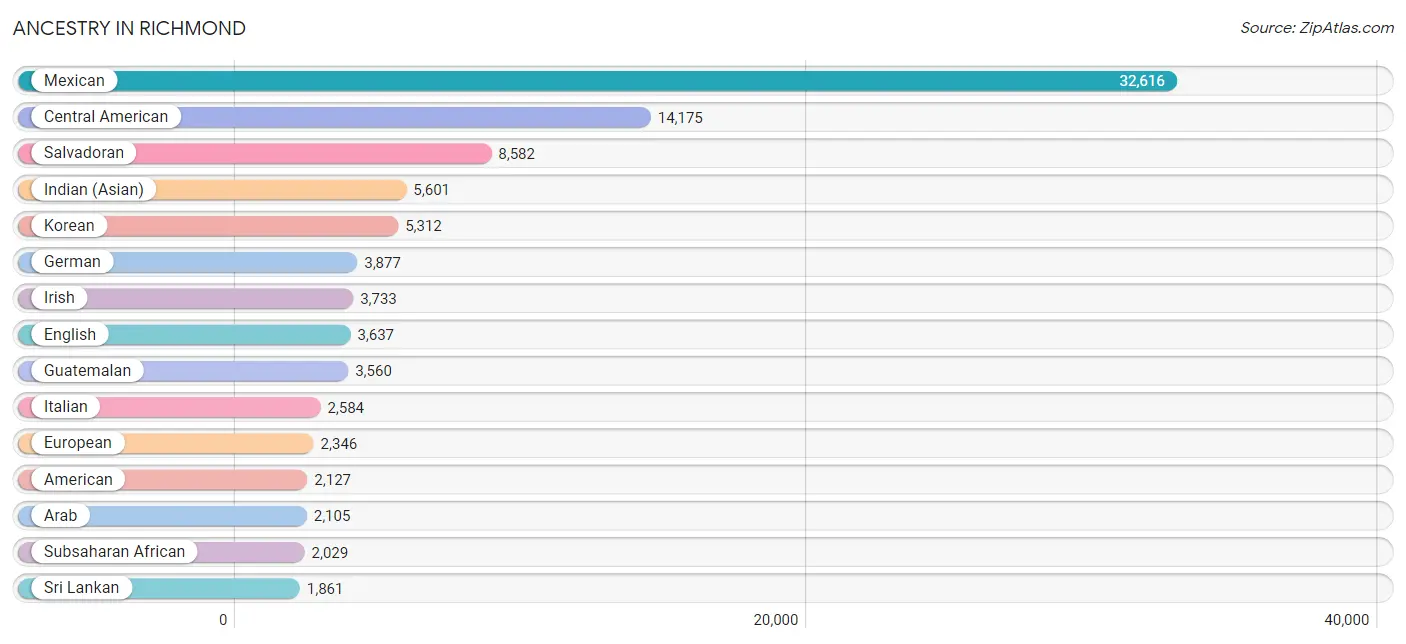
Ancestry in Richmond
The most populous ancestries reported in Richmond are Mexican (32,616 | 28.2%), Central American (14,175 | 12.3%), Salvadoran (8,582 | 7.4%), Indian (Asian) (5,601 | 4.8%), and Korean (5,312 | 4.6%), together accounting for 57.3% of all Richmond residents.
| Ancestry | # Population | % Population |
| Afghan | 78 | 0.1% |
| African | 1,257 | 1.1% |
| Albanian | 32 | 0.0% |
| Aleut | 3 | 0.0% |
| American | 2,127 | 1.8% |
| Apache | 14 | 0.0% |
| Arab | 2,105 | 1.8% |
| Argentinean | 10 | 0.0% |
| Armenian | 63 | 0.1% |
| Assyrian / Chaldean / Syriac | 8 | 0.0% |
| Australian | 53 | 0.1% |
| Austrian | 63 | 0.1% |
| Basque | 18 | 0.0% |
| Belgian | 45 | 0.0% |
| Belizean | 32 | 0.0% |
| Bhutanese | 1,409 | 1.2% |
| Blackfeet | 14 | 0.0% |
| Brazilian | 1,684 | 1.5% |
| British | 329 | 0.3% |
| Bulgarian | 33 | 0.0% |
| Burmese | 927 | 0.8% |
| Cambodian | 12 | 0.0% |
| Canadian | 23 | 0.0% |
| Central American | 14,175 | 12.3% |
| Central American Indian | 367 | 0.3% |
| Cherokee | 630 | 0.5% |
| Chickasaw | 53 | 0.1% |
| Chilean | 139 | 0.1% |
| Choctaw | 51 | 0.0% |
| Colombian | 246 | 0.2% |
| Costa Rican | 80 | 0.1% |
| Cree | 4 | 0.0% |
| Creek | 52 | 0.0% |
| Croatian | 79 | 0.1% |
| Cuban | 149 | 0.1% |
| Czech | 196 | 0.2% |
| Danish | 245 | 0.2% |
| Dominican | 35 | 0.0% |
| Dutch | 544 | 0.5% |
| Eastern European | 217 | 0.2% |
| Ecuadorian | 286 | 0.3% |
| Egyptian | 26 | 0.0% |
| English | 3,637 | 3.2% |
| Estonian | 36 | 0.0% |
| Ethiopian | 242 | 0.2% |
| European | 2,346 | 2.0% |
| Filipino | 252 | 0.2% |
| Finnish | 112 | 0.1% |
| French | 1,008 | 0.9% |
| French Canadian | 5 | 0.0% |
| German | 3,877 | 3.4% |
| Ghanaian | 25 | 0.0% |
| Greek | 214 | 0.2% |
| Guamanian / Chamorro | 43 | 0.0% |
| Guatemalan | 3,560 | 3.1% |
| Honduran | 908 | 0.8% |
| Hungarian | 137 | 0.1% |
| Icelander | 35 | 0.0% |
| Indian (Asian) | 5,601 | 4.8% |
| Inupiat | 39 | 0.0% |
| Iranian | 200 | 0.2% |
| Iraqi | 24 | 0.0% |
| Irish | 3,733 | 3.2% |
| Iroquois | 16 | 0.0% |
| Israeli | 89 | 0.1% |
| Italian | 2,584 | 2.2% |
| Jamaican | 56 | 0.1% |
| Japanese | 613 | 0.5% |
| Kenyan | 338 | 0.3% |
| Korean | 5,312 | 4.6% |
| Laotian | 289 | 0.3% |
| Latvian | 35 | 0.0% |
| Lebanese | 149 | 0.1% |
| Lithuanian | 44 | 0.0% |
| Luxembourger | 14 | 0.0% |
| Malaysian | 1,667 | 1.4% |
| Mexican | 32,616 | 28.2% |
| Mexican American Indian | 758 | 0.7% |
| Mongolian | 54 | 0.1% |
| Moroccan | 53 | 0.1% |
| Native Hawaiian | 486 | 0.4% |
| Navajo | 36 | 0.0% |
| Nepalese | 182 | 0.2% |
| Nicaraguan | 1,039 | 0.9% |
| Nigerian | 71 | 0.1% |
| Northern European | 160 | 0.1% |
| Norwegian | 528 | 0.5% |
| Pakistani | 231 | 0.2% |
| Palestinian | 10 | 0.0% |
| Panamanian | 6 | 0.0% |
| Peruvian | 834 | 0.7% |
| Polish | 840 | 0.7% |
| Portuguese | 669 | 0.6% |
| Puerto Rican | 593 | 0.5% |
| Romanian | 22 | 0.0% |
| Russian | 519 | 0.4% |
| Salvadoran | 8,582 | 7.4% |
| Samoan | 291 | 0.3% |
| Scandinavian | 213 | 0.2% |
| Scotch-Irish | 239 | 0.2% |
| Scottish | 675 | 0.6% |
| Serbian | 8 | 0.0% |
| Sierra Leonean | 25 | 0.0% |
| Sioux | 1 | 0.0% |
| Slavic | 26 | 0.0% |
| Slovak | 56 | 0.1% |
| Slovene | 39 | 0.0% |
| South American | 1,610 | 1.4% |
| South American Indian | 251 | 0.2% |
| Spaniard | 504 | 0.4% |
| Spanish | 451 | 0.4% |
| Sri Lankan | 1,861 | 1.6% |
| Subsaharan African | 2,029 | 1.8% |
| Swedish | 457 | 0.4% |
| Swiss | 102 | 0.1% |
| Syrian | 6 | 0.0% |
| Thai | 1,051 | 0.9% |
| Tohono O'Odham | 14 | 0.0% |
| Tongan | 145 | 0.1% |
| Turkish | 30 | 0.0% |
| Ukrainian | 169 | 0.2% |
| Uruguayan | 13 | 0.0% |
| Venezuelan | 64 | 0.1% |
| Welsh | 461 | 0.4% |
| West Indian | 13 | 0.0% |
| Yugoslavian | 22 | 0.0% | View All 126 Rows |
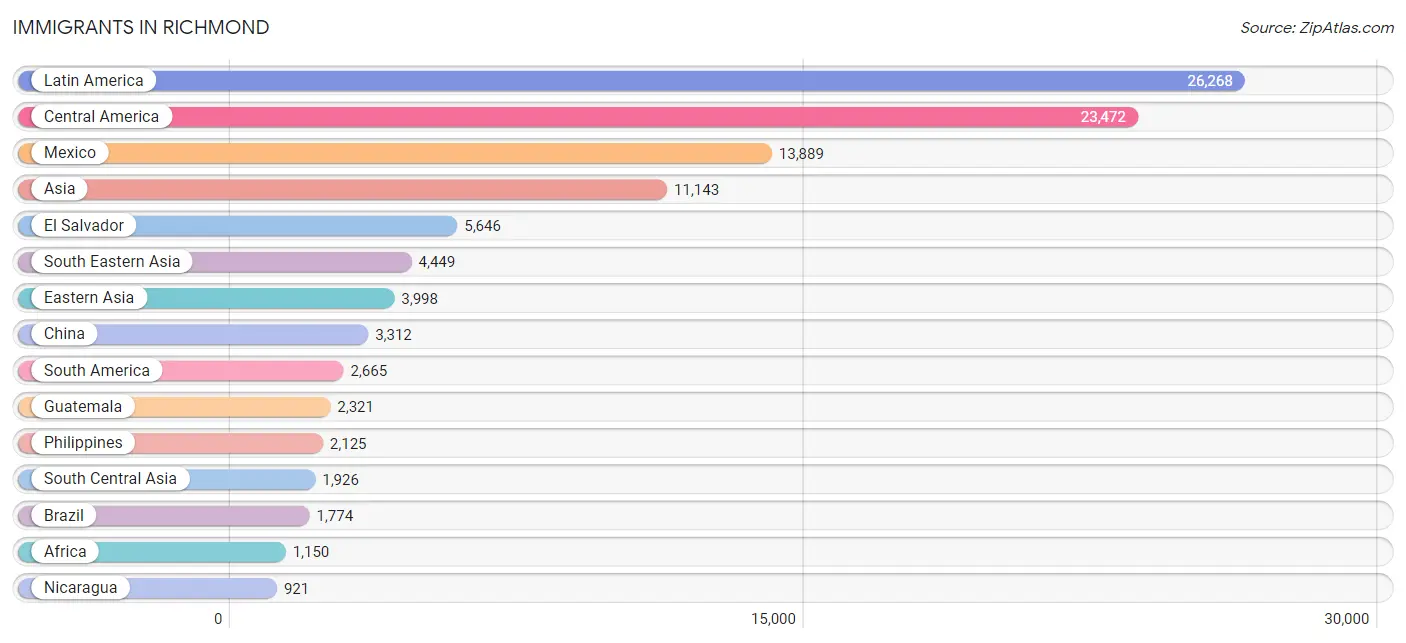
Immigrants in Richmond
The most numerous immigrant groups reported in Richmond came from Latin America (26,268 | 22.7%), Central America (23,472 | 20.3%), Mexico (13,889 | 12.0%), Asia (11,143 | 9.6%), and El Salvador (5,646 | 4.9%), together accounting for 69.6% of all Richmond residents.
| Immigration Origin | # Population | % Population |
| Afghanistan | 87 | 0.1% |
| Africa | 1,150 | 1.0% |
| Albania | 10 | 0.0% |
| Asia | 11,143 | 9.6% |
| Australia | 71 | 0.1% |
| Azores | 15 | 0.0% |
| Bangladesh | 1 | 0.0% |
| Belgium | 12 | 0.0% |
| Belize | 58 | 0.1% |
| Brazil | 1,774 | 1.5% |
| Bulgaria | 33 | 0.0% |
| Cambodia | 44 | 0.0% |
| Canada | 154 | 0.1% |
| Caribbean | 131 | 0.1% |
| Central America | 23,472 | 20.3% |
| Chile | 65 | 0.1% |
| China | 3,312 | 2.9% |
| Colombia | 139 | 0.1% |
| Cuba | 51 | 0.0% |
| Czechoslovakia | 23 | 0.0% |
| Dominican Republic | 44 | 0.0% |
| Eastern Africa | 496 | 0.4% |
| Eastern Asia | 3,998 | 3.5% |
| Eastern Europe | 235 | 0.2% |
| Ecuador | 70 | 0.1% |
| El Salvador | 5,646 | 4.9% |
| England | 28 | 0.0% |
| Eritrea | 30 | 0.0% |
| Ethiopia | 208 | 0.2% |
| Europe | 783 | 0.7% |
| Fiji | 168 | 0.2% |
| France | 21 | 0.0% |
| Germany | 60 | 0.1% |
| Guatemala | 2,321 | 2.0% |
| Honduras | 637 | 0.5% |
| Hong Kong | 814 | 0.7% |
| Hungary | 8 | 0.0% |
| India | 626 | 0.5% |
| Indonesia | 178 | 0.2% |
| Iran | 87 | 0.1% |
| Ireland | 37 | 0.0% |
| Israel | 141 | 0.1% |
| Italy | 40 | 0.0% |
| Jamaica | 36 | 0.0% |
| Japan | 119 | 0.1% |
| Kenya | 208 | 0.2% |
| Korea | 555 | 0.5% |
| Kuwait | 45 | 0.0% |
| Laos | 673 | 0.6% |
| Latin America | 26,268 | 22.7% |
| Lebanon | 27 | 0.0% |
| Malaysia | 103 | 0.1% |
| Mexico | 13,889 | 12.0% |
| Morocco | 45 | 0.0% |
| Nepal | 450 | 0.4% |
| Nicaragua | 921 | 0.8% |
| Nigeria | 64 | 0.1% |
| Northern Africa | 443 | 0.4% |
| Northern Europe | 143 | 0.1% |
| Norway | 8 | 0.0% |
| Oceania | 252 | 0.2% |
| Pakistan | 595 | 0.5% |
| Peru | 533 | 0.5% |
| Philippines | 2,125 | 1.8% |
| Poland | 23 | 0.0% |
| Portugal | 45 | 0.0% |
| Russia | 92 | 0.1% |
| Saudi Arabia | 26 | 0.0% |
| Singapore | 13 | 0.0% |
| South America | 2,665 | 2.3% |
| South Central Asia | 1,926 | 1.7% |
| South Eastern Asia | 4,449 | 3.8% |
| Southern Europe | 207 | 0.2% |
| Spain | 122 | 0.1% |
| Sri Lanka | 62 | 0.1% |
| Switzerland | 26 | 0.0% |
| Syria | 6 | 0.0% |
| Taiwan | 529 | 0.5% |
| Thailand | 408 | 0.4% |
| Turkey | 43 | 0.0% |
| Ukraine | 37 | 0.0% |
| Uruguay | 13 | 0.0% |
| Venezuela | 71 | 0.1% |
| Vietnam | 875 | 0.8% |
| Western Africa | 87 | 0.1% |
| Western Asia | 697 | 0.6% |
| Western Europe | 119 | 0.1% |
| Yemen | 409 | 0.4% | View All 88 Rows |
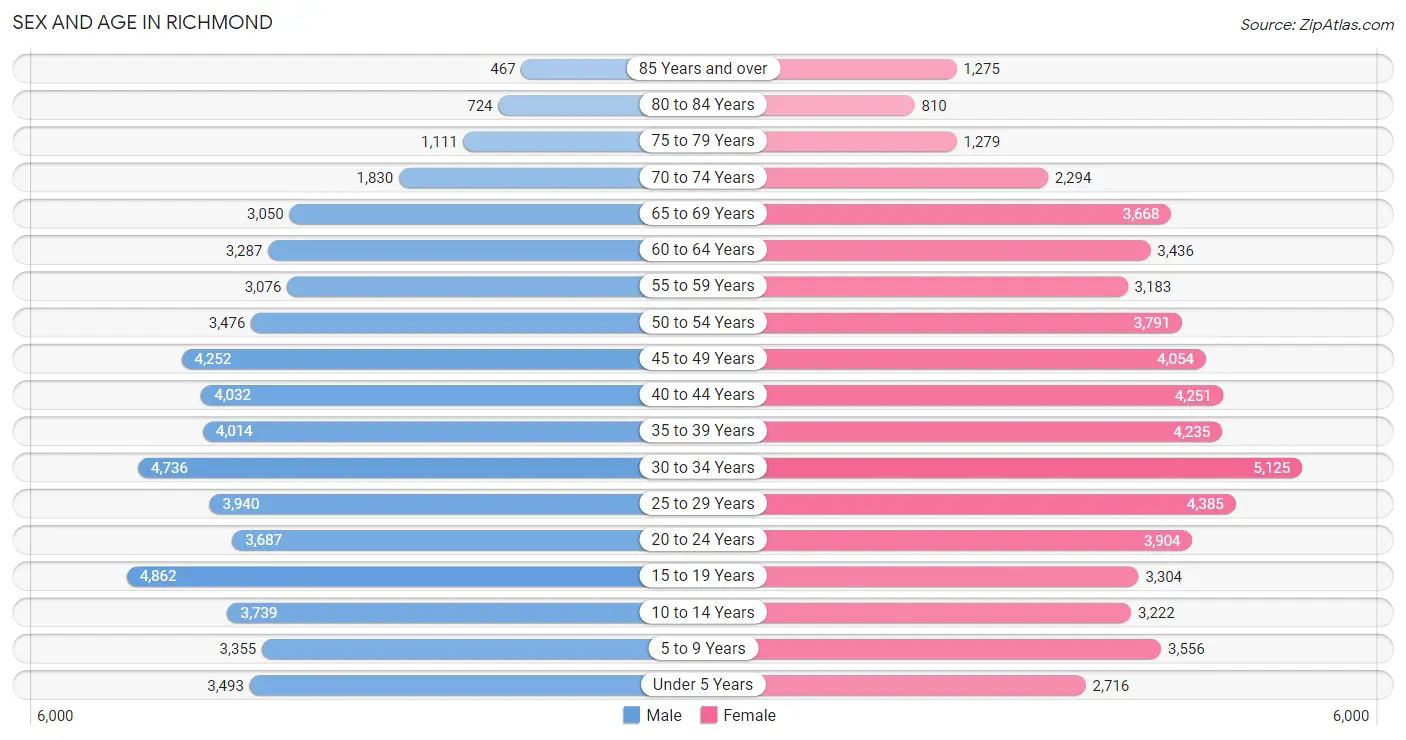
Sex and Age in Richmond
Sex and Age in Richmond
The most populous age groups in Richmond are 15 to 19 Years (4,862 | 8.5%) for men and 30 to 34 Years (5,125 | 8.8%) for women.
| Age Bracket | Male | Female |
| Under 5 Years | 3,493 (6.1%) | 2,716 (4.6%) |
| 5 to 9 Years | 3,355 (5.9%) | 3,556 (6.1%) |
| 10 to 14 Years | 3,739 (6.5%) | 3,222 (5.5%) |
| 15 to 19 Years | 4,862 (8.5%) | 3,304 (5.7%) |
| 20 to 24 Years | 3,687 (6.5%) | 3,904 (6.7%) |
| 25 to 29 Years | 3,940 (6.9%) | 4,385 (7.5%) |
| 30 to 34 Years | 4,736 (8.3%) | 5,125 (8.8%) |
| 35 to 39 Years | 4,014 (7.0%) | 4,235 (7.2%) |
| 40 to 44 Years | 4,032 (7.1%) | 4,251 (7.3%) |
| 45 to 49 Years | 4,252 (7.4%) | 4,054 (6.9%) |
| 50 to 54 Years | 3,476 (6.1%) | 3,791 (6.5%) |
| 55 to 59 Years | 3,076 (5.4%) | 3,183 (5.4%) |
| 60 to 64 Years | 3,287 (5.8%) | 3,436 (5.9%) |
| 65 to 69 Years | 3,050 (5.3%) | 3,668 (6.3%) |
| 70 to 74 Years | 1,830 (3.2%) | 2,294 (3.9%) |
| 75 to 79 Years | 1,111 (1.9%) | 1,279 (2.2%) |
| 80 to 84 Years | 724 (1.3%) | 810 (1.4%) |
| 85 Years and over | 467 (0.8%) | 1,275 (2.2%) |
| Total | 57,131 (100.0%) | 58,488 (100.0%) |
Families and Households in Richmond
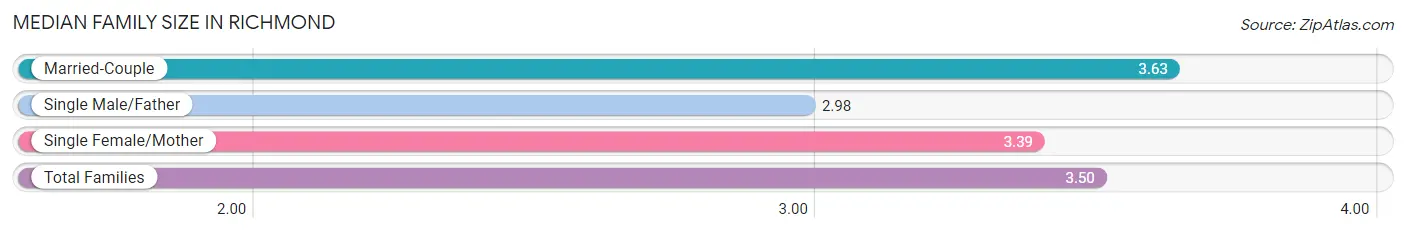
Median Family Size in Richmond
The median family size in Richmond is 3.50 persons per family, with married-couple families (17,084 | 64.4%) accounting for the largest median family size of 3.63 persons per family. On the other hand, single male/father families (3,031 | 11.4%) represent the smallest median family size with 2.98 persons per family.
| Family Type | # Families | Family Size |
| Married-Couple | 17,084 (64.4%) | 3.63 |
| Single Male/Father | 3,031 (11.4%) | 2.98 |
| Single Female/Mother | 6,401 (24.1%) | 3.39 |
| Total Families | 26,516 (100.0%) | 3.50 |
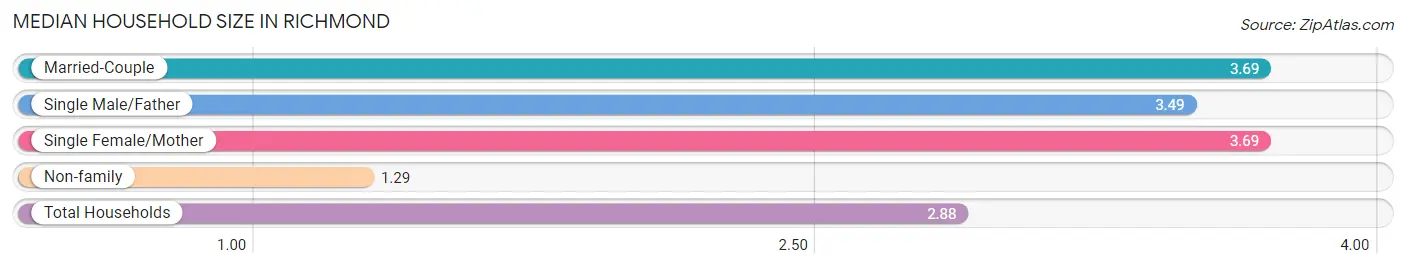
Median Household Size in Richmond
The median household size in Richmond is 2.88 persons per household, with married-couple households (17,084 | 43.1%) accounting for the largest median household size of 3.69 persons per household. non-family households (13,102 | 33.1%) represent the smallest median household size with 1.29 persons per household.
| Household Type | # Households | Household Size |
| Married-Couple | 17,084 (43.1%) | 3.69 |
| Single Male/Father | 3,031 (7.6%) | 3.49 |
| Single Female/Mother | 6,401 (16.2%) | 3.69 |
| Non-family | 13,102 (33.1%) | 1.29 |
| Total Households | 39,618 (100.0%) | 2.88 |
Household Size by Marriage Status in Richmond
Out of a total of 39,618 households in Richmond, 26,516 (66.9%) are family households, while 13,102 (33.1%) are nonfamily households. The most numerous type of family households are 2-person households, comprising 8,177, and the most common type of nonfamily households are 1-person households, comprising 10,020.
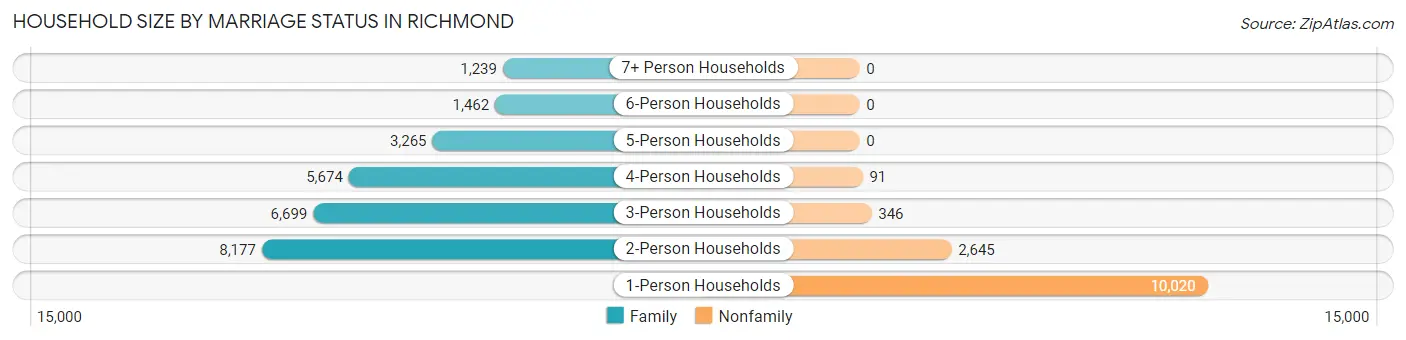
| Household Size | Family Households | Nonfamily Households |
| 1-Person Households | - | 10,020 (25.3%) |
| 2-Person Households | 8,177 (20.6%) | 2,645 (6.7%) |
| 3-Person Households | 6,699 (16.9%) | 346 (0.9%) |
| 4-Person Households | 5,674 (14.3%) | 91 (0.2%) |
| 5-Person Households | 3,265 (8.2%) | 0 (0.0%) |
| 6-Person Households | 1,462 (3.7%) | 0 (0.0%) |
| 7+ Person Households | 1,239 (3.1%) | 0 (0.0%) |
| Total | 26,516 (66.9%) | 13,102 (33.1%) |
Female Fertility in Richmond
Fertility by Age in Richmond
Average fertility rate in Richmond is 71.0 births per 1,000 women. Women in the age bracket of 20 to 34 years have the highest fertility rate with 107.0 births per 1,000 women. Women in the age bracket of 20 to 34 years acount for 67.5% of all women with births.
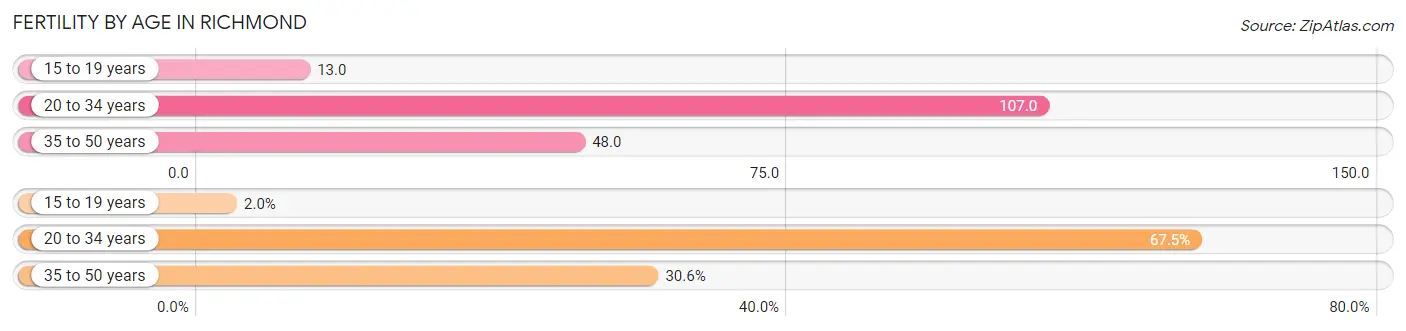
| Age Bracket | Women with Births | Births / 1,000 Women |
| 15 to 19 years | 42 (2.0%) | 13.0 |
| 20 to 34 years | 1,441 (67.5%) | 107.0 |
| 35 to 50 years | 653 (30.6%) | 48.0 |
| Total | 2,136 (100.0%) | 71.0 |
Fertility by Age by Marriage Status in Richmond
57.6% of women with births (2,136) in Richmond are married. The highest percentage of unmarried women with births falls into 15 to 19 years age bracket with 100.0% of them unmarried at the time of birth, while the lowest percentage of unmarried women with births belong to 35 to 50 years age bracket with 13.9% of them unmarried.
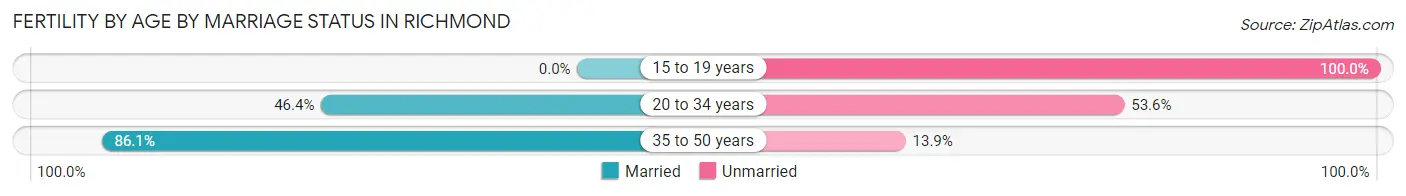
| Age Bracket | Married | Unmarried |
| 15 to 19 years | 0 (0.0%) | 42 (100.0%) |
| 20 to 34 years | 669 (46.4%) | 772 (53.6%) |
| 35 to 50 years | 562 (86.1%) | 91 (13.9%) |
| Total | 1,230 (57.6%) | 906 (42.4%) |
Fertility by Education in Richmond
Average fertility rate in Richmond is 71.0 births per 1,000 women. Women with the education attainment of graduate degree have the highest fertility rate of 108.0 births per 1,000 women, while women with the education attainment of bachelor's degree have the lowest fertility at 46.0 births per 1,000 women. Women with the education attainment of college or associate's degree represent 38.9% of all women with births.
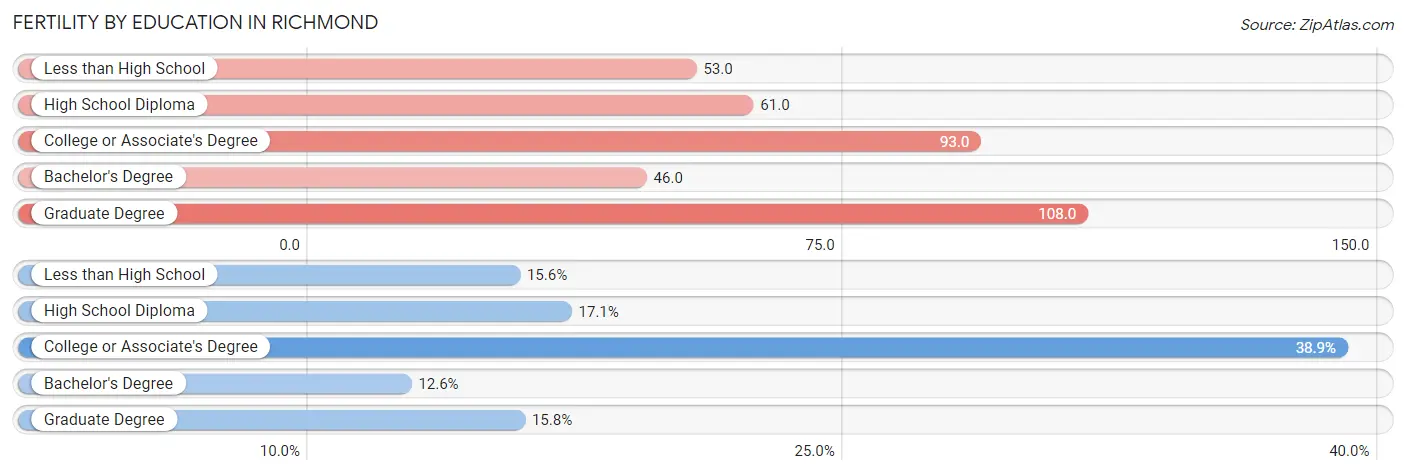
| Educational Attainment | Women with Births | Births / 1,000 Women |
| Less than High School | 334 (15.6%) | 53.0 |
| High School Diploma | 365 (17.1%) | 61.0 |
| College or Associate's Degree | 831 (38.9%) | 93.0 |
| Bachelor's Degree | 269 (12.6%) | 46.0 |
| Graduate Degree | 337 (15.8%) | 108.0 |
| Total | 2,136 (100.0%) | 71.0 |
Fertility by Education by Marriage Status in Richmond
42.4% of women with births in Richmond are unmarried. Women with the educational attainment of bachelor's degree are most likely to be married with 97.0% of them married at childbirth, while women with the educational attainment of college or associate's degree are least likely to be married with 64.1% of them unmarried at childbirth.
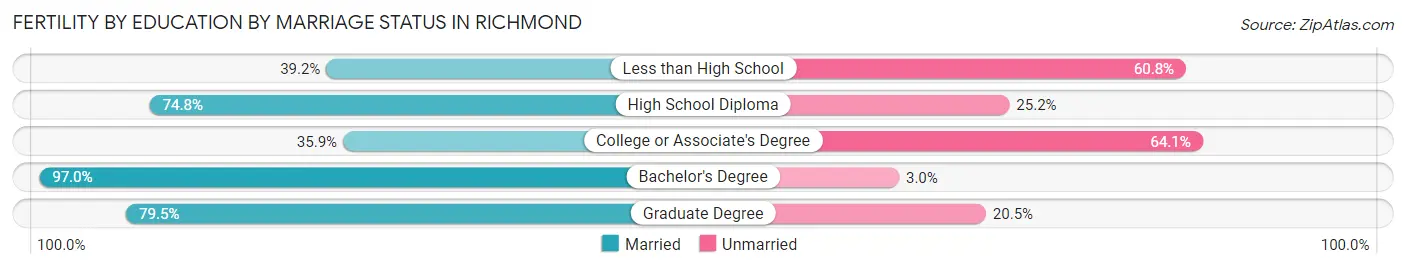
| Educational Attainment | Married | Unmarried |
| Less than High School | 131 (39.2%) | 203 (60.8%) |
| High School Diploma | 273 (74.8%) | 92 (25.2%) |
| College or Associate's Degree | 298 (35.9%) | 533 (64.1%) |
| Bachelor's Degree | 261 (97.0%) | 8 (3.0%) |
| Graduate Degree | 268 (79.5%) | 69 (20.5%) |
| Total | 1,230 (57.6%) | 906 (42.4%) |
Employment Characteristics in Richmond
Employment by Class of Employer in Richmond
Among the 55,773 employed individuals in Richmond, private company employees (35,902 | 64.4%), not-for-profit organizations (5,705 | 10.2%), and local government employees (4,573 | 8.2%) make up the most common classes of employment.
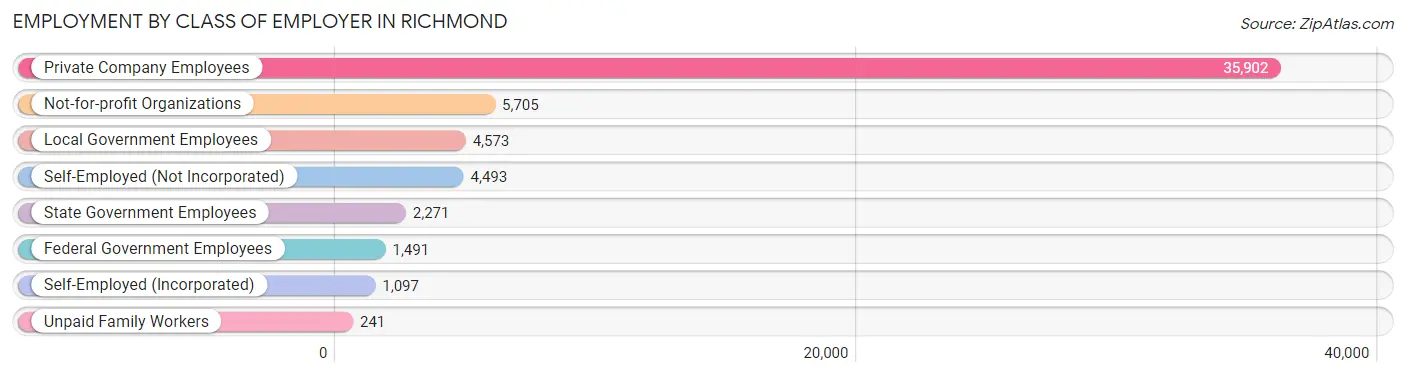
| Employer Class | # Employees | % Employees |
| Private Company Employees | 35,902 | 64.4% |
| Self-Employed (Incorporated) | 1,097 | 2.0% |
| Self-Employed (Not Incorporated) | 4,493 | 8.1% |
| Not-for-profit Organizations | 5,705 | 10.2% |
| Local Government Employees | 4,573 | 8.2% |
| State Government Employees | 2,271 | 4.1% |
| Federal Government Employees | 1,491 | 2.7% |
| Unpaid Family Workers | 241 | 0.4% |
| Total | 55,773 | 100.0% |
Employment Status by Age in Richmond
According to the labor force statistics for Richmond, out of the total population over 16 years of age (94,129), 66.6% or 62,690 individuals are in the labor force, with 6.9% or 4,326 of them unemployed. The age group with the highest labor force participation rate is 25 to 29 years, with 85.3% or 7,101 individuals in the labor force. Within the labor force, the 16 to 19 years age range has the highest percentage of unemployed individuals, with 15.1% or 337 of them being unemployed.
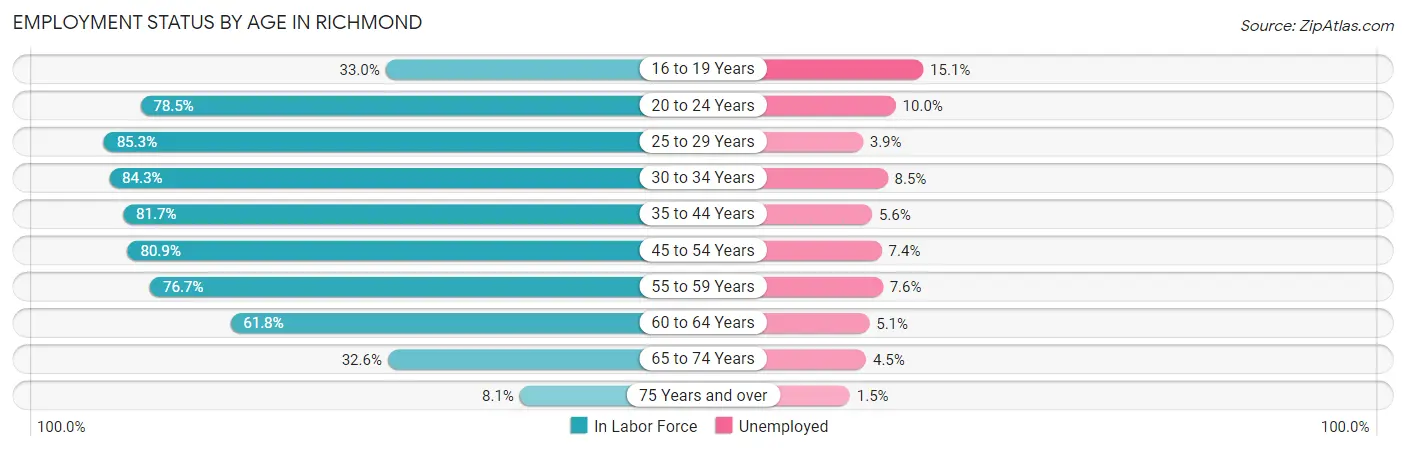
| Age Bracket | In Labor Force | Unemployed |
| 16 to 19 Years | 2,230 (33.0%) | 337 (15.1%) |
| 20 to 24 Years | 5,959 (78.5%) | 596 (10.0%) |
| 25 to 29 Years | 7,101 (85.3%) | 277 (3.9%) |
| 30 to 34 Years | 8,313 (84.3%) | 707 (8.5%) |
| 35 to 44 Years | 13,507 (81.7%) | 756 (5.6%) |
| 45 to 54 Years | 12,599 (80.9%) | 932 (7.4%) |
| 55 to 59 Years | 4,801 (76.7%) | 365 (7.6%) |
| 60 to 64 Years | 4,155 (61.8%) | 212 (5.1%) |
| 65 to 74 Years | 3,534 (32.6%) | 159 (4.5%) |
| 75 Years and over | 459 (8.1%) | 7 (1.5%) |
| Total | 62,690 (66.6%) | 4,326 (6.9%) |
Employment Status by Educational Attainment in Richmond
According to labor force statistics for Richmond, 79.8% of individuals (50,492) out of the total population between 25 and 64 years of age (63,273) are in the labor force, with 6.4% or 3,231 of them being unemployed. The group with the highest labor force participation rate are those with the educational attainment of bachelor's degree or higher, with 88.7% or 17,837 individuals in the labor force. Within the labor force, individuals with high school diploma education have the highest percentage of unemployment, with 7.7% or 726 of them being unemployed.
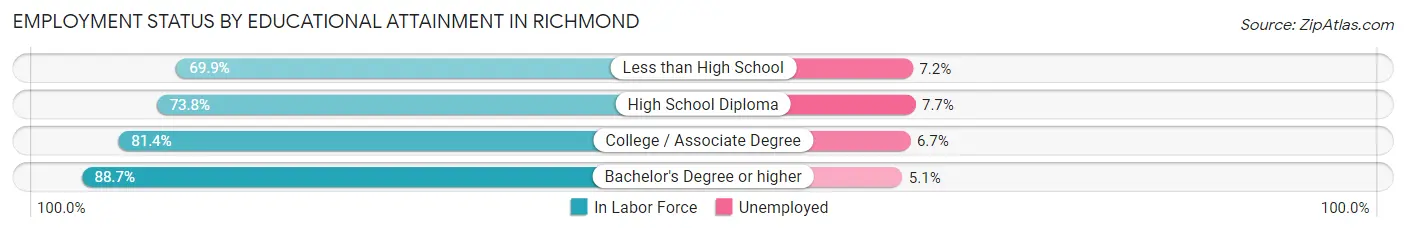
| Educational Attainment | In Labor Force | Unemployed |
| Less than High School | 9,365 (69.9%) | 965 (7.2%) |
| High School Diploma | 9,429 (73.8%) | 984 (7.7%) |
| College / Associate Degree | 13,831 (81.4%) | 1,138 (6.7%) |
| Bachelor's Degree or higher | 17,837 (88.7%) | 1,026 (5.1%) |
| Total | 50,492 (79.8%) | 4,049 (6.4%) |
Employment Occupations by Sex in Richmond
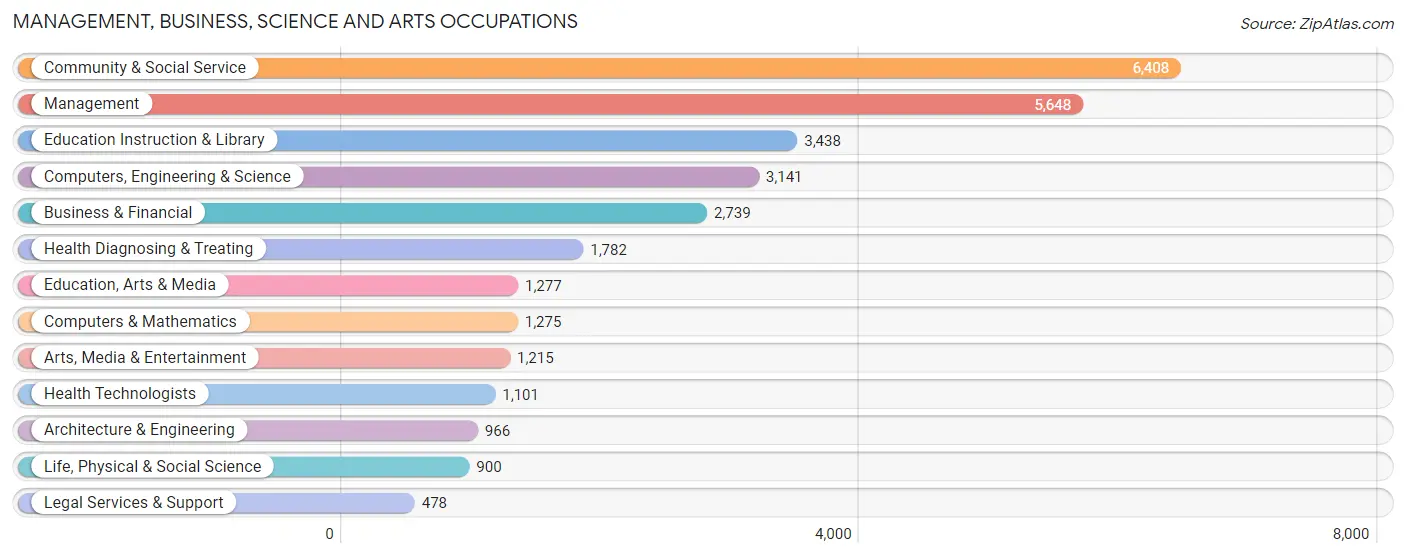
Management, Business, Science and Arts Occupations
The most common Management, Business, Science and Arts occupations in Richmond are Community & Social Service (6,408 | 11.0%), Management (5,648 | 9.7%), Education Instruction & Library (3,438 | 5.9%), Computers, Engineering & Science (3,141 | 5.4%), and Business & Financial (2,739 | 4.7%).
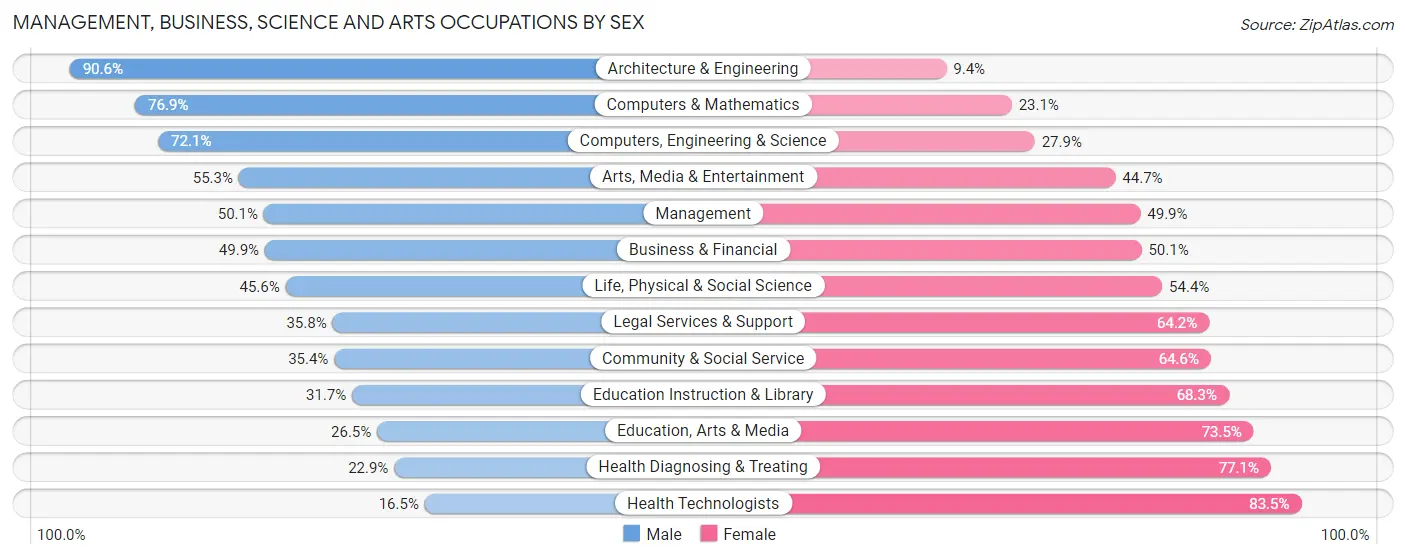
Management, Business, Science and Arts Occupations by Sex
Within the Management, Business, Science and Arts occupations in Richmond, the most male-oriented occupations are Architecture & Engineering (90.6%), Computers & Mathematics (76.9%), and Computers, Engineering & Science (72.1%), while the most female-oriented occupations are Health Technologists (83.5%), Health Diagnosing & Treating (77.1%), and Education, Arts & Media (73.5%).
| Occupation | Male | Female |
| Management | 2,830 (50.1%) | 2,818 (49.9%) |
| Business & Financial | 1,366 (49.9%) | 1,373 (50.1%) |
| Computers, Engineering & Science | 2,266 (72.1%) | 875 (27.9%) |
| Computers & Mathematics | 981 (76.9%) | 294 (23.1%) |
| Architecture & Engineering | 875 (90.6%) | 91 (9.4%) |
| Life, Physical & Social Science | 410 (45.6%) | 490 (54.4%) |
| Community & Social Service | 2,270 (35.4%) | 4,138 (64.6%) |
| Education, Arts & Media | 338 (26.5%) | 939 (73.5%) |
| Legal Services & Support | 171 (35.8%) | 307 (64.2%) |
| Education Instruction & Library | 1,089 (31.7%) | 2,349 (68.3%) |
| Arts, Media & Entertainment | 672 (55.3%) | 543 (44.7%) |
| Health Diagnosing & Treating | 408 (22.9%) | 1,374 (77.1%) |
| Health Technologists | 182 (16.5%) | 919 (83.5%) |
| Total (Category) | 9,140 (46.4%) | 10,578 (53.6%) |
| Total (Overall) | 29,968 (51.5%) | 28,261 (48.5%) |
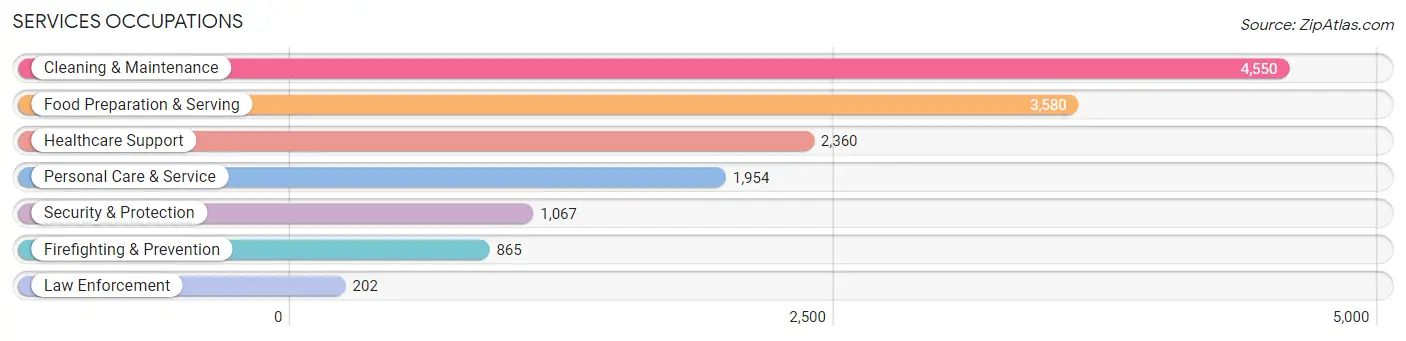
Services Occupations
The most common Services occupations in Richmond are Cleaning & Maintenance (4,550 | 7.8%), Food Preparation & Serving (3,580 | 6.1%), Healthcare Support (2,360 | 4.1%), Personal Care & Service (1,954 | 3.4%), and Security & Protection (1,067 | 1.8%).
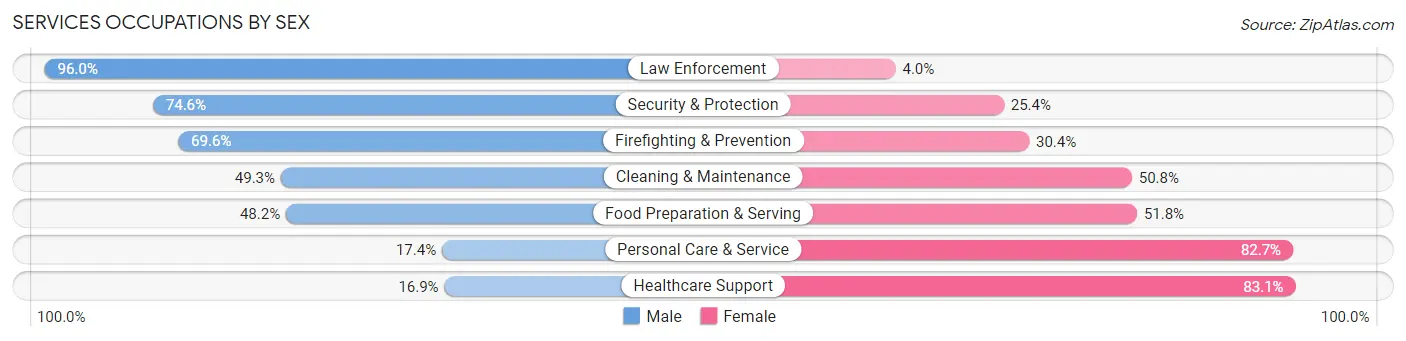
Services Occupations by Sex
Within the Services occupations in Richmond, the most male-oriented occupations are Law Enforcement (96.0%), Security & Protection (74.6%), and Firefighting & Prevention (69.6%), while the most female-oriented occupations are Healthcare Support (83.1%), Personal Care & Service (82.7%), and Food Preparation & Serving (51.8%).
| Occupation | Male | Female |
| Healthcare Support | 398 (16.9%) | 1,962 (83.1%) |
| Security & Protection | 796 (74.6%) | 271 (25.4%) |
| Firefighting & Prevention | 602 (69.6%) | 263 (30.4%) |
| Law Enforcement | 194 (96.0%) | 8 (4.0%) |
| Food Preparation & Serving | 1,727 (48.2%) | 1,853 (51.8%) |
| Cleaning & Maintenance | 2,241 (49.2%) | 2,309 (50.7%) |
| Personal Care & Service | 339 (17.3%) | 1,615 (82.7%) |
| Total (Category) | 5,501 (40.7%) | 8,010 (59.3%) |
| Total (Overall) | 29,968 (51.5%) | 28,261 (48.5%) |
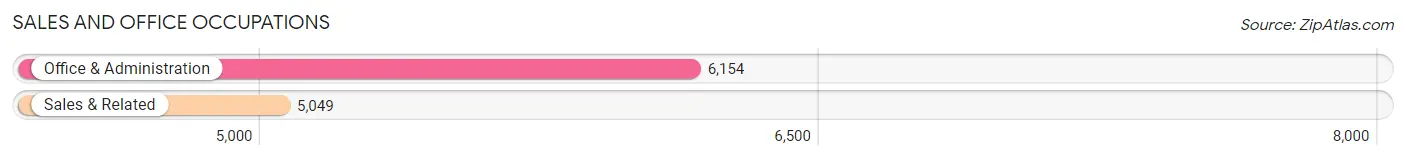
Sales and Office Occupations
The most common Sales and Office occupations in Richmond are Office & Administration (6,154 | 10.6%), and Sales & Related (5,049 | 8.7%).
Sales and Office Occupations by Sex
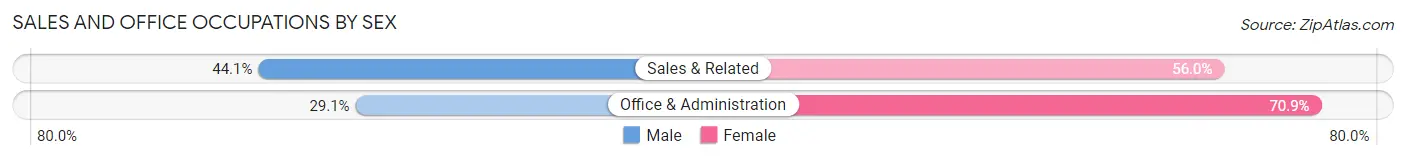
| Occupation | Male | Female |
| Sales & Related | 2,224 (44.1%) | 2,825 (55.9%) |
| Office & Administration | 1,791 (29.1%) | 4,363 (70.9%) |
| Total (Category) | 4,015 (35.8%) | 7,188 (64.2%) |
| Total (Overall) | 29,968 (51.5%) | 28,261 (48.5%) |
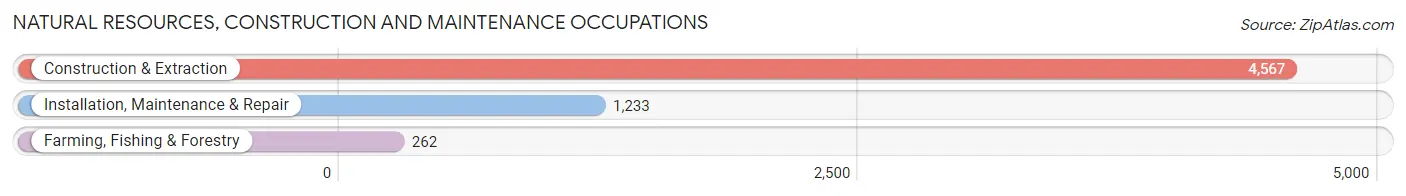
Natural Resources, Construction and Maintenance Occupations
The most common Natural Resources, Construction and Maintenance occupations in Richmond are Construction & Extraction (4,567 | 7.8%), Installation, Maintenance & Repair (1,233 | 2.1%), and Farming, Fishing & Forestry (262 | 0.4%).
Natural Resources, Construction and Maintenance Occupations by Sex
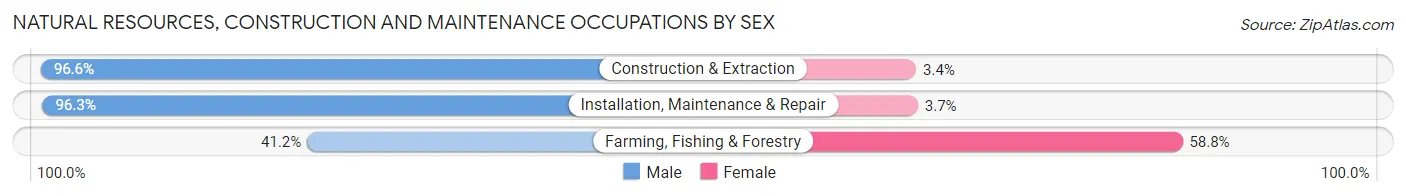
| Occupation | Male | Female |
| Farming, Fishing & Forestry | 108 (41.2%) | 154 (58.8%) |
| Construction & Extraction | 4,413 (96.6%) | 154 (3.4%) |
| Installation, Maintenance & Repair | 1,187 (96.3%) | 46 (3.7%) |
| Total (Category) | 5,708 (94.2%) | 354 (5.8%) |
| Total (Overall) | 29,968 (51.5%) | 28,261 (48.5%) |
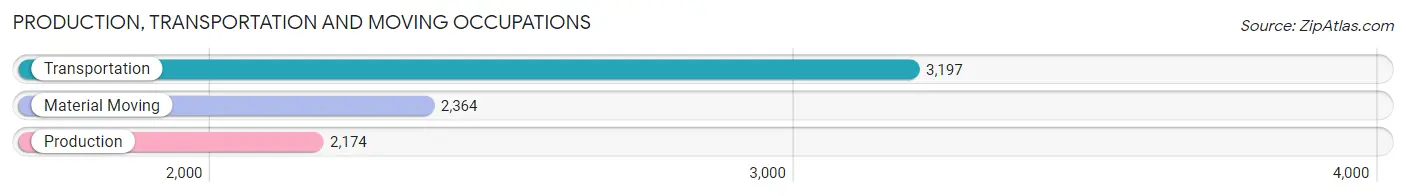
Production, Transportation and Moving Occupations
The most common Production, Transportation and Moving occupations in Richmond are Transportation (3,197 | 5.5%), Material Moving (2,364 | 4.1%), and Production (2,174 | 3.7%).
Production, Transportation and Moving Occupations by Sex
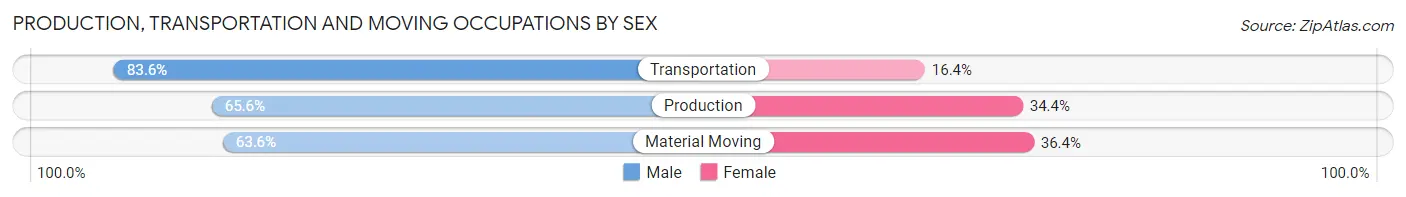
| Occupation | Male | Female |
| Production | 1,427 (65.6%) | 747 (34.4%) |
| Transportation | 2,673 (83.6%) | 524 (16.4%) |
| Material Moving | 1,504 (63.6%) | 860 (36.4%) |
| Total (Category) | 5,604 (72.5%) | 2,131 (27.6%) |
| Total (Overall) | 29,968 (51.5%) | 28,261 (48.5%) |
Employment Industries by Sex in Richmond
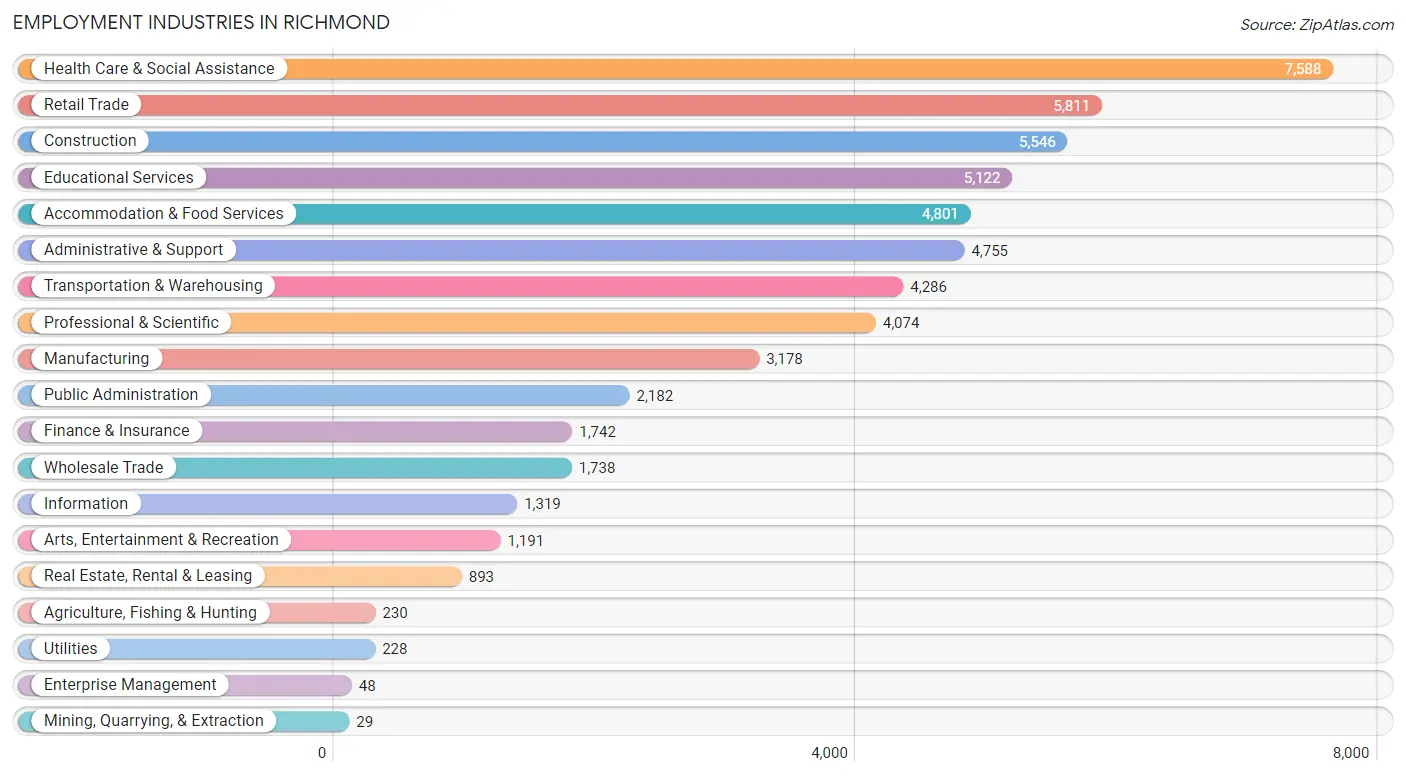
Employment Industries in Richmond
The major employment industries in Richmond include Health Care & Social Assistance (7,588 | 13.0%), Retail Trade (5,811 | 10.0%), Construction (5,546 | 9.5%), Educational Services (5,122 | 8.8%), and Accommodation & Food Services (4,801 | 8.3%).
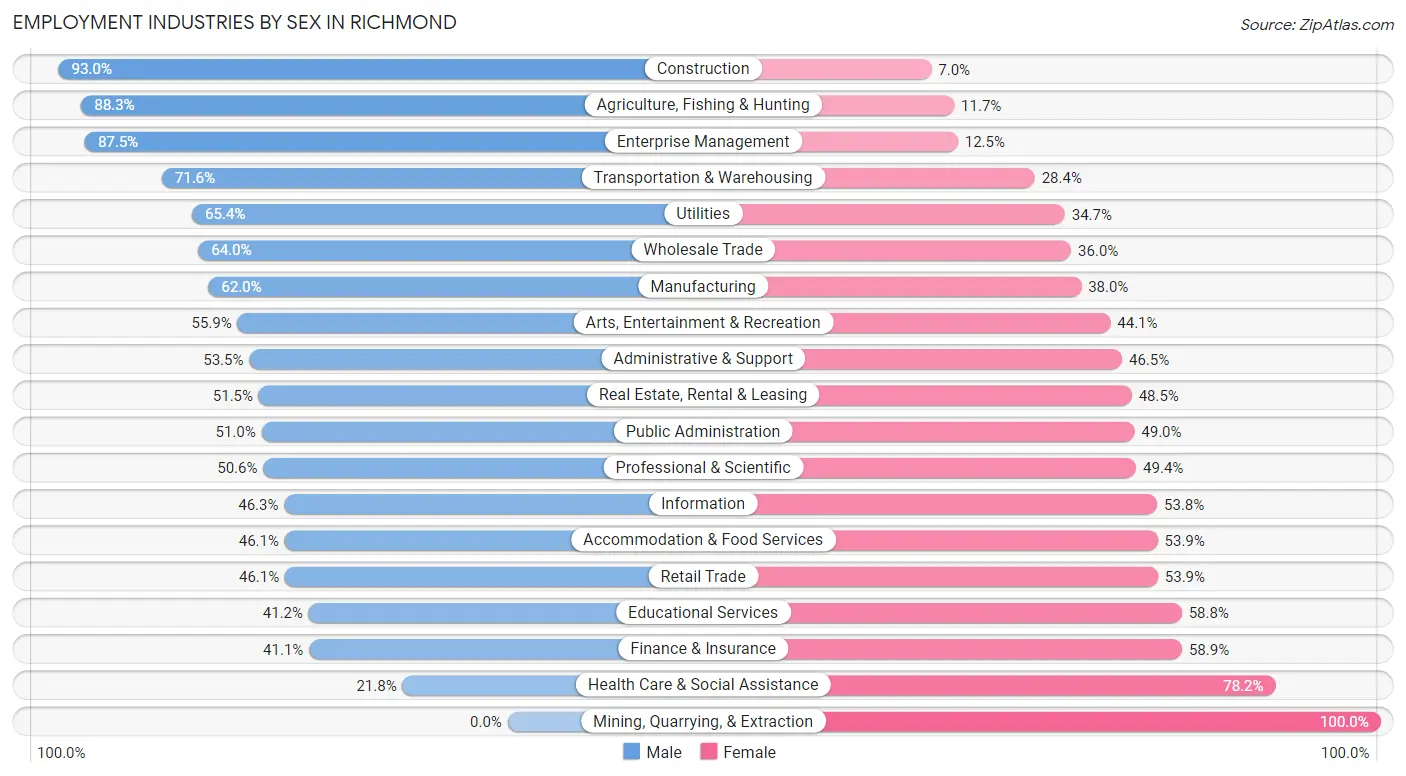
Employment Industries by Sex in Richmond
The Richmond industries that see more men than women are Construction (93.0%), Agriculture, Fishing & Hunting (88.3%), and Enterprise Management (87.5%), whereas the industries that tend to have a higher number of women are Mining, Quarrying, & Extraction (100.0%), Health Care & Social Assistance (78.2%), and Finance & Insurance (58.9%).
| Industry | Male | Female |
| Agriculture, Fishing & Hunting | 203 (88.3%) | 27 (11.7%) |
| Mining, Quarrying, & Extraction | 0 (0.0%) | 29 (100.0%) |
| Construction | 5,156 (93.0%) | 390 (7.0%) |
| Manufacturing | 1,969 (62.0%) | 1,209 (38.0%) |
| Wholesale Trade | 1,113 (64.0%) | 625 (36.0%) |
| Retail Trade | 2,678 (46.1%) | 3,133 (53.9%) |
| Transportation & Warehousing | 3,068 (71.6%) | 1,218 (28.4%) |
| Utilities | 149 (65.3%) | 79 (34.6%) |
| Information | 610 (46.3%) | 709 (53.7%) |
| Finance & Insurance | 716 (41.1%) | 1,026 (58.9%) |
| Real Estate, Rental & Leasing | 460 (51.5%) | 433 (48.5%) |
| Professional & Scientific | 2,061 (50.6%) | 2,013 (49.4%) |
| Enterprise Management | 42 (87.5%) | 6 (12.5%) |
| Administrative & Support | 2,544 (53.5%) | 2,211 (46.5%) |
| Educational Services | 2,108 (41.2%) | 3,014 (58.8%) |
| Health Care & Social Assistance | 1,653 (21.8%) | 5,935 (78.2%) |
| Arts, Entertainment & Recreation | 666 (55.9%) | 525 (44.1%) |
| Accommodation & Food Services | 2,215 (46.1%) | 2,586 (53.9%) |
| Public Administration | 1,112 (51.0%) | 1,070 (49.0%) |
| Total | 29,968 (51.5%) | 28,261 (48.5%) |
Education in Richmond
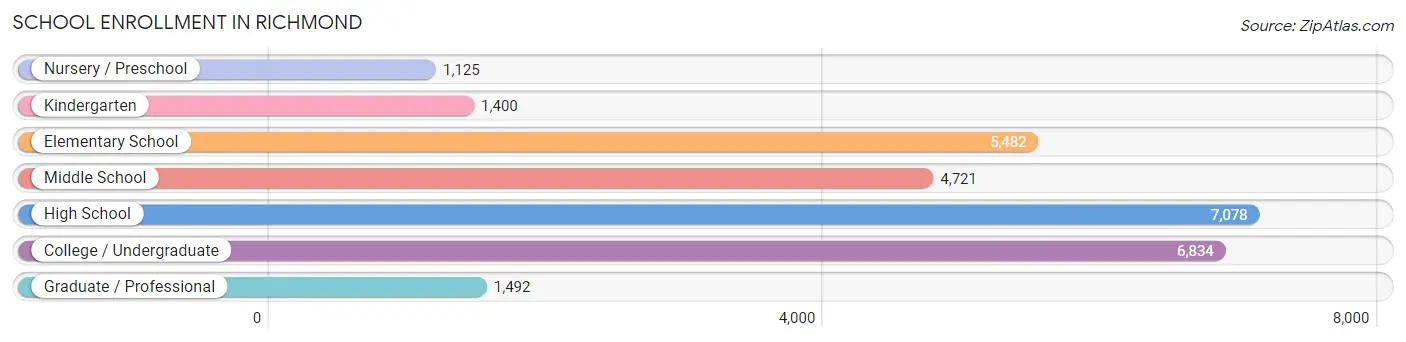
School Enrollment in Richmond
The most common levels of schooling among the 28,132 students in Richmond are high school (7,078 | 25.2%), college / undergraduate (6,834 | 24.3%), and elementary school (5,482 | 19.5%).
| School Level | # Students | % Students |
| Nursery / Preschool | 1,125 | 4.0% |
| Kindergarten | 1,400 | 5.0% |
| Elementary School | 5,482 | 19.5% |
| Middle School | 4,721 | 16.8% |
| High School | 7,078 | 25.2% |
| College / Undergraduate | 6,834 | 24.3% |
| Graduate / Professional | 1,492 | 5.3% |
| Total | 28,132 | 100.0% |
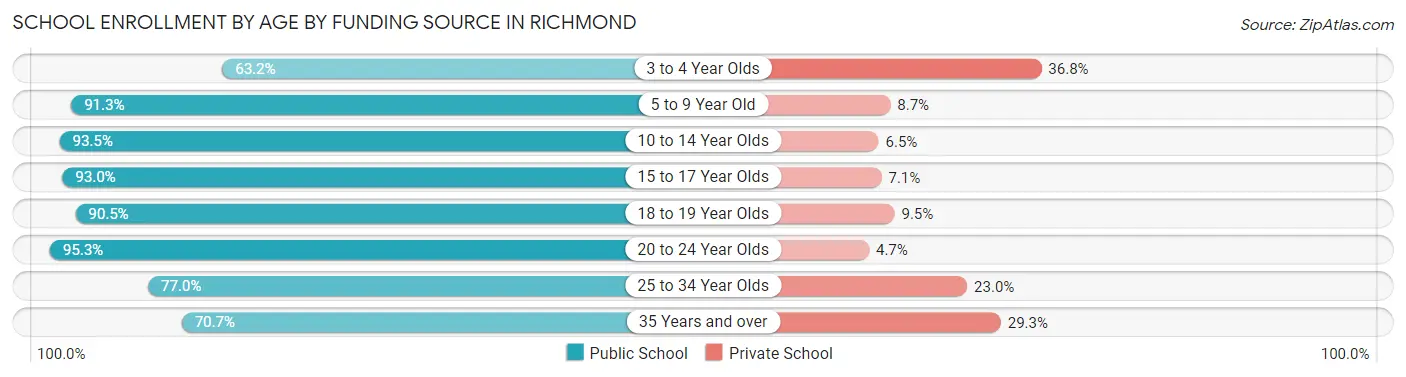
School Enrollment by Age by Funding Source in Richmond
Out of a total of 28,132 students who are enrolled in schools in Richmond, 3,095 (11.0%) attend a private institution, while the remaining 25,037 (89.0%) are enrolled in public schools. The age group of 3 to 4 year olds has the highest likelihood of being enrolled in private schools, with 348 (36.8% in the age bracket) enrolled. Conversely, the age group of 20 to 24 year olds has the lowest likelihood of being enrolled in a private school, with 2,644 (95.3% in the age bracket) attending a public institution.
| Age Bracket | Public School | Private School |
| 3 to 4 Year Olds | 597 (63.2%) | 348 (36.8%) |
| 5 to 9 Year Old | 5,978 (91.3%) | 569 (8.7%) |
| 10 to 14 Year Olds | 6,317 (93.5%) | 440 (6.5%) |
| 15 to 17 Year Olds | 4,113 (92.9%) | 312 (7.0%) |
| 18 to 19 Year Olds | 2,257 (90.5%) | 236 (9.5%) |
| 20 to 24 Year Olds | 2,644 (95.3%) | 131 (4.7%) |
| 25 to 34 Year Olds | 1,995 (77.0%) | 596 (23.0%) |
| 35 Years and over | 1,131 (70.7%) | 468 (29.3%) |
| Total | 25,037 (89.0%) | 3,095 (11.0%) |
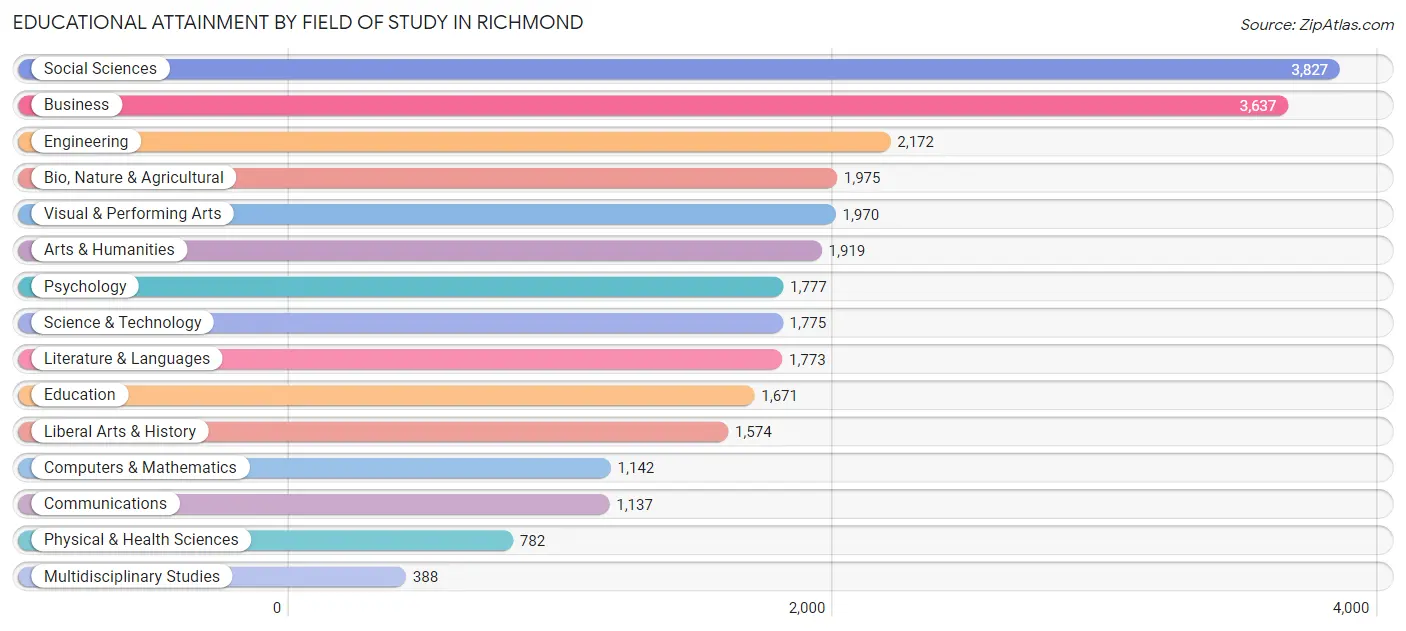
Educational Attainment by Field of Study in Richmond
Social sciences (3,827 | 13.9%), business (3,637 | 13.2%), engineering (2,172 | 7.9%), bio, nature & agricultural (1,975 | 7.2%), and visual & performing arts (1,970 | 7.2%) are the most common fields of study among 27,519 individuals in Richmond who have obtained a bachelor's degree or higher.
| Field of Study | # Graduates | % Graduates |
| Computers & Mathematics | 1,142 | 4.2% |
| Bio, Nature & Agricultural | 1,975 | 7.2% |
| Physical & Health Sciences | 782 | 2.8% |
| Psychology | 1,777 | 6.5% |
| Social Sciences | 3,827 | 13.9% |
| Engineering | 2,172 | 7.9% |
| Multidisciplinary Studies | 388 | 1.4% |
| Science & Technology | 1,775 | 6.5% |
| Business | 3,637 | 13.2% |
| Education | 1,671 | 6.1% |
| Literature & Languages | 1,773 | 6.4% |
| Liberal Arts & History | 1,574 | 5.7% |
| Visual & Performing Arts | 1,970 | 7.2% |
| Communications | 1,137 | 4.1% |
| Arts & Humanities | 1,919 | 7.0% |
| Total | 27,519 | 100.0% |
Transportation & Commute in Richmond
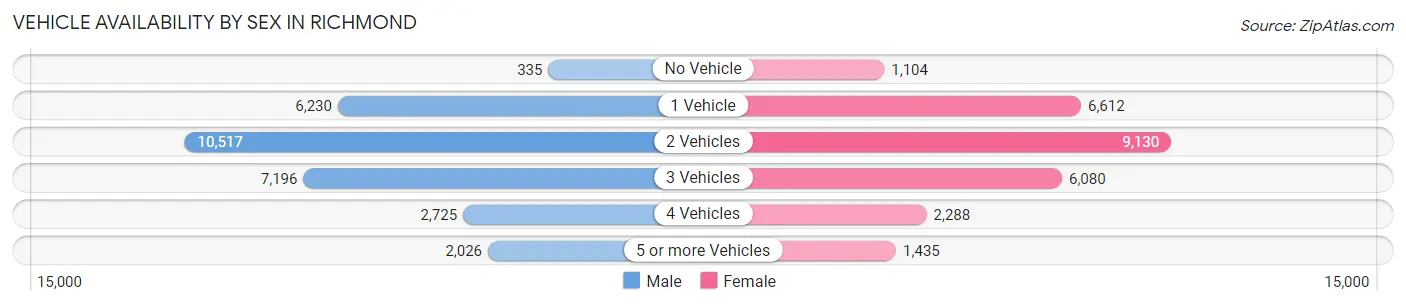
Vehicle Availability by Sex in Richmond
The most prevalent vehicle ownership categories in Richmond are males with 2 vehicles (10,517, accounting for 36.2%) and females with 2 vehicles (9,130, making up 39.5%).
| Vehicles Available | Male | Female |
| No Vehicle | 335 (1.1%) | 1,104 (4.1%) |
| 1 Vehicle | 6,230 (21.5%) | 6,612 (24.8%) |
| 2 Vehicles | 10,517 (36.2%) | 9,130 (34.3%) |
| 3 Vehicles | 7,196 (24.8%) | 6,080 (22.8%) |
| 4 Vehicles | 2,725 (9.4%) | 2,288 (8.6%) |
| 5 or more Vehicles | 2,026 (7.0%) | 1,435 (5.4%) |
| Total | 29,029 (100.0%) | 26,649 (100.0%) |
Commute Time in Richmond
The most frequently occuring commute durations in Richmond are 30 to 34 minutes (7,424 commuters, 15.0%), 60 to 89 minutes (7,001 commuters, 14.1%), and 20 to 24 minutes (5,993 commuters, 12.1%).
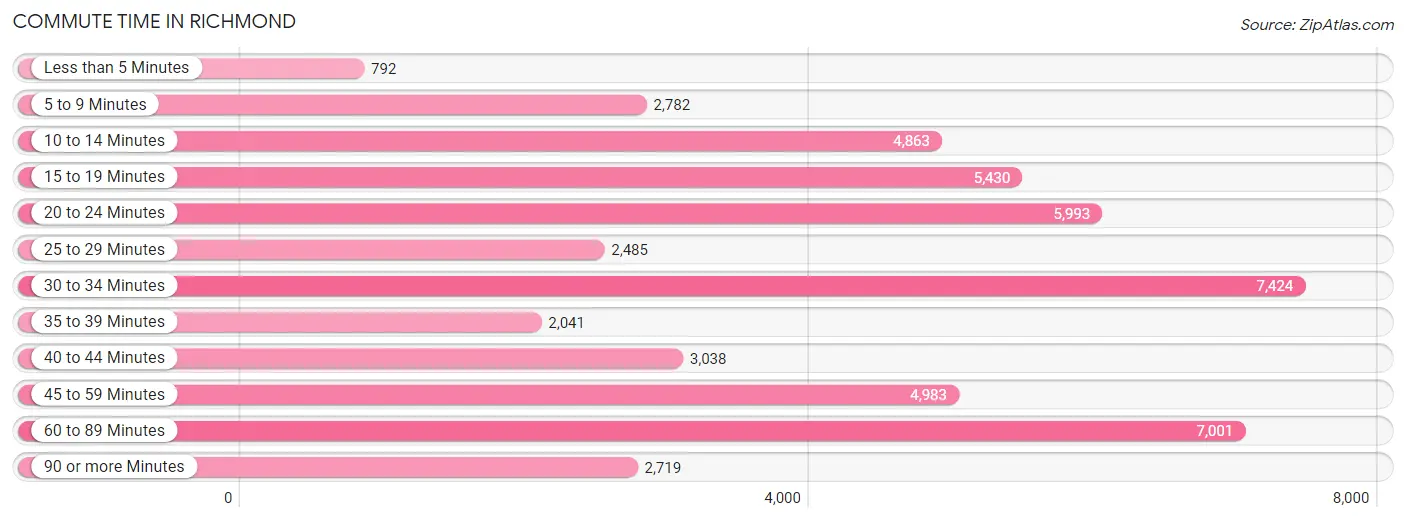
| Commute Time | # Commuters | % Commuters |
| Less than 5 Minutes | 792 | 1.6% |
| 5 to 9 Minutes | 2,782 | 5.6% |
| 10 to 14 Minutes | 4,863 | 9.8% |
| 15 to 19 Minutes | 5,430 | 11.0% |
| 20 to 24 Minutes | 5,993 | 12.1% |
| 25 to 29 Minutes | 2,485 | 5.0% |
| 30 to 34 Minutes | 7,424 | 15.0% |
| 35 to 39 Minutes | 2,041 | 4.1% |
| 40 to 44 Minutes | 3,038 | 6.1% |
| 45 to 59 Minutes | 4,983 | 10.1% |
| 60 to 89 Minutes | 7,001 | 14.1% |
| 90 or more Minutes | 2,719 | 5.5% |
Commute Time by Sex in Richmond
The most common commute times in Richmond are 60 to 89 minutes (3,989 commuters, 15.3%) for males and 30 to 34 minutes (3,585 commuters, 15.3%) for females.
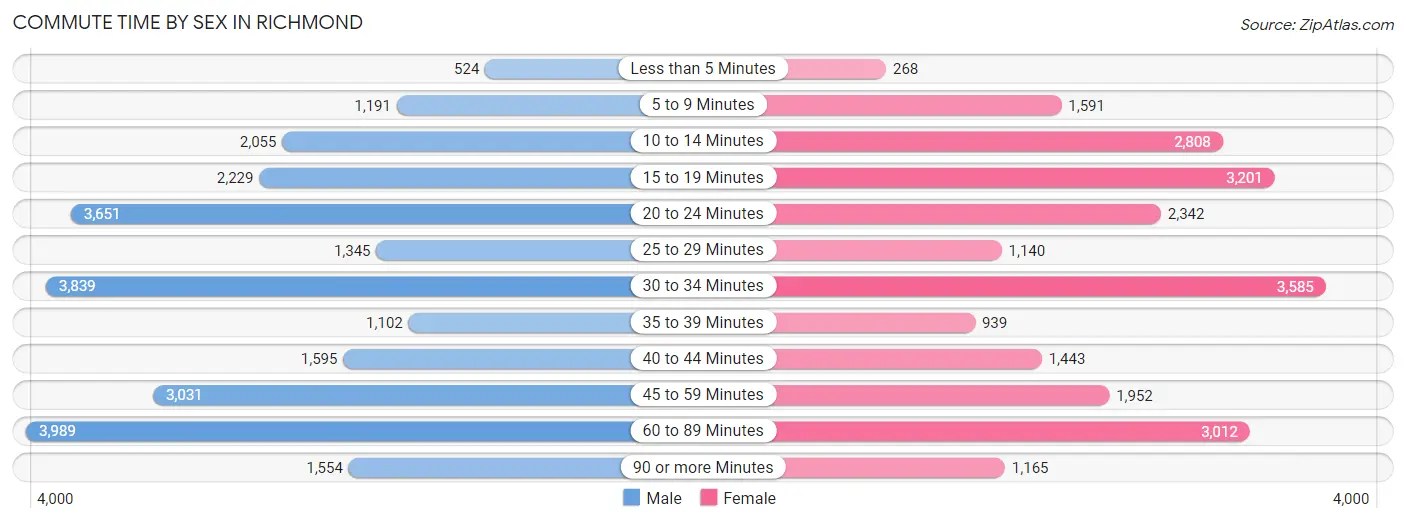
| Commute Time | Male | Female |
| Less than 5 Minutes | 524 (2.0%) | 268 (1.1%) |
| 5 to 9 Minutes | 1,191 (4.6%) | 1,591 (6.8%) |
| 10 to 14 Minutes | 2,055 (7.9%) | 2,808 (12.0%) |
| 15 to 19 Minutes | 2,229 (8.5%) | 3,201 (13.7%) |
| 20 to 24 Minutes | 3,651 (14.0%) | 2,342 (10.0%) |
| 25 to 29 Minutes | 1,345 (5.1%) | 1,140 (4.9%) |
| 30 to 34 Minutes | 3,839 (14.7%) | 3,585 (15.3%) |
| 35 to 39 Minutes | 1,102 (4.2%) | 939 (4.0%) |
| 40 to 44 Minutes | 1,595 (6.1%) | 1,443 (6.1%) |
| 45 to 59 Minutes | 3,031 (11.6%) | 1,952 (8.3%) |
| 60 to 89 Minutes | 3,989 (15.3%) | 3,012 (12.9%) |
| 90 or more Minutes | 1,554 (5.9%) | 1,165 (5.0%) |
Time of Departure to Work by Sex in Richmond
The most frequent times of departure to work in Richmond are 6:00 AM to 6:29 AM (3,208, 12.3%) for males and 7:30 AM to 7:59 AM (3,378, 14.4%) for females.
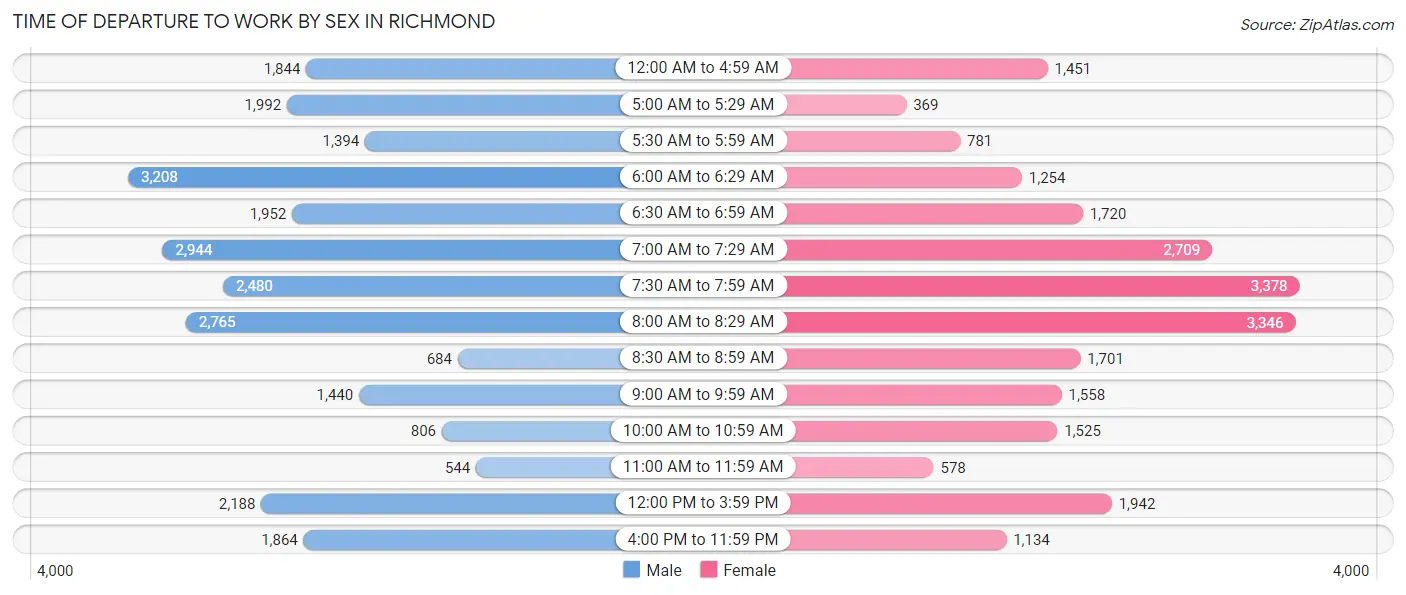
| Time of Departure | Male | Female |
| 12:00 AM to 4:59 AM | 1,844 (7.1%) | 1,451 (6.2%) |
| 5:00 AM to 5:29 AM | 1,992 (7.6%) | 369 (1.6%) |
| 5:30 AM to 5:59 AM | 1,394 (5.3%) | 781 (3.3%) |
| 6:00 AM to 6:29 AM | 3,208 (12.3%) | 1,254 (5.3%) |
| 6:30 AM to 6:59 AM | 1,952 (7.5%) | 1,720 (7.3%) |
| 7:00 AM to 7:29 AM | 2,944 (11.3%) | 2,709 (11.6%) |
| 7:30 AM to 7:59 AM | 2,480 (9.5%) | 3,378 (14.4%) |
| 8:00 AM to 8:29 AM | 2,765 (10.6%) | 3,346 (14.3%) |
| 8:30 AM to 8:59 AM | 684 (2.6%) | 1,701 (7.2%) |
| 9:00 AM to 9:59 AM | 1,440 (5.5%) | 1,558 (6.7%) |
| 10:00 AM to 10:59 AM | 806 (3.1%) | 1,525 (6.5%) |
| 11:00 AM to 11:59 AM | 544 (2.1%) | 578 (2.5%) |
| 12:00 PM to 3:59 PM | 2,188 (8.4%) | 1,942 (8.3%) |
| 4:00 PM to 11:59 PM | 1,864 (7.1%) | 1,134 (4.8%) |
| Total | 26,105 (100.0%) | 23,446 (100.0%) |
Housing Occupancy in Richmond
Occupancy by Ownership in Richmond
Of the total 39,618 dwellings in Richmond, owner-occupied units account for 20,545 (51.9%), while renter-occupied units make up 19,073 (48.1%).
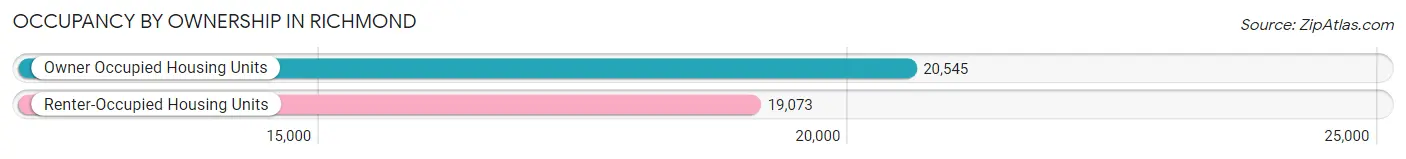
| Occupancy | # Housing Units | % Housing Units |
| Owner Occupied Housing Units | 20,545 | 51.9% |
| Renter-Occupied Housing Units | 19,073 | 48.1% |
| Total Occupied Housing Units | 39,618 | 100.0% |
Occupancy by Household Size in Richmond
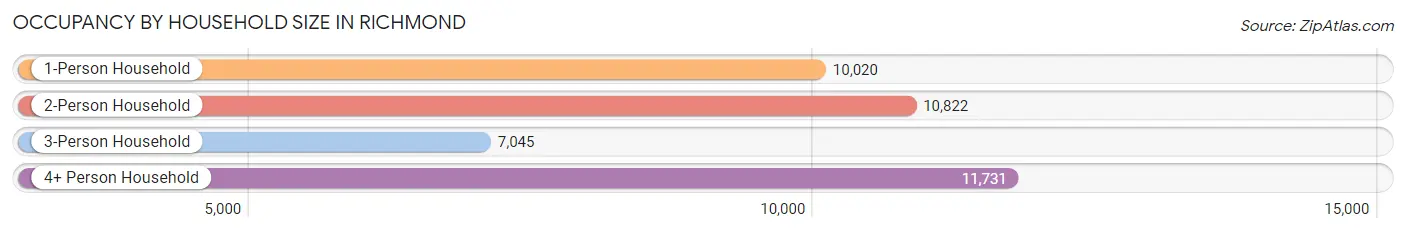
| Household Size | # Housing Units | % Housing Units |
| 1-Person Household | 10,020 | 25.3% |
| 2-Person Household | 10,822 | 27.3% |
| 3-Person Household | 7,045 | 17.8% |
| 4+ Person Household | 11,731 | 29.6% |
| Total Housing Units | 39,618 | 100.0% |
Occupancy by Ownership by Household Size in Richmond
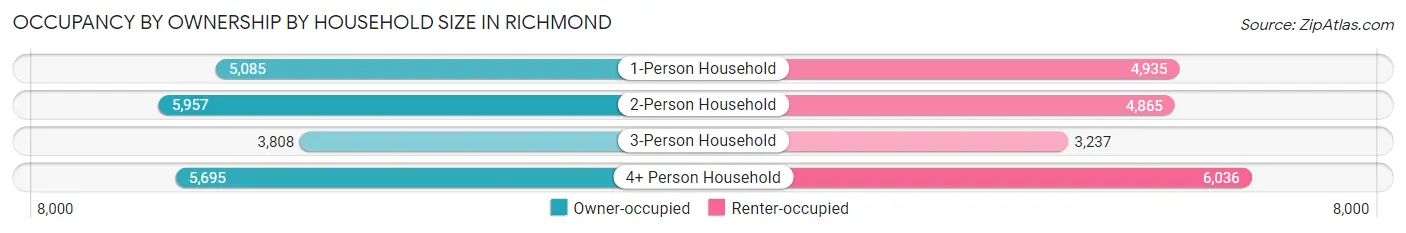
| Household Size | Owner-occupied | Renter-occupied |
| 1-Person Household | 5,085 (50.7%) | 4,935 (49.2%) |
| 2-Person Household | 5,957 (55.0%) | 4,865 (45.0%) |
| 3-Person Household | 3,808 (54.0%) | 3,237 (46.0%) |
| 4+ Person Household | 5,695 (48.5%) | 6,036 (51.4%) |
| Total Housing Units | 20,545 (51.9%) | 19,073 (48.1%) |
Occupancy by Educational Attainment in Richmond
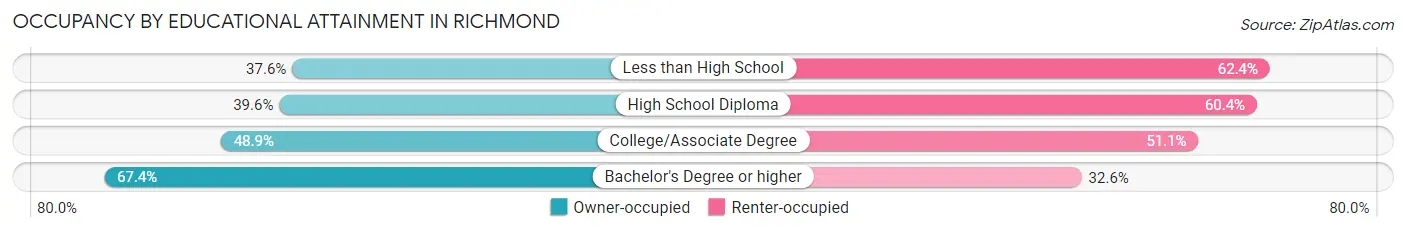
| Household Size | Owner-occupied | Renter-occupied |
| Less than High School | 2,347 (37.6%) | 3,902 (62.4%) |
| High School Diploma | 2,961 (39.6%) | 4,515 (60.4%) |
| College/Associate Degree | 5,856 (48.9%) | 6,121 (51.1%) |
| Bachelor's Degree or higher | 9,381 (67.4%) | 4,535 (32.6%) |
Occupancy by Age of Householder in Richmond
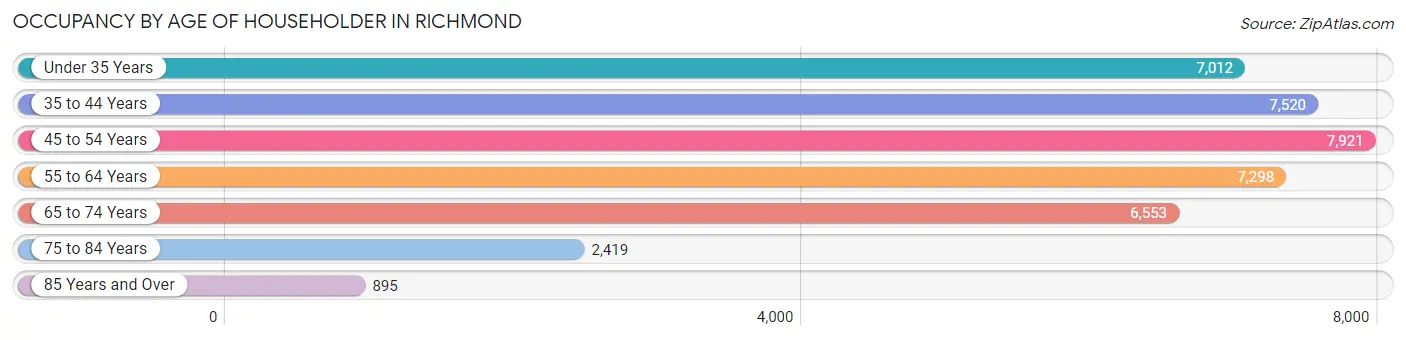
| Age Bracket | # Households | % Households |
| Under 35 Years | 7,012 | 17.7% |
| 35 to 44 Years | 7,520 | 19.0% |
| 45 to 54 Years | 7,921 | 20.0% |
| 55 to 64 Years | 7,298 | 18.4% |
| 65 to 74 Years | 6,553 | 16.5% |
| 75 to 84 Years | 2,419 | 6.1% |
| 85 Years and Over | 895 | 2.3% |
| Total | 39,618 | 100.0% |
Housing Finances in Richmond
Median Income by Occupancy in Richmond
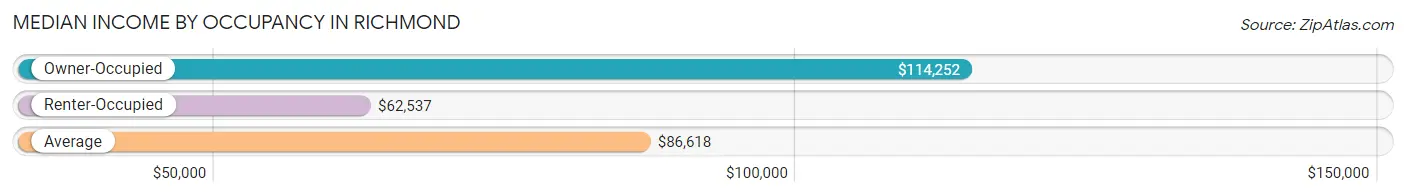
| Occupancy Type | # Households | Median Income |
| Owner-Occupied | 20,545 (51.9%) | $114,252 |
| Renter-Occupied | 19,073 (48.1%) | $62,537 |
| Average | 39,618 (100.0%) | $86,618 |
Occupancy by Householder Income Bracket in Richmond
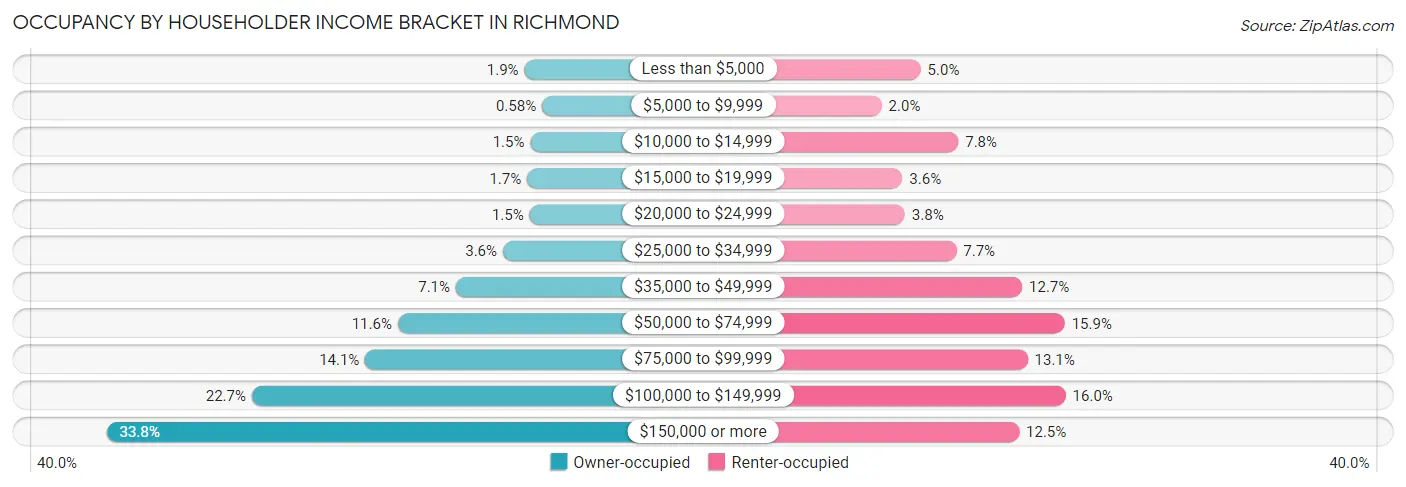
| Income Bracket | Owner-occupied | Renter-occupied |
| Less than $5,000 | 395 (1.9%) | 946 (5.0%) |
| $5,000 to $9,999 | 120 (0.6%) | 380 (2.0%) |
| $10,000 to $14,999 | 302 (1.5%) | 1,494 (7.8%) |
| $15,000 to $19,999 | 354 (1.7%) | 681 (3.6%) |
| $20,000 to $24,999 | 315 (1.5%) | 717 (3.8%) |
| $25,000 to $34,999 | 731 (3.6%) | 1,464 (7.7%) |
| $35,000 to $49,999 | 1,466 (7.1%) | 2,421 (12.7%) |
| $50,000 to $74,999 | 2,378 (11.6%) | 3,040 (15.9%) |
| $75,000 to $99,999 | 2,887 (14.1%) | 2,500 (13.1%) |
| $100,000 to $149,999 | 4,662 (22.7%) | 3,054 (16.0%) |
| $150,000 or more | 6,935 (33.8%) | 2,376 (12.5%) |
| Total | 20,545 (100.0%) | 19,073 (100.0%) |
Monthly Housing Cost Tiers in Richmond
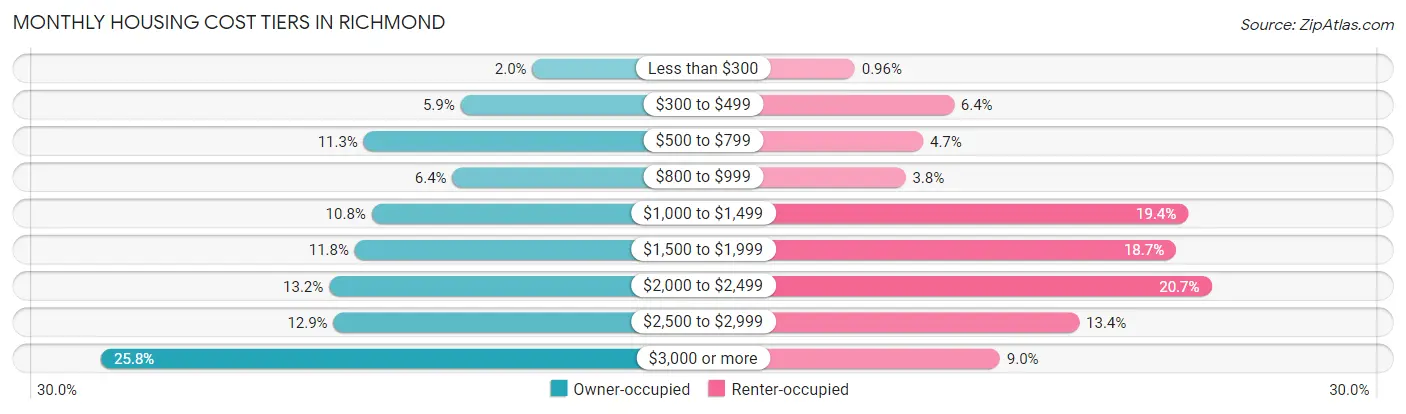
| Monthly Cost | Owner-occupied | Renter-occupied |
| Less than $300 | 400 (1.9%) | 183 (1.0%) |
| $300 to $499 | 1,216 (5.9%) | 1,226 (6.4%) |
| $500 to $799 | 2,316 (11.3%) | 903 (4.7%) |
| $800 to $999 | 1,309 (6.4%) | 718 (3.8%) |
| $1,000 to $1,499 | 2,226 (10.8%) | 3,694 (19.4%) |
| $1,500 to $1,999 | 2,417 (11.8%) | 3,566 (18.7%) |
| $2,000 to $2,499 | 2,707 (13.2%) | 3,938 (20.6%) |
| $2,500 to $2,999 | 2,658 (12.9%) | 2,546 (13.4%) |
| $3,000 or more | 5,296 (25.8%) | 1,710 (9.0%) |
| Total | 20,545 (100.0%) | 19,073 (100.0%) |
Physical Housing Characteristics in Richmond
Housing Structures in Richmond
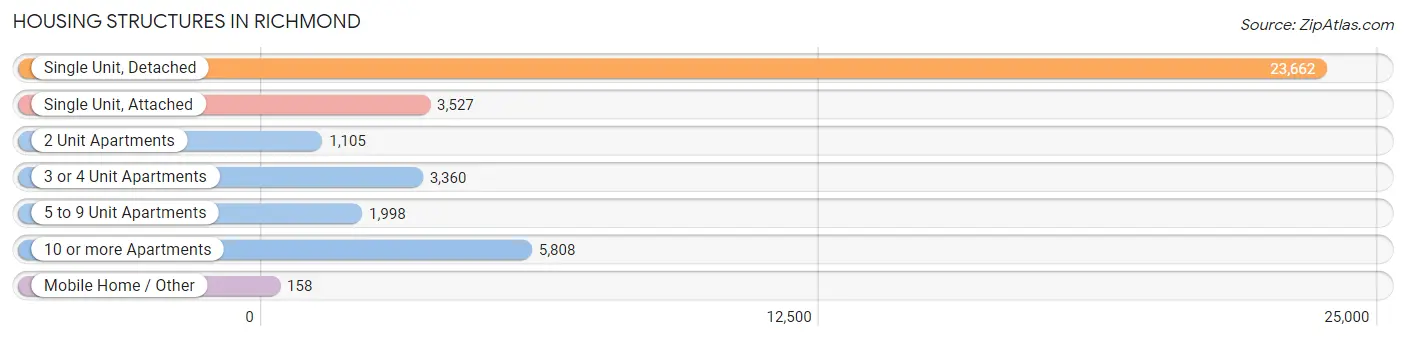
| Structure Type | # Housing Units | % Housing Units |
| Single Unit, Detached | 23,662 | 59.7% |
| Single Unit, Attached | 3,527 | 8.9% |
| 2 Unit Apartments | 1,105 | 2.8% |
| 3 or 4 Unit Apartments | 3,360 | 8.5% |
| 5 to 9 Unit Apartments | 1,998 | 5.0% |
| 10 or more Apartments | 5,808 | 14.7% |
| Mobile Home / Other | 158 | 0.4% |
| Total | 39,618 | 100.0% |
Housing Structures by Occupancy in Richmond
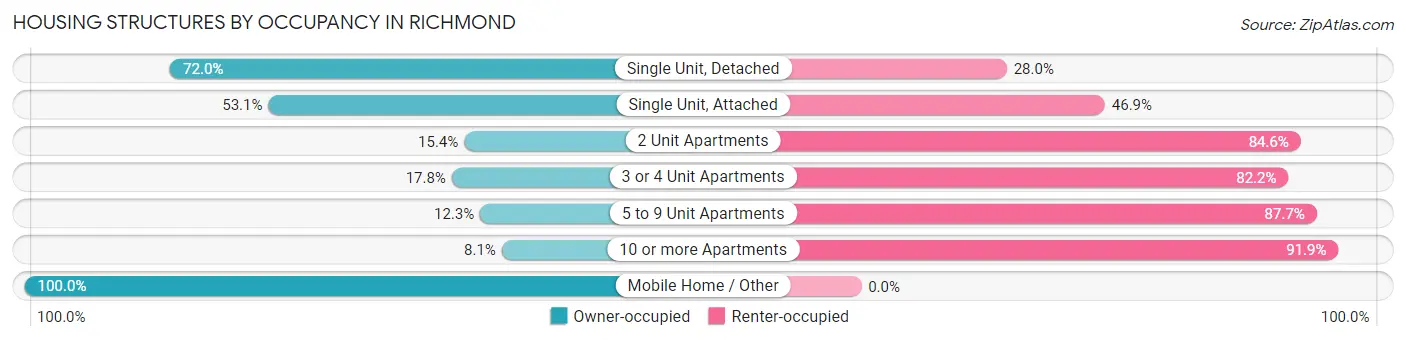
| Structure Type | Owner-occupied | Renter-occupied |
| Single Unit, Detached | 17,029 (72.0%) | 6,633 (28.0%) |
| Single Unit, Attached | 1,872 (53.1%) | 1,655 (46.9%) |
| 2 Unit Apartments | 170 (15.4%) | 935 (84.6%) |
| 3 or 4 Unit Apartments | 597 (17.8%) | 2,763 (82.2%) |
| 5 to 9 Unit Apartments | 246 (12.3%) | 1,752 (87.7%) |
| 10 or more Apartments | 473 (8.1%) | 5,335 (91.9%) |
| Mobile Home / Other | 158 (100.0%) | 0 (0.0%) |
| Total | 20,545 (51.9%) | 19,073 (48.1%) |
Housing Structures by Number of Rooms in Richmond
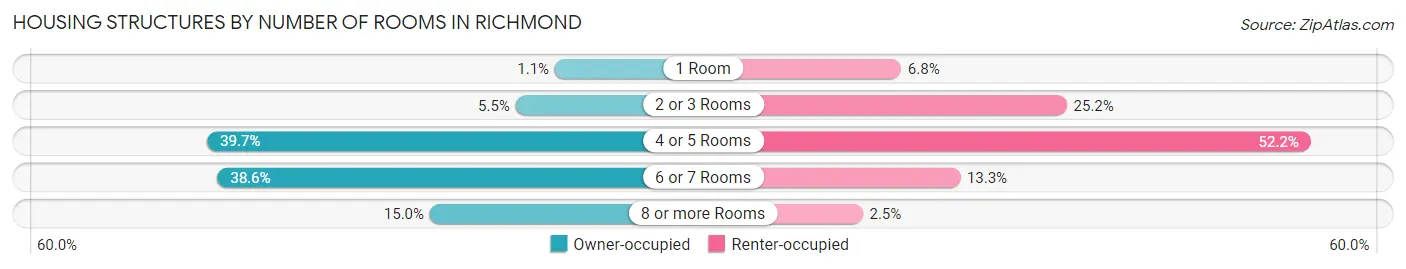
| Number of Rooms | Owner-occupied | Renter-occupied |
| 1 Room | 234 (1.1%) | 1,292 (6.8%) |
| 2 or 3 Rooms | 1,129 (5.5%) | 4,799 (25.2%) |
| 4 or 5 Rooms | 8,165 (39.7%) | 9,963 (52.2%) |
| 6 or 7 Rooms | 7,932 (38.6%) | 2,541 (13.3%) |
| 8 or more Rooms | 3,085 (15.0%) | 478 (2.5%) |
| Total | 20,545 (100.0%) | 19,073 (100.0%) |
Housing Structure by Heating Type in Richmond
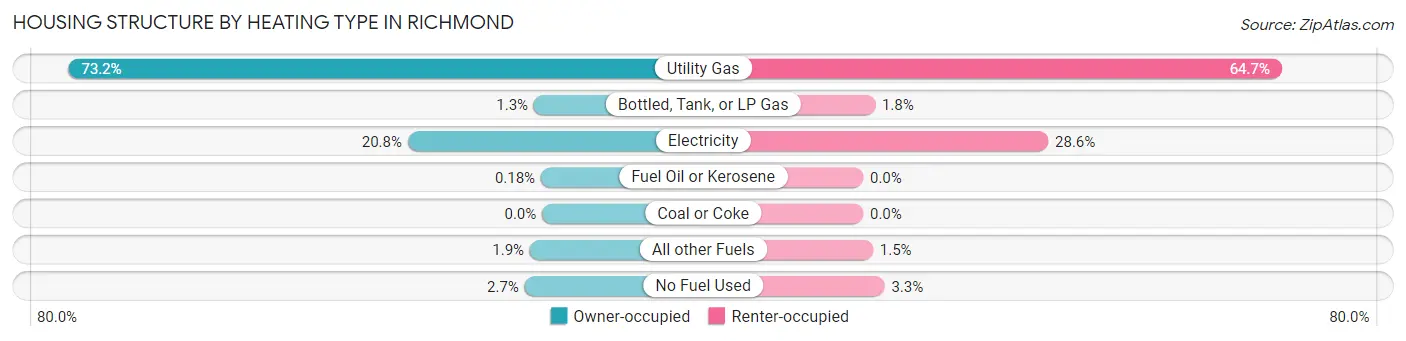
| Heating Type | Owner-occupied | Renter-occupied |
| Utility Gas | 15,046 (73.2%) | 12,344 (64.7%) |
| Bottled, Tank, or LP Gas | 258 (1.3%) | 351 (1.8%) |
| Electricity | 4,265 (20.8%) | 5,456 (28.6%) |
| Fuel Oil or Kerosene | 37 (0.2%) | 0 (0.0%) |
| Coal or Coke | 0 (0.0%) | 0 (0.0%) |
| All other Fuels | 387 (1.9%) | 290 (1.5%) |
| No Fuel Used | 552 (2.7%) | 632 (3.3%) |
| Total | 20,545 (100.0%) | 19,073 (100.0%) |
Household Vehicle Usage in Richmond
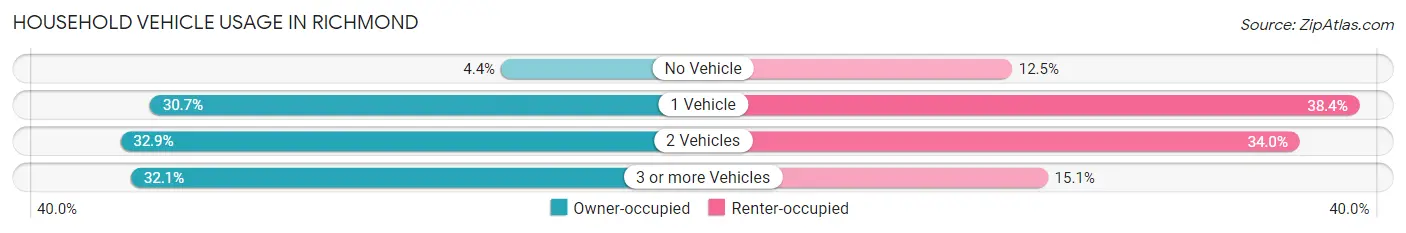
| Vehicles per Household | Owner-occupied | Renter-occupied |
| No Vehicle | 911 (4.4%) | 2,376 (12.5%) |
| 1 Vehicle | 6,298 (30.6%) | 7,330 (38.4%) |
| 2 Vehicles | 6,750 (32.9%) | 6,479 (34.0%) |
| 3 or more Vehicles | 6,586 (32.1%) | 2,888 (15.1%) |
| Total | 20,545 (100.0%) | 19,073 (100.0%) |
Real Estate & Mortgages in Richmond
Real Estate and Mortgage Overview in Richmond
| Characteristic | Without Mortgage | With Mortgage |
| Housing Units | 5,894 | 14,651 |
| Median Property Value | $586,400 | $638,300 |
| Median Household Income | $88,086 | $5,609 |
| Monthly Housing Costs | $693 | $5,296 |
| Real Estate Taxes | $4,263 | $157 |
Property Value by Mortgage Status in Richmond
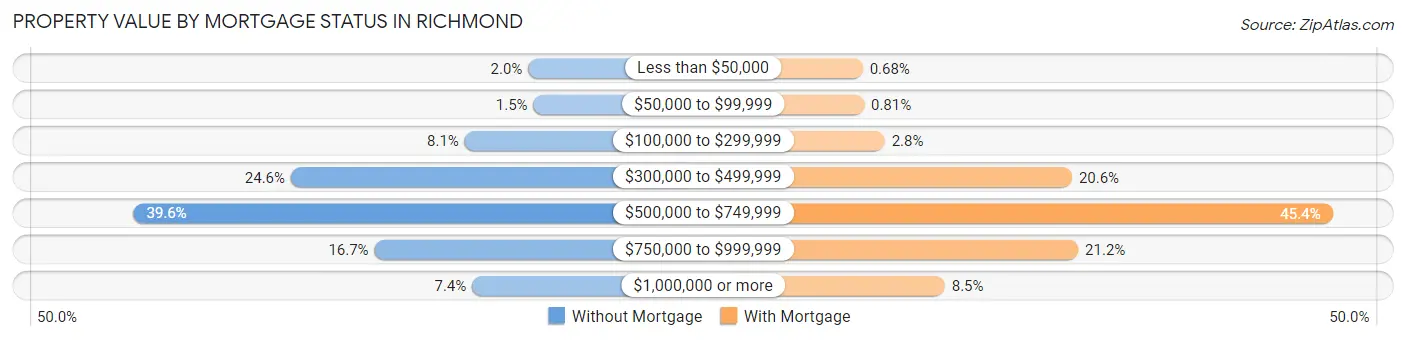
| Property Value | Without Mortgage | With Mortgage |
| Less than $50,000 | 120 (2.0%) | 99 (0.7%) |
| $50,000 to $99,999 | 91 (1.5%) | 119 (0.8%) |
| $100,000 to $299,999 | 477 (8.1%) | 407 (2.8%) |
| $300,000 to $499,999 | 1,452 (24.6%) | 3,020 (20.6%) |
| $500,000 to $749,999 | 2,336 (39.6%) | 6,655 (45.4%) |
| $750,000 to $999,999 | 983 (16.7%) | 3,106 (21.2%) |
| $1,000,000 or more | 435 (7.4%) | 1,245 (8.5%) |
| Total | 5,894 (100.0%) | 14,651 (100.0%) |
Household Income by Mortgage Status in Richmond
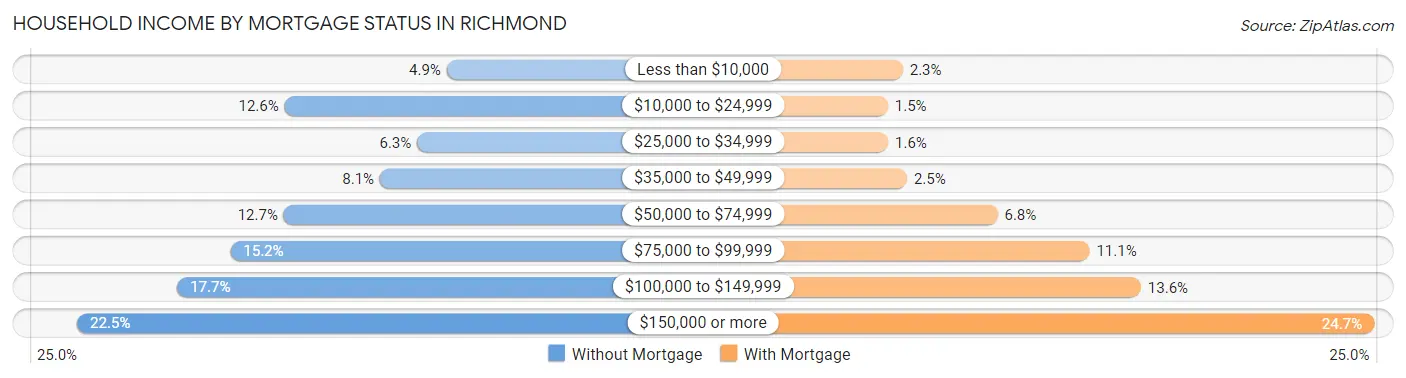
| Household Income | Without Mortgage | With Mortgage |
| Less than $10,000 | 289 (4.9%) | 330 (2.2%) |
| $10,000 to $24,999 | 744 (12.6%) | 226 (1.5%) |
| $25,000 to $34,999 | 372 (6.3%) | 227 (1.5%) |
| $35,000 to $49,999 | 476 (8.1%) | 359 (2.5%) |
| $50,000 to $74,999 | 746 (12.7%) | 990 (6.8%) |
| $75,000 to $99,999 | 896 (15.2%) | 1,632 (11.1%) |
| $100,000 to $149,999 | 1,045 (17.7%) | 1,991 (13.6%) |
| $150,000 or more | 1,326 (22.5%) | 3,617 (24.7%) |
| Total | 5,894 (100.0%) | 14,651 (100.0%) |
Property Value to Household Income Ratio in Richmond
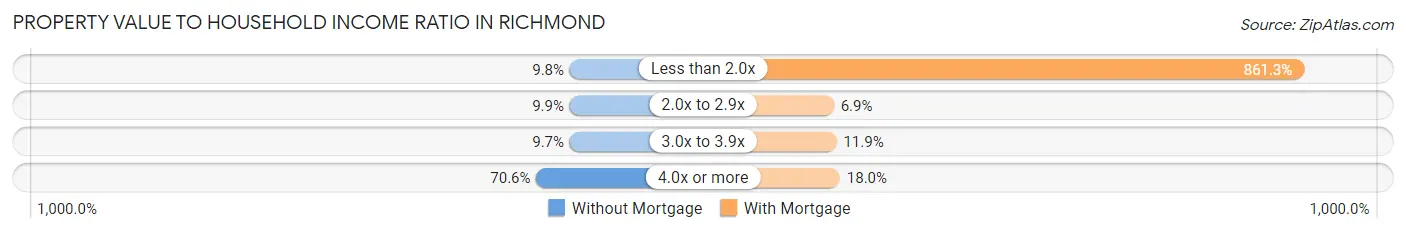
| Value-to-Income Ratio | Without Mortgage | With Mortgage |
| Less than 2.0x | 577 (9.8%) | 126,185 (861.3%) |
| 2.0x to 2.9x | 585 (9.9%) | 1,014 (6.9%) |
| 3.0x to 3.9x | 572 (9.7%) | 1,748 (11.9%) |
| 4.0x or more | 4,160 (70.6%) | 2,643 (18.0%) |
| Total | 5,894 (100.0%) | 14,651 (100.0%) |
Real Estate Taxes by Mortgage Status in Richmond
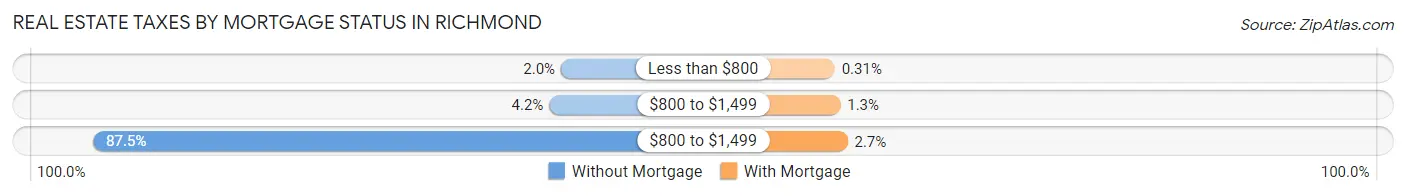
| Property Taxes | Without Mortgage | With Mortgage |
| Less than $800 | 120 (2.0%) | 46 (0.3%) |
| $800 to $1,499 | 247 (4.2%) | 193 (1.3%) |
| $800 to $1,499 | 5,157 (87.5%) | 388 (2.6%) |
| Total | 5,894 (100.0%) | 14,651 (100.0%) |
Health & Disability in Richmond
Health Insurance Coverage by Age in Richmond
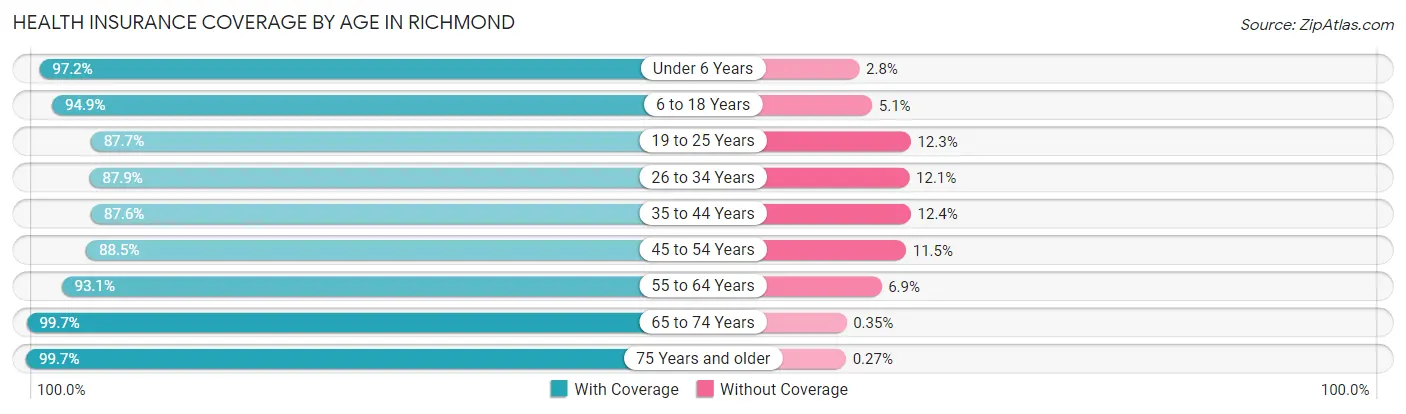
| Age Bracket | With Coverage | Without Coverage |
| Under 6 Years | 7,331 (97.2%) | 208 (2.8%) |
| 6 to 18 Years | 18,485 (94.9%) | 1,001 (5.1%) |
| 19 to 25 Years | 9,224 (87.7%) | 1,298 (12.3%) |
| 26 to 34 Years | 14,197 (87.9%) | 1,953 (12.1%) |
| 35 to 44 Years | 14,345 (87.6%) | 2,025 (12.4%) |
| 45 to 54 Years | 13,735 (88.5%) | 1,779 (11.5%) |
| 55 to 64 Years | 12,032 (93.1%) | 890 (6.9%) |
| 65 to 74 Years | 10,742 (99.7%) | 38 (0.4%) |
| 75 Years and older | 5,530 (99.7%) | 15 (0.3%) |
| Total | 105,621 (92.0%) | 9,207 (8.0%) |
Health Insurance Coverage by Citizenship Status in Richmond
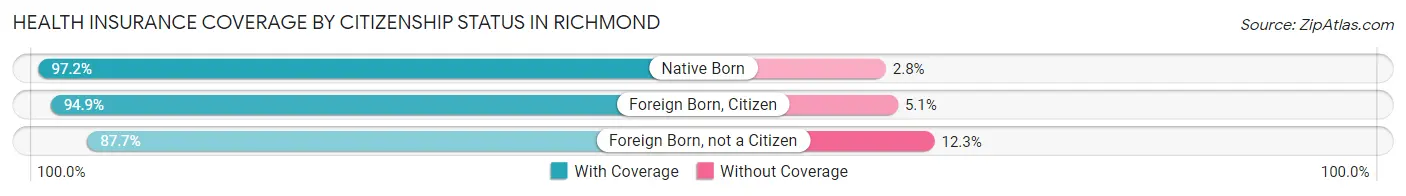
| Citizenship Status | With Coverage | Without Coverage |
| Native Born | 7,331 (97.2%) | 208 (2.8%) |
| Foreign Born, Citizen | 18,485 (94.9%) | 1,001 (5.1%) |
| Foreign Born, not a Citizen | 9,224 (87.7%) | 1,298 (12.3%) |
Health Insurance Coverage by Household Income in Richmond
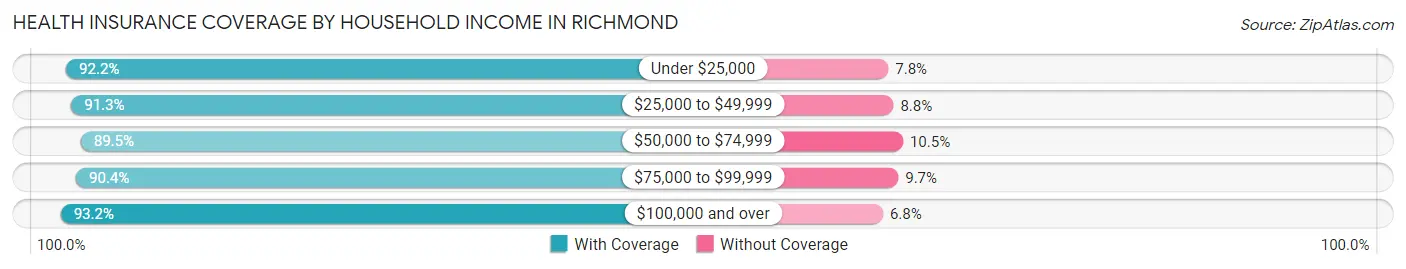
| Household Income | With Coverage | Without Coverage |
| Under $25,000 | 10,019 (92.2%) | 846 (7.8%) |
| $25,000 to $49,999 | 15,009 (91.2%) | 1,439 (8.7%) |
| $50,000 to $74,999 | 12,961 (89.5%) | 1,525 (10.5%) |
| $75,000 to $99,999 | 14,374 (90.3%) | 1,535 (9.7%) |
| $100,000 and over | 52,566 (93.2%) | 3,816 (6.8%) |
Public vs Private Health Insurance Coverage by Age in Richmond
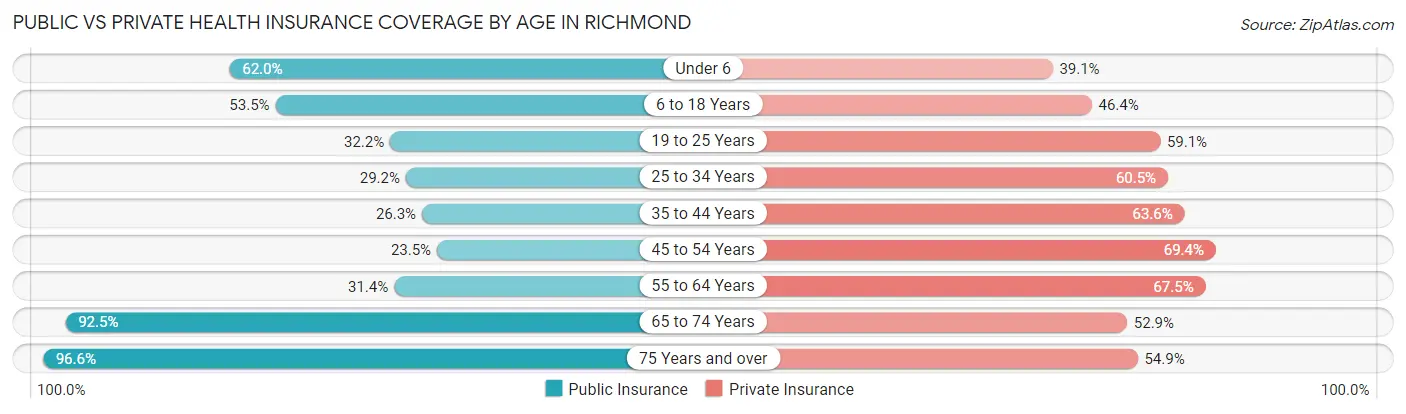
| Age Bracket | Public Insurance | Private Insurance |
| Under 6 | 4,674 (62.0%) | 2,948 (39.1%) |
| 6 to 18 Years | 10,415 (53.4%) | 9,031 (46.4%) |
| 19 to 25 Years | 3,385 (32.2%) | 6,213 (59.1%) |
| 25 to 34 Years | 4,722 (29.2%) | 9,776 (60.5%) |
| 35 to 44 Years | 4,297 (26.3%) | 10,417 (63.6%) |
| 45 to 54 Years | 3,639 (23.5%) | 10,770 (69.4%) |
| 55 to 64 Years | 4,062 (31.4%) | 8,722 (67.5%) |
| 65 to 74 Years | 9,967 (92.5%) | 5,704 (52.9%) |
| 75 Years and over | 5,358 (96.6%) | 3,043 (54.9%) |
| Total | 50,519 (44.0%) | 66,624 (58.0%) |
Disability Status by Sex by Age in Richmond
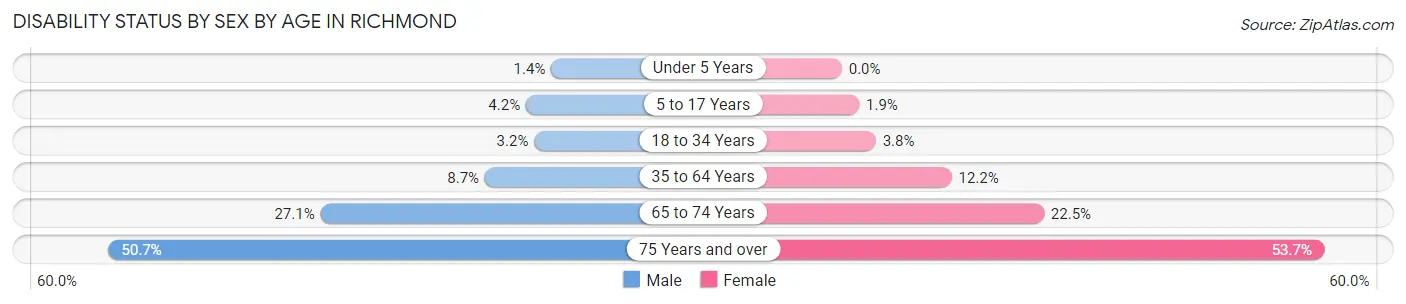
| Age Bracket | Male | Female |
| Under 5 Years | 47 (1.3%) | 0 (0.0%) |
| 5 to 17 Years | 408 (4.2%) | 168 (1.9%) |
| 18 to 34 Years | 461 (3.2%) | 557 (3.8%) |
| 35 to 64 Years | 1,913 (8.7%) | 2,798 (12.2%) |
| 65 to 74 Years | 1,307 (27.1%) | 1,339 (22.5%) |
| 75 Years and over | 1,148 (50.7%) | 1,760 (53.7%) |
Disability Class by Sex by Age in Richmond
Disability Class: Hearing Difficulty
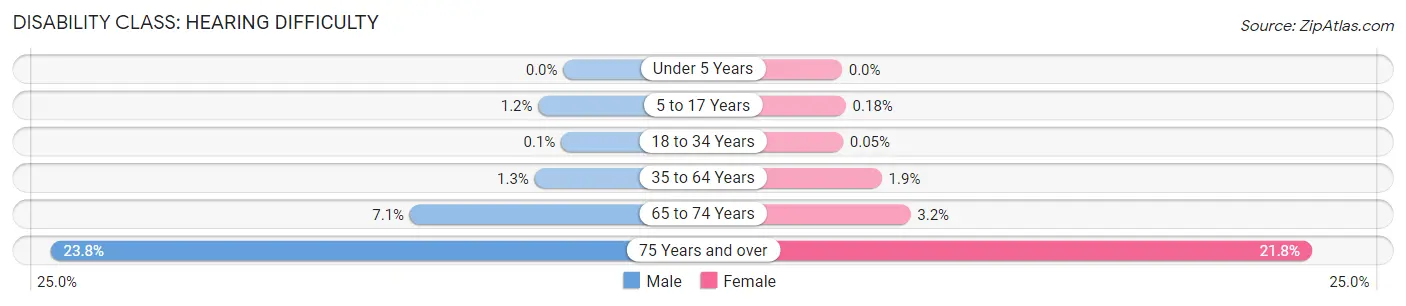
| Age Bracket | Male | Female |
| Under 5 Years | 0 (0.0%) | 0 (0.0%) |
| 5 to 17 Years | 114 (1.2%) | 16 (0.2%) |
| 18 to 34 Years | 14 (0.1%) | 8 (0.1%) |
| 35 to 64 Years | 292 (1.3%) | 424 (1.8%) |
| 65 to 74 Years | 344 (7.1%) | 189 (3.2%) |
| 75 Years and over | 539 (23.8%) | 715 (21.8%) |
Disability Class: Vision Difficulty
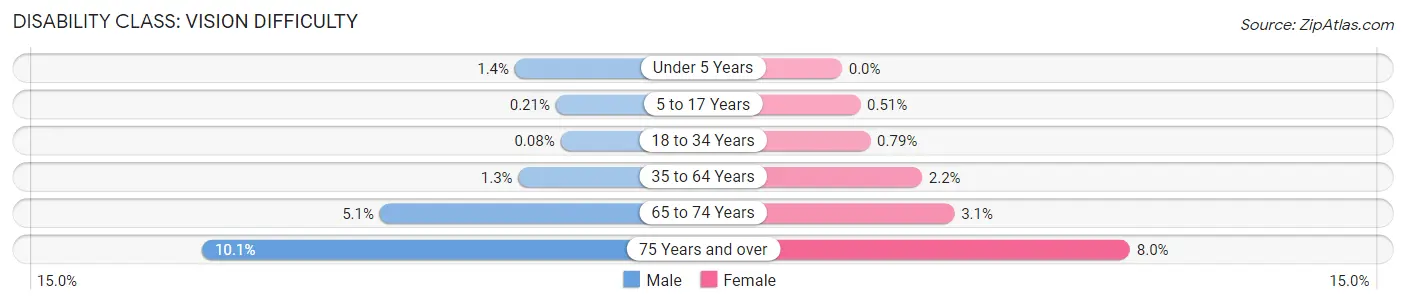
| Age Bracket | Male | Female |
| Under 5 Years | 47 (1.3%) | 0 (0.0%) |
| 5 to 17 Years | 21 (0.2%) | 44 (0.5%) |
| 18 to 34 Years | 11 (0.1%) | 117 (0.8%) |
| 35 to 64 Years | 274 (1.3%) | 510 (2.2%) |
| 65 to 74 Years | 247 (5.1%) | 186 (3.1%) |
| 75 Years and over | 228 (10.1%) | 263 (8.0%) |
Disability Class: Cognitive Difficulty
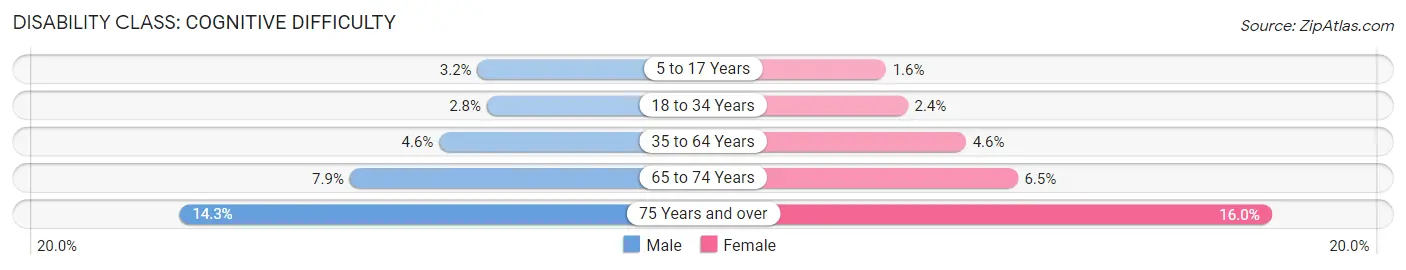
| Age Bracket | Male | Female |
| 5 to 17 Years | 313 (3.2%) | 142 (1.6%) |
| 18 to 34 Years | 404 (2.8%) | 360 (2.4%) |
| 35 to 64 Years | 1,011 (4.6%) | 1,054 (4.6%) |
| 65 to 74 Years | 383 (7.9%) | 388 (6.5%) |
| 75 Years and over | 323 (14.2%) | 523 (16.0%) |
Disability Class: Ambulatory Difficulty
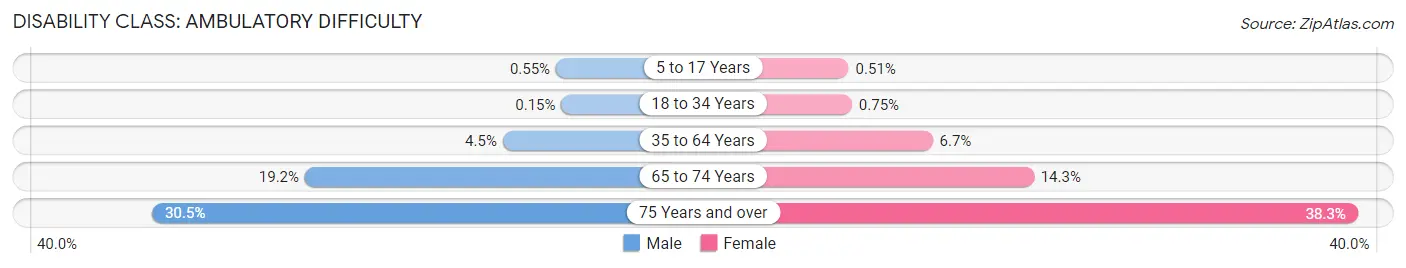
| Age Bracket | Male | Female |
| 5 to 17 Years | 54 (0.5%) | 44 (0.5%) |
| 18 to 34 Years | 21 (0.2%) | 110 (0.7%) |
| 35 to 64 Years | 986 (4.5%) | 1,544 (6.7%) |
| 65 to 74 Years | 927 (19.2%) | 848 (14.2%) |
| 75 Years and over | 692 (30.5%) | 1,256 (38.3%) |
Disability Class: Self-Care Difficulty
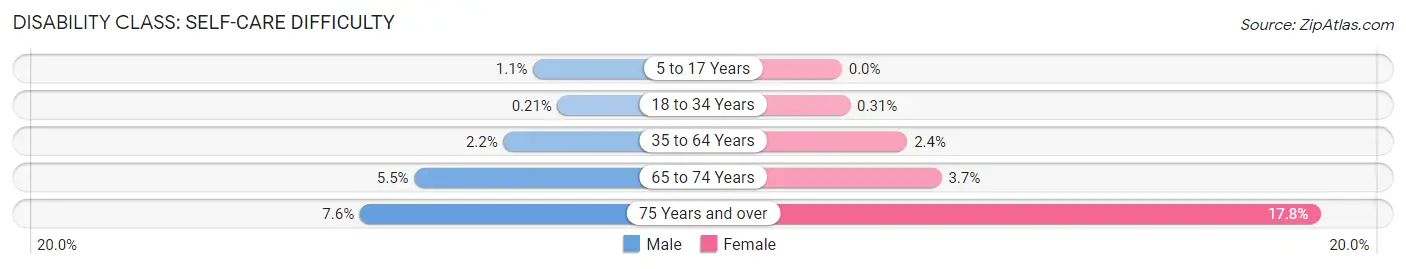
| Age Bracket | Male | Female |
| 5 to 17 Years | 109 (1.1%) | 0 (0.0%) |
| 18 to 34 Years | 30 (0.2%) | 46 (0.3%) |
| 35 to 64 Years | 487 (2.2%) | 556 (2.4%) |
| 65 to 74 Years | 267 (5.5%) | 220 (3.7%) |
| 75 Years and over | 171 (7.5%) | 582 (17.7%) |
Technology Access in Richmond
Computing Device Access in Richmond
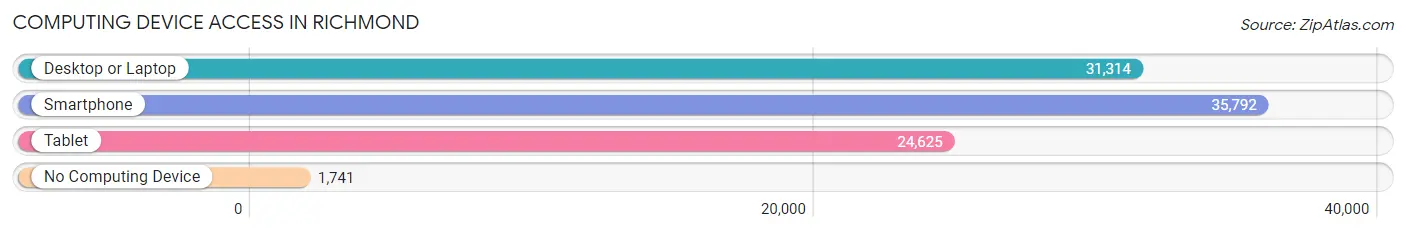
| Device Type | # Households | % Households |
| Desktop or Laptop | 31,314 | 79.0% |
| Smartphone | 35,792 | 90.3% |
| Tablet | 24,625 | 62.2% |
| No Computing Device | 1,741 | 4.4% |
| Total | 39,618 | 100.0% |
Internet Access in Richmond
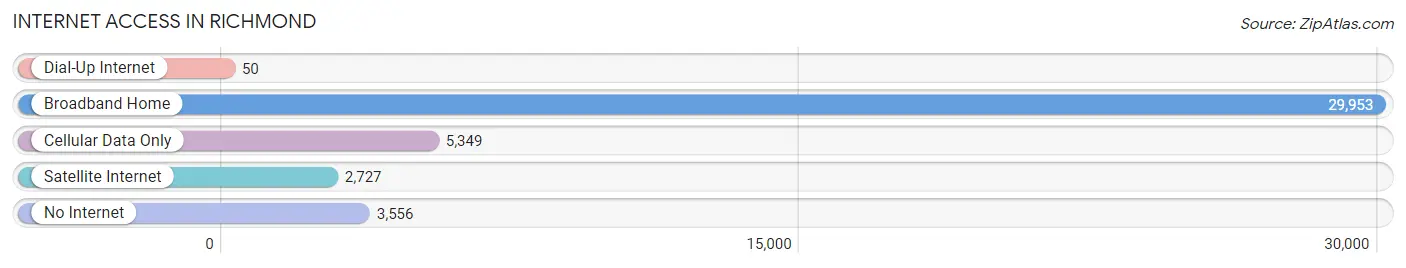
| Internet Type | # Households | % Households |
| Dial-Up Internet | 50 | 0.1% |
| Broadband Home | 29,953 | 75.6% |
| Cellular Data Only | 5,349 | 13.5% |
| Satellite Internet | 2,727 | 6.9% |
| No Internet | 3,556 | 9.0% |
| Total | 39,618 | 100.0% |
Richmond Summary
Richmond, California is a city located in Contra Costa County, in the San Francisco Bay Area. It is situated on the eastern shore of the San Francisco Bay, and is the largest city in the county. Richmond has a population of approximately 110,000 people, and is the fourth most populous city in the Bay Area.
Richmond has a long and rich history, dating back to the early 1800s when it was first settled by the Ohlone people. In the mid-1800s, the area was developed by the California Gold Rush, and the city was incorporated in 1905. Since then, Richmond has grown to become a major industrial center, with a strong economy based on manufacturing, shipping, and other industries.
Geographically, Richmond is located on the eastern shore of the San Francisco Bay, and is bordered by the cities of San Pablo, El Cerrito, and Pinole. The city is divided into two distinct areas: the flatlands, which are located near the bay, and the hills, which are located further inland. The city is home to several parks, including Miller/Knox Regional Shoreline, Point Pinole Regional Shoreline, and Wildcat Canyon Regional Park.
Richmond's economy is largely based on manufacturing and shipping. The city is home to several large industrial companies, including Chevron, Kaiser Permanente, and the Port of Richmond. Additionally, Richmond is home to a number of smaller businesses, including restaurants, retail stores, and other services. The city also has a thriving arts and culture scene, with several galleries, theaters, and music venues.
Richmond's demographics are diverse, with a population that is approximately 40% White, 30% Hispanic, and 20% African American. Additionally, the city is home to a large Asian population, with approximately 10% of the population identifying as Asian. The median household income in Richmond is approximately $60,000, and the median home value is approximately $400,000.
Richmond is a vibrant and diverse city, with a rich history and a strong economy. It is home to a diverse population, and is a great place to live, work, and play. With its strong economy, diverse population, and beautiful scenery, Richmond is a great place to call home.
Common Questions
What is Per Capita Income in Richmond?
Per Capita income in Richmond is $38,522.
What is the Median Family Income in Richmond?
Median Family Income in Richmond is $92,312.
What is the Median Household income in Richmond?
Median Household Income in Richmond is $86,618.
What is Income or Wage Gap in Richmond?
Income or Wage Gap in Richmond is 20.1%.
Women in Richmond earn 79.9 cents for every dollar earned by a man.
What is Family Income Deficit in Richmond?
Family Income Deficit in Richmond is $13,405.
Families that are below poverty line in Richmond earn $13,405 less on average than the poverty threshold level.
What is Inequality or Gini Index in Richmond?
Inequality or Gini Index in Richmond is 0.44.
What is the Total Population of Richmond?
Total Population of Richmond is 115,619.
What is the Total Male Population of Richmond?
Total Male Population of Richmond is 57,131.
What is the Total Female Population of Richmond?
Total Female Population of Richmond is 58,488.
What is the Ratio of Males per 100 Females in Richmond?
There are 97.68 Males per 100 Females in Richmond.
What is the Ratio of Females per 100 Males in Richmond?
There are 102.38 Females per 100 Males in Richmond.
What is the Median Population Age in Richmond?
Median Population Age in Richmond is 37.1 Years.
What is the Average Family Size in Richmond
Average Family Size in Richmond is 3.5 People.
What is the Average Household Size in Richmond
Average Household Size in Richmond is 2.9 People.
How Large is the Labor Force in Richmond?
There are 62,690 People in the Labor Forcein in Richmond.
What is the Percentage of People in the Labor Force in Richmond?
66.6% of People are in the Labor Force in Richmond.
What is the Unemployment Rate in Richmond?
Unemployment Rate in Richmond is 6.9%.