Cities with the Lowest Percentage of Births to Unmarried Women over the Age of 35 in Kansas

RELATED REPORTS & OPTIONS

Lowest Illegitimacy | Women 35+
Population
Families and Households
Female Fertility
Female Fertility (Unmarried)
Race (Community Size)
Race (Percentage)
Ancestry (Community Size)
AfghanAfricanAlaska NativeAlaskan AthabascanAlbanianAleutAlsatianAmericanApacheArabArapahoArgentineanArmenianAssyrian / Chaldean / SyriacAustralianAustrianBahamianBangladeshiBarbadianBasqueBelgianBelizeanBermudanBhutaneseBlackfeetBolivianBrazilianBritishBritish West IndianBulgarianBurmeseCajunCambodianCanadianCape VerdeanCarpatho RusynCelticCentral AmericanCentral American IndianCherokeeCheyenneChickasawChileanChineseChippewaChoctawColombianColvilleComancheCosta RicanCreeCreekCroatianCrowCubanCypriotCzechCzechoslovakianDanishDelawareDominicanDutchDutch West IndianEastern EuropeanEcuadorianEgyptianEnglishEstonianEthiopianEuropeanFijianFilipinoFinnishFrenchFrench American IndianFrench CanadianGermanGerman RussianGhanaianGreekGuamanian / ChamorroGuatemalanGuyaneseHaitianHmongHonduranHopiHoumaHungarianIcelanderIndian (Asian)IndonesianInupiatIranianIraqiIrishIroquoisIsraeliItalianJamaicanJapaneseJordanianKenyanKiowaKoreanLaotianLatvianLebaneseLiberianLithuanianLumbeeLuxembourgerMacedonianMalaysianMalteseMarshalleseMenomineeMexicanMexican American IndianMongolianMoroccanNative HawaiianNavajoNepaleseNew ZealanderNicaraguanNigerianNorthern EuropeanNorwegianOkinawanOsageOttawaPaiutePakistaniPalestinianPanamanianParaguayanPennsylvania GermanPeruvianPimaPolishPortuguesePotawatomiPuebloPuerto RicanPuget Sound SalishRomanianRussianSalvadoranSamoanScandinavianScotch-IrishScottishSeminoleSenegaleseSerbianShoshoneSierra LeoneanSiouxSlavicSlovakSloveneSomaliSouth AfricanSouth AmericanSouth American IndianSoviet UnionSpaniardSpanishSpanish AmericanSpanish American IndianSri LankanSubsaharan AfricanSudaneseSwedishSwissSyrianTaiwaneseThaiTlingit-HaidaTohono O'OdhamTonganTrinidadian and TobagonianTsimshianTurkishU.S. Virgin IslanderUgandanUkrainianUruguayanUteVenezuelanVietnameseWelshWest IndianYakamaYaquiYugoslavianYumanYup'ikZimbabwean
Ancestry (Percentage)
AfghanAfricanAlaska NativeAlaskan AthabascanAlbanianAleutAlsatianAmericanApacheArabArapahoArgentineanArmenianAssyrian / Chaldean / SyriacAustralianAustrianBahamianBangladeshiBarbadianBasqueBelgianBelizeanBermudanBhutaneseBlackfeetBolivianBrazilianBritishBritish West IndianBulgarianBurmeseCajunCambodianCanadianCape VerdeanCarpatho RusynCelticCentral AmericanCentral American IndianCherokeeCheyenneChickasawChileanChineseChippewaChoctawColombianColvilleComancheCosta RicanCreeCreekCroatianCrowCubanCypriotCzechCzechoslovakianDanishDelawareDominicanDutchDutch West IndianEastern EuropeanEcuadorianEgyptianEnglishEstonianEthiopianEuropeanFijianFilipinoFinnishFrenchFrench American IndianFrench CanadianGermanGerman RussianGhanaianGreekGuamanian / ChamorroGuatemalanGuyaneseHaitianHmongHonduranHopiHoumaHungarianIcelanderIndian (Asian)IndonesianInupiatIranianIraqiIrishIroquoisIsraeliItalianJamaicanJapaneseJordanianKenyanKiowaKoreanLaotianLatvianLebaneseLiberianLithuanianLumbeeLuxembourgerMacedonianMalaysianMalteseMarshalleseMenomineeMexicanMexican American IndianMongolianMoroccanNative HawaiianNavajoNepaleseNew ZealanderNicaraguanNigerianNorthern EuropeanNorwegianOkinawanOsageOttawaPaiutePakistaniPalestinianPanamanianParaguayanPennsylvania GermanPeruvianPimaPolishPortuguesePotawatomiPuebloPuerto RicanPuget Sound SalishRomanianRussianSalvadoranSamoanScandinavianScotch-IrishScottishSeminoleSenegaleseSerbianShoshoneSierra LeoneanSiouxSlavicSlovakSloveneSomaliSouth AfricanSouth AmericanSouth American IndianSoviet UnionSpaniardSpanishSpanish AmericanSpanish American IndianSri LankanSubsaharan AfricanSudaneseSwedishSwissSyrianTaiwaneseThaiTlingit-HaidaTohono O'OdhamTonganTrinidadian and TobagonianTsimshianTurkishU.S. Virgin IslanderUgandanUkrainianUruguayanUteVenezuelanVietnameseWelshWest IndianYakamaYaquiYugoslavianYumanYup'ikZimbabwean
Immigrant Origin (Total)
AfghanistanAfricaAlbaniaArgentinaArmeniaAsiaAustraliaAustriaAzoresBahamasBangladeshBarbadosBelarusBelgiumBelizeBoliviaBosnia and HerzegovinaBrazilBulgariaBurma / MyanmarCabo VerdeCambodiaCameroonCanadaCaribbeanCentral AmericaChileChinaColombiaCongoCosta RicaCroatiaCubaCzechoslovakiaDenmarkDominicaDominican RepublicEastern AfricaEastern AsiaEastern EuropeEcuadorEgyptEl SalvadorEnglandEritreaEthiopiaEuropeFijiFranceGermanyGhanaGreeceGrenadaGuatemalaGuyanaHaitiHondurasHong KongHungaryIndiaIndonesiaIranIraqIrelandIsraelItalyJamaicaJapanJordanKazakhstanKenyaKoreaKuwaitLaosLatin AmericaLatviaLebanonLiberiaLithuaniaMalaysiaMexicoMicronesiaMiddle AfricaMoldovaMoroccoNepalNetherlandsNicaraguaNigeriaNorth MacedoniaNorthern AfricaNorthern EuropeNorwayOceaniaPakistanPanamaPeruPhilippinesPolandPortugalRomaniaRussiaSaudi ArabiaScotlandSenegalSerbiaSierra LeoneSingaporeSomaliaSouth AfricaSouth AmericaSouth Central AsiaSouth Eastern AsiaSouthern EuropeSpainSri LankaSt. Vincent and the GrenadinesSudanSwedenSwitzerlandSyriaTaiwanThailandTrinidad and TobagoTurkeyUgandaUkraineUruguayUzbekistanVenezuelaVietnamWest IndiesWestern AfricaWestern AsiaWestern EuropeYemenZaireZimbabwe
Immigrant Origin (Percentage)
AfghanistanAfricaAlbaniaArgentinaArmeniaAsiaAustraliaAustriaAzoresBahamasBangladeshBarbadosBelarusBelgiumBelizeBoliviaBosnia and HerzegovinaBrazilBulgariaBurma / MyanmarCabo VerdeCambodiaCameroonCanadaCaribbeanCentral AmericaChileChinaColombiaCongoCosta RicaCroatiaCubaCzechoslovakiaDenmarkDominicaDominican RepublicEastern AfricaEastern AsiaEastern EuropeEcuadorEgyptEl SalvadorEnglandEritreaEthiopiaEuropeFijiFranceGermanyGhanaGreeceGrenadaGuatemalaGuyanaHaitiHondurasHong KongHungaryIndiaIndonesiaIranIraqIrelandIsraelItalyJamaicaJapanJordanKazakhstanKenyaKoreaKuwaitLaosLatin AmericaLatviaLebanonLiberiaLithuaniaMalaysiaMexicoMicronesiaMiddle AfricaMoldovaMoroccoNepalNetherlandsNicaraguaNigeriaNorth MacedoniaNorthern AfricaNorthern EuropeNorwayOceaniaPakistanPanamaPeruPhilippinesPolandPortugalRomaniaRussiaSaudi ArabiaScotlandSenegalSerbiaSierra LeoneSingaporeSomaliaSouth AfricaSouth AmericaSouth Central AsiaSouth Eastern AsiaSouthern EuropeSpainSri LankaSt. Vincent and the GrenadinesSudanSwedenSwitzerlandSyriaTaiwanThailandTrinidad and TobagoTurkeyUgandaUkraineUruguayUzbekistanVenezuelaVietnamWest IndiesWestern AfricaWestern AsiaWestern EuropeYemenZaireZimbabwe
Income
Income (Families)
Income (Households)
Poverty
Poverty (Families)
Unemployment
Employment Occupations
Employment Industries
Employer Class
Commute Time
Commute Means
School Enrollment
Education by Degree Field
Occupancy
Finances
Physical Characteristics
Kansas
Compare Cities
Comparison Subject

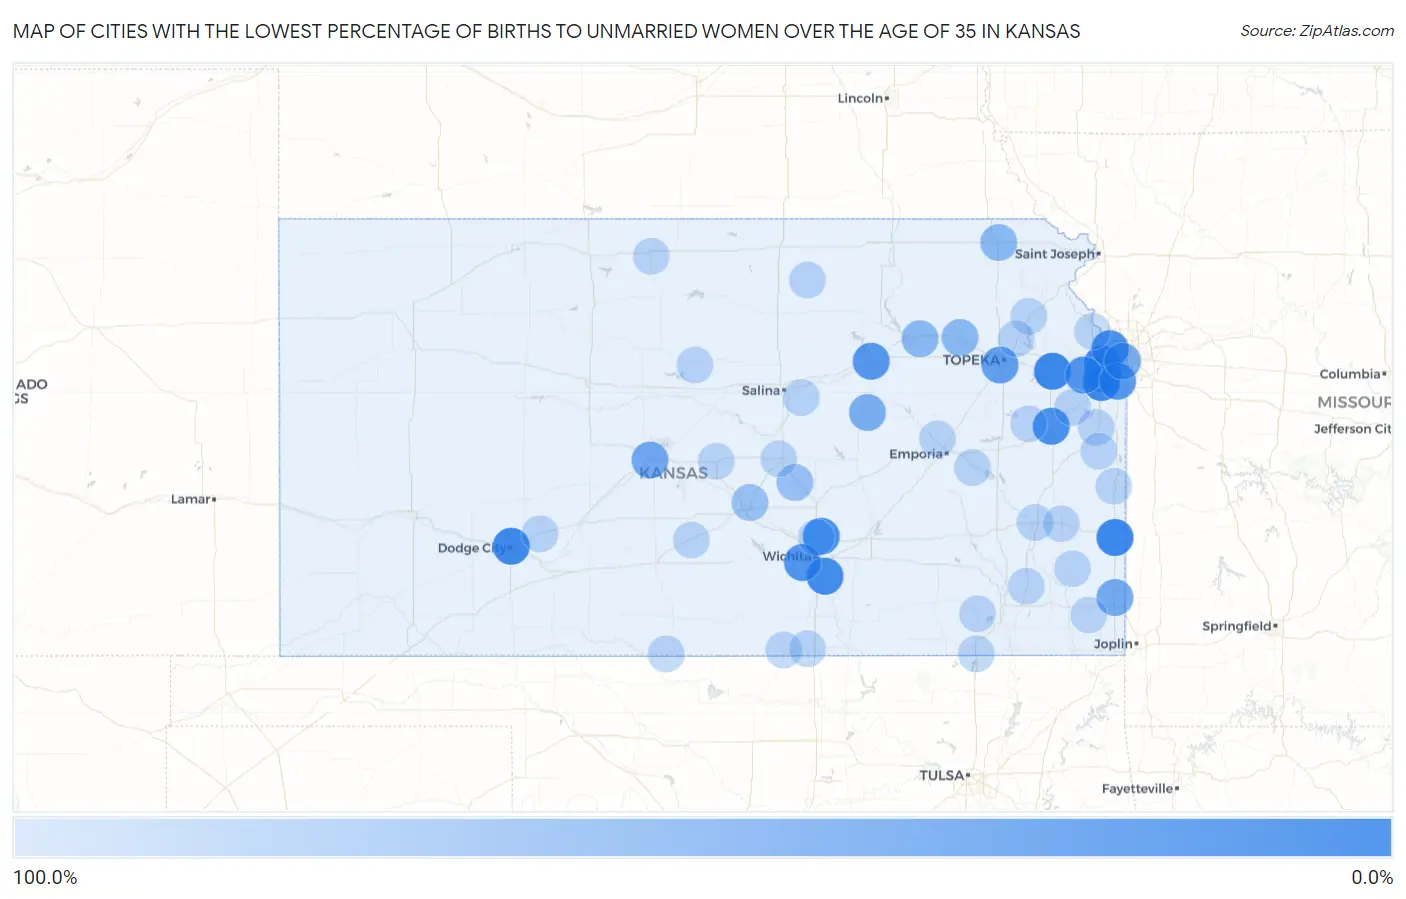
Map of Cities with the Lowest Percentage of Births to Unmarried Women over the Age of 35 in Kansas

100.0%
0.0%
Cities with the Lowest Percentage of Births to Unmarried Women over the Age of 35 in Kansas Map

Cities with the Lowest Percentage of Births to Unmarried Women over the Age of 35 in Kansas

City % Unmarried vs State vs National
1.Shawnee5.9%16.8%(-10.9)#120.1%(-14.2)#160
2.Lenexa6.5%16.8%(-10.3)#220.1%(-13.6)#183
3.Lawrence8.3%16.8%(-8.50)#320.1%(-11.8)#272
4.Fort Scott8.7%16.8%(-8.10)#420.1%(-11.4)#293
5.Dodge City10.4%16.8%(-6.40)#520.1%(-9.70)#366
6.Olathe11.0%16.8%(-5.80)#620.1%(-9.10)#386
7.Derby13.3%16.8%(-3.50)#720.1%(-6.80)#505
8.Kansas City17.0%16.8%(+0.200)#820.1%(-3.10)#730
9.Kechi20.0%16.8%(+3.20)#920.1%(-0.100)#874
10.Ottawa20.4%16.8%(+3.60)#1020.1%(+0.300)#900
11.De Soto24.6%16.8%(+7.80)#1120.1%(+4.50)#1,091
12.Wichita25.1%16.8%(+8.30)#1220.1%(+5.00)#1,117
13.Junction City28.1%16.8%(+11.3)#1320.1%(+8.00)#1,252
14.Overland Park29.6%16.8%(+12.8)#1420.1%(+9.50)#1,321
15.Topeka37.8%16.8%(+21.0)#1520.1%(+17.7)#1,669
16.Great Bend48.6%16.8%(+31.8)#1620.1%(+28.5)#2,004
17.Pittsburg50.0%16.8%(+33.2)#1720.1%(+29.9)#2,031
18.Roeland Park52.0%16.8%(+35.2)#1820.1%(+31.9)#2,120
19.Herington53.8%16.8%(+37.0)#1920.1%(+33.7)#2,166
20.St Marys66.7%16.8%(+49.9)#2020.1%(+46.6)#2,453
21.St George66.7%16.8%(+49.9)#2120.1%(+46.6)#2,462
22.Fairview66.7%16.8%(+49.9)#2220.1%(+46.6)#2,468
23.Moundridge77.8%16.8%(+61.0)#2320.1%(+57.7)#2,603
24.Hutchinson79.3%16.8%(+62.5)#2420.1%(+59.2)#2,620
25.Mcpherson100.0%16.8%(+83.2)#2520.1%(+79.9)#2,836
26.Lansing100.0%16.8%(+83.2)#2620.1%(+79.9)#2,883
27.Park City100.0%16.8%(+83.2)#2720.1%(+79.9)#2,989
28.Paola100.0%16.8%(+83.2)#2820.1%(+79.9)#3,074
29.Iola100.0%16.8%(+83.2)#2920.1%(+79.9)#3,099
30.Lyons100.0%16.8%(+83.2)#3020.1%(+79.9)#3,223
31.Wellsville100.0%16.8%(+83.2)#3120.1%(+79.9)#3,446
32.Pleasanton100.0%16.8%(+83.2)#3220.1%(+79.9)#3,510
33.Caney100.0%16.8%(+83.2)#3320.1%(+79.9)#3,557
34.Smith Center100.0%16.8%(+83.2)#3420.1%(+79.9)#3,560
35.Valley Falls100.0%16.8%(+83.2)#3520.1%(+79.9)#3,648
36.Pomona100.0%16.8%(+83.2)#3620.1%(+79.9)#3,656
37.Americus100.0%16.8%(+83.2)#3720.1%(+79.9)#3,702
38.Spearville100.0%16.8%(+83.2)#3820.1%(+79.9)#3,706
39.Caldwell100.0%16.8%(+83.2)#3920.1%(+79.9)#3,707
40.Clyde100.0%16.8%(+83.2)#4020.1%(+79.9)#3,754
41.Meriden100.0%16.8%(+83.2)#4120.1%(+79.9)#3,838
42.Moran100.0%16.8%(+83.2)#4220.1%(+79.9)#3,957
43.Hartford100.0%16.8%(+83.2)#4320.1%(+79.9)#3,973
44.Thayer100.0%16.8%(+83.2)#4420.1%(+79.9)#3,979
45.Fontana100.0%16.8%(+83.2)#4520.1%(+79.9)#3,986
46.South Haven100.0%16.8%(+83.2)#4620.1%(+79.9)#4,030
47.Sylvan Grove100.0%16.8%(+83.2)#4720.1%(+79.9)#4,038
48.Elk City100.0%16.8%(+83.2)#4820.1%(+79.9)#4,059
49.Turon100.0%16.8%(+83.2)#4920.1%(+79.9)#4,074
50.Hardtner100.0%16.8%(+83.2)#5020.1%(+79.9)#4,091
51.Walnut100.0%16.8%(+83.2)#5120.1%(+79.9)#4,120
52.West Mineral100.0%16.8%(+83.2)#5220.1%(+79.9)#4,144
53.Kipp100.0%16.8%(+83.2)#5320.1%(+79.9)#4,173

Common Questions

What are the Top 10 Cities with the Lowest Percentage of Births to Unmarried Women over the Age of 35 in Kansas?
Top 10 Cities with the Lowest Percentage of Births to Unmarried Women over the Age of 35 in Kansas are:
#1
0.0%
#2
0.0%
#3
0.0%
#4
0.0%
#5
0.0%
#6
0.0%
#7
0.0%
#8
0.0%
#9
0.0%
#10
0.0%
What city has the Lowest Percentage of Births to Unmarried Women over the Age of 35 in Kansas?
Shawnee has the Lowest Percentage of Births to Unmarried Women over the Age of 35 in Kansas with 5.9%.
What is the Percentage of Births to Unmarried Women over the Age of 35 in the State of Kansas?
Percentage of Births to Unmarried Women over the Age of 35 in Kansas is 16.8%.
What is the Percentage of Births to Unmarried Women over the Age of 35 in the United States?
Percentage of Births to Unmarried Women over the Age of 35 in the United States is 20.1%.