Petaluma, CA Map & Demographics
Petaluma Map
Petaluma Overview
$56,290
PER CAPITA INCOME
$138,468
AVG FAMILY INCOME
$108,527
AVG HOUSEHOLD INCOME
21.0%
WAGE / INCOME GAP [ % ]
79.0¢/ $1
WAGE / INCOME GAP [ $ ]
$9,569
FAMILY INCOME DEFICIT
0.43
INEQUALITY / GINI INDEX
59,682
TOTAL POPULATION
29,625
MALE POPULATION
30,057
FEMALE POPULATION
98.56
MALES / 100 FEMALES
101.46
FEMALES / 100 MALES
43.5
MEDIAN AGE
3.0
AVG FAMILY SIZE
2.5
AVG HOUSEHOLD SIZE
32,525
LABOR FORCE [ PEOPLE ]
65.4%
PERCENT IN LABOR FORCE
4.7%
UNEMPLOYMENT RATE
Petaluma Area Codes
Income in Petaluma
Income Overview in Petaluma
Per Capita Income in Petaluma is $56,290, while median incomes of families and households are $138,468 and $108,527 respectively.
| Characteristic | Number | Measure |
| Per Capita Income | 59,682 | $56,290 |
| Median Family Income | 15,164 | $138,468 |
| Mean Family Income | 15,164 | $161,870 |
| Median Household Income | 23,486 | $108,527 |
| Mean Household Income | 23,486 | $140,374 |
| Income Deficit | 15,164 | $9,569 |
| Wage / Income Gap (%) | 59,682 | 21.00% |
| Wage / Income Gap ($) | 59,682 | 79.00¢ per $1 |
| Gini / Inequality Index | 59,682 | 0.43 |
Earnings by Sex in Petaluma
Average Earnings in Petaluma are $55,694, $62,711 for men and $49,541 for women, a difference of 21.0%.
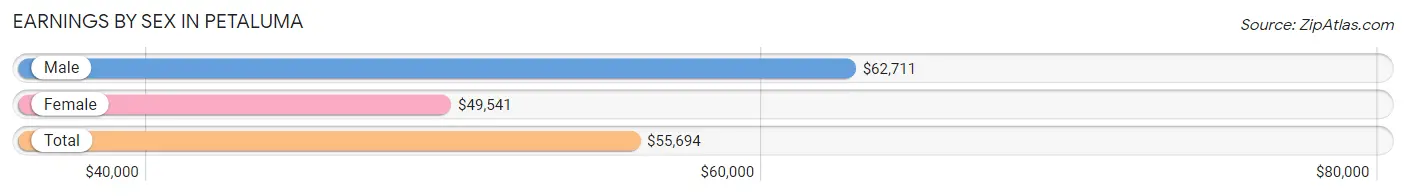
| Sex | Number | Average Earnings |
| Male | 17,584 (51.8%) | $62,711 |
| Female | 16,356 (48.2%) | $49,541 |
| Total | 33,940 (100.0%) | $55,694 |
Earnings by Sex by Income Bracket in Petaluma
The most common earnings brackets in Petaluma are $100,000+ for men (5,651 | 32.1%) and $100,000+ for women (3,178 | 19.4%).
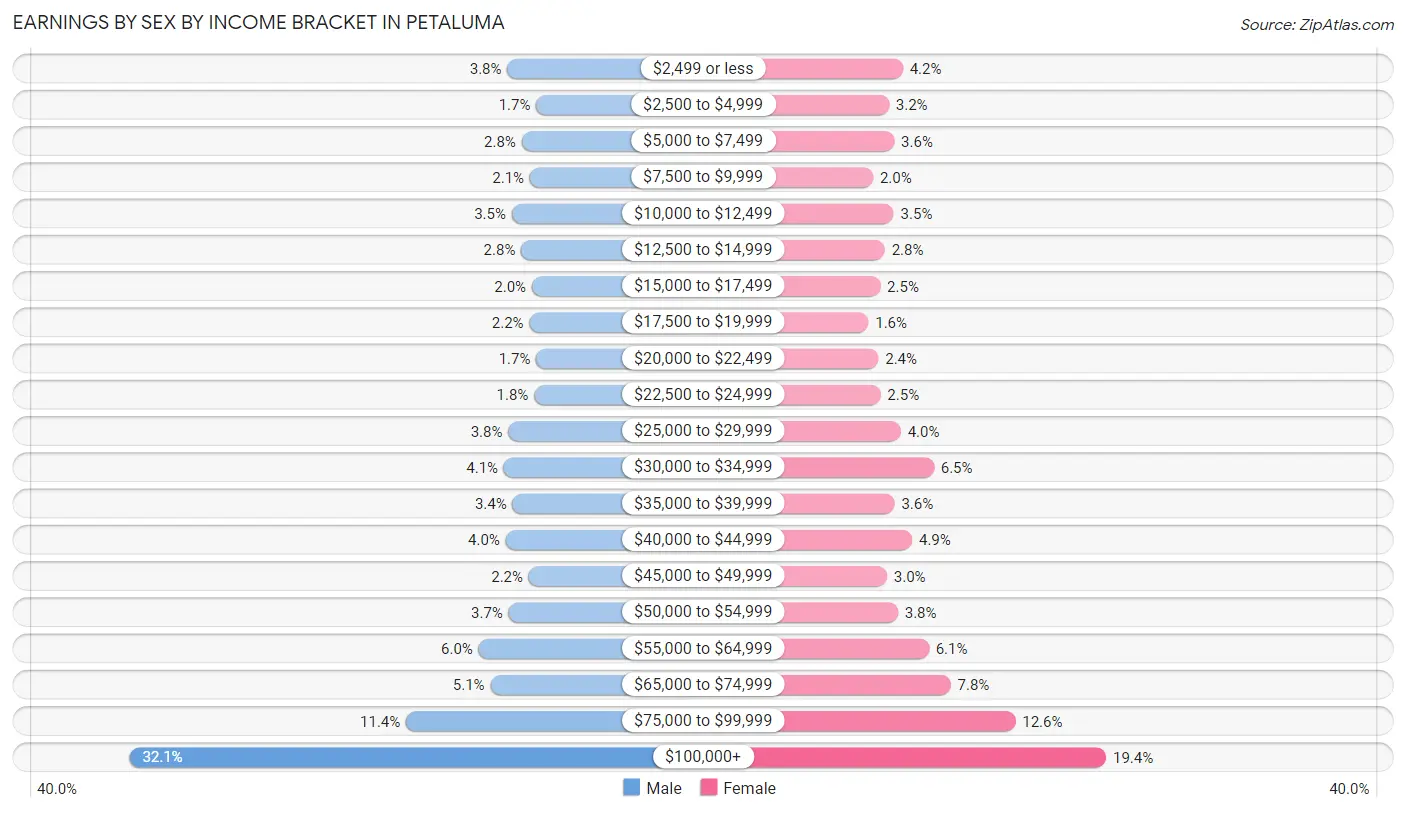
| Income | Male | Female |
| $2,499 or less | 671 (3.8%) | 686 (4.2%) |
| $2,500 to $4,999 | 291 (1.7%) | 516 (3.2%) |
| $5,000 to $7,499 | 484 (2.8%) | 581 (3.5%) |
| $7,500 to $9,999 | 375 (2.1%) | 320 (2.0%) |
| $10,000 to $12,499 | 613 (3.5%) | 574 (3.5%) |
| $12,500 to $14,999 | 488 (2.8%) | 464 (2.8%) |
| $15,000 to $17,499 | 349 (2.0%) | 409 (2.5%) |
| $17,500 to $19,999 | 381 (2.2%) | 263 (1.6%) |
| $20,000 to $22,499 | 290 (1.7%) | 386 (2.4%) |
| $22,500 to $24,999 | 319 (1.8%) | 412 (2.5%) |
| $25,000 to $29,999 | 659 (3.7%) | 661 (4.0%) |
| $30,000 to $34,999 | 718 (4.1%) | 1,066 (6.5%) |
| $35,000 to $39,999 | 604 (3.4%) | 584 (3.6%) |
| $40,000 to $44,999 | 695 (4.0%) | 799 (4.9%) |
| $45,000 to $49,999 | 389 (2.2%) | 491 (3.0%) |
| $50,000 to $54,999 | 655 (3.7%) | 624 (3.8%) |
| $55,000 to $64,999 | 1,050 (6.0%) | 1,004 (6.1%) |
| $65,000 to $74,999 | 895 (5.1%) | 1,273 (7.8%) |
| $75,000 to $99,999 | 2,007 (11.4%) | 2,065 (12.6%) |
| $100,000+ | 5,651 (32.1%) | 3,178 (19.4%) |
| Total | 17,584 (100.0%) | 16,356 (100.0%) |
Earnings by Sex by Educational Attainment in Petaluma
Average earnings in Petaluma are $71,042 for men and $54,571 for women, a difference of 23.2%. Men with an educational attainment of graduate degree enjoy the highest average annual earnings of $114,301, while those with less than high school education earn the least with $40,953. Women with an educational attainment of graduate degree earn the most with the average annual earnings of $79,450, while those with high school diploma education have the smallest earnings of $29,883.
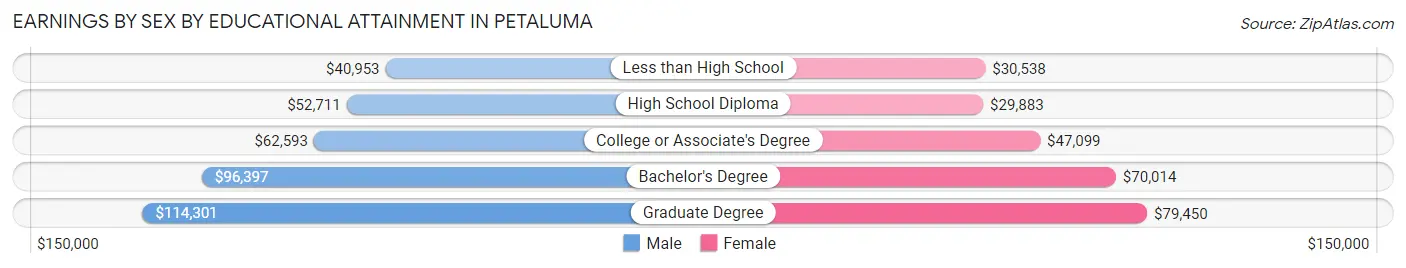
| Educational Attainment | Male Income | Female Income |
| Less than High School | $40,953 | $30,538 |
| High School Diploma | $52,711 | $29,883 |
| College or Associate's Degree | $62,593 | $47,099 |
| Bachelor's Degree | $96,397 | $70,014 |
| Graduate Degree | $114,301 | $79,450 |
| Total | $71,042 | $54,571 |
Family Income in Petaluma
Family Income Brackets in Petaluma
According to the Petaluma family income data, there are 3,973 families falling into the $200,000+ income range, which is the most common income bracket and makes up 26.2% of all families. Conversely, the $10,000 to $14,999 income bracket is the least frequent group with only 45 families (0.3%) belonging to this category.
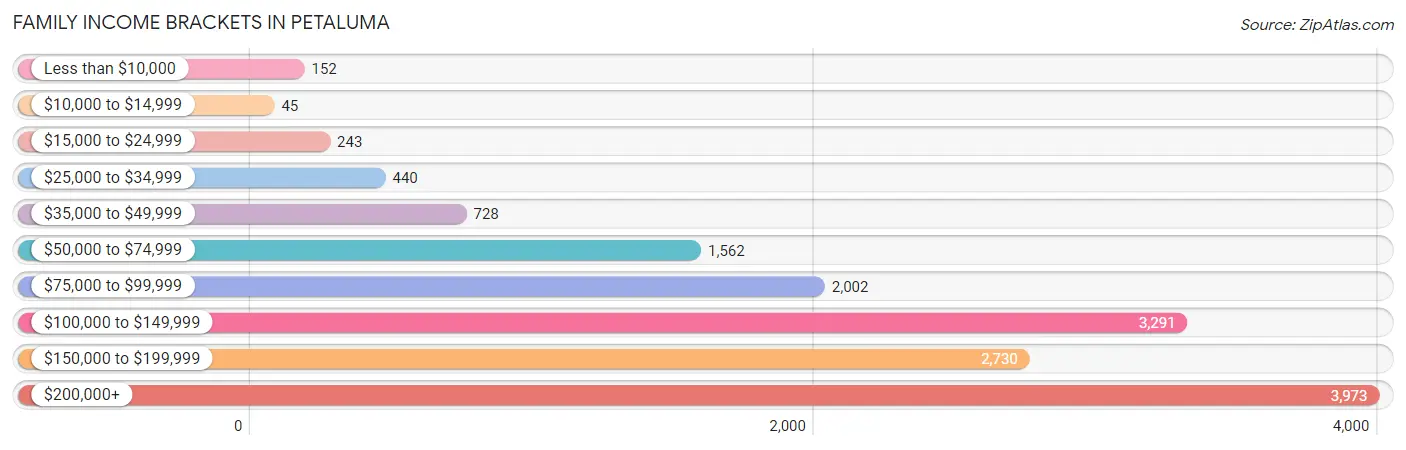
| Income Bracket | # Families | % Families |
| Less than $10,000 | 152 | 1.0% |
| $10,000 to $14,999 | 45 | 0.3% |
| $15,000 to $24,999 | 243 | 1.6% |
| $25,000 to $34,999 | 440 | 2.9% |
| $35,000 to $49,999 | 728 | 4.8% |
| $50,000 to $74,999 | 1,562 | 10.3% |
| $75,000 to $99,999 | 2,002 | 13.2% |
| $100,000 to $149,999 | 3,291 | 21.7% |
| $150,000 to $199,999 | 2,730 | 18.0% |
| $200,000+ | 3,973 | 26.2% |
Family Income by Famaliy Size in Petaluma
7+ person families (67 | 0.4%) account for the highest median family income in Petaluma with $176,914 per family, while 2-person families (6,703 | 44.2%) have the highest median income of $57,292 per family member.
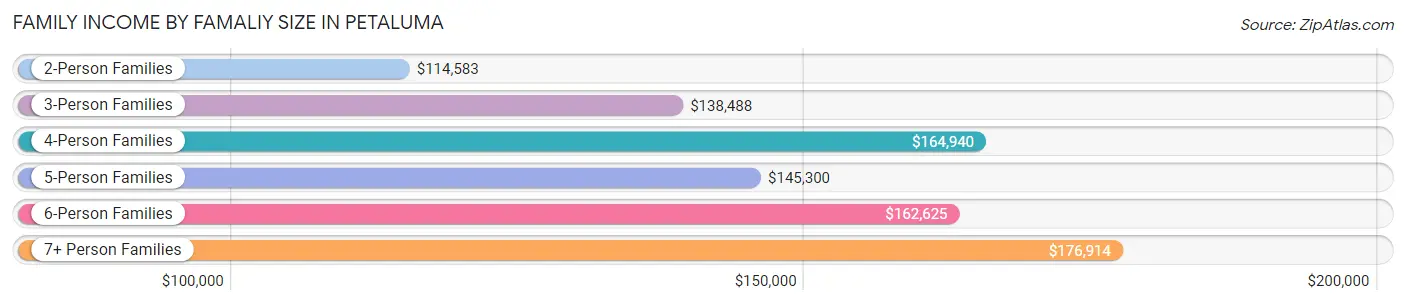
| Income Bracket | # Families | Median Income |
| 2-Person Families | 6,703 (44.2%) | $114,583 |
| 3-Person Families | 3,768 (24.8%) | $138,488 |
| 4-Person Families | 3,443 (22.7%) | $164,940 |
| 5-Person Families | 972 (6.4%) | $145,300 |
| 6-Person Families | 211 (1.4%) | $162,625 |
| 7+ Person Families | 67 (0.4%) | $176,914 |
| Total | 15,164 (100.0%) | $138,468 |
Family Income by Number of Earners in Petaluma
The median family income in Petaluma is $138,468, with families comprising 3+ earners (1,957) having the highest median family income of $177,878, while families with no earners (1,912) have the lowest median family income of $75,088, accounting for 12.9% and 12.6% of families, respectively.
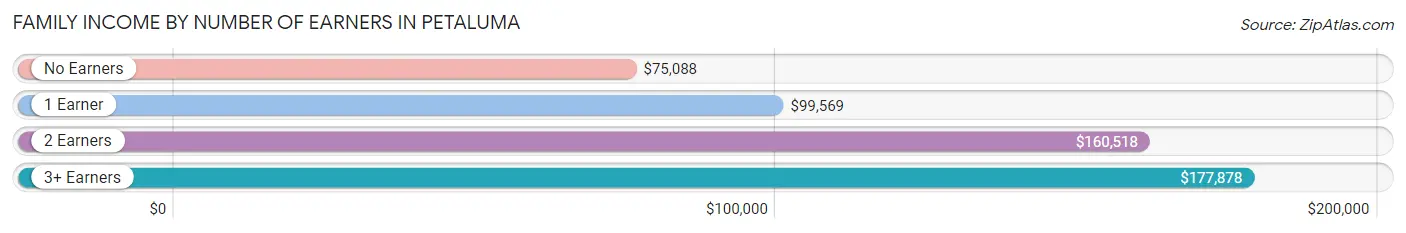
| Number of Earners | # Families | Median Income |
| No Earners | 1,912 (12.6%) | $75,088 |
| 1 Earner | 4,232 (27.9%) | $99,569 |
| 2 Earners | 7,063 (46.6%) | $160,518 |
| 3+ Earners | 1,957 (12.9%) | $177,878 |
| Total | 15,164 (100.0%) | $138,468 |
Household Income in Petaluma
Household Income Brackets in Petaluma
With 5,049 households falling in the category, the $200,000+ income range is the most frequent in Petaluma, accounting for 21.5% of all households. In contrast, only 611 households (2.6%) fall into the $10,000 to $14,999 income bracket, making it the least populous group.
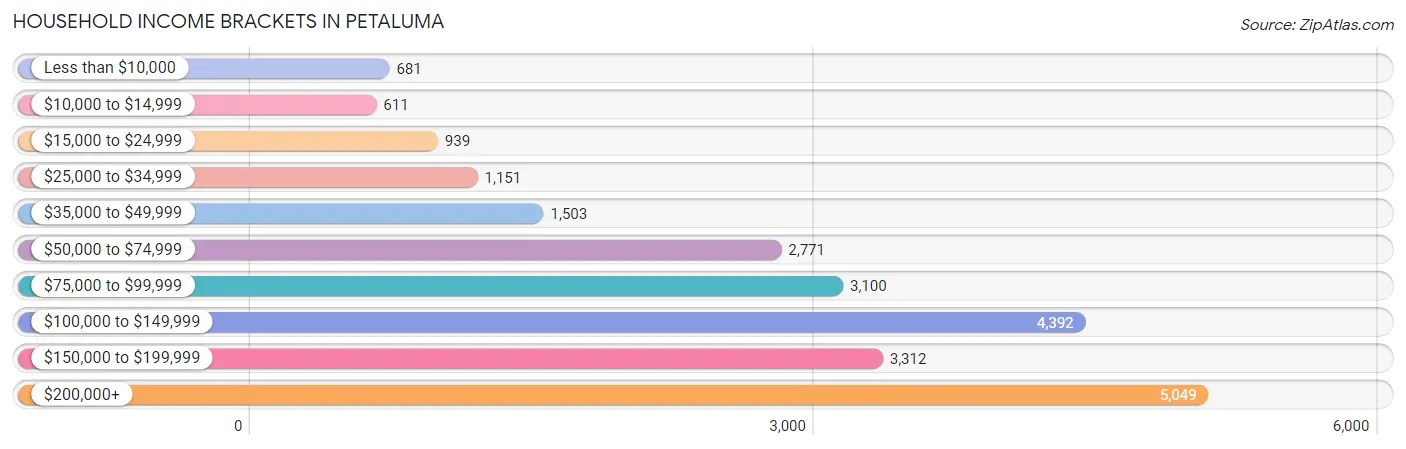
| Income Bracket | # Households | % Households |
| Less than $10,000 | 681 | 2.9% |
| $10,000 to $14,999 | 611 | 2.6% |
| $15,000 to $24,999 | 939 | 4.0% |
| $25,000 to $34,999 | 1,151 | 4.9% |
| $35,000 to $49,999 | 1,503 | 6.4% |
| $50,000 to $74,999 | 2,771 | 11.8% |
| $75,000 to $99,999 | 3,100 | 13.2% |
| $100,000 to $149,999 | 4,392 | 18.7% |
| $150,000 to $199,999 | 3,312 | 14.1% |
| $200,000+ | 5,049 | 21.5% |
Household Income by Householder Age in Petaluma
The median household income in Petaluma is $108,527, with the highest median household income of $134,063 found in the 25 to 44 years age bracket for the primary householder. A total of 6,930 households (29.5%) fall into this category. Meanwhile, the 15 to 24 years age bracket for the primary householder has the lowest median household income of $0, with 290 households (1.2%) in this group.
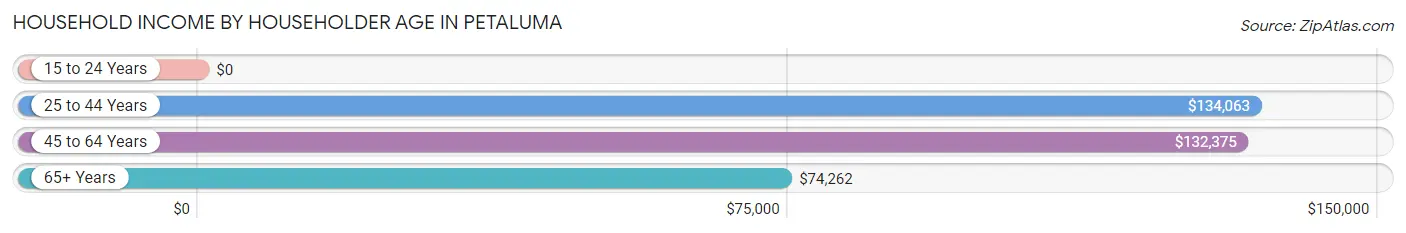
| Income Bracket | # Households | Median Income |
| 15 to 24 Years | 290 (1.2%) | $0 |
| 25 to 44 Years | 6,930 (29.5%) | $134,063 |
| 45 to 64 Years | 8,856 (37.7%) | $132,375 |
| 65+ Years | 7,410 (31.6%) | $74,262 |
| Total | 23,486 (100.0%) | $108,527 |
Poverty in Petaluma
Income Below Poverty by Sex and Age in Petaluma
With 4.8% poverty level for males and 6.9% for females among the residents of Petaluma, 16 and 17 year old males and 15 year old females are the most vulnerable to poverty, with 106 males (11.5%) and 46 females (11.3%) in their respective age groups living below the poverty level.
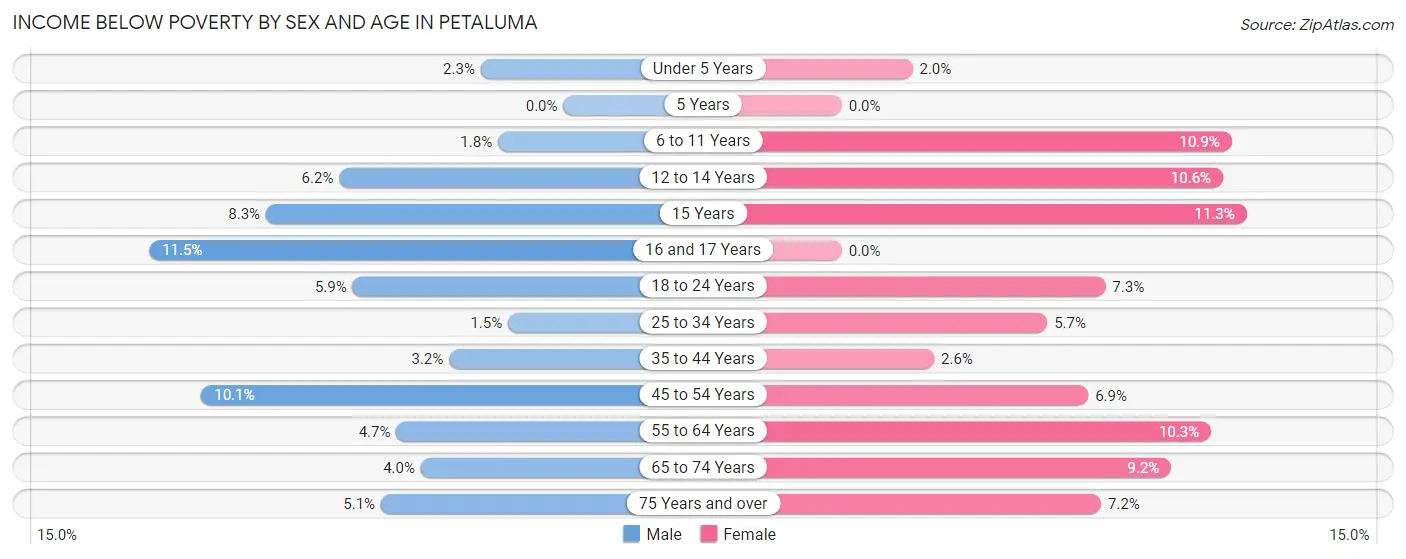
| Age Bracket | Male | Female |
| Under 5 Years | 32 (2.3%) | 25 (2.0%) |
| 5 Years | 0 (0.0%) | 0 (0.0%) |
| 6 to 11 Years | 33 (1.8%) | 201 (10.8%) |
| 12 to 14 Years | 75 (6.2%) | 78 (10.6%) |
| 15 Years | 40 (8.3%) | 46 (11.3%) |
| 16 and 17 Years | 106 (11.5%) | 0 (0.0%) |
| 18 to 24 Years | 109 (5.9%) | 143 (7.3%) |
| 25 to 34 Years | 59 (1.5%) | 209 (5.7%) |
| 35 to 44 Years | 122 (3.2%) | 107 (2.6%) |
| 45 to 54 Years | 400 (10.1%) | 265 (6.9%) |
| 55 to 64 Years | 211 (4.6%) | 473 (10.3%) |
| 65 to 74 Years | 125 (4.0%) | 325 (9.2%) |
| 75 Years and over | 98 (5.1%) | 197 (7.2%) |
| Total | 1,410 (4.8%) | 2,069 (6.9%) |
Income Above Poverty by Sex and Age in Petaluma
According to the poverty statistics in Petaluma, males aged 5 years and females aged 5 years are the age groups that are most secure financially, with 100.0% of males and 100.0% of females in these age groups living above the poverty line.
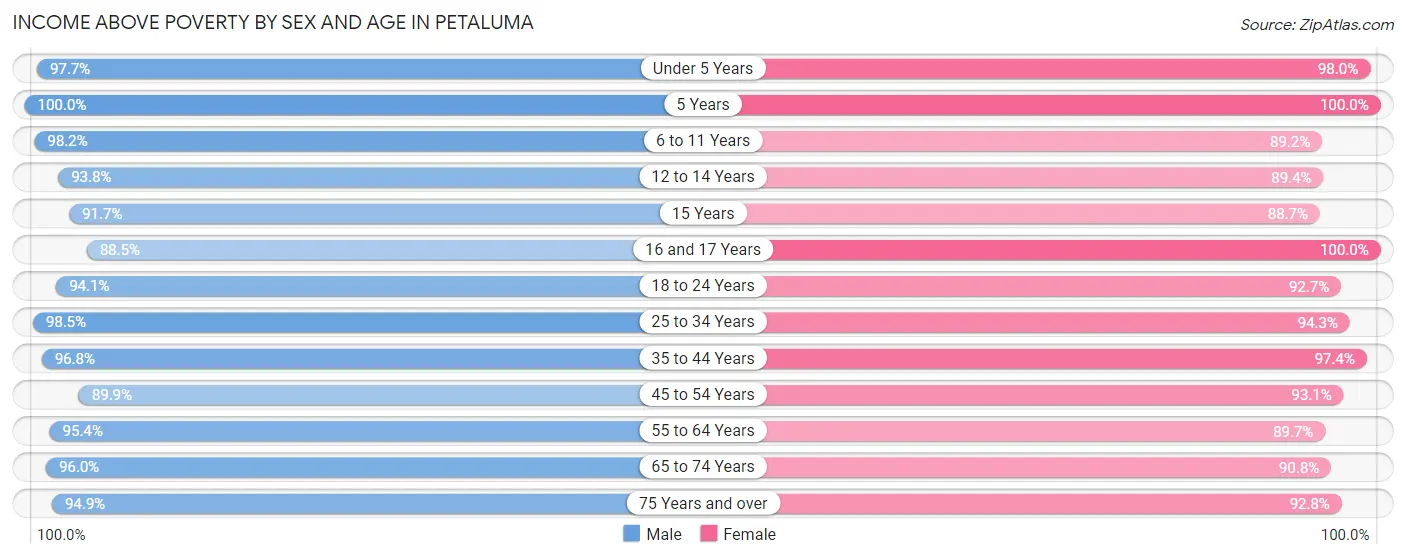
| Age Bracket | Male | Female |
| Under 5 Years | 1,358 (97.7%) | 1,241 (98.0%) |
| 5 Years | 422 (100.0%) | 258 (100.0%) |
| 6 to 11 Years | 1,776 (98.2%) | 1,652 (89.1%) |
| 12 to 14 Years | 1,126 (93.8%) | 657 (89.4%) |
| 15 Years | 443 (91.7%) | 362 (88.7%) |
| 16 and 17 Years | 813 (88.5%) | 789 (100.0%) |
| 18 to 24 Years | 1,749 (94.1%) | 1,804 (92.7%) |
| 25 to 34 Years | 3,780 (98.5%) | 3,446 (94.3%) |
| 35 to 44 Years | 3,718 (96.8%) | 4,060 (97.4%) |
| 45 to 54 Years | 3,569 (89.9%) | 3,596 (93.1%) |
| 55 to 64 Years | 4,323 (95.4%) | 4,127 (89.7%) |
| 65 to 74 Years | 3,027 (96.0%) | 3,218 (90.8%) |
| 75 Years and over | 1,833 (94.9%) | 2,531 (92.8%) |
| Total | 27,937 (95.2%) | 27,741 (93.1%) |
Income Below Poverty Among Married-Couple Families in Petaluma
The poverty statistics for married-couple families in Petaluma show that 1.4% or 170 of the total 12,157 families live below the poverty line. Families with 5 or more children have the highest poverty rate of 64.3%, comprising of 9 families. On the other hand, families with no children have the lowest poverty rate of 1.0%, which includes 68 families.
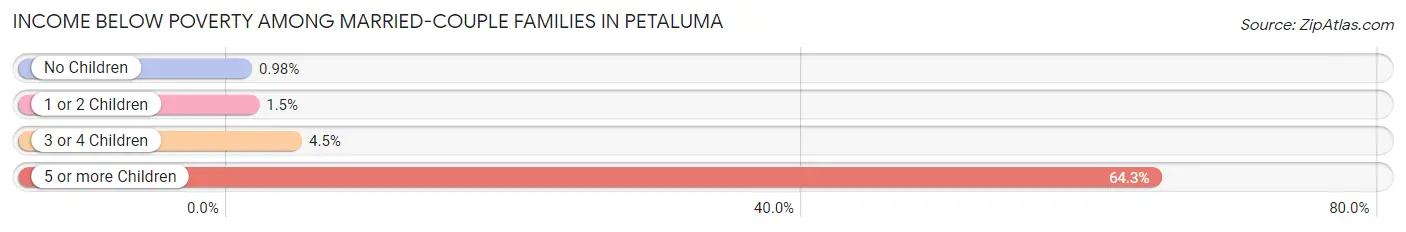
| Children | Above Poverty | Below Poverty |
| No Children | 6,905 (99.0%) | 68 (1.0%) |
| 1 or 2 Children | 4,542 (98.5%) | 68 (1.5%) |
| 3 or 4 Children | 535 (95.5%) | 25 (4.5%) |
| 5 or more Children | 5 (35.7%) | 9 (64.3%) |
| Total | 11,987 (98.6%) | 170 (1.4%) |
Income Below Poverty Among Single-Parent Households in Petaluma
According to the poverty data in Petaluma, 3.1% or 36 single-father households and 9.6% or 176 single-mother households are living below the poverty line. Among single-father households, those with 1 or 2 children have the highest poverty rate, with 36 households (6.5%) experiencing poverty. Likewise, among single-mother households, those with 3 or 4 children have the highest poverty rate, with 37 households (24.0%) falling below the poverty line.
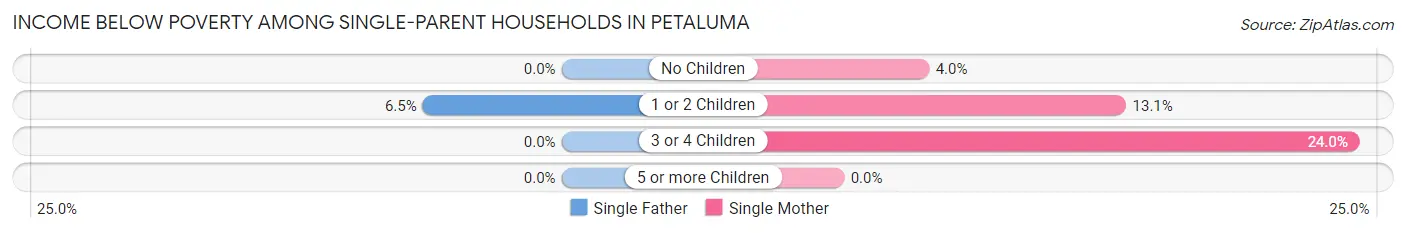
| Children | Single Father | Single Mother |
| No Children | 0 (0.0%) | 35 (4.0%) |
| 1 or 2 Children | 36 (6.5%) | 104 (13.1%) |
| 3 or 4 Children | 0 (0.0%) | 37 (24.0%) |
| 5 or more Children | 0 (0.0%) | 0 (0.0%) |
| Total | 36 (3.1%) | 176 (9.6%) |
Income Below Poverty Among Married-Couple vs Single-Parent Households in Petaluma
The poverty data for Petaluma shows that 170 of the married-couple family households (1.4%) and 212 of the single-parent households (7.0%) are living below the poverty level. Within the married-couple family households, those with 5 or more children have the highest poverty rate, with 9 households (64.3%) falling below the poverty line. Among the single-parent households, those with 3 or 4 children have the highest poverty rate, with 37 household (15.0%) living below poverty.
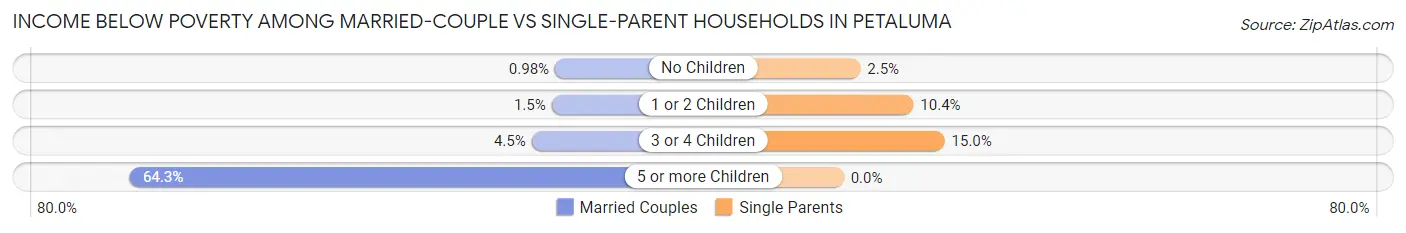
| Children | Married-Couple Families | Single-Parent Households |
| No Children | 68 (1.0%) | 35 (2.5%) |
| 1 or 2 Children | 68 (1.5%) | 140 (10.4%) |
| 3 or 4 Children | 25 (4.5%) | 37 (15.0%) |
| 5 or more Children | 9 (64.3%) | 0 (0.0%) |
| Total | 170 (1.4%) | 212 (7.0%) |
Race in Petaluma
The most populous races in Petaluma are White / Caucasian (44,947 | 75.3%), Hispanic or Latino (11,530 | 19.3%), and Two or more Races (6,345 | 10.6%).
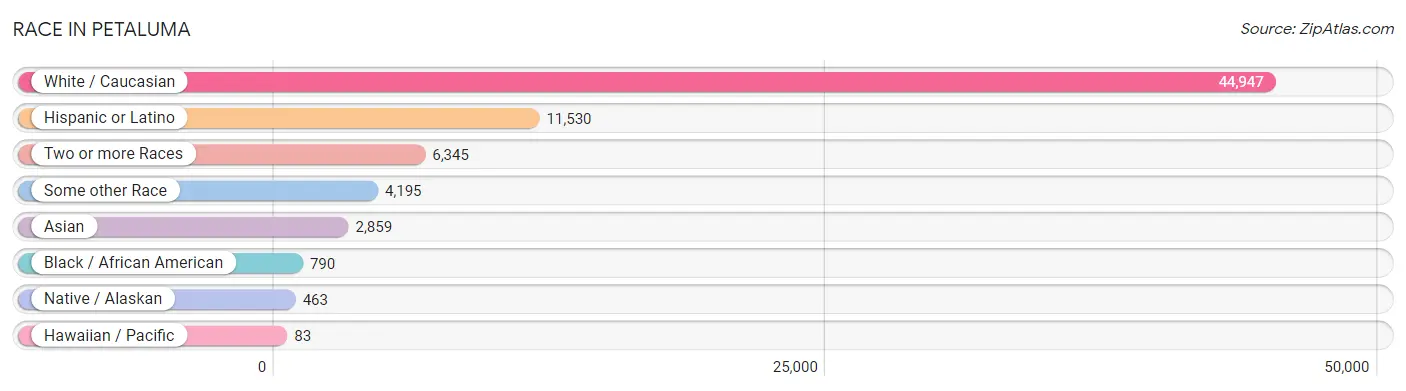
| Race | # Population | % Population |
| Asian | 2,859 | 4.8% |
| Black / African American | 790 | 1.3% |
| Hawaiian / Pacific | 83 | 0.1% |
| Hispanic or Latino | 11,530 | 19.3% |
| Native / Alaskan | 463 | 0.8% |
| White / Caucasian | 44,947 | 75.3% |
| Two or more Races | 6,345 | 10.6% |
| Some other Race | 4,195 | 7.0% |
| Total | 59,682 | 100.0% |
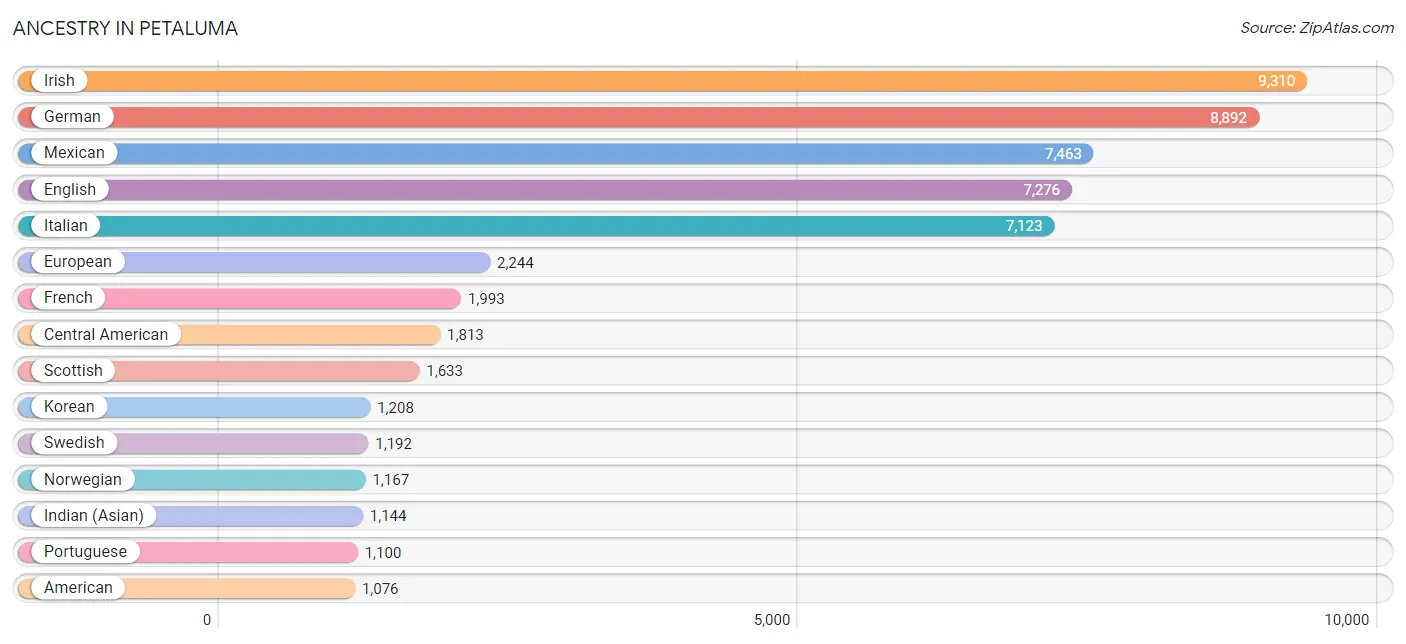
Ancestry in Petaluma
The most populous ancestries reported in Petaluma are Irish (9,310 | 15.6%), German (8,892 | 14.9%), Mexican (7,463 | 12.5%), English (7,276 | 12.2%), and Italian (7,123 | 11.9%), together accounting for 67.1% of all Petaluma residents.
| Ancestry | # Population | % Population |
| Afghan | 71 | 0.1% |
| African | 173 | 0.3% |
| American | 1,076 | 1.8% |
| Apache | 97 | 0.2% |
| Arab | 166 | 0.3% |
| Argentinean | 146 | 0.2% |
| Armenian | 108 | 0.2% |
| Austrian | 313 | 0.5% |
| Bangladeshi | 125 | 0.2% |
| Basque | 14 | 0.0% |
| Belgian | 261 | 0.4% |
| Belizean | 24 | 0.0% |
| Bhutanese | 601 | 1.0% |
| Blackfeet | 49 | 0.1% |
| Bolivian | 4 | 0.0% |
| Brazilian | 66 | 0.1% |
| British | 838 | 1.4% |
| Bulgarian | 24 | 0.0% |
| Burmese | 233 | 0.4% |
| Canadian | 224 | 0.4% |
| Carpatho Rusyn | 9 | 0.0% |
| Celtic | 43 | 0.1% |
| Central American | 1,813 | 3.0% |
| Central American Indian | 255 | 0.4% |
| Cherokee | 197 | 0.3% |
| Chilean | 77 | 0.1% |
| Chippewa | 52 | 0.1% |
| Colombian | 256 | 0.4% |
| Costa Rican | 83 | 0.1% |
| Creek | 14 | 0.0% |
| Croatian | 55 | 0.1% |
| Cuban | 175 | 0.3% |
| Czech | 396 | 0.7% |
| Czechoslovakian | 21 | 0.0% |
| Danish | 644 | 1.1% |
| Dutch | 784 | 1.3% |
| Eastern European | 427 | 0.7% |
| Ecuadorian | 59 | 0.1% |
| Egyptian | 33 | 0.1% |
| English | 7,276 | 12.2% |
| Estonian | 51 | 0.1% |
| Ethiopian | 70 | 0.1% |
| European | 2,244 | 3.8% |
| Filipino | 195 | 0.3% |
| Finnish | 297 | 0.5% |
| French | 1,993 | 3.3% |
| French Canadian | 262 | 0.4% |
| German | 8,892 | 14.9% |
| Greek | 394 | 0.7% |
| Guamanian / Chamorro | 5 | 0.0% |
| Guatemalan | 343 | 0.6% |
| Honduran | 90 | 0.2% |
| Hopi | 9 | 0.0% |
| Hungarian | 118 | 0.2% |
| Icelander | 3 | 0.0% |
| Indian (Asian) | 1,144 | 1.9% |
| Iranian | 332 | 0.6% |
| Irish | 9,310 | 15.6% |
| Iroquois | 9 | 0.0% |
| Israeli | 11 | 0.0% |
| Italian | 7,123 | 11.9% |
| Japanese | 11 | 0.0% |
| Kenyan | 57 | 0.1% |
| Korean | 1,208 | 2.0% |
| Laotian | 79 | 0.1% |
| Lebanese | 27 | 0.1% |
| Lithuanian | 37 | 0.1% |
| Luxembourger | 20 | 0.0% |
| Macedonian | 7 | 0.0% |
| Malaysian | 35 | 0.1% |
| Maltese | 137 | 0.2% |
| Mexican | 7,463 | 12.5% |
| Mexican American Indian | 54 | 0.1% |
| Mongolian | 3 | 0.0% |
| Native Hawaiian | 102 | 0.2% |
| Navajo | 32 | 0.1% |
| New Zealander | 5 | 0.0% |
| Nicaraguan | 181 | 0.3% |
| Nigerian | 204 | 0.3% |
| Northern European | 420 | 0.7% |
| Norwegian | 1,167 | 2.0% |
| Osage | 19 | 0.0% |
| Pakistani | 20 | 0.0% |
| Palestinian | 65 | 0.1% |
| Panamanian | 49 | 0.1% |
| Peruvian | 68 | 0.1% |
| Pima | 50 | 0.1% |
| Polish | 1,075 | 1.8% |
| Portuguese | 1,100 | 1.8% |
| Potawatomi | 9 | 0.0% |
| Pueblo | 25 | 0.0% |
| Puerto Rican | 151 | 0.3% |
| Romanian | 19 | 0.0% |
| Russian | 927 | 1.5% |
| Salvadoran | 964 | 1.6% |
| Samoan | 72 | 0.1% |
| Scandinavian | 231 | 0.4% |
| Scotch-Irish | 743 | 1.2% |
| Scottish | 1,633 | 2.7% |
| Serbian | 11 | 0.0% |
| Sioux | 30 | 0.1% |
| Slavic | 18 | 0.0% |
| Slovak | 78 | 0.1% |
| Slovene | 15 | 0.0% |
| South African | 16 | 0.0% |
| South American | 630 | 1.1% |
| South American Indian | 52 | 0.1% |
| Spaniard | 351 | 0.6% |
| Spanish | 387 | 0.6% |
| Sri Lankan | 468 | 0.8% |
| Subsaharan African | 463 | 0.8% |
| Swedish | 1,192 | 2.0% |
| Swiss | 850 | 1.4% |
| Syrian | 10 | 0.0% |
| Thai | 458 | 0.8% |
| Turkish | 27 | 0.1% |
| Ukrainian | 96 | 0.2% |
| Venezuelan | 20 | 0.0% |
| Vietnamese | 13 | 0.0% |
| Welsh | 393 | 0.7% |
| West Indian | 117 | 0.2% |
| Yaqui | 60 | 0.1% |
| Yugoslavian | 63 | 0.1% | View All 123 Rows |
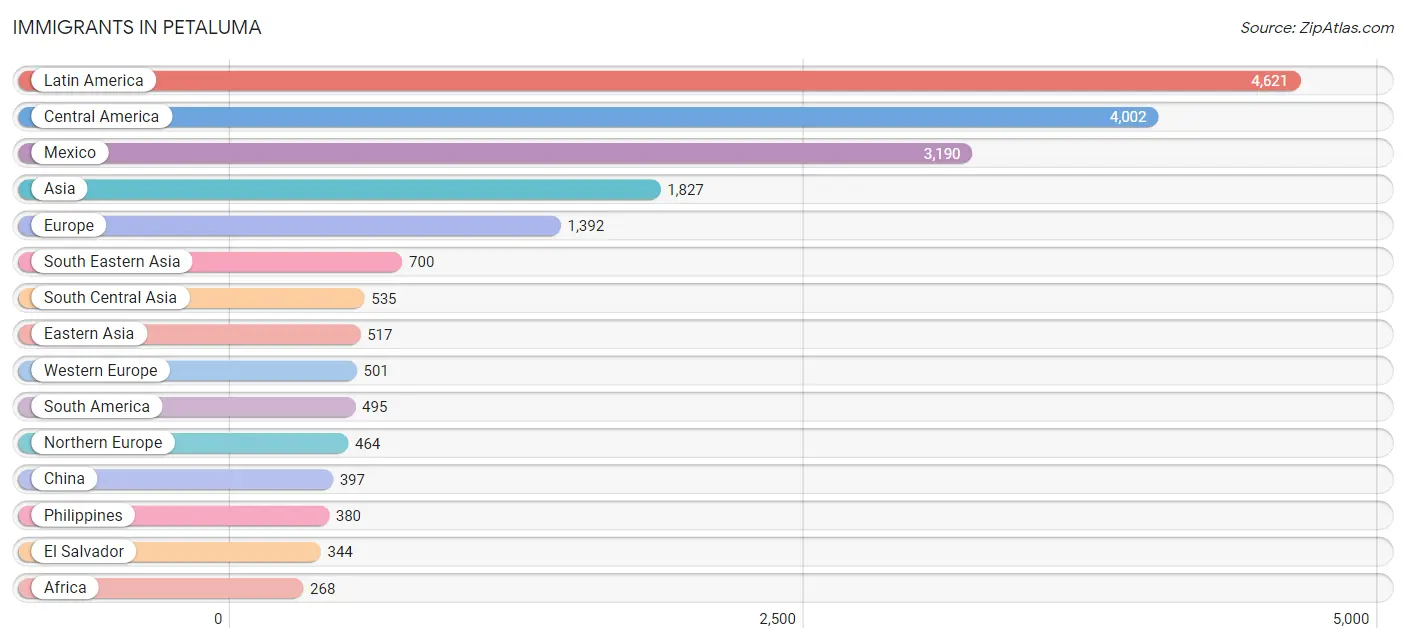
Immigrants in Petaluma
The most numerous immigrant groups reported in Petaluma came from Latin America (4,621 | 7.7%), Central America (4,002 | 6.7%), Mexico (3,190 | 5.3%), Asia (1,827 | 3.1%), and Europe (1,392 | 2.3%), together accounting for 25.2% of all Petaluma residents.
| Immigration Origin | # Population | % Population |
| Afghanistan | 71 | 0.1% |
| Africa | 268 | 0.4% |
| Argentina | 191 | 0.3% |
| Asia | 1,827 | 3.1% |
| Australia | 13 | 0.0% |
| Austria | 22 | 0.0% |
| Azores | 25 | 0.0% |
| Bangladesh | 13 | 0.0% |
| Belarus | 6 | 0.0% |
| Belgium | 17 | 0.0% |
| Bolivia | 4 | 0.0% |
| Bosnia and Herzegovina | 10 | 0.0% |
| Brazil | 100 | 0.2% |
| Bulgaria | 28 | 0.1% |
| Cambodia | 95 | 0.2% |
| Canada | 252 | 0.4% |
| Caribbean | 124 | 0.2% |
| Central America | 4,002 | 6.7% |
| Chile | 25 | 0.0% |
| China | 397 | 0.7% |
| Colombia | 95 | 0.2% |
| Costa Rica | 112 | 0.2% |
| Cuba | 124 | 0.2% |
| Denmark | 31 | 0.1% |
| Eastern Africa | 103 | 0.2% |
| Eastern Asia | 517 | 0.9% |
| Eastern Europe | 197 | 0.3% |
| Ecuador | 48 | 0.1% |
| Egypt | 9 | 0.0% |
| El Salvador | 344 | 0.6% |
| England | 59 | 0.1% |
| Ethiopia | 46 | 0.1% |
| Europe | 1,392 | 2.3% |
| Fiji | 31 | 0.1% |
| France | 113 | 0.2% |
| Germany | 239 | 0.4% |
| Greece | 12 | 0.0% |
| Guatemala | 259 | 0.4% |
| Honduras | 33 | 0.1% |
| Hong Kong | 7 | 0.0% |
| India | 185 | 0.3% |
| Indonesia | 21 | 0.0% |
| Iran | 193 | 0.3% |
| Ireland | 127 | 0.2% |
| Israel | 15 | 0.0% |
| Italy | 140 | 0.2% |
| Japan | 63 | 0.1% |
| Jordan | 24 | 0.0% |
| Kazakhstan | 14 | 0.0% |
| Kenya | 57 | 0.1% |
| Korea | 57 | 0.1% |
| Laos | 21 | 0.0% |
| Latin America | 4,621 | 7.7% |
| Malaysia | 3 | 0.0% |
| Mexico | 3,190 | 5.3% |
| Netherlands | 92 | 0.2% |
| Nicaragua | 64 | 0.1% |
| Nigeria | 130 | 0.2% |
| North Macedonia | 7 | 0.0% |
| Northern Africa | 26 | 0.0% |
| Northern Europe | 464 | 0.8% |
| Norway | 14 | 0.0% |
| Oceania | 83 | 0.1% |
| Pakistan | 13 | 0.0% |
| Peru | 32 | 0.1% |
| Philippines | 380 | 0.6% |
| Poland | 15 | 0.0% |
| Portugal | 25 | 0.0% |
| Romania | 10 | 0.0% |
| Russia | 86 | 0.1% |
| Scotland | 35 | 0.1% |
| South Africa | 9 | 0.0% |
| South America | 495 | 0.8% |
| South Central Asia | 535 | 0.9% |
| South Eastern Asia | 700 | 1.2% |
| Southern Europe | 230 | 0.4% |
| Spain | 24 | 0.0% |
| Sri Lanka | 39 | 0.1% |
| Sweden | 18 | 0.0% |
| Switzerland | 18 | 0.0% |
| Taiwan | 27 | 0.1% |
| Thailand | 1 | 0.0% |
| Turkey | 27 | 0.1% |
| Ukraine | 11 | 0.0% |
| Uzbekistan | 7 | 0.0% |
| Vietnam | 179 | 0.3% |
| Western Africa | 130 | 0.2% |
| Western Asia | 66 | 0.1% |
| Western Europe | 501 | 0.8% | View All 89 Rows |
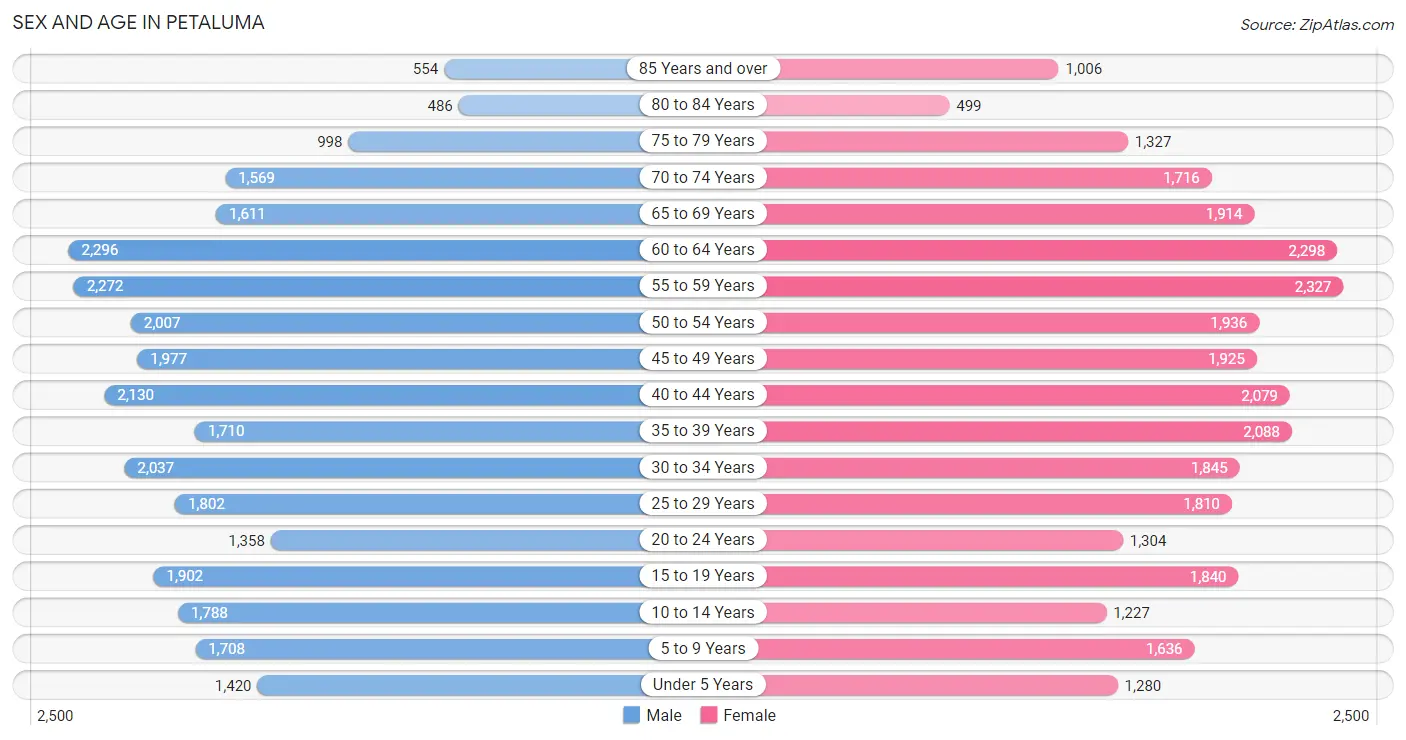
Sex and Age in Petaluma
Sex and Age in Petaluma
The most populous age groups in Petaluma are 60 to 64 Years (2,296 | 7.7%) for men and 55 to 59 Years (2,327 | 7.7%) for women.
| Age Bracket | Male | Female |
| Under 5 Years | 1,420 (4.8%) | 1,280 (4.3%) |
| 5 to 9 Years | 1,708 (5.8%) | 1,636 (5.4%) |
| 10 to 14 Years | 1,788 (6.0%) | 1,227 (4.1%) |
| 15 to 19 Years | 1,902 (6.4%) | 1,840 (6.1%) |
| 20 to 24 Years | 1,358 (4.6%) | 1,304 (4.3%) |
| 25 to 29 Years | 1,802 (6.1%) | 1,810 (6.0%) |
| 30 to 34 Years | 2,037 (6.9%) | 1,845 (6.1%) |
| 35 to 39 Years | 1,710 (5.8%) | 2,088 (7.0%) |
| 40 to 44 Years | 2,130 (7.2%) | 2,079 (6.9%) |
| 45 to 49 Years | 1,977 (6.7%) | 1,925 (6.4%) |
| 50 to 54 Years | 2,007 (6.8%) | 1,936 (6.4%) |
| 55 to 59 Years | 2,272 (7.7%) | 2,327 (7.7%) |
| 60 to 64 Years | 2,296 (7.7%) | 2,298 (7.6%) |
| 65 to 69 Years | 1,611 (5.4%) | 1,914 (6.4%) |
| 70 to 74 Years | 1,569 (5.3%) | 1,716 (5.7%) |
| 75 to 79 Years | 998 (3.4%) | 1,327 (4.4%) |
| 80 to 84 Years | 486 (1.6%) | 499 (1.7%) |
| 85 Years and over | 554 (1.9%) | 1,006 (3.4%) |
| Total | 29,625 (100.0%) | 30,057 (100.0%) |
Families and Households in Petaluma
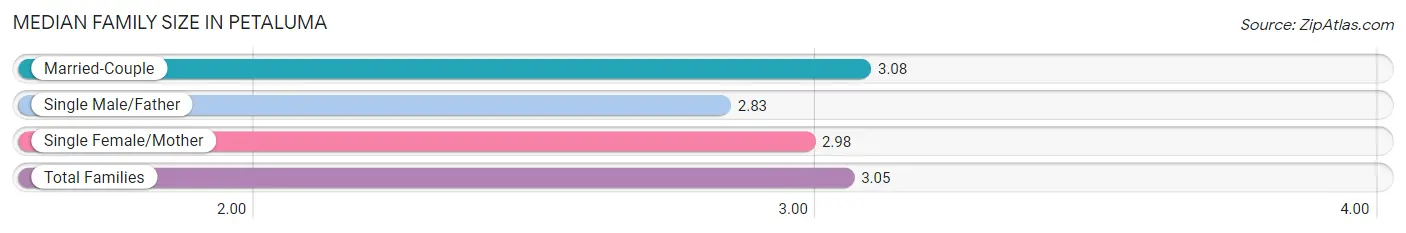
Median Family Size in Petaluma
The median family size in Petaluma is 3.05 persons per family, with married-couple families (12,157 | 80.2%) accounting for the largest median family size of 3.08 persons per family. On the other hand, single male/father families (1,167 | 7.7%) represent the smallest median family size with 2.83 persons per family.
| Family Type | # Families | Family Size |
| Married-Couple | 12,157 (80.2%) | 3.08 |
| Single Male/Father | 1,167 (7.7%) | 2.83 |
| Single Female/Mother | 1,840 (12.1%) | 2.98 |
| Total Families | 15,164 (100.0%) | 3.05 |
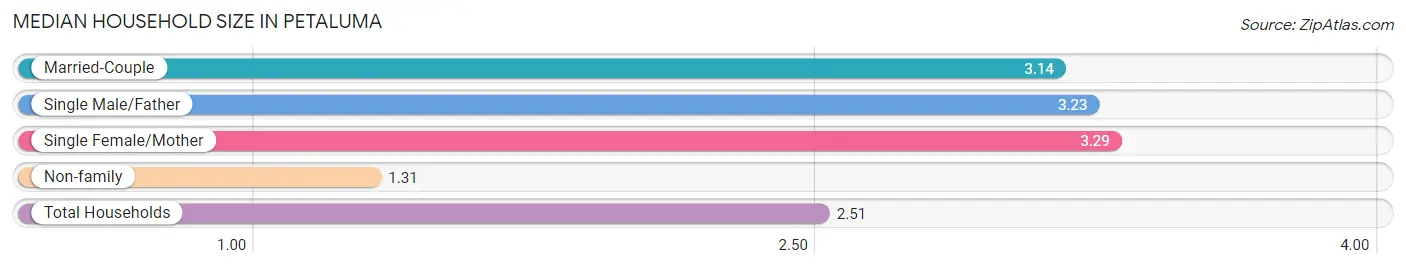
Median Household Size in Petaluma
The median household size in Petaluma is 2.51 persons per household, with single female/mother households (1,840 | 7.8%) accounting for the largest median household size of 3.29 persons per household. non-family households (8,322 | 35.4%) represent the smallest median household size with 1.31 persons per household.
| Household Type | # Households | Household Size |
| Married-Couple | 12,157 (51.8%) | 3.14 |
| Single Male/Father | 1,167 (5.0%) | 3.23 |
| Single Female/Mother | 1,840 (7.8%) | 3.29 |
| Non-family | 8,322 (35.4%) | 1.31 |
| Total Households | 23,486 (100.0%) | 2.51 |
Household Size by Marriage Status in Petaluma
Out of a total of 23,486 households in Petaluma, 15,164 (64.6%) are family households, while 8,322 (35.4%) are nonfamily households. The most numerous type of family households are 2-person households, comprising 6,003, and the most common type of nonfamily households are 1-person households, comprising 6,309.
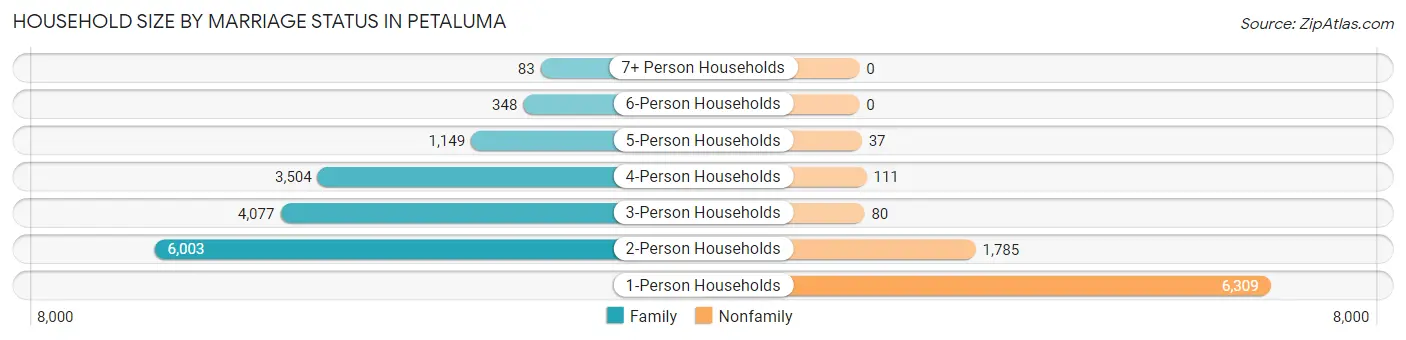
| Household Size | Family Households | Nonfamily Households |
| 1-Person Households | - | 6,309 (26.9%) |
| 2-Person Households | 6,003 (25.6%) | 1,785 (7.6%) |
| 3-Person Households | 4,077 (17.4%) | 80 (0.3%) |
| 4-Person Households | 3,504 (14.9%) | 111 (0.5%) |
| 5-Person Households | 1,149 (4.9%) | 37 (0.2%) |
| 6-Person Households | 348 (1.5%) | 0 (0.0%) |
| 7+ Person Households | 83 (0.4%) | 0 (0.0%) |
| Total | 15,164 (64.6%) | 8,322 (35.4%) |
Female Fertility in Petaluma
Fertility by Age in Petaluma
Average fertility rate in Petaluma is 40.0 births per 1,000 women. Women in the age bracket of 20 to 34 years have the highest fertility rate with 70.0 births per 1,000 women. Women in the age bracket of 20 to 34 years acount for 65.8% of all women with births.
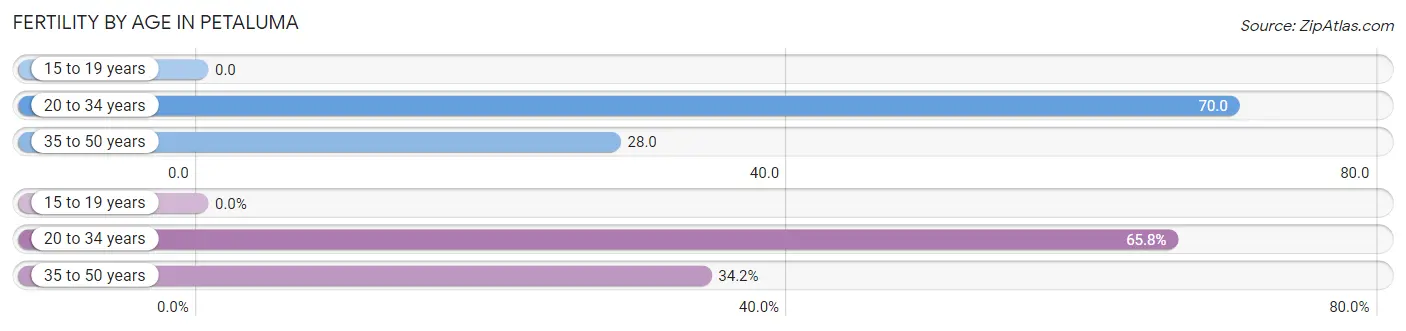
| Age Bracket | Women with Births | Births / 1,000 Women |
| 15 to 19 years | 0 (0.0%) | 0.0 |
| 20 to 34 years | 347 (65.8%) | 70.0 |
| 35 to 50 years | 180 (34.2%) | 28.0 |
| Total | 527 (100.0%) | 40.0 |
Fertility by Age by Marriage Status in Petaluma
91.1% of women with births (527) in Petaluma are married. The highest percentage of unmarried women with births falls into 20 to 34 years age bracket with 10.7% of them unmarried at the time of birth, while the lowest percentage of unmarried women with births belong to 35 to 50 years age bracket with 5.6% of them unmarried.
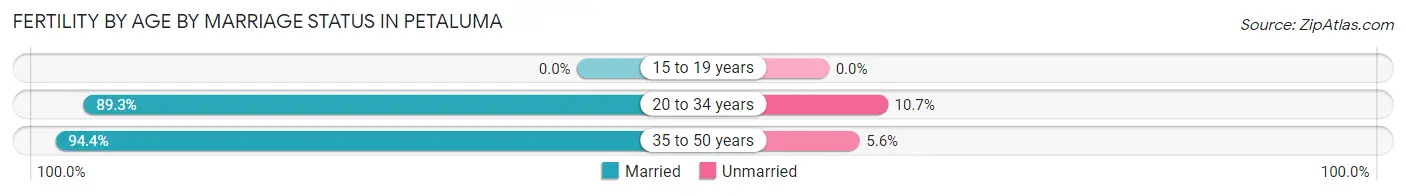
| Age Bracket | Married | Unmarried |
| 15 to 19 years | 0 (0.0%) | 0 (0.0%) |
| 20 to 34 years | 310 (89.3%) | 37 (10.7%) |
| 35 to 50 years | 170 (94.4%) | 10 (5.6%) |
| Total | 480 (91.1%) | 47 (8.9%) |
Fertility by Education in Petaluma
Average fertility rate in Petaluma is 40.0 births per 1,000 women. Women with the education attainment of graduate degree have the highest fertility rate of 59.0 births per 1,000 women, while women with the education attainment of college or associate's degree have the lowest fertility at 20.0 births per 1,000 women. Women with the education attainment of bachelor's degree represent 37.6% of all women with births.
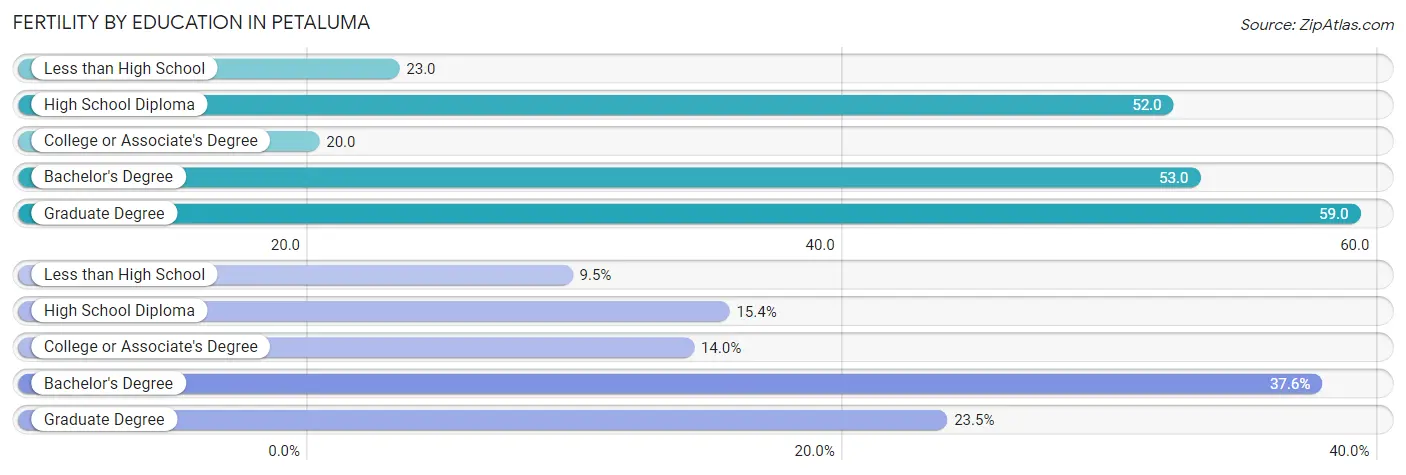
| Educational Attainment | Women with Births | Births / 1,000 Women |
| Less than High School | 50 (9.5%) | 23.0 |
| High School Diploma | 81 (15.4%) | 52.0 |
| College or Associate's Degree | 74 (14.0%) | 20.0 |
| Bachelor's Degree | 198 (37.6%) | 53.0 |
| Graduate Degree | 124 (23.5%) | 59.0 |
| Total | 527 (100.0%) | 40.0 |
Fertility by Education by Marriage Status in Petaluma
8.9% of women with births in Petaluma are unmarried. Women with the educational attainment of less than high school are most likely to be married with 100.0% of them married at childbirth, while women with the educational attainment of high school diploma are least likely to be married with 30.9% of them unmarried at childbirth.
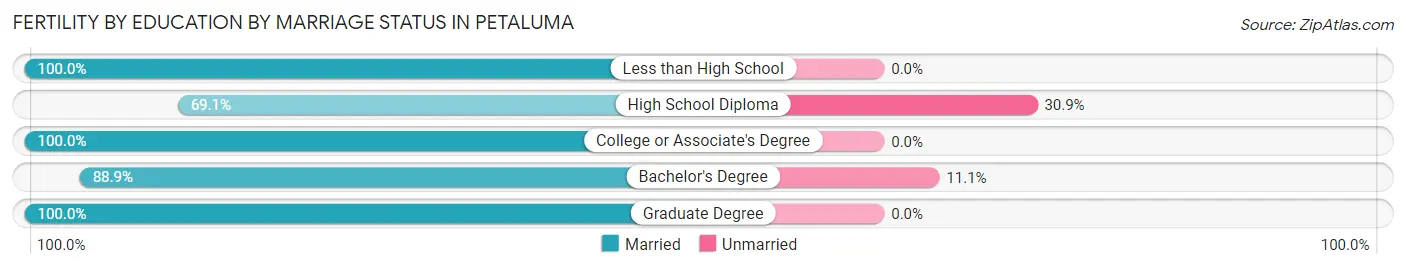
| Educational Attainment | Married | Unmarried |
| Less than High School | 50 (100.0%) | 0 (0.0%) |
| High School Diploma | 56 (69.1%) | 25 (30.9%) |
| College or Associate's Degree | 74 (100.0%) | 0 (0.0%) |
| Bachelor's Degree | 176 (88.9%) | 22 (11.1%) |
| Graduate Degree | 124 (100.0%) | 0 (0.0%) |
| Total | 480 (91.1%) | 47 (8.9%) |
Employment Characteristics in Petaluma
Employment by Class of Employer in Petaluma
Among the 30,092 employed individuals in Petaluma, private company employees (18,463 | 61.4%), local government employees (3,324 | 11.1%), and not-for-profit organizations (2,740 | 9.1%) make up the most common classes of employment.
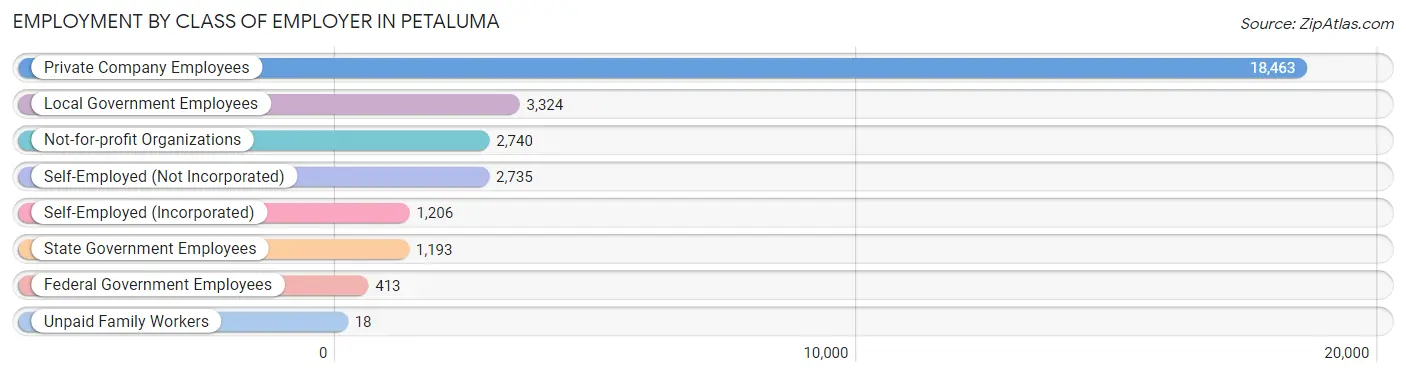
| Employer Class | # Employees | % Employees |
| Private Company Employees | 18,463 | 61.4% |
| Self-Employed (Incorporated) | 1,206 | 4.0% |
| Self-Employed (Not Incorporated) | 2,735 | 9.1% |
| Not-for-profit Organizations | 2,740 | 9.1% |
| Local Government Employees | 3,324 | 11.1% |
| State Government Employees | 1,193 | 4.0% |
| Federal Government Employees | 413 | 1.4% |
| Unpaid Family Workers | 18 | 0.1% |
| Total | 30,092 | 100.0% |
Employment Status by Age in Petaluma
According to the labor force statistics for Petaluma, out of the total population over 16 years of age (49,732), 65.4% or 32,525 individuals are in the labor force, with 4.7% or 1,529 of them unemployed. The age group with the highest labor force participation rate is 30 to 34 years, with 91.9% or 3,568 individuals in the labor force. Within the labor force, the 16 to 19 years age range has the highest percentage of unemployed individuals, with 10.0% or 103 of them being unemployed.
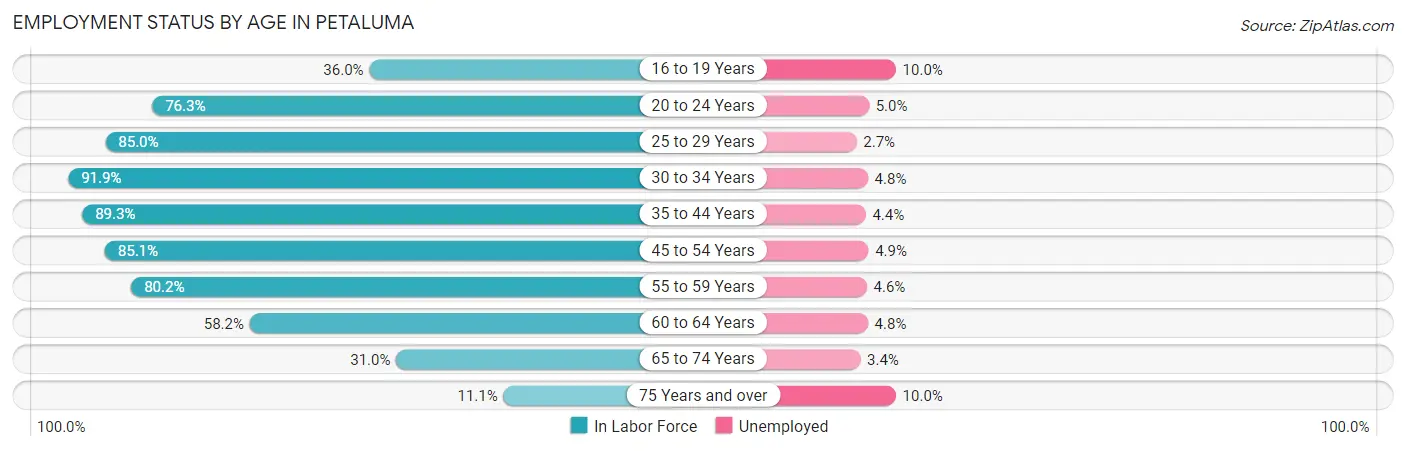
| Age Bracket | In Labor Force | Unemployed |
| 16 to 19 Years | 1,026 (36.0%) | 103 (10.0%) |
| 20 to 24 Years | 2,031 (76.3%) | 102 (5.0%) |
| 25 to 29 Years | 3,070 (85.0%) | 83 (2.7%) |
| 30 to 34 Years | 3,568 (91.9%) | 171 (4.8%) |
| 35 to 44 Years | 7,150 (89.3%) | 315 (4.4%) |
| 45 to 54 Years | 6,676 (85.1%) | 327 (4.9%) |
| 55 to 59 Years | 3,688 (80.2%) | 170 (4.6%) |
| 60 to 64 Years | 2,674 (58.2%) | 128 (4.8%) |
| 65 to 74 Years | 2,111 (31.0%) | 72 (3.4%) |
| 75 Years and over | 541 (11.1%) | 54 (10.0%) |
| Total | 32,525 (65.4%) | 1,529 (4.7%) |
Employment Status by Educational Attainment in Petaluma
According to labor force statistics for Petaluma, 82.5% of individuals (26,845) out of the total population between 25 and 64 years of age (32,539) are in the labor force, with 4.4% or 1,181 of them being unemployed. The group with the highest labor force participation rate are those with the educational attainment of bachelor's degree or higher, with 86.3% or 12,741 individuals in the labor force. Within the labor force, individuals with high school diploma education have the highest percentage of unemployment, with 7.4% or 270 of them being unemployed.
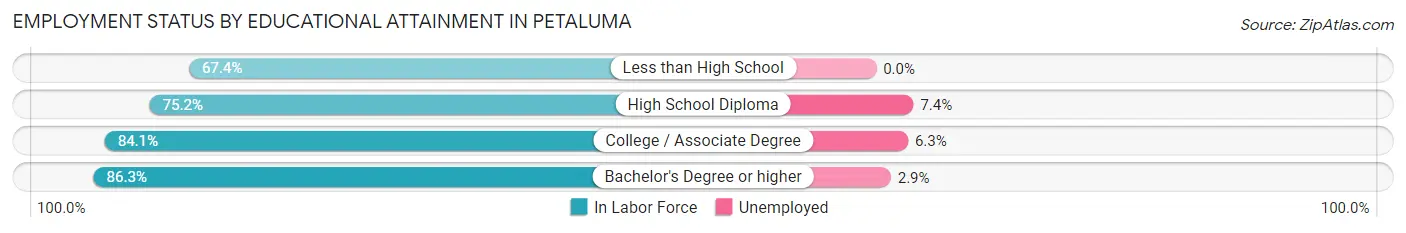
| Educational Attainment | In Labor Force | Unemployed |
| Less than High School | 1,752 (67.4%) | 0 (0.0%) |
| High School Diploma | 3,651 (75.2%) | 359 (7.4%) |
| College / Associate Degree | 8,680 (84.1%) | 650 (6.3%) |
| Bachelor's Degree or higher | 12,741 (86.3%) | 428 (2.9%) |
| Total | 26,845 (82.5%) | 1,432 (4.4%) |
Employment Occupations by Sex in Petaluma
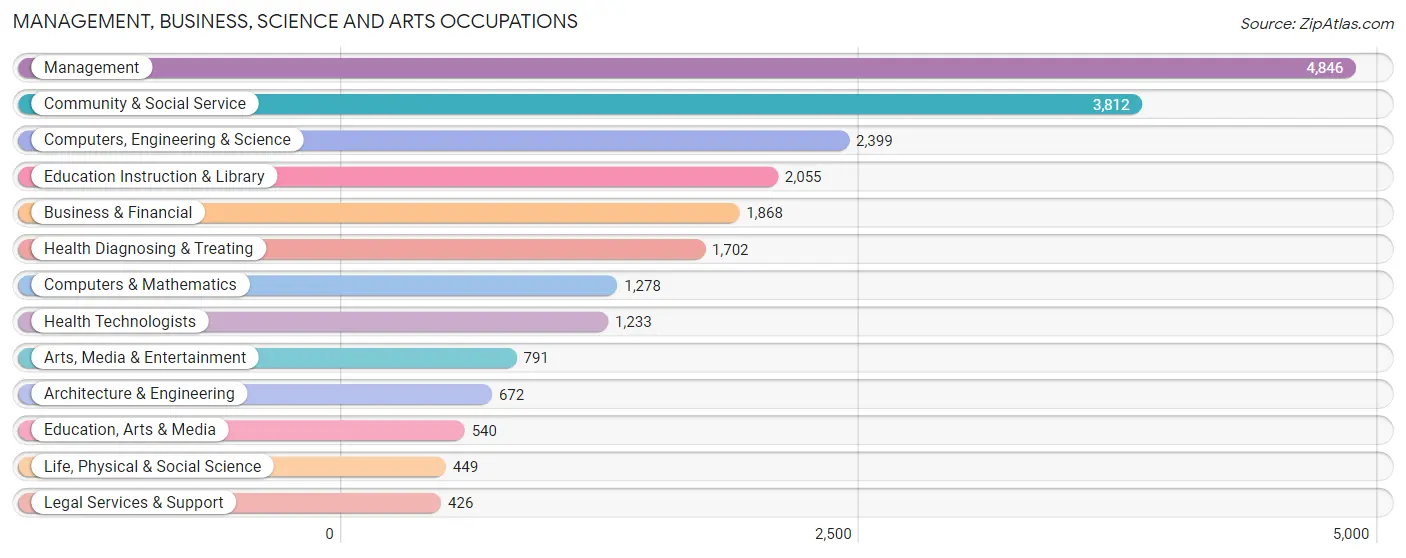
Management, Business, Science and Arts Occupations
The most common Management, Business, Science and Arts occupations in Petaluma are Management (4,846 | 15.7%), Community & Social Service (3,812 | 12.3%), Computers, Engineering & Science (2,399 | 7.8%), Education Instruction & Library (2,055 | 6.7%), and Business & Financial (1,868 | 6.0%).
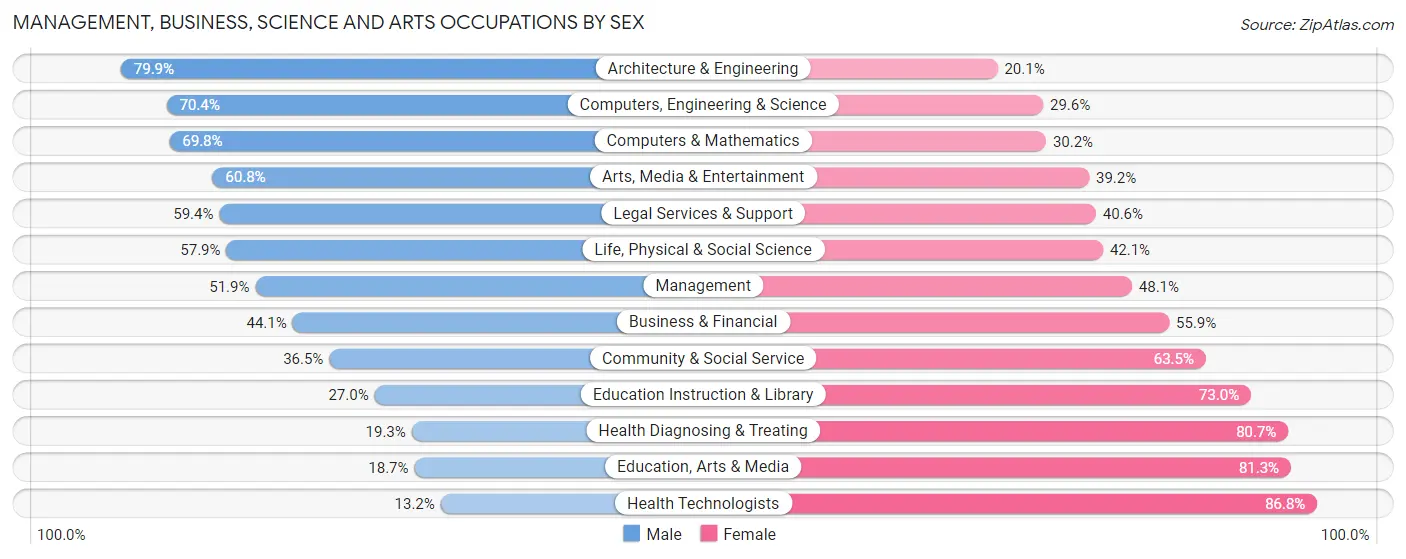
Management, Business, Science and Arts Occupations by Sex
Within the Management, Business, Science and Arts occupations in Petaluma, the most male-oriented occupations are Architecture & Engineering (79.9%), Computers, Engineering & Science (70.4%), and Computers & Mathematics (69.8%), while the most female-oriented occupations are Health Technologists (86.8%), Education, Arts & Media (81.3%), and Health Diagnosing & Treating (80.7%).
| Occupation | Male | Female |
| Management | 2,514 (51.9%) | 2,332 (48.1%) |
| Business & Financial | 824 (44.1%) | 1,044 (55.9%) |
| Computers, Engineering & Science | 1,689 (70.4%) | 710 (29.6%) |
| Computers & Mathematics | 892 (69.8%) | 386 (30.2%) |
| Architecture & Engineering | 537 (79.9%) | 135 (20.1%) |
| Life, Physical & Social Science | 260 (57.9%) | 189 (42.1%) |
| Community & Social Service | 1,390 (36.5%) | 2,422 (63.5%) |
| Education, Arts & Media | 101 (18.7%) | 439 (81.3%) |
| Legal Services & Support | 253 (59.4%) | 173 (40.6%) |
| Education Instruction & Library | 555 (27.0%) | 1,500 (73.0%) |
| Arts, Media & Entertainment | 481 (60.8%) | 310 (39.2%) |
| Health Diagnosing & Treating | 328 (19.3%) | 1,374 (80.7%) |
| Health Technologists | 163 (13.2%) | 1,070 (86.8%) |
| Total (Category) | 6,745 (46.1%) | 7,882 (53.9%) |
| Total (Overall) | 15,748 (51.0%) | 15,122 (49.0%) |
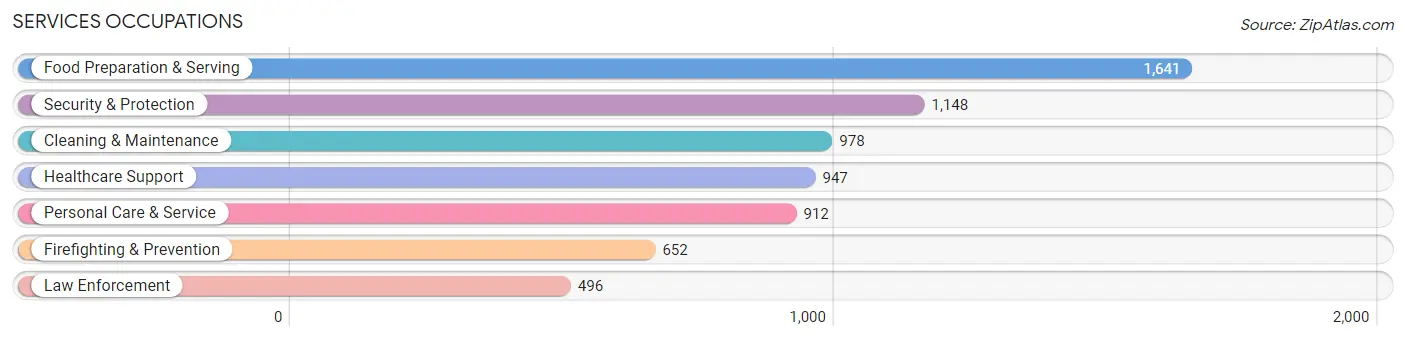
Services Occupations
The most common Services occupations in Petaluma are Food Preparation & Serving (1,641 | 5.3%), Security & Protection (1,148 | 3.7%), Cleaning & Maintenance (978 | 3.2%), Healthcare Support (947 | 3.1%), and Personal Care & Service (912 | 2.9%).
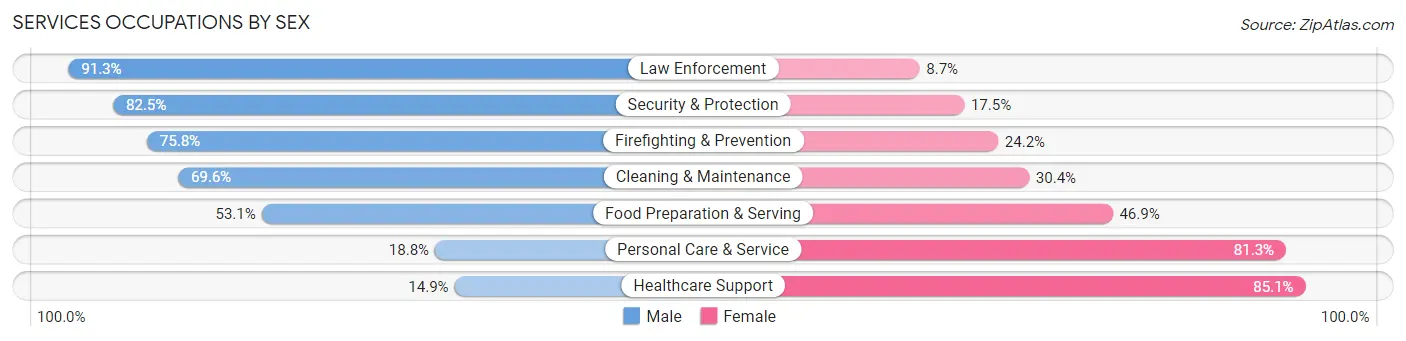
Services Occupations by Sex
Within the Services occupations in Petaluma, the most male-oriented occupations are Law Enforcement (91.3%), Security & Protection (82.5%), and Firefighting & Prevention (75.8%), while the most female-oriented occupations are Healthcare Support (85.1%), Personal Care & Service (81.2%), and Food Preparation & Serving (46.9%).
| Occupation | Male | Female |
| Healthcare Support | 141 (14.9%) | 806 (85.1%) |
| Security & Protection | 947 (82.5%) | 201 (17.5%) |
| Firefighting & Prevention | 494 (75.8%) | 158 (24.2%) |
| Law Enforcement | 453 (91.3%) | 43 (8.7%) |
| Food Preparation & Serving | 871 (53.1%) | 770 (46.9%) |
| Cleaning & Maintenance | 681 (69.6%) | 297 (30.4%) |
| Personal Care & Service | 171 (18.8%) | 741 (81.2%) |
| Total (Category) | 2,811 (50.0%) | 2,815 (50.0%) |
| Total (Overall) | 15,748 (51.0%) | 15,122 (49.0%) |
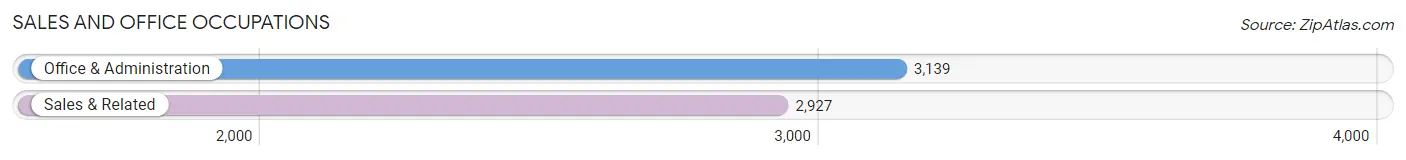
Sales and Office Occupations
The most common Sales and Office occupations in Petaluma are Office & Administration (3,139 | 10.2%), and Sales & Related (2,927 | 9.5%).
Sales and Office Occupations by Sex
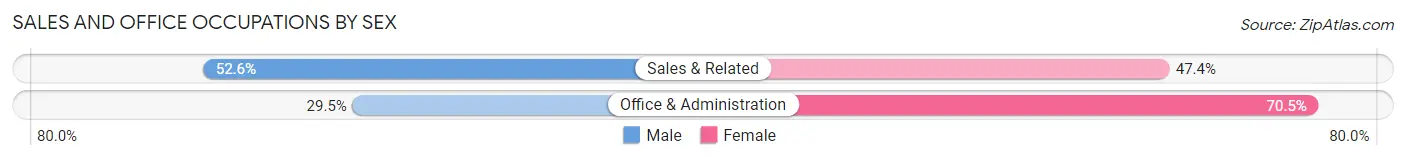
| Occupation | Male | Female |
| Sales & Related | 1,539 (52.6%) | 1,388 (47.4%) |
| Office & Administration | 927 (29.5%) | 2,212 (70.5%) |
| Total (Category) | 2,466 (40.6%) | 3,600 (59.4%) |
| Total (Overall) | 15,748 (51.0%) | 15,122 (49.0%) |
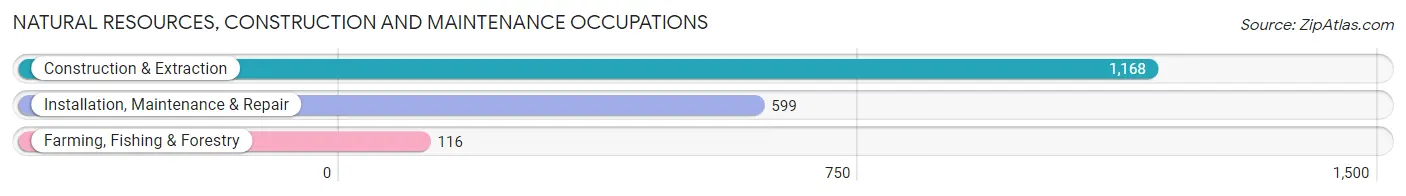
Natural Resources, Construction and Maintenance Occupations
The most common Natural Resources, Construction and Maintenance occupations in Petaluma are Construction & Extraction (1,168 | 3.8%), Installation, Maintenance & Repair (599 | 1.9%), and Farming, Fishing & Forestry (116 | 0.4%).
Natural Resources, Construction and Maintenance Occupations by Sex
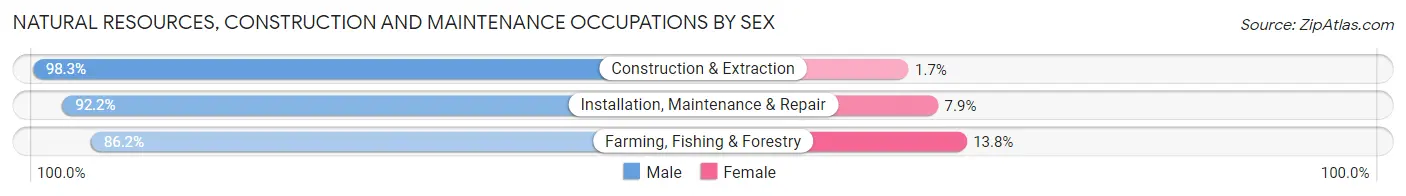
| Occupation | Male | Female |
| Farming, Fishing & Forestry | 100 (86.2%) | 16 (13.8%) |
| Construction & Extraction | 1,148 (98.3%) | 20 (1.7%) |
| Installation, Maintenance & Repair | 552 (92.1%) | 47 (7.9%) |
| Total (Category) | 1,800 (95.6%) | 83 (4.4%) |
| Total (Overall) | 15,748 (51.0%) | 15,122 (49.0%) |
Production, Transportation and Moving Occupations
The most common Production, Transportation and Moving occupations in Petaluma are Production (1,156 | 3.7%), Material Moving (771 | 2.5%), and Transportation (741 | 2.4%).
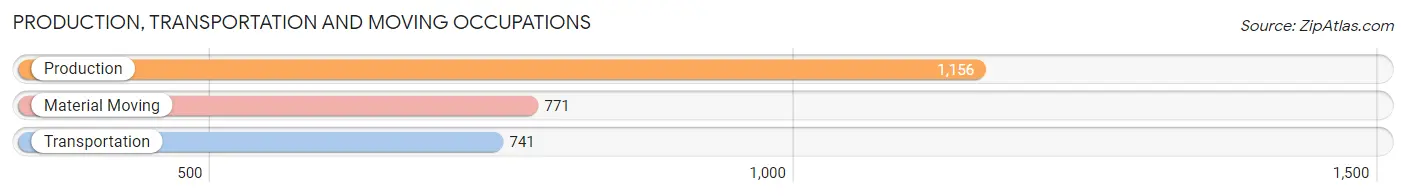
Production, Transportation and Moving Occupations by Sex
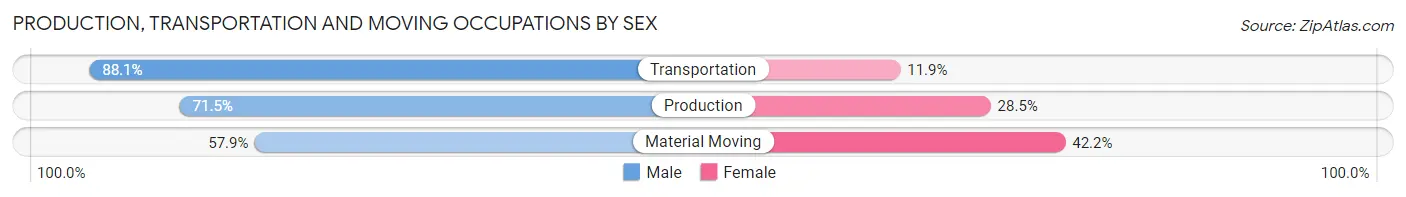
| Occupation | Male | Female |
| Production | 827 (71.5%) | 329 (28.5%) |
| Transportation | 653 (88.1%) | 88 (11.9%) |
| Material Moving | 446 (57.9%) | 325 (42.1%) |
| Total (Category) | 1,926 (72.2%) | 742 (27.8%) |
| Total (Overall) | 15,748 (51.0%) | 15,122 (49.0%) |
Employment Industries by Sex in Petaluma
Employment Industries in Petaluma
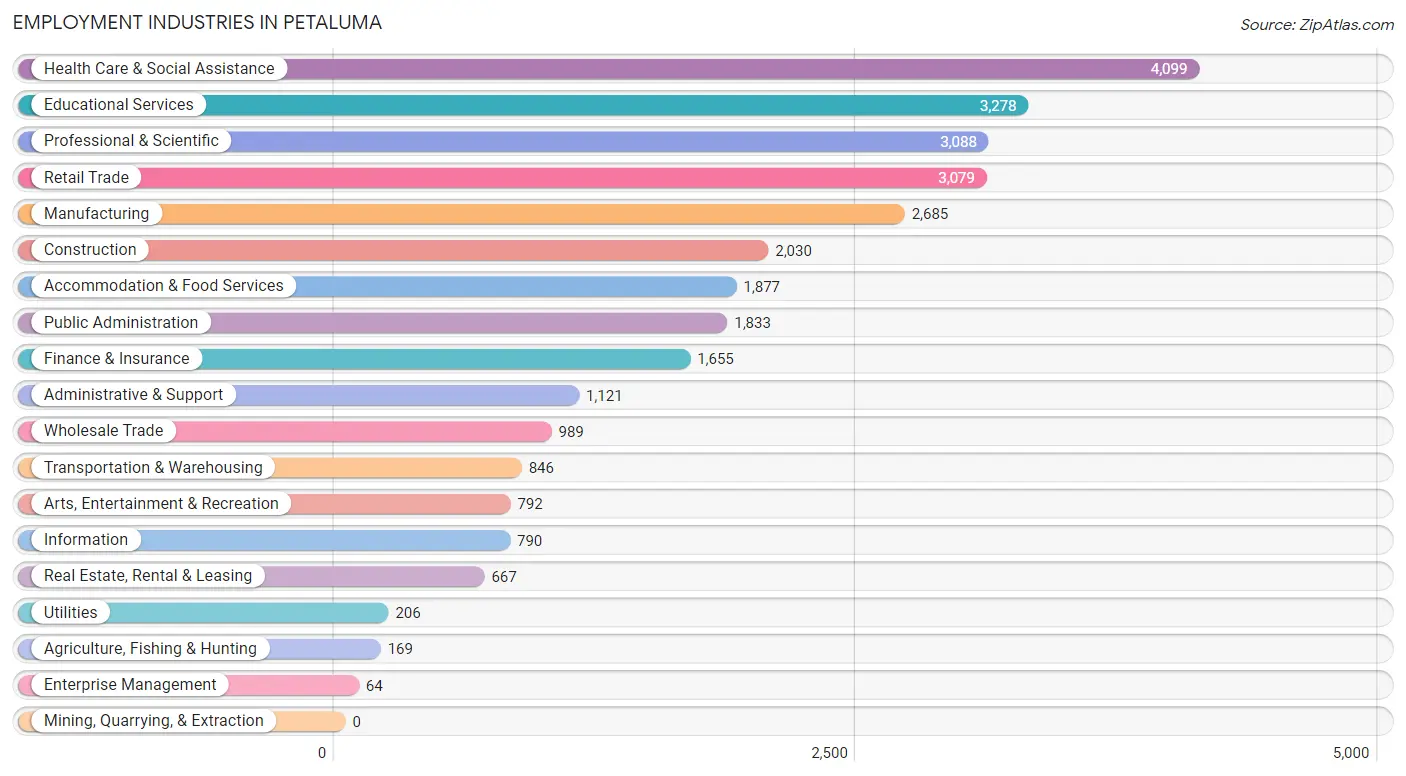
The major employment industries in Petaluma include Health Care & Social Assistance (4,099 | 13.3%), Educational Services (3,278 | 10.6%), Professional & Scientific (3,088 | 10.0%), Retail Trade (3,079 | 10.0%), and Manufacturing (2,685 | 8.7%).
Employment Industries by Sex in Petaluma
The Petaluma industries that see more men than women are Construction (90.8%), Utilities (86.9%), and Agriculture, Fishing & Hunting (79.3%), whereas the industries that tend to have a higher number of women are Health Care & Social Assistance (76.1%), Educational Services (69.6%), and Enterprise Management (62.5%).
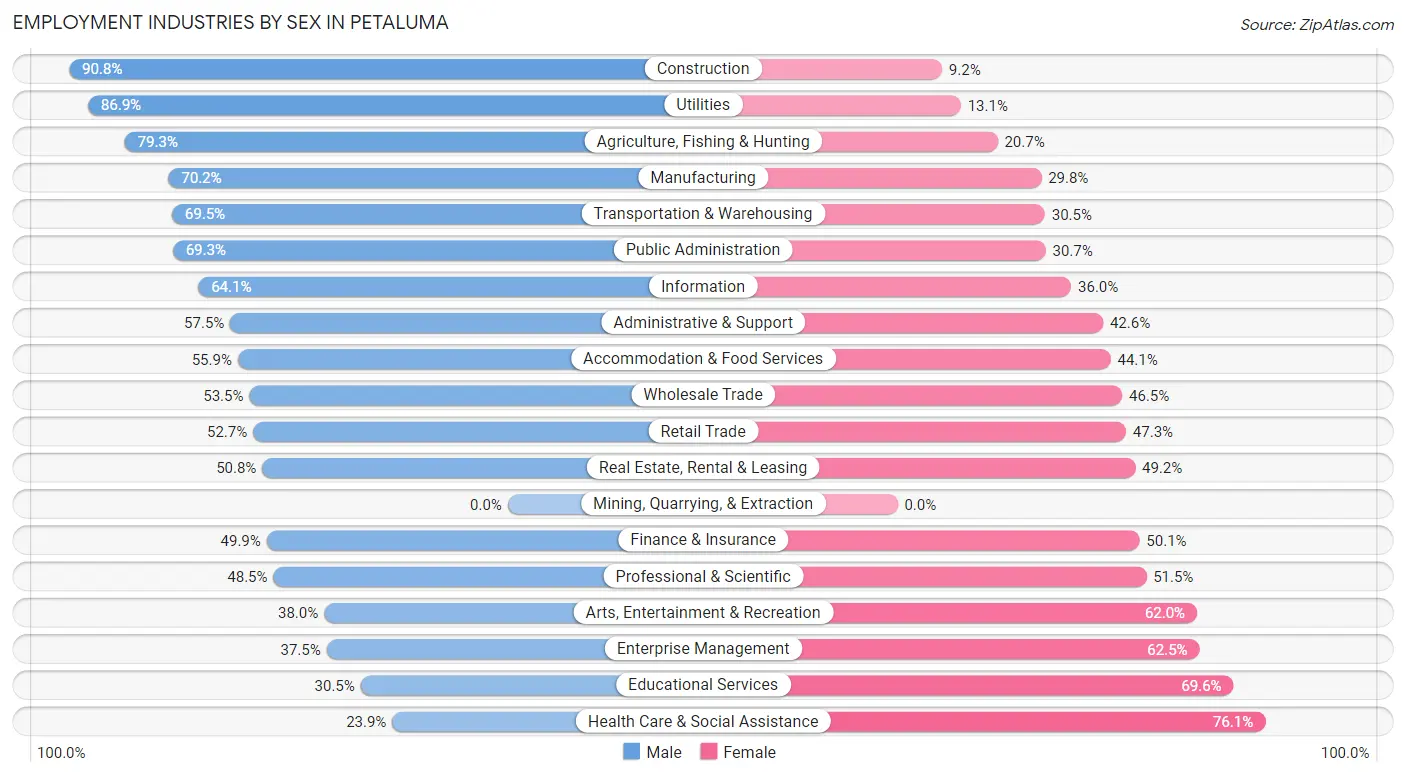
| Industry | Male | Female |
| Agriculture, Fishing & Hunting | 134 (79.3%) | 35 (20.7%) |
| Mining, Quarrying, & Extraction | 0 (0.0%) | 0 (0.0%) |
| Construction | 1,843 (90.8%) | 187 (9.2%) |
| Manufacturing | 1,886 (70.2%) | 799 (29.8%) |
| Wholesale Trade | 529 (53.5%) | 460 (46.5%) |
| Retail Trade | 1,623 (52.7%) | 1,456 (47.3%) |
| Transportation & Warehousing | 588 (69.5%) | 258 (30.5%) |
| Utilities | 179 (86.9%) | 27 (13.1%) |
| Information | 506 (64.0%) | 284 (35.9%) |
| Finance & Insurance | 826 (49.9%) | 829 (50.1%) |
| Real Estate, Rental & Leasing | 339 (50.8%) | 328 (49.2%) |
| Professional & Scientific | 1,498 (48.5%) | 1,590 (51.5%) |
| Enterprise Management | 24 (37.5%) | 40 (62.5%) |
| Administrative & Support | 644 (57.5%) | 477 (42.5%) |
| Educational Services | 998 (30.4%) | 2,280 (69.6%) |
| Health Care & Social Assistance | 980 (23.9%) | 3,119 (76.1%) |
| Arts, Entertainment & Recreation | 301 (38.0%) | 491 (62.0%) |
| Accommodation & Food Services | 1,049 (55.9%) | 828 (44.1%) |
| Public Administration | 1,271 (69.3%) | 562 (30.7%) |
| Total | 15,748 (51.0%) | 15,122 (49.0%) |
Education in Petaluma
School Enrollment in Petaluma
The most common levels of schooling among the 13,114 students in Petaluma are high school (3,363 | 25.6%), college / undergraduate (2,676 | 20.4%), and elementary school (2,454 | 18.7%).
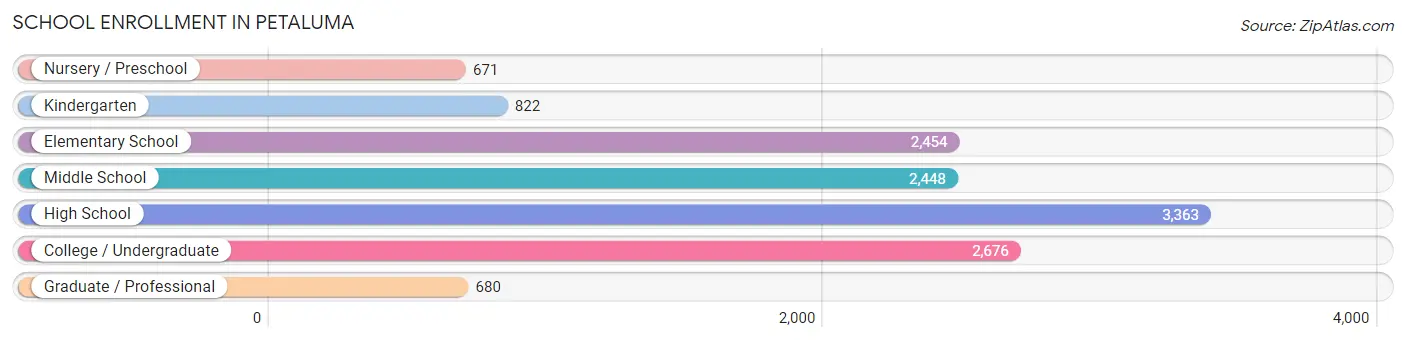
| School Level | # Students | % Students |
| Nursery / Preschool | 671 | 5.1% |
| Kindergarten | 822 | 6.3% |
| Elementary School | 2,454 | 18.7% |
| Middle School | 2,448 | 18.7% |
| High School | 3,363 | 25.6% |
| College / Undergraduate | 2,676 | 20.4% |
| Graduate / Professional | 680 | 5.2% |
| Total | 13,114 | 100.0% |
School Enrollment by Age by Funding Source in Petaluma
Out of a total of 13,114 students who are enrolled in schools in Petaluma, 1,206 (9.2%) attend a private institution, while the remaining 11,908 (90.8%) are enrolled in public schools. The age group of 3 to 4 year olds has the highest likelihood of being enrolled in private schools, with 289 (55.6% in the age bracket) enrolled. Conversely, the age group of 15 to 17 year olds has the lowest likelihood of being enrolled in a private school, with 2,491 (96.3% in the age bracket) attending a public institution.
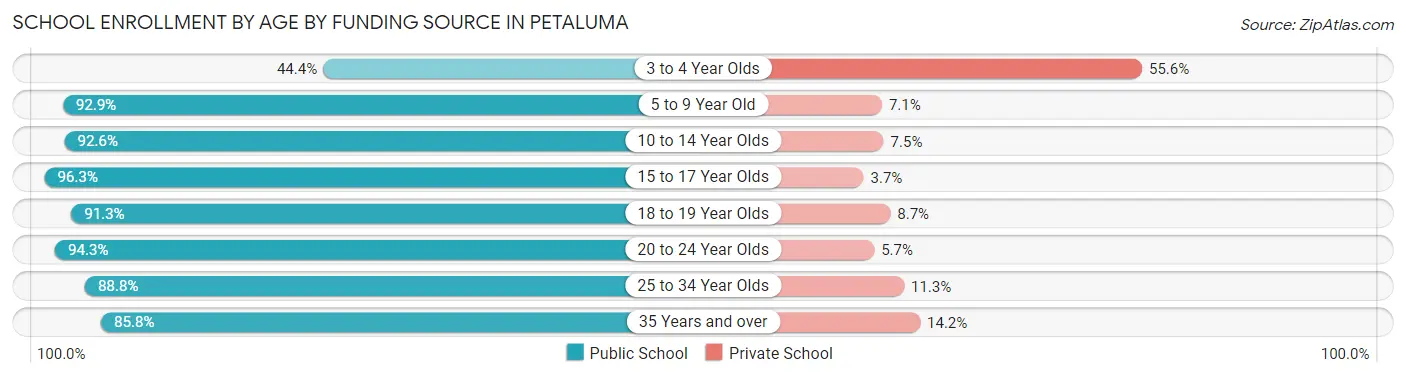
| Age Bracket | Public School | Private School |
| 3 to 4 Year Olds | 231 (44.4%) | 289 (55.6%) |
| 5 to 9 Year Old | 3,068 (92.9%) | 236 (7.1%) |
| 10 to 14 Year Olds | 2,781 (92.5%) | 224 (7.4%) |
| 15 to 17 Year Olds | 2,491 (96.3%) | 96 (3.7%) |
| 18 to 19 Year Olds | 903 (91.3%) | 86 (8.7%) |
| 20 to 24 Year Olds | 945 (94.3%) | 57 (5.7%) |
| 25 to 34 Year Olds | 686 (88.7%) | 87 (11.3%) |
| 35 Years and over | 801 (85.8%) | 133 (14.2%) |
| Total | 11,908 (90.8%) | 1,206 (9.2%) |
Educational Attainment by Field of Study in Petaluma
Business (3,261 | 16.0%), social sciences (2,449 | 12.0%), literature & languages (1,642 | 8.1%), bio, nature & agricultural (1,639 | 8.1%), and liberal arts & history (1,507 | 7.4%) are the most common fields of study among 20,366 individuals in Petaluma who have obtained a bachelor's degree or higher.
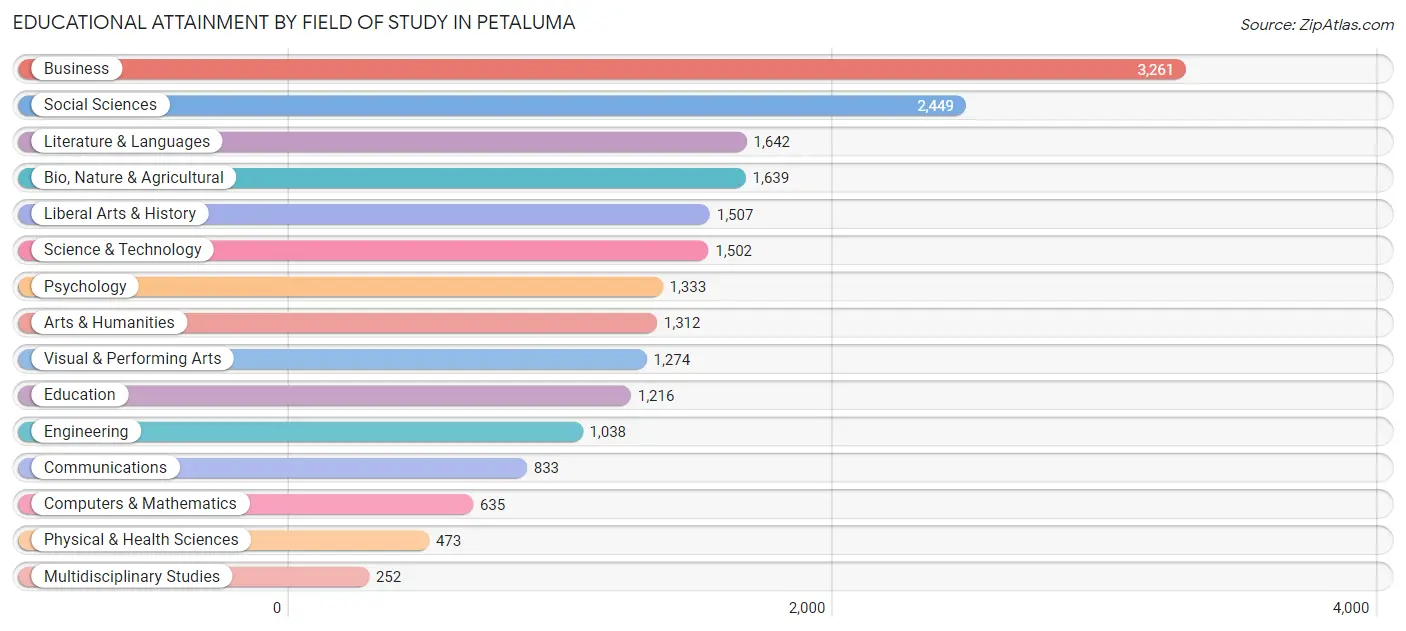
| Field of Study | # Graduates | % Graduates |
| Computers & Mathematics | 635 | 3.1% |
| Bio, Nature & Agricultural | 1,639 | 8.1% |
| Physical & Health Sciences | 473 | 2.3% |
| Psychology | 1,333 | 6.6% |
| Social Sciences | 2,449 | 12.0% |
| Engineering | 1,038 | 5.1% |
| Multidisciplinary Studies | 252 | 1.2% |
| Science & Technology | 1,502 | 7.4% |
| Business | 3,261 | 16.0% |
| Education | 1,216 | 6.0% |
| Literature & Languages | 1,642 | 8.1% |
| Liberal Arts & History | 1,507 | 7.4% |
| Visual & Performing Arts | 1,274 | 6.3% |
| Communications | 833 | 4.1% |
| Arts & Humanities | 1,312 | 6.4% |
| Total | 20,366 | 100.0% |
Transportation & Commute in Petaluma
Vehicle Availability by Sex in Petaluma
The most prevalent vehicle ownership categories in Petaluma are males with 2 vehicles (6,449, accounting for 41.9%) and females with 2 vehicles (6,163, making up 44.1%).
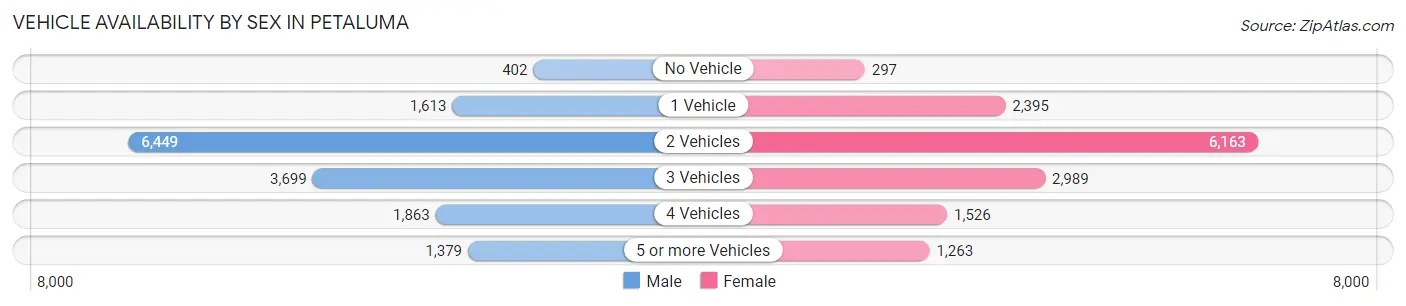
| Vehicles Available | Male | Female |
| No Vehicle | 402 (2.6%) | 297 (2.0%) |
| 1 Vehicle | 1,613 (10.5%) | 2,395 (16.4%) |
| 2 Vehicles | 6,449 (41.9%) | 6,163 (42.1%) |
| 3 Vehicles | 3,699 (24.0%) | 2,989 (20.4%) |
| 4 Vehicles | 1,863 (12.1%) | 1,526 (10.4%) |
| 5 or more Vehicles | 1,379 (8.9%) | 1,263 (8.6%) |
| Total | 15,405 (100.0%) | 14,633 (100.0%) |
Commute Time in Petaluma
The most frequently occuring commute durations in Petaluma are 30 to 34 minutes (3,839 commuters, 15.1%), 10 to 14 minutes (3,598 commuters, 14.1%), and 45 to 59 minutes (2,938 commuters, 11.6%).
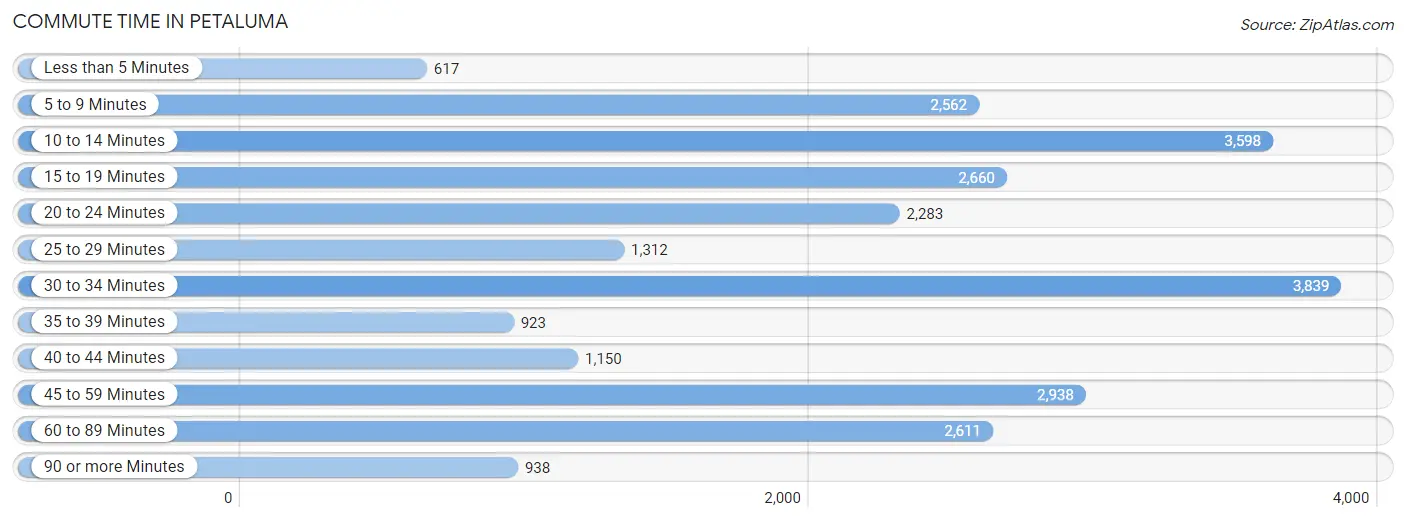
| Commute Time | # Commuters | % Commuters |
| Less than 5 Minutes | 617 | 2.4% |
| 5 to 9 Minutes | 2,562 | 10.1% |
| 10 to 14 Minutes | 3,598 | 14.1% |
| 15 to 19 Minutes | 2,660 | 10.5% |
| 20 to 24 Minutes | 2,283 | 9.0% |
| 25 to 29 Minutes | 1,312 | 5.2% |
| 30 to 34 Minutes | 3,839 | 15.1% |
| 35 to 39 Minutes | 923 | 3.6% |
| 40 to 44 Minutes | 1,150 | 4.5% |
| 45 to 59 Minutes | 2,938 | 11.6% |
| 60 to 89 Minutes | 2,611 | 10.3% |
| 90 or more Minutes | 938 | 3.7% |
Commute Time by Sex in Petaluma
The most common commute times in Petaluma are 10 to 14 minutes (1,882 commuters, 14.1%) for males and 30 to 34 minutes (1,961 commuters, 16.3%) for females.
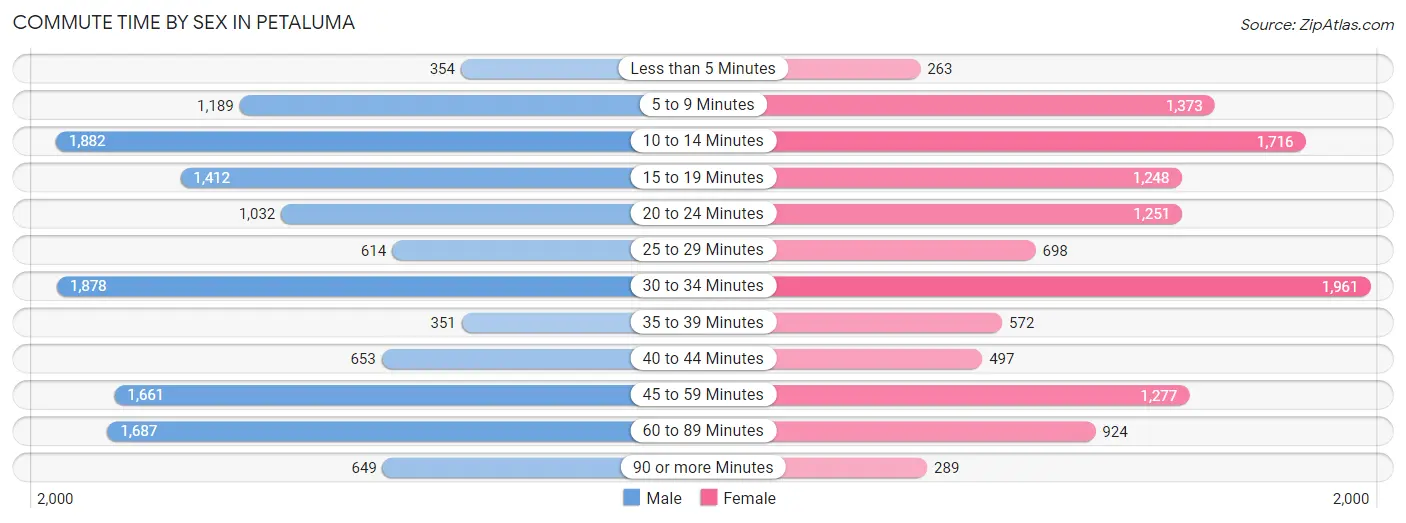
| Commute Time | Male | Female |
| Less than 5 Minutes | 354 (2.6%) | 263 (2.2%) |
| 5 to 9 Minutes | 1,189 (8.9%) | 1,373 (11.4%) |
| 10 to 14 Minutes | 1,882 (14.1%) | 1,716 (14.2%) |
| 15 to 19 Minutes | 1,412 (10.6%) | 1,248 (10.3%) |
| 20 to 24 Minutes | 1,032 (7.7%) | 1,251 (10.4%) |
| 25 to 29 Minutes | 614 (4.6%) | 698 (5.8%) |
| 30 to 34 Minutes | 1,878 (14.1%) | 1,961 (16.3%) |
| 35 to 39 Minutes | 351 (2.6%) | 572 (4.7%) |
| 40 to 44 Minutes | 653 (4.9%) | 497 (4.1%) |
| 45 to 59 Minutes | 1,661 (12.4%) | 1,277 (10.6%) |
| 60 to 89 Minutes | 1,687 (12.6%) | 924 (7.7%) |
| 90 or more Minutes | 649 (4.9%) | 289 (2.4%) |
Time of Departure to Work by Sex in Petaluma
The most frequent times of departure to work in Petaluma are 8:00 AM to 8:29 AM (1,525, 11.4%) for males and 8:00 AM to 8:29 AM (2,086, 17.3%) for females.
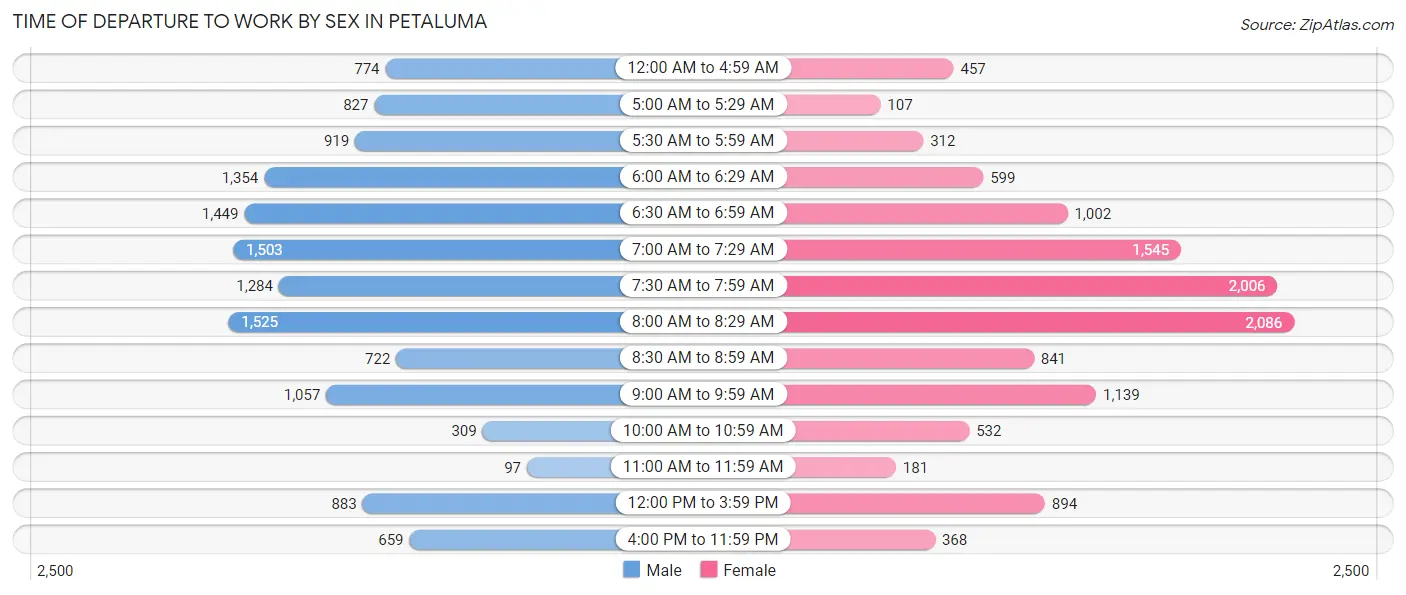
| Time of Departure | Male | Female |
| 12:00 AM to 4:59 AM | 774 (5.8%) | 457 (3.8%) |
| 5:00 AM to 5:29 AM | 827 (6.2%) | 107 (0.9%) |
| 5:30 AM to 5:59 AM | 919 (6.9%) | 312 (2.6%) |
| 6:00 AM to 6:29 AM | 1,354 (10.1%) | 599 (5.0%) |
| 6:30 AM to 6:59 AM | 1,449 (10.8%) | 1,002 (8.3%) |
| 7:00 AM to 7:29 AM | 1,503 (11.3%) | 1,545 (12.8%) |
| 7:30 AM to 7:59 AM | 1,284 (9.6%) | 2,006 (16.6%) |
| 8:00 AM to 8:29 AM | 1,525 (11.4%) | 2,086 (17.3%) |
| 8:30 AM to 8:59 AM | 722 (5.4%) | 841 (7.0%) |
| 9:00 AM to 9:59 AM | 1,057 (7.9%) | 1,139 (9.4%) |
| 10:00 AM to 10:59 AM | 309 (2.3%) | 532 (4.4%) |
| 11:00 AM to 11:59 AM | 97 (0.7%) | 181 (1.5%) |
| 12:00 PM to 3:59 PM | 883 (6.6%) | 894 (7.4%) |
| 4:00 PM to 11:59 PM | 659 (4.9%) | 368 (3.0%) |
| Total | 13,362 (100.0%) | 12,069 (100.0%) |
Housing Occupancy in Petaluma
Occupancy by Ownership in Petaluma
Of the total 23,486 dwellings in Petaluma, owner-occupied units account for 14,767 (62.9%), while renter-occupied units make up 8,719 (37.1%).
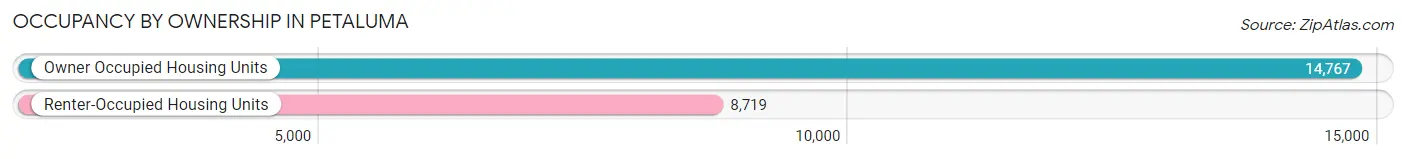
| Occupancy | # Housing Units | % Housing Units |
| Owner Occupied Housing Units | 14,767 | 62.9% |
| Renter-Occupied Housing Units | 8,719 | 37.1% |
| Total Occupied Housing Units | 23,486 | 100.0% |
Occupancy by Household Size in Petaluma
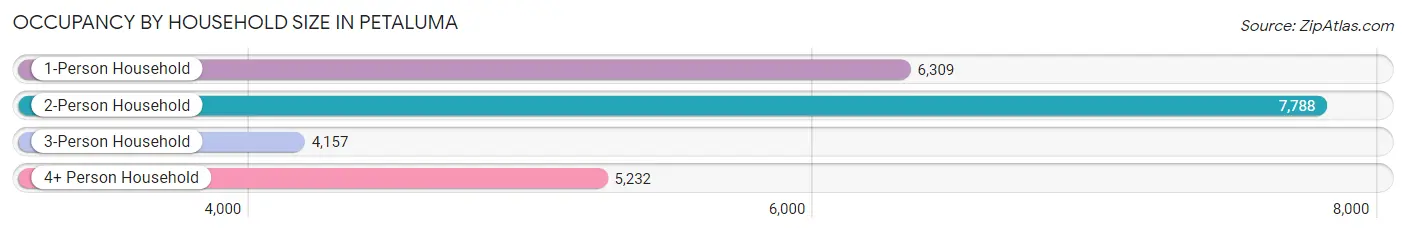
| Household Size | # Housing Units | % Housing Units |
| 1-Person Household | 6,309 | 26.9% |
| 2-Person Household | 7,788 | 33.2% |
| 3-Person Household | 4,157 | 17.7% |
| 4+ Person Household | 5,232 | 22.3% |
| Total Housing Units | 23,486 | 100.0% |
Occupancy by Ownership by Household Size in Petaluma
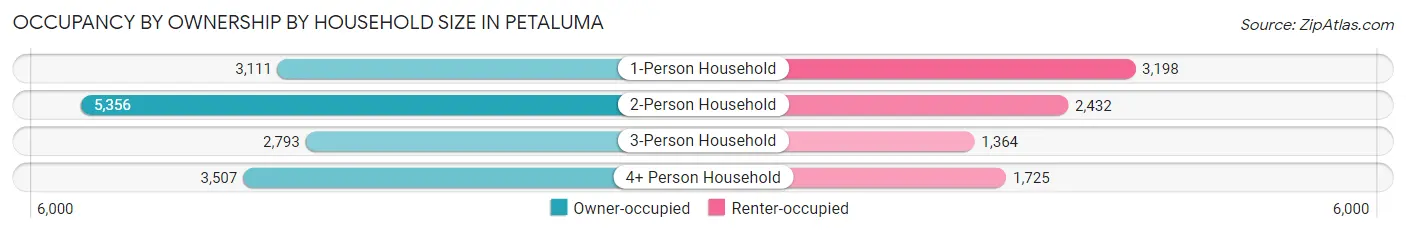
| Household Size | Owner-occupied | Renter-occupied |
| 1-Person Household | 3,111 (49.3%) | 3,198 (50.7%) |
| 2-Person Household | 5,356 (68.8%) | 2,432 (31.2%) |
| 3-Person Household | 2,793 (67.2%) | 1,364 (32.8%) |
| 4+ Person Household | 3,507 (67.0%) | 1,725 (33.0%) |
| Total Housing Units | 14,767 (62.9%) | 8,719 (37.1%) |
Occupancy by Educational Attainment in Petaluma
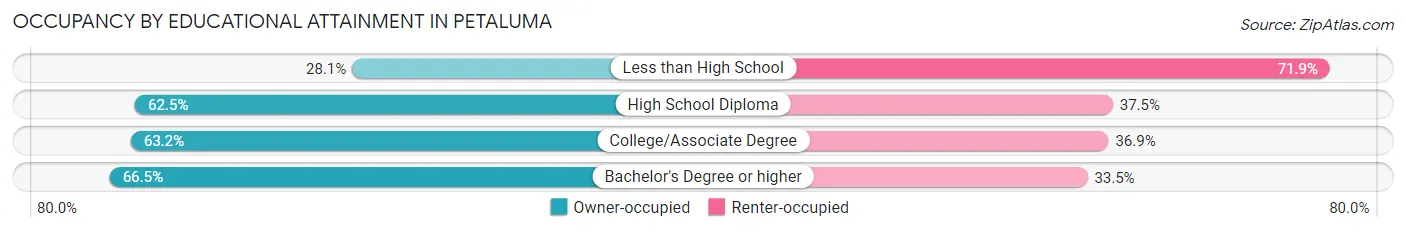
| Household Size | Owner-occupied | Renter-occupied |
| Less than High School | 337 (28.1%) | 864 (71.9%) |
| High School Diploma | 1,763 (62.5%) | 1,059 (37.5%) |
| College/Associate Degree | 5,179 (63.1%) | 3,022 (36.8%) |
| Bachelor's Degree or higher | 7,488 (66.5%) | 3,774 (33.5%) |
Occupancy by Age of Householder in Petaluma
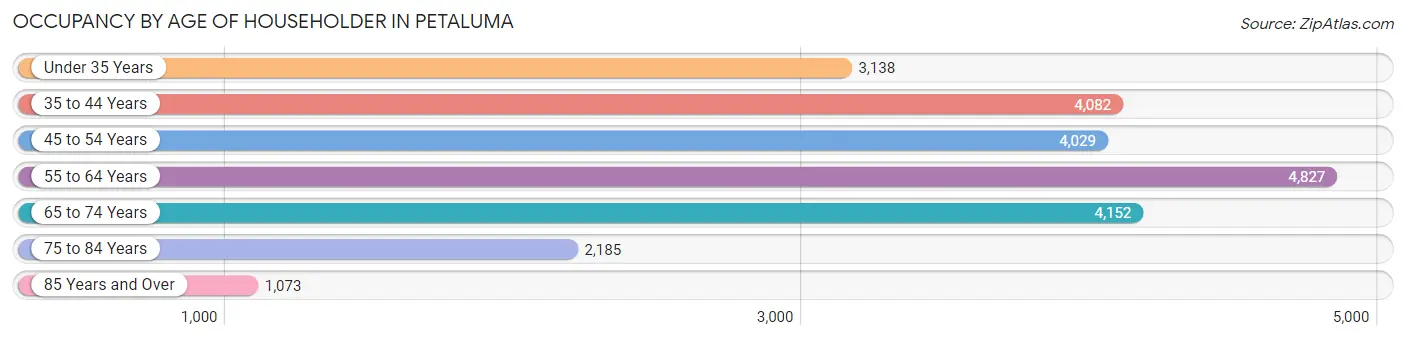
| Age Bracket | # Households | % Households |
| Under 35 Years | 3,138 | 13.4% |
| 35 to 44 Years | 4,082 | 17.4% |
| 45 to 54 Years | 4,029 | 17.2% |
| 55 to 64 Years | 4,827 | 20.5% |
| 65 to 74 Years | 4,152 | 17.7% |
| 75 to 84 Years | 2,185 | 9.3% |
| 85 Years and Over | 1,073 | 4.6% |
| Total | 23,486 | 100.0% |
Housing Finances in Petaluma
Median Income by Occupancy in Petaluma
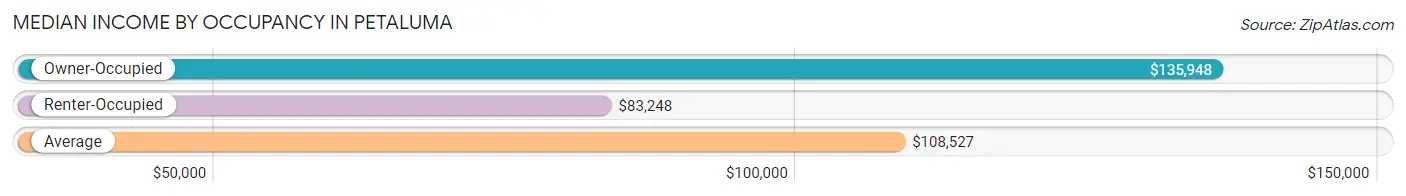
| Occupancy Type | # Households | Median Income |
| Owner-Occupied | 14,767 (62.9%) | $135,948 |
| Renter-Occupied | 8,719 (37.1%) | $83,248 |
| Average | 23,486 (100.0%) | $108,527 |
Occupancy by Householder Income Bracket in Petaluma
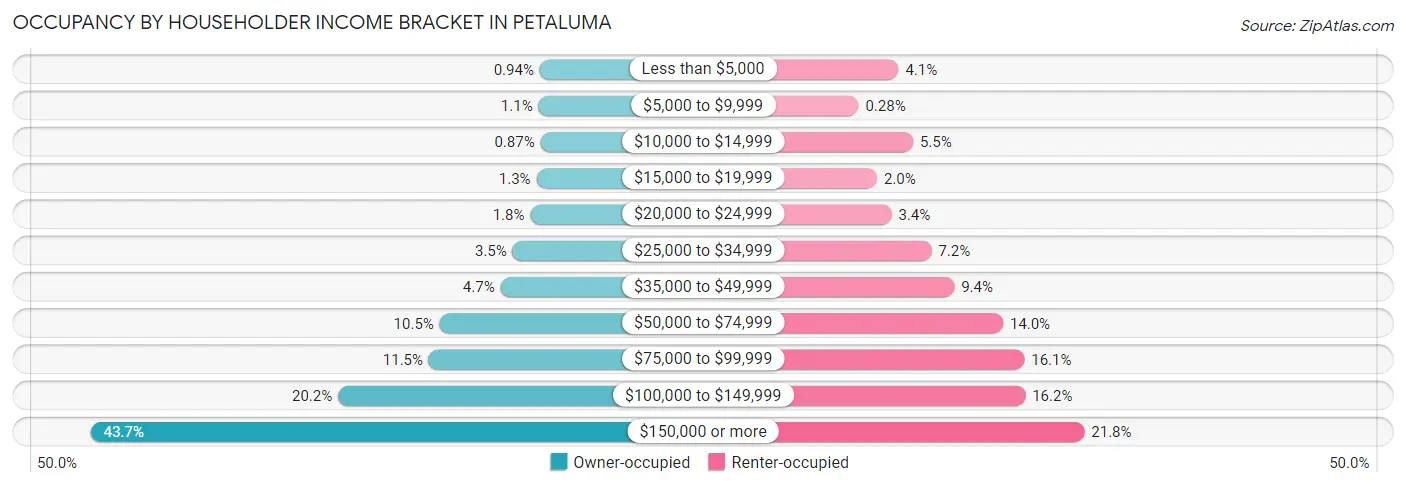
| Income Bracket | Owner-occupied | Renter-occupied |
| Less than $5,000 | 139 (0.9%) | 357 (4.1%) |
| $5,000 to $9,999 | 156 (1.1%) | 24 (0.3%) |
| $10,000 to $14,999 | 128 (0.9%) | 477 (5.5%) |
| $15,000 to $19,999 | 185 (1.3%) | 178 (2.0%) |
| $20,000 to $24,999 | 272 (1.8%) | 299 (3.4%) |
| $25,000 to $34,999 | 520 (3.5%) | 630 (7.2%) |
| $35,000 to $49,999 | 691 (4.7%) | 820 (9.4%) |
| $50,000 to $74,999 | 1,546 (10.5%) | 1,224 (14.0%) |
| $75,000 to $99,999 | 1,698 (11.5%) | 1,401 (16.1%) |
| $100,000 to $149,999 | 2,976 (20.2%) | 1,409 (16.2%) |
| $150,000 or more | 6,456 (43.7%) | 1,900 (21.8%) |
| Total | 14,767 (100.0%) | 8,719 (100.0%) |
Monthly Housing Cost Tiers in Petaluma
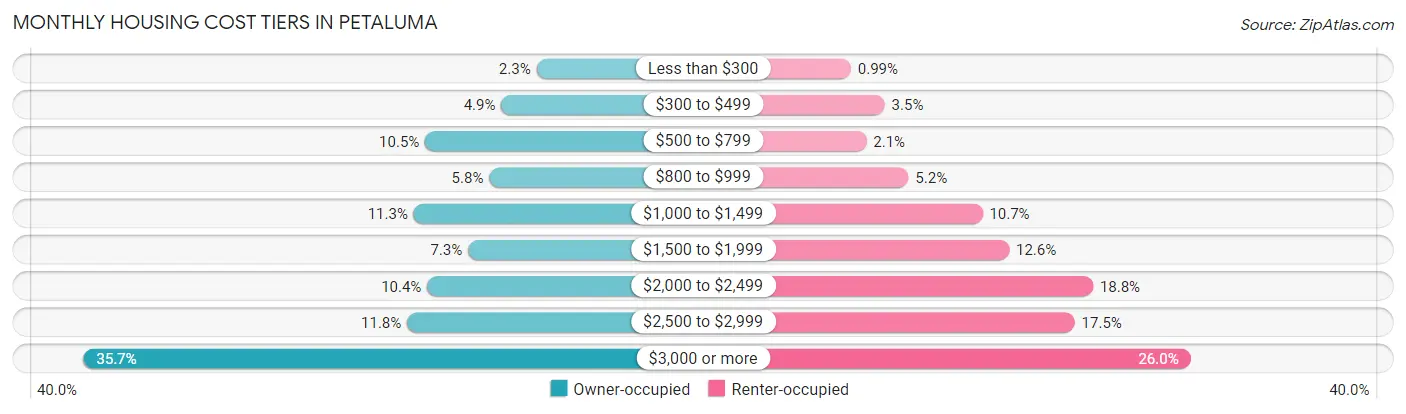
| Monthly Cost | Owner-occupied | Renter-occupied |
| Less than $300 | 340 (2.3%) | 86 (1.0%) |
| $300 to $499 | 722 (4.9%) | 303 (3.5%) |
| $500 to $799 | 1,551 (10.5%) | 186 (2.1%) |
| $800 to $999 | 853 (5.8%) | 456 (5.2%) |
| $1,000 to $1,499 | 1,674 (11.3%) | 931 (10.7%) |
| $1,500 to $1,999 | 1,084 (7.3%) | 1,102 (12.6%) |
| $2,000 to $2,499 | 1,528 (10.3%) | 1,641 (18.8%) |
| $2,500 to $2,999 | 1,747 (11.8%) | 1,523 (17.5%) |
| $3,000 or more | 5,268 (35.7%) | 2,267 (26.0%) |
| Total | 14,767 (100.0%) | 8,719 (100.0%) |
Physical Housing Characteristics in Petaluma
Housing Structures in Petaluma
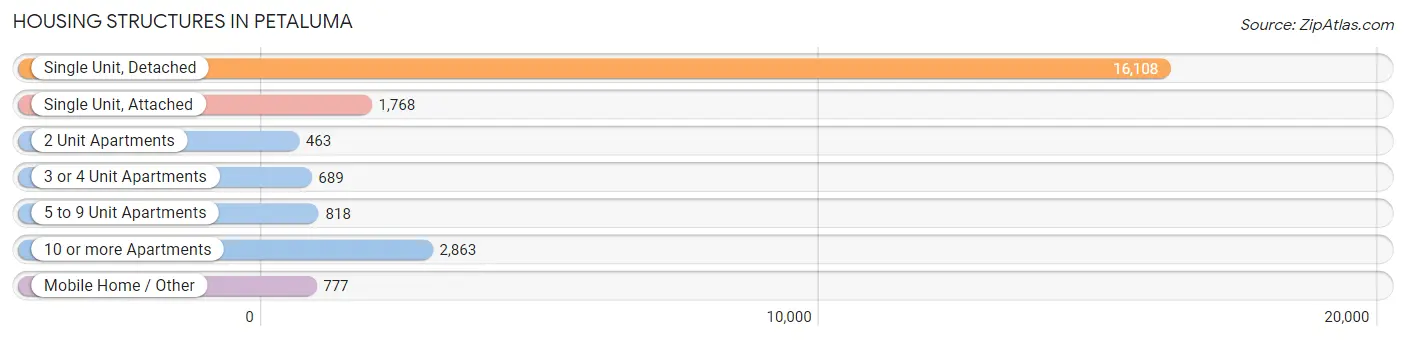
| Structure Type | # Housing Units | % Housing Units |
| Single Unit, Detached | 16,108 | 68.6% |
| Single Unit, Attached | 1,768 | 7.5% |
| 2 Unit Apartments | 463 | 2.0% |
| 3 or 4 Unit Apartments | 689 | 2.9% |
| 5 to 9 Unit Apartments | 818 | 3.5% |
| 10 or more Apartments | 2,863 | 12.2% |
| Mobile Home / Other | 777 | 3.3% |
| Total | 23,486 | 100.0% |
Housing Structures by Occupancy in Petaluma
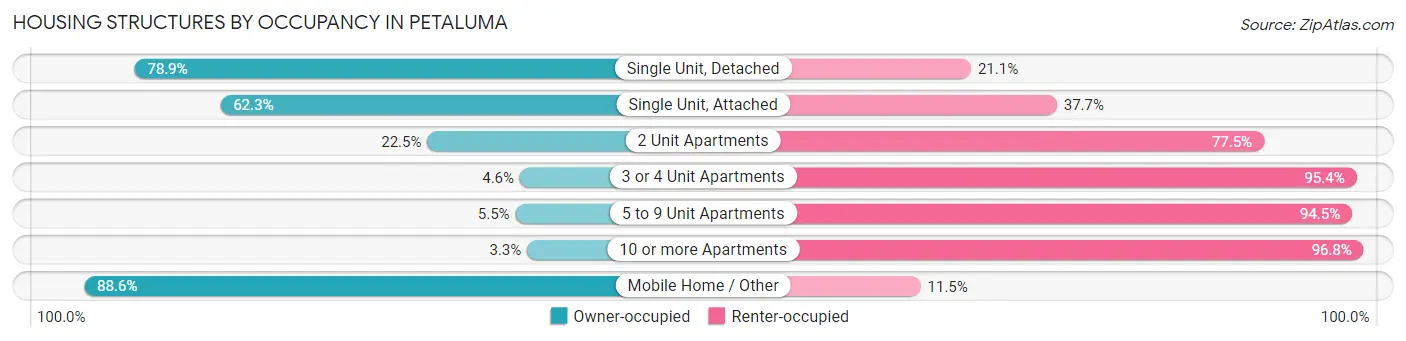
| Structure Type | Owner-occupied | Renter-occupied |
| Single Unit, Detached | 12,703 (78.9%) | 3,405 (21.1%) |
| Single Unit, Attached | 1,102 (62.3%) | 666 (37.7%) |
| 2 Unit Apartments | 104 (22.5%) | 359 (77.5%) |
| 3 or 4 Unit Apartments | 32 (4.6%) | 657 (95.4%) |
| 5 to 9 Unit Apartments | 45 (5.5%) | 773 (94.5%) |
| 10 or more Apartments | 93 (3.3%) | 2,770 (96.8%) |
| Mobile Home / Other | 688 (88.5%) | 89 (11.5%) |
| Total | 14,767 (62.9%) | 8,719 (37.1%) |
Housing Structures by Number of Rooms in Petaluma
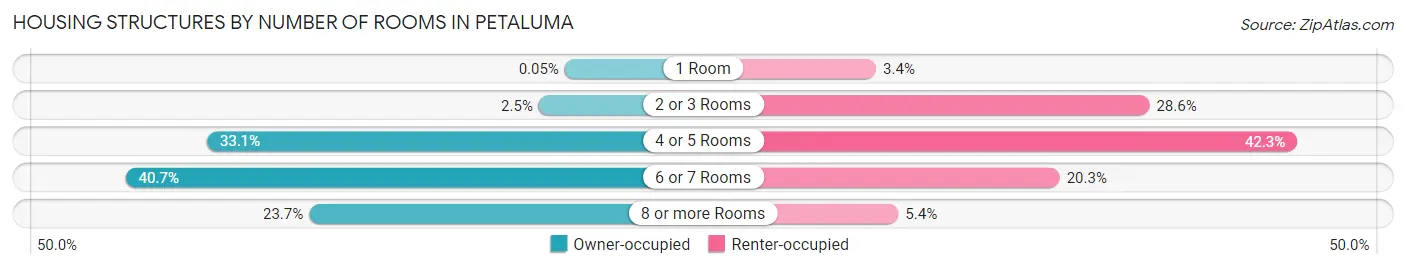
| Number of Rooms | Owner-occupied | Renter-occupied |
| 1 Room | 8 (0.1%) | 292 (3.4%) |
| 2 or 3 Rooms | 362 (2.5%) | 2,496 (28.6%) |
| 4 or 5 Rooms | 4,894 (33.1%) | 3,686 (42.3%) |
| 6 or 7 Rooms | 6,005 (40.7%) | 1,773 (20.3%) |
| 8 or more Rooms | 3,498 (23.7%) | 472 (5.4%) |
| Total | 14,767 (100.0%) | 8,719 (100.0%) |
Housing Structure by Heating Type in Petaluma
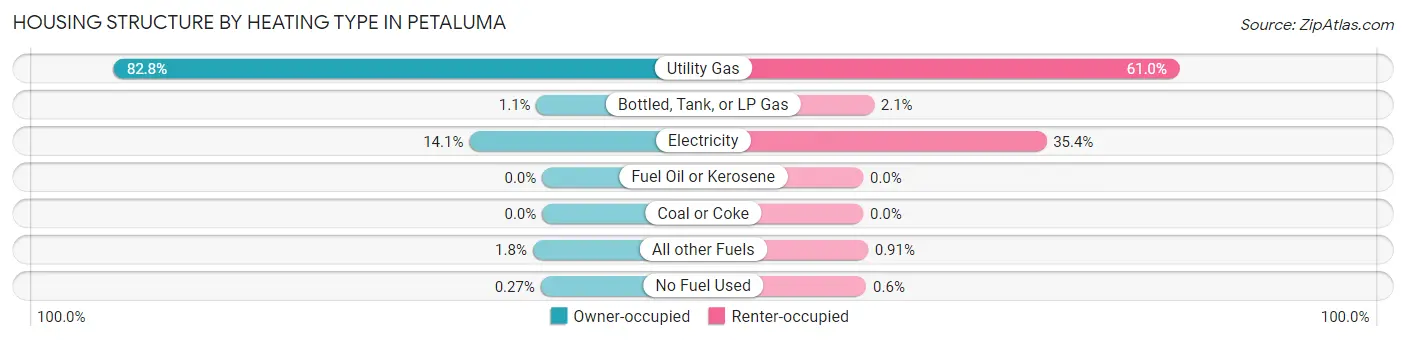
| Heating Type | Owner-occupied | Renter-occupied |
| Utility Gas | 12,219 (82.8%) | 5,320 (61.0%) |
| Bottled, Tank, or LP Gas | 162 (1.1%) | 182 (2.1%) |
| Electricity | 2,079 (14.1%) | 3,086 (35.4%) |
| Fuel Oil or Kerosene | 0 (0.0%) | 0 (0.0%) |
| Coal or Coke | 0 (0.0%) | 0 (0.0%) |
| All other Fuels | 267 (1.8%) | 79 (0.9%) |
| No Fuel Used | 40 (0.3%) | 52 (0.6%) |
| Total | 14,767 (100.0%) | 8,719 (100.0%) |
Household Vehicle Usage in Petaluma
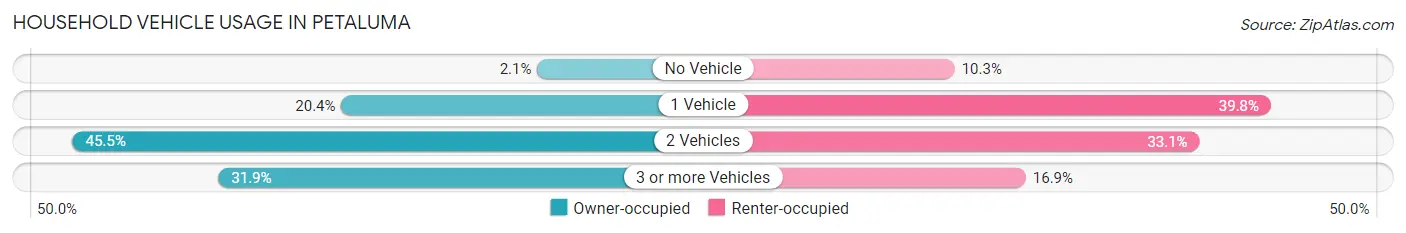
| Vehicles per Household | Owner-occupied | Renter-occupied |
| No Vehicle | 316 (2.1%) | 894 (10.2%) |
| 1 Vehicle | 3,017 (20.4%) | 3,467 (39.8%) |
| 2 Vehicles | 6,722 (45.5%) | 2,885 (33.1%) |
| 3 or more Vehicles | 4,712 (31.9%) | 1,473 (16.9%) |
| Total | 14,767 (100.0%) | 8,719 (100.0%) |
Real Estate & Mortgages in Petaluma
Real Estate and Mortgage Overview in Petaluma
| Characteristic | Without Mortgage | With Mortgage |
| Housing Units | 4,400 | 10,367 |
| Median Property Value | $748,800 | $826,900 |
| Median Household Income | $88,491 | $5,341 |
| Monthly Housing Costs | $767 | $5,185 |
| Real Estate Taxes | $4,006 | $151 |
Property Value by Mortgage Status in Petaluma
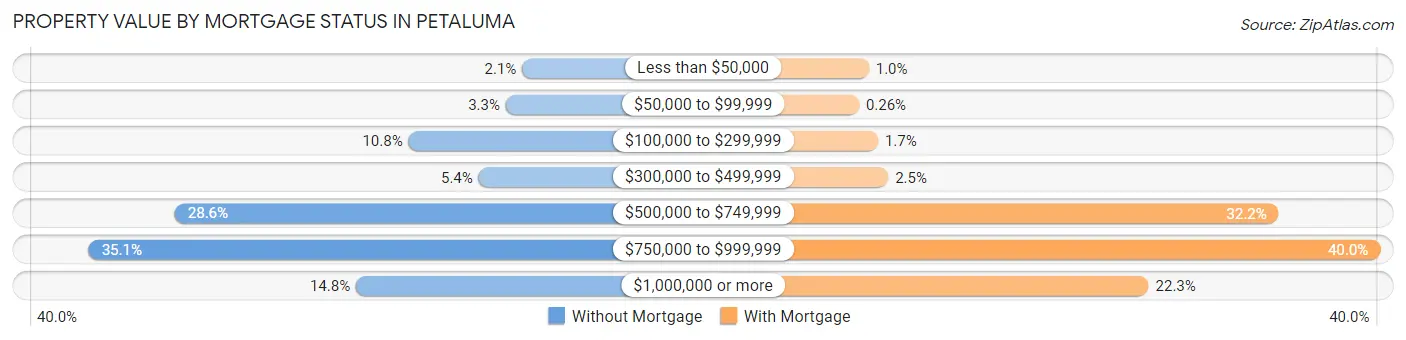
| Property Value | Without Mortgage | With Mortgage |
| Less than $50,000 | 92 (2.1%) | 105 (1.0%) |
| $50,000 to $99,999 | 147 (3.3%) | 27 (0.3%) |
| $100,000 to $299,999 | 473 (10.7%) | 177 (1.7%) |
| $300,000 to $499,999 | 238 (5.4%) | 258 (2.5%) |
| $500,000 to $749,999 | 1,256 (28.5%) | 3,341 (32.2%) |
| $750,000 to $999,999 | 1,545 (35.1%) | 4,144 (40.0%) |
| $1,000,000 or more | 649 (14.7%) | 2,315 (22.3%) |
| Total | 4,400 (100.0%) | 10,367 (100.0%) |
Household Income by Mortgage Status in Petaluma
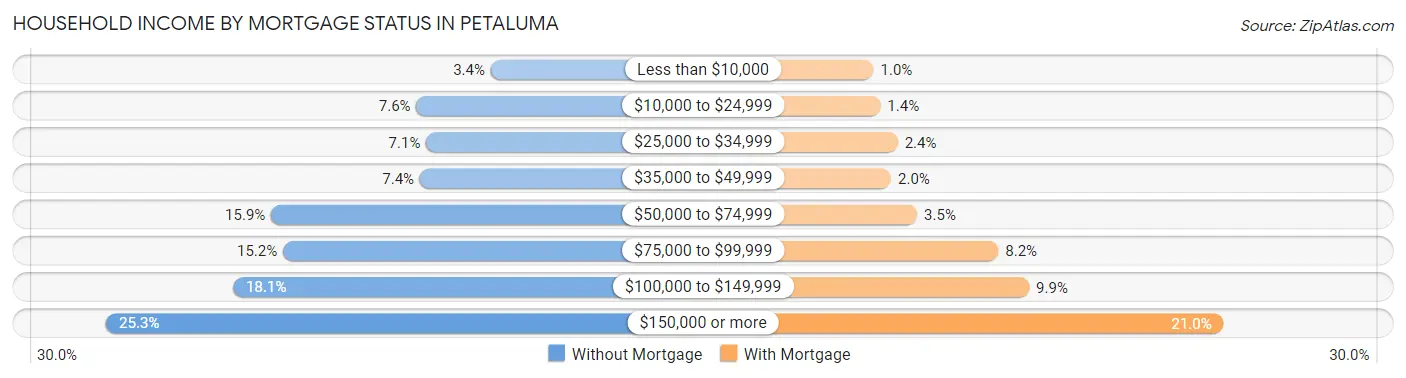
| Household Income | Without Mortgage | With Mortgage |
| Less than $10,000 | 148 (3.4%) | 107 (1.0%) |
| $10,000 to $24,999 | 335 (7.6%) | 147 (1.4%) |
| $25,000 to $34,999 | 310 (7.0%) | 250 (2.4%) |
| $35,000 to $49,999 | 326 (7.4%) | 210 (2.0%) |
| $50,000 to $74,999 | 700 (15.9%) | 365 (3.5%) |
| $75,000 to $99,999 | 670 (15.2%) | 846 (8.2%) |
| $100,000 to $149,999 | 796 (18.1%) | 1,028 (9.9%) |
| $150,000 or more | 1,115 (25.3%) | 2,180 (21.0%) |
| Total | 4,400 (100.0%) | 10,367 (100.0%) |
Property Value to Household Income Ratio in Petaluma
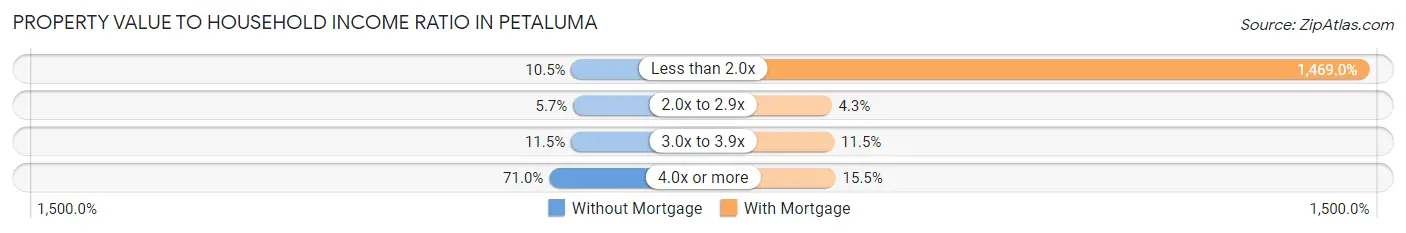
| Value-to-Income Ratio | Without Mortgage | With Mortgage |
| Less than 2.0x | 461 (10.5%) | 152,289 (1,469.0%) |
| 2.0x to 2.9x | 252 (5.7%) | 442 (4.3%) |
| 3.0x to 3.9x | 507 (11.5%) | 1,196 (11.5%) |
| 4.0x or more | 3,123 (71.0%) | 1,607 (15.5%) |
| Total | 4,400 (100.0%) | 10,367 (100.0%) |
Real Estate Taxes by Mortgage Status in Petaluma
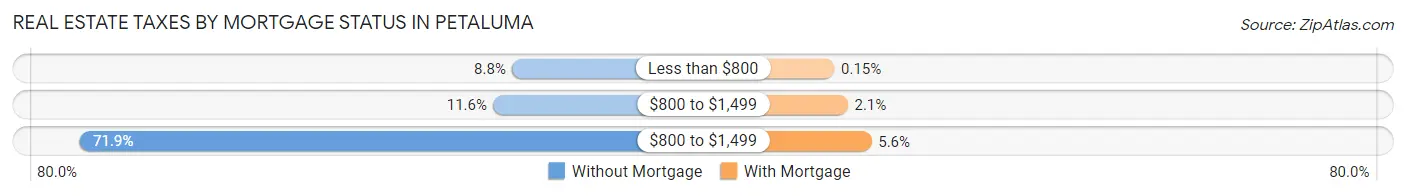
| Property Taxes | Without Mortgage | With Mortgage |
| Less than $800 | 388 (8.8%) | 16 (0.2%) |
| $800 to $1,499 | 510 (11.6%) | 220 (2.1%) |
| $800 to $1,499 | 3,163 (71.9%) | 579 (5.6%) |
| Total | 4,400 (100.0%) | 10,367 (100.0%) |
Health & Disability in Petaluma
Health Insurance Coverage by Age in Petaluma
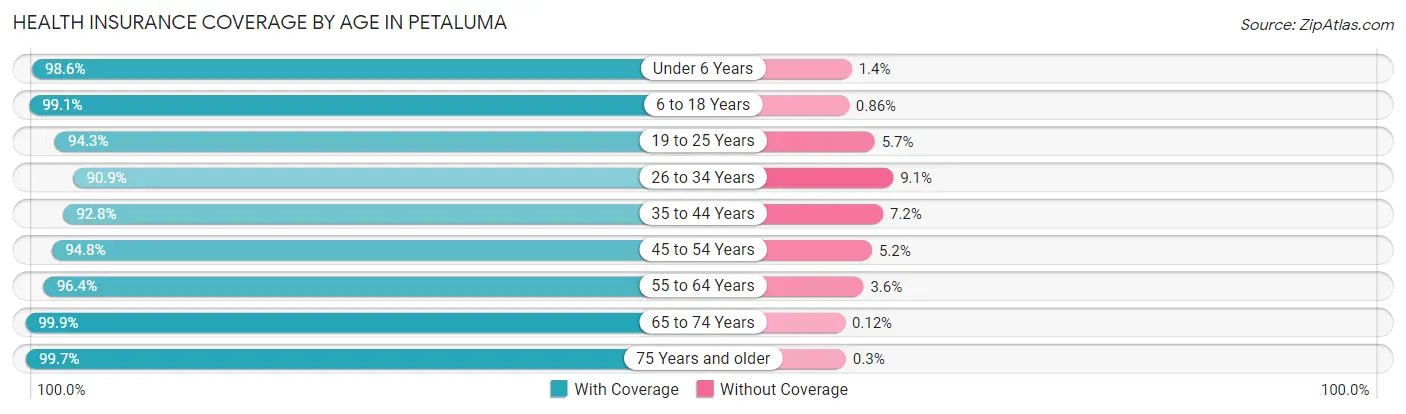
| Age Bracket | With Coverage | Without Coverage |
| Under 6 Years | 3,342 (98.6%) | 47 (1.4%) |
| 6 to 18 Years | 8,764 (99.1%) | 76 (0.9%) |
| 19 to 25 Years | 3,849 (94.3%) | 232 (5.7%) |
| 26 to 34 Years | 5,992 (90.9%) | 601 (9.1%) |
| 35 to 44 Years | 7,375 (92.8%) | 573 (7.2%) |
| 45 to 54 Years | 7,387 (94.8%) | 402 (5.2%) |
| 55 to 64 Years | 8,808 (96.4%) | 326 (3.6%) |
| 65 to 74 Years | 6,687 (99.9%) | 8 (0.1%) |
| 75 Years and older | 4,645 (99.7%) | 14 (0.3%) |
| Total | 56,849 (96.2%) | 2,279 (3.8%) |
Health Insurance Coverage by Citizenship Status in Petaluma
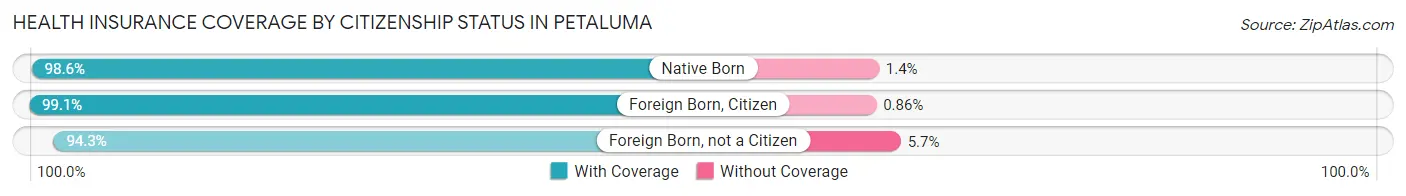
| Citizenship Status | With Coverage | Without Coverage |
| Native Born | 3,342 (98.6%) | 47 (1.4%) |
| Foreign Born, Citizen | 8,764 (99.1%) | 76 (0.9%) |
| Foreign Born, not a Citizen | 3,849 (94.3%) | 232 (5.7%) |
Health Insurance Coverage by Household Income in Petaluma
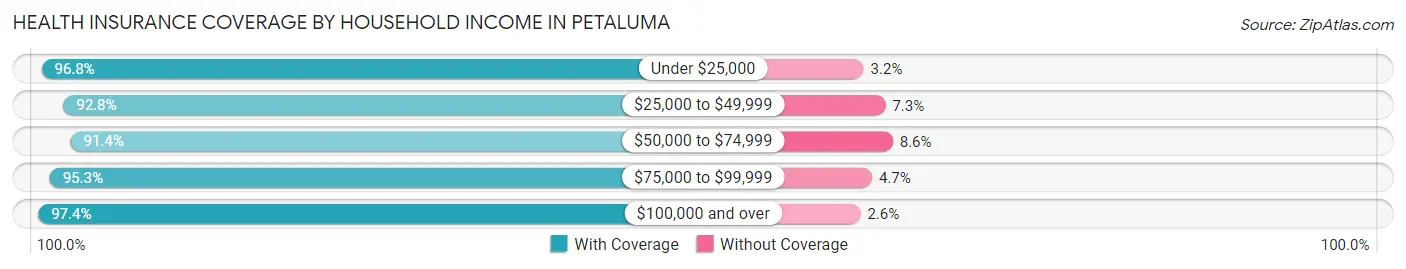
| Household Income | With Coverage | Without Coverage |
| Under $25,000 | 2,880 (96.8%) | 94 (3.2%) |
| $25,000 to $49,999 | 4,668 (92.7%) | 365 (7.2%) |
| $50,000 to $74,999 | 5,075 (91.4%) | 479 (8.6%) |
| $75,000 to $99,999 | 7,403 (95.3%) | 367 (4.7%) |
| $100,000 and over | 36,520 (97.4%) | 958 (2.6%) |
Public vs Private Health Insurance Coverage by Age in Petaluma
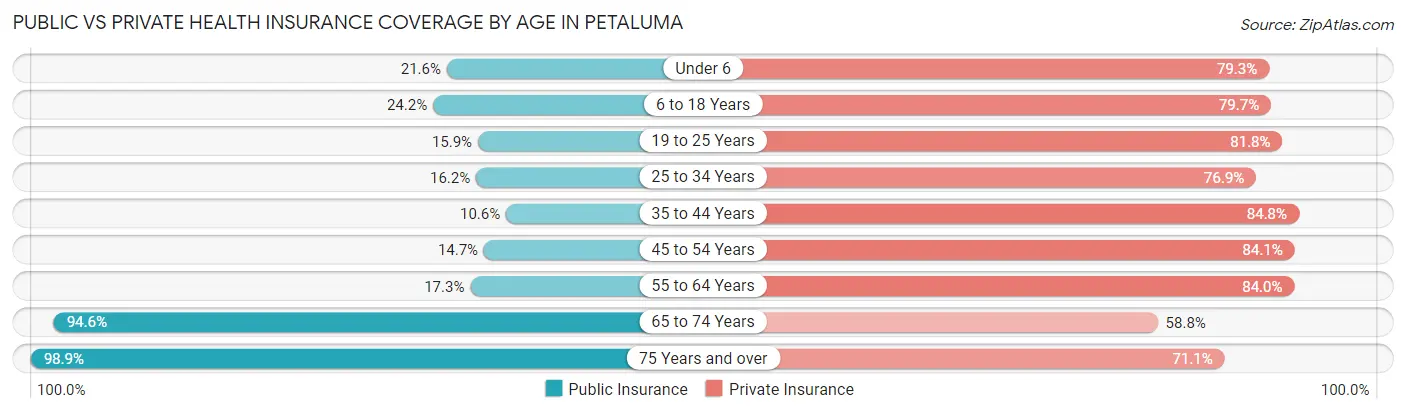
| Age Bracket | Public Insurance | Private Insurance |
| Under 6 | 733 (21.6%) | 2,687 (79.3%) |
| 6 to 18 Years | 2,139 (24.2%) | 7,042 (79.7%) |
| 19 to 25 Years | 647 (15.9%) | 3,337 (81.8%) |
| 25 to 34 Years | 1,069 (16.2%) | 5,071 (76.9%) |
| 35 to 44 Years | 845 (10.6%) | 6,742 (84.8%) |
| 45 to 54 Years | 1,148 (14.7%) | 6,547 (84.1%) |
| 55 to 64 Years | 1,578 (17.3%) | 7,671 (84.0%) |
| 65 to 74 Years | 6,333 (94.6%) | 3,937 (58.8%) |
| 75 Years and over | 4,606 (98.9%) | 3,310 (71.1%) |
| Total | 19,098 (32.3%) | 46,344 (78.4%) |
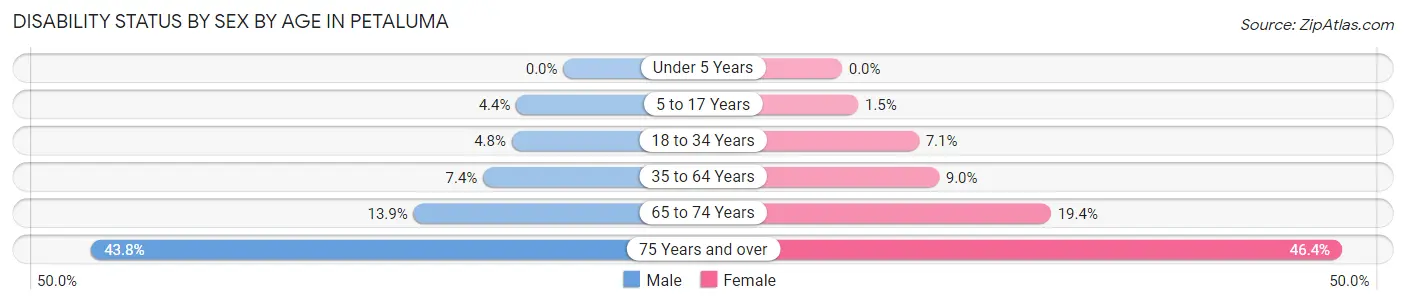
Disability Status by Sex by Age in Petaluma
| Age Bracket | Male | Female |
| Under 5 Years | 0 (0.0%) | 0 (0.0%) |
| 5 to 17 Years | 214 (4.4%) | 61 (1.5%) |
| 18 to 34 Years | 271 (4.8%) | 398 (7.1%) |
| 35 to 64 Years | 911 (7.4%) | 1,137 (9.0%) |
| 65 to 74 Years | 438 (13.9%) | 687 (19.4%) |
| 75 Years and over | 846 (43.8%) | 1,266 (46.4%) |
Disability Class by Sex by Age in Petaluma
Disability Class: Hearing Difficulty
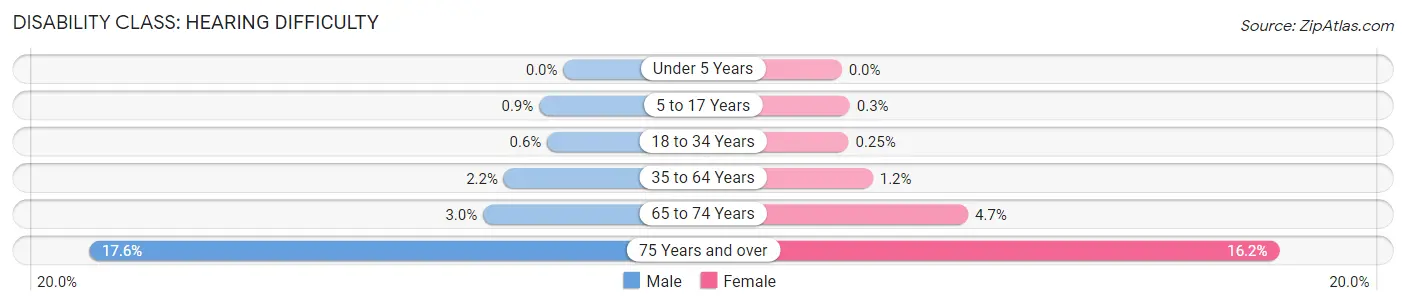
| Age Bracket | Male | Female |
| Under 5 Years | 0 (0.0%) | 0 (0.0%) |
| 5 to 17 Years | 44 (0.9%) | 12 (0.3%) |
| 18 to 34 Years | 34 (0.6%) | 14 (0.3%) |
| 35 to 64 Years | 271 (2.2%) | 145 (1.1%) |
| 65 to 74 Years | 94 (3.0%) | 166 (4.7%) |
| 75 Years and over | 340 (17.6%) | 443 (16.2%) |
Disability Class: Vision Difficulty
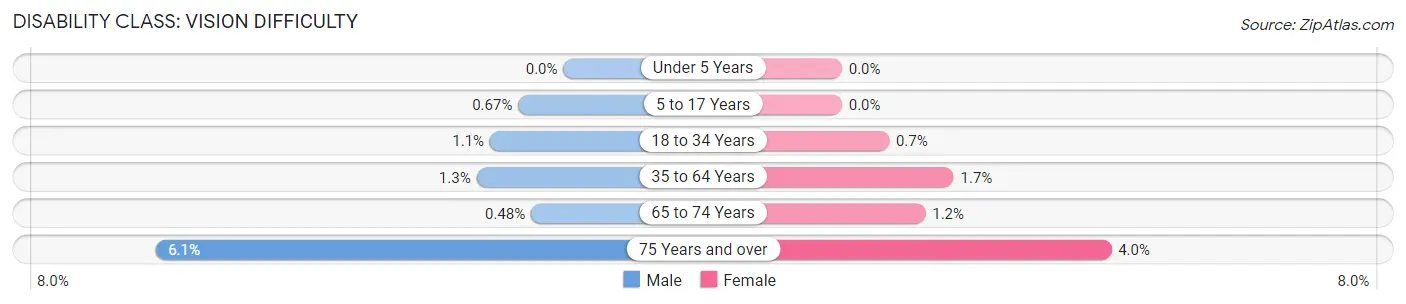
| Age Bracket | Male | Female |
| Under 5 Years | 0 (0.0%) | 0 (0.0%) |
| 5 to 17 Years | 33 (0.7%) | 0 (0.0%) |
| 18 to 34 Years | 62 (1.1%) | 39 (0.7%) |
| 35 to 64 Years | 158 (1.3%) | 210 (1.7%) |
| 65 to 74 Years | 15 (0.5%) | 44 (1.2%) |
| 75 Years and over | 117 (6.1%) | 109 (4.0%) |
Disability Class: Cognitive Difficulty
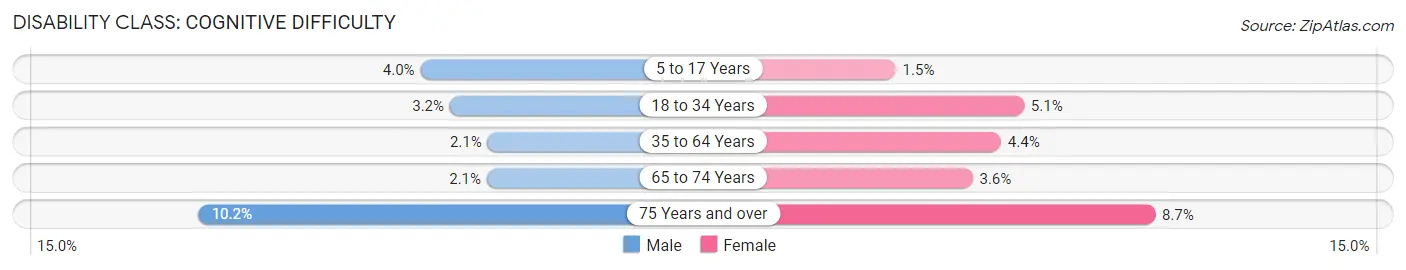
| Age Bracket | Male | Female |
| 5 to 17 Years | 195 (4.0%) | 61 (1.5%) |
| 18 to 34 Years | 179 (3.2%) | 283 (5.1%) |
| 35 to 64 Years | 258 (2.1%) | 560 (4.4%) |
| 65 to 74 Years | 67 (2.1%) | 129 (3.6%) |
| 75 Years and over | 196 (10.2%) | 238 (8.7%) |
Disability Class: Ambulatory Difficulty
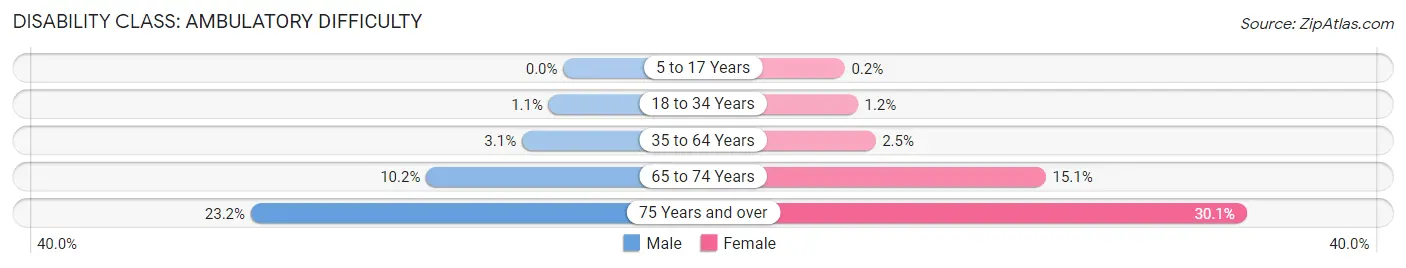
| Age Bracket | Male | Female |
| 5 to 17 Years | 0 (0.0%) | 8 (0.2%) |
| 18 to 34 Years | 61 (1.1%) | 65 (1.2%) |
| 35 to 64 Years | 376 (3.1%) | 313 (2.5%) |
| 65 to 74 Years | 321 (10.2%) | 536 (15.1%) |
| 75 Years and over | 448 (23.2%) | 820 (30.1%) |
Disability Class: Self-Care Difficulty
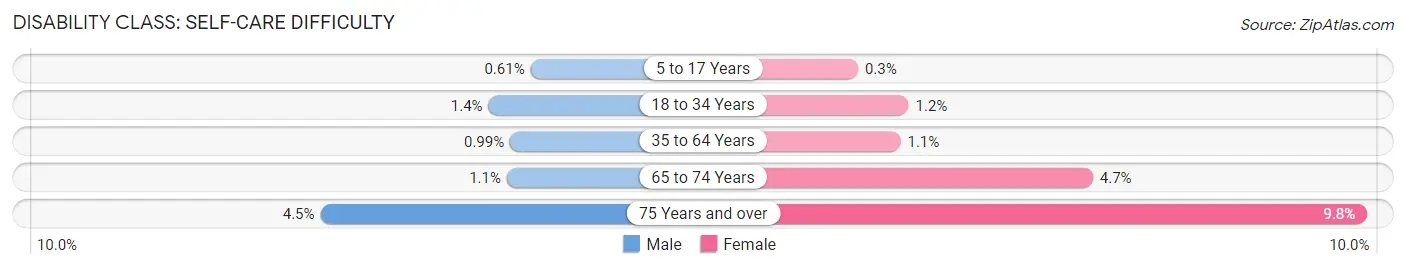
| Age Bracket | Male | Female |
| 5 to 17 Years | 30 (0.6%) | 12 (0.3%) |
| 18 to 34 Years | 79 (1.4%) | 69 (1.2%) |
| 35 to 64 Years | 121 (1.0%) | 138 (1.1%) |
| 65 to 74 Years | 33 (1.1%) | 165 (4.7%) |
| 75 Years and over | 87 (4.5%) | 266 (9.8%) |
Technology Access in Petaluma
Computing Device Access in Petaluma
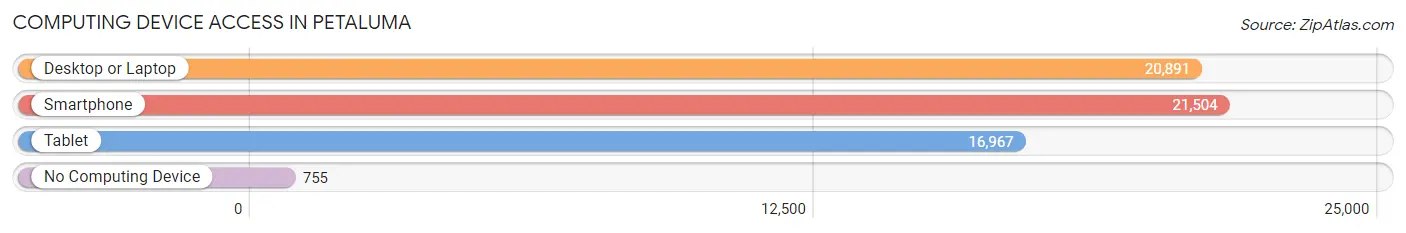
| Device Type | # Households | % Households |
| Desktop or Laptop | 20,891 | 88.9% |
| Smartphone | 21,504 | 91.6% |
| Tablet | 16,967 | 72.2% |
| No Computing Device | 755 | 3.2% |
| Total | 23,486 | 100.0% |
Internet Access in Petaluma
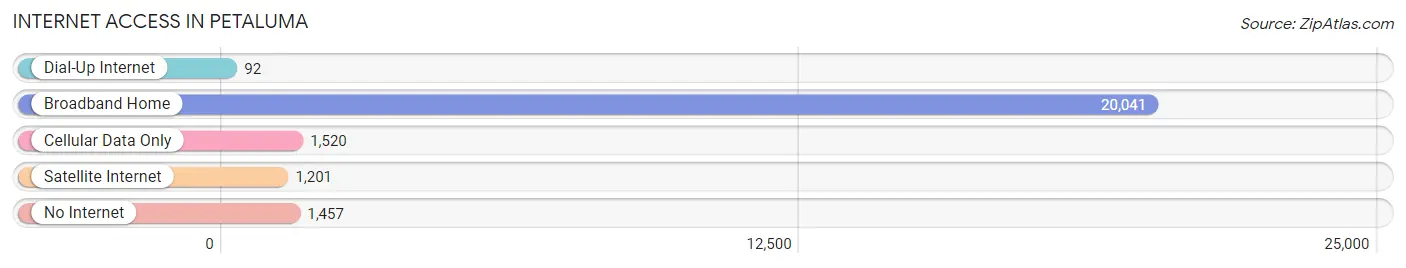
| Internet Type | # Households | % Households |
| Dial-Up Internet | 92 | 0.4% |
| Broadband Home | 20,041 | 85.3% |
| Cellular Data Only | 1,520 | 6.5% |
| Satellite Internet | 1,201 | 5.1% |
| No Internet | 1,457 | 6.2% |
| Total | 23,486 | 100.0% |
Petaluma Summary
Petaluma, California is a city located in Sonoma County, California, United States. It is situated in the northern part of the San Francisco Bay Area, approximately 40 miles north of San Francisco. The population of Petaluma was 57,941 at the 2010 census, making it the tenth largest city in the county.
History
The area around Petaluma was originally inhabited by the Coast Miwok Native American tribe. The first Europeans to settle in the area were the Spanish, who established a mission in the area in 1823. The town of Petaluma was founded in 1858 by the Petaluma Land and Water Company. The town was named after the Miwok word for “flat back”, referring to the flat-topped hills in the area.
In the late 19th century, Petaluma became a major center for the production of eggs and poultry. The city was known as the “Egg Basket of the World”, and the Petaluma Poultry Processing Company was the largest egg producer in the world. The city was also home to the first commercial hatchery in the United States.
Geography
Petaluma is located in the northern part of Sonoma County, approximately 40 miles north of San Francisco. The city is situated on the Petaluma River, which flows into San Pablo Bay. The city is surrounded by rolling hills and is located in the Petaluma Valley.
The climate in Petaluma is Mediterranean, with mild, wet winters and hot, dry summers. The average annual precipitation is approximately 22 inches.
Economy
Petaluma’s economy is largely based on agriculture and tourism. The city is home to several wineries and is a popular destination for wine tasting. The city is also home to several breweries, including Lagunitas Brewing Company and HenHouse Brewing Company.
The city is also home to several technology companies, including Autodesk, Inc., which is headquartered in Petaluma. The city is also home to several manufacturing companies, including Petaluma Poultry Processing Company and Petaluma Creamery.
Demographics
As of the 2010 census, the population of Petaluma was 57,941. The racial makeup of the city was 75.3% White, 1.3% African American, 0.7% Native American, 8.2% Asian, 0.2% Pacific Islander, 10.3% from other races, and 4.2% from two or more races. Hispanic or Latino of any race were 22.2% of the population.
The median income for a household in Petaluma was $63,837, and the median income for a family was $76,837. The per capita income for the city was $31,945. About 11.2% of families and 14.3% of the population were below the poverty line, including 19.2% of those under age 18 and 6.7% of those age 65 or over.
Common Questions
What is Per Capita Income in Petaluma?
Per Capita income in Petaluma is $56,290.
What is the Median Family Income in Petaluma?
Median Family Income in Petaluma is $138,468.
What is the Median Household income in Petaluma?
Median Household Income in Petaluma is $108,527.
What is Income or Wage Gap in Petaluma?
Income or Wage Gap in Petaluma is 21.0%.
Women in Petaluma earn 79.0 cents for every dollar earned by a man.
What is Family Income Deficit in Petaluma?
Family Income Deficit in Petaluma is $9,569.
Families that are below poverty line in Petaluma earn $9,569 less on average than the poverty threshold level.
What is Inequality or Gini Index in Petaluma?
Inequality or Gini Index in Petaluma is 0.43.
What is the Total Population of Petaluma?
Total Population of Petaluma is 59,682.
What is the Total Male Population of Petaluma?
Total Male Population of Petaluma is 29,625.
What is the Total Female Population of Petaluma?
Total Female Population of Petaluma is 30,057.
What is the Ratio of Males per 100 Females in Petaluma?
There are 98.56 Males per 100 Females in Petaluma.
What is the Ratio of Females per 100 Males in Petaluma?
There are 101.46 Females per 100 Males in Petaluma.
What is the Median Population Age in Petaluma?
Median Population Age in Petaluma is 43.5 Years.
What is the Average Family Size in Petaluma
Average Family Size in Petaluma is 3.0 People.
What is the Average Household Size in Petaluma
Average Household Size in Petaluma is 2.5 People.
How Large is the Labor Force in Petaluma?
There are 32,525 People in the Labor Forcein in Petaluma.
What is the Percentage of People in the Labor Force in Petaluma?
65.4% of People are in the Labor Force in Petaluma.
What is the Unemployment Rate in Petaluma?
Unemployment Rate in Petaluma is 4.7%.