Cities with the Lowest Percentage of Births to Unmarried Women over the Age of 35 in Connecticut

RELATED REPORTS & OPTIONS

Lowest Illegitimacy | Women 35+
Population
Families and Households
Female Fertility
Female Fertility (Unmarried)
Race (Community Size)
Race (Percentage)
Ancestry (Community Size)
AfghanAfricanAlaska NativeAlaskan AthabascanAlbanianAleutAlsatianAmericanApacheArabArapahoArgentineanArmenianAssyrian / Chaldean / SyriacAustralianAustrianBahamianBangladeshiBarbadianBasqueBelgianBelizeanBermudanBhutaneseBlackfeetBolivianBrazilianBritishBritish West IndianBulgarianBurmeseCajunCambodianCanadianCape VerdeanCarpatho RusynCelticCentral AmericanCentral American IndianCherokeeCheyenneChickasawChileanChineseChippewaChoctawColombianColvilleComancheCosta RicanCreeCreekCroatianCrowCubanCypriotCzechCzechoslovakianDanishDelawareDominicanDutchDutch West IndianEastern EuropeanEcuadorianEgyptianEnglishEstonianEthiopianEuropeanFijianFilipinoFinnishFrenchFrench American IndianFrench CanadianGermanGerman RussianGhanaianGreekGuamanian / ChamorroGuatemalanGuyaneseHaitianHmongHonduranHopiHoumaHungarianIcelanderIndian (Asian)IndonesianInupiatIranianIraqiIrishIroquoisIsraeliItalianJamaicanJapaneseJordanianKenyanKiowaKoreanLaotianLatvianLebaneseLiberianLithuanianLumbeeLuxembourgerMacedonianMalaysianMalteseMarshalleseMenomineeMexicanMexican American IndianMongolianMoroccanNative HawaiianNavajoNepaleseNew ZealanderNicaraguanNigerianNorthern EuropeanNorwegianOkinawanOsageOttawaPaiutePakistaniPalestinianPanamanianParaguayanPennsylvania GermanPeruvianPimaPolishPortuguesePotawatomiPuebloPuerto RicanPuget Sound SalishRomanianRussianSalvadoranSamoanScandinavianScotch-IrishScottishSeminoleSenegaleseSerbianShoshoneSierra LeoneanSiouxSlavicSlovakSloveneSomaliSouth AfricanSouth AmericanSouth American IndianSoviet UnionSpaniardSpanishSpanish AmericanSpanish American IndianSri LankanSubsaharan AfricanSudaneseSwedishSwissSyrianTaiwaneseThaiTlingit-HaidaTohono O'OdhamTonganTrinidadian and TobagonianTsimshianTurkishU.S. Virgin IslanderUgandanUkrainianUruguayanUteVenezuelanVietnameseWelshWest IndianYakamaYaquiYugoslavianYumanYup'ikZimbabwean
Ancestry (Percentage)
AfghanAfricanAlaska NativeAlaskan AthabascanAlbanianAleutAlsatianAmericanApacheArabArapahoArgentineanArmenianAssyrian / Chaldean / SyriacAustralianAustrianBahamianBangladeshiBarbadianBasqueBelgianBelizeanBermudanBhutaneseBlackfeetBolivianBrazilianBritishBritish West IndianBulgarianBurmeseCajunCambodianCanadianCape VerdeanCarpatho RusynCelticCentral AmericanCentral American IndianCherokeeCheyenneChickasawChileanChineseChippewaChoctawColombianColvilleComancheCosta RicanCreeCreekCroatianCrowCubanCypriotCzechCzechoslovakianDanishDelawareDominicanDutchDutch West IndianEastern EuropeanEcuadorianEgyptianEnglishEstonianEthiopianEuropeanFijianFilipinoFinnishFrenchFrench American IndianFrench CanadianGermanGerman RussianGhanaianGreekGuamanian / ChamorroGuatemalanGuyaneseHaitianHmongHonduranHopiHoumaHungarianIcelanderIndian (Asian)IndonesianInupiatIranianIraqiIrishIroquoisIsraeliItalianJamaicanJapaneseJordanianKenyanKiowaKoreanLaotianLatvianLebaneseLiberianLithuanianLumbeeLuxembourgerMacedonianMalaysianMalteseMarshalleseMenomineeMexicanMexican American IndianMongolianMoroccanNative HawaiianNavajoNepaleseNew ZealanderNicaraguanNigerianNorthern EuropeanNorwegianOkinawanOsageOttawaPaiutePakistaniPalestinianPanamanianParaguayanPennsylvania GermanPeruvianPimaPolishPortuguesePotawatomiPuebloPuerto RicanPuget Sound SalishRomanianRussianSalvadoranSamoanScandinavianScotch-IrishScottishSeminoleSenegaleseSerbianShoshoneSierra LeoneanSiouxSlavicSlovakSloveneSomaliSouth AfricanSouth AmericanSouth American IndianSoviet UnionSpaniardSpanishSpanish AmericanSpanish American IndianSri LankanSubsaharan AfricanSudaneseSwedishSwissSyrianTaiwaneseThaiTlingit-HaidaTohono O'OdhamTonganTrinidadian and TobagonianTsimshianTurkishU.S. Virgin IslanderUgandanUkrainianUruguayanUteVenezuelanVietnameseWelshWest IndianYakamaYaquiYugoslavianYumanYup'ikZimbabwean
Immigrant Origin (Total)
AfghanistanAfricaAlbaniaArgentinaArmeniaAsiaAustraliaAustriaAzoresBahamasBangladeshBarbadosBelarusBelgiumBelizeBoliviaBosnia and HerzegovinaBrazilBulgariaBurma / MyanmarCabo VerdeCambodiaCameroonCanadaCaribbeanCentral AmericaChileChinaColombiaCongoCosta RicaCroatiaCubaCzechoslovakiaDenmarkDominicaDominican RepublicEastern AfricaEastern AsiaEastern EuropeEcuadorEgyptEl SalvadorEnglandEritreaEthiopiaEuropeFijiFranceGermanyGhanaGreeceGrenadaGuatemalaGuyanaHaitiHondurasHong KongHungaryIndiaIndonesiaIranIraqIrelandIsraelItalyJamaicaJapanJordanKazakhstanKenyaKoreaKuwaitLaosLatin AmericaLatviaLebanonLiberiaLithuaniaMalaysiaMexicoMicronesiaMiddle AfricaMoldovaMoroccoNepalNetherlandsNicaraguaNigeriaNorth MacedoniaNorthern AfricaNorthern EuropeNorwayOceaniaPakistanPanamaPeruPhilippinesPolandPortugalRomaniaRussiaSaudi ArabiaScotlandSenegalSerbiaSierra LeoneSingaporeSomaliaSouth AfricaSouth AmericaSouth Central AsiaSouth Eastern AsiaSouthern EuropeSpainSri LankaSt. Vincent and the GrenadinesSudanSwedenSwitzerlandSyriaTaiwanThailandTrinidad and TobagoTurkeyUgandaUkraineUruguayUzbekistanVenezuelaVietnamWest IndiesWestern AfricaWestern AsiaWestern EuropeYemenZaireZimbabwe
Immigrant Origin (Percentage)
AfghanistanAfricaAlbaniaArgentinaArmeniaAsiaAustraliaAustriaAzoresBahamasBangladeshBarbadosBelarusBelgiumBelizeBoliviaBosnia and HerzegovinaBrazilBulgariaBurma / MyanmarCabo VerdeCambodiaCameroonCanadaCaribbeanCentral AmericaChileChinaColombiaCongoCosta RicaCroatiaCubaCzechoslovakiaDenmarkDominicaDominican RepublicEastern AfricaEastern AsiaEastern EuropeEcuadorEgyptEl SalvadorEnglandEritreaEthiopiaEuropeFijiFranceGermanyGhanaGreeceGrenadaGuatemalaGuyanaHaitiHondurasHong KongHungaryIndiaIndonesiaIranIraqIrelandIsraelItalyJamaicaJapanJordanKazakhstanKenyaKoreaKuwaitLaosLatin AmericaLatviaLebanonLiberiaLithuaniaMalaysiaMexicoMicronesiaMiddle AfricaMoldovaMoroccoNepalNetherlandsNicaraguaNigeriaNorth MacedoniaNorthern AfricaNorthern EuropeNorwayOceaniaPakistanPanamaPeruPhilippinesPolandPortugalRomaniaRussiaSaudi ArabiaScotlandSenegalSerbiaSierra LeoneSingaporeSomaliaSouth AfricaSouth AmericaSouth Central AsiaSouth Eastern AsiaSouthern EuropeSpainSri LankaSt. Vincent and the GrenadinesSudanSwedenSwitzerlandSyriaTaiwanThailandTrinidad and TobagoTurkeyUgandaUkraineUruguayUzbekistanVenezuelaVietnamWest IndiesWestern AfricaWestern AsiaWestern EuropeYemenZaireZimbabwe
Income
Income (Families)
Income (Households)
Poverty
Poverty (Families)
Unemployment
Employment Occupations
Employment Industries
Employer Class
Commute Time
Commute Means
School Enrollment
Education by Degree Field
Occupancy
Finances
Physical Characteristics
Connecticut
Compare Cities
Comparison Subject

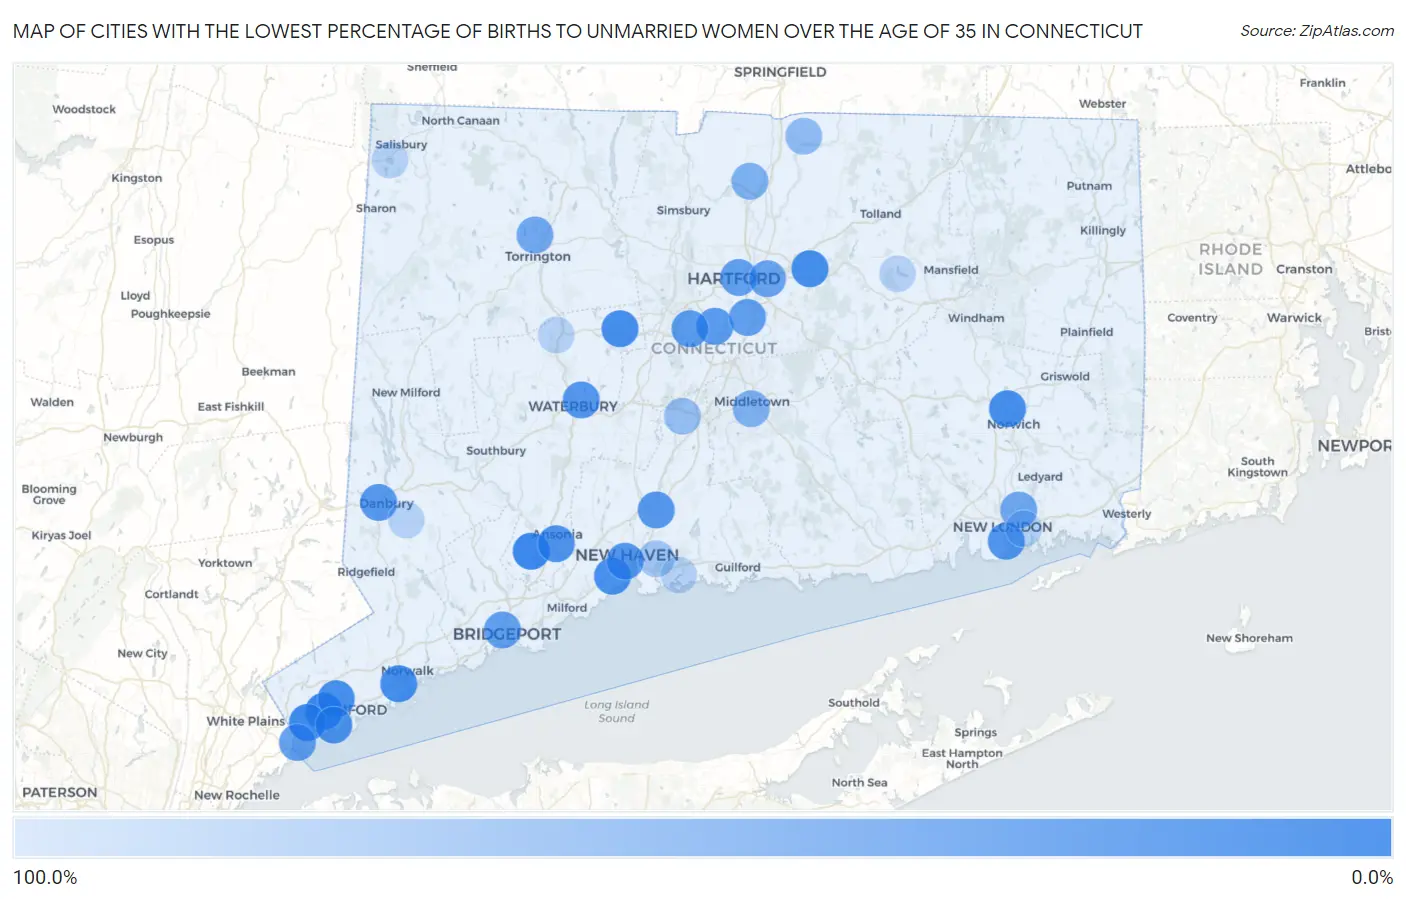
Map of Cities with the Lowest Percentage of Births to Unmarried Women over the Age of 35 in Connecticut

100.0%
0.0%
Cities with the Lowest Percentage of Births to Unmarried Women over the Age of 35 in Connecticut Map

Cities with the Lowest Percentage of Births to Unmarried Women over the Age of 35 in Connecticut

City % Unmarried vs State vs National
1.Cos Cob3.5%16.7%(-13.2)#120.1%(-16.6)#65
2.Shelton7.5%16.7%(-9.20)#220.1%(-12.6)#227
3.Greenwich9.5%16.7%(-7.20)#320.1%(-10.6)#324
4.Norwalk13.1%16.7%(-3.60)#420.1%(-7.00)#495
5.Manchester13.8%16.7%(-2.90)#520.1%(-6.30)#537
6.Stamford14.6%16.7%(-2.10)#620.1%(-5.50)#585
7.Norwich14.8%16.7%(-1.90)#720.1%(-5.30)#606
8.Bristol15.1%16.7%(-1.60)#820.1%(-5.00)#621
9.West Haven16.3%16.7%(-0.400)#920.1%(-3.80)#693
10.Derby20.6%16.7%(+3.90)#1020.1%(+0.500)#910
11.Old Greenwich21.8%16.7%(+5.10)#1120.1%(+1.70)#974
12.New London23.6%16.7%(+6.90)#1220.1%(+3.50)#1,054
13.New Haven26.6%16.7%(+9.90)#1320.1%(+6.50)#1,182
14.Waterbury26.6%16.7%(+9.90)#1420.1%(+6.50)#1,183
15.North Haven27.7%16.7%(+11.0)#1520.1%(+7.60)#1,234
16.Danbury28.2%16.7%(+11.5)#1620.1%(+8.10)#1,255
17.Newington28.5%16.7%(+11.8)#1720.1%(+8.40)#1,272
18.New Britain30.0%16.7%(+13.3)#1820.1%(+9.90)#1,336
19.Byram34.6%16.7%(+17.9)#1920.1%(+14.5)#1,545
20.Bridgeport35.0%16.7%(+18.3)#2020.1%(+14.9)#1,561
21.Hartford35.2%16.7%(+18.5)#2120.1%(+15.1)#1,573
22.Wethersfield35.7%16.7%(+19.0)#2220.1%(+15.6)#1,589
23.Naugatuck Borough39.2%16.7%(+22.5)#2320.1%(+19.1)#1,720
24.East Hartford40.3%16.7%(+23.6)#2420.1%(+20.2)#1,766
25.Conning Towers Nautilus Park45.8%16.7%(+29.1)#2520.1%(+25.7)#1,935
26.Torrington47.0%16.7%(+30.3)#2620.1%(+26.9)#1,958
27.Windsor Locks57.1%16.7%(+40.4)#2720.1%(+37.0)#2,228
28.Middletown60.5%16.7%(+43.8)#2820.1%(+40.4)#2,312
29.Hazardville71.4%16.7%(+54.7)#2920.1%(+51.3)#2,523
30.Meriden76.5%16.7%(+59.8)#3020.1%(+56.4)#2,587
31.Plattsville77.8%16.7%(+61.1)#3120.1%(+57.7)#2,605
32.East Haven86.2%16.7%(+69.5)#3220.1%(+66.1)#2,681
33.Bethel100.0%16.7%(+83.3)#3320.1%(+79.9)#2,877
34.Branford Center100.0%16.7%(+83.3)#3420.1%(+79.9)#3,045
35.Long Hill100.0%16.7%(+83.3)#3520.1%(+79.9)#3,151
36.Danielson Borough100.0%16.7%(+83.3)#3620.1%(+79.9)#3,180
37.Coventry Lake100.0%16.7%(+83.3)#3720.1%(+79.9)#3,401
38.Thomaston100.0%16.7%(+83.3)#3820.1%(+79.9)#3,430
39.Lakeville100.0%16.7%(+83.3)#3920.1%(+79.9)#3,756
40.Cornwall Bridge100.0%16.7%(+83.3)#4020.1%(+79.9)#4,103

Common Questions

What are the Top 10 Cities with the Lowest Percentage of Births to Unmarried Women over the Age of 35 in Connecticut?
Top 10 Cities with the Lowest Percentage of Births to Unmarried Women over the Age of 35 in Connecticut are:
What city has the Lowest Percentage of Births to Unmarried Women over the Age of 35 in Connecticut?
Cos Cob has the Lowest Percentage of Births to Unmarried Women over the Age of 35 in Connecticut with 3.5%.
What is the Percentage of Births to Unmarried Women over the Age of 35 in the State of Connecticut?
Percentage of Births to Unmarried Women over the Age of 35 in Connecticut is 16.7%.
What is the Percentage of Births to Unmarried Women over the Age of 35 in the United States?
Percentage of Births to Unmarried Women over the Age of 35 in the United States is 20.1%.