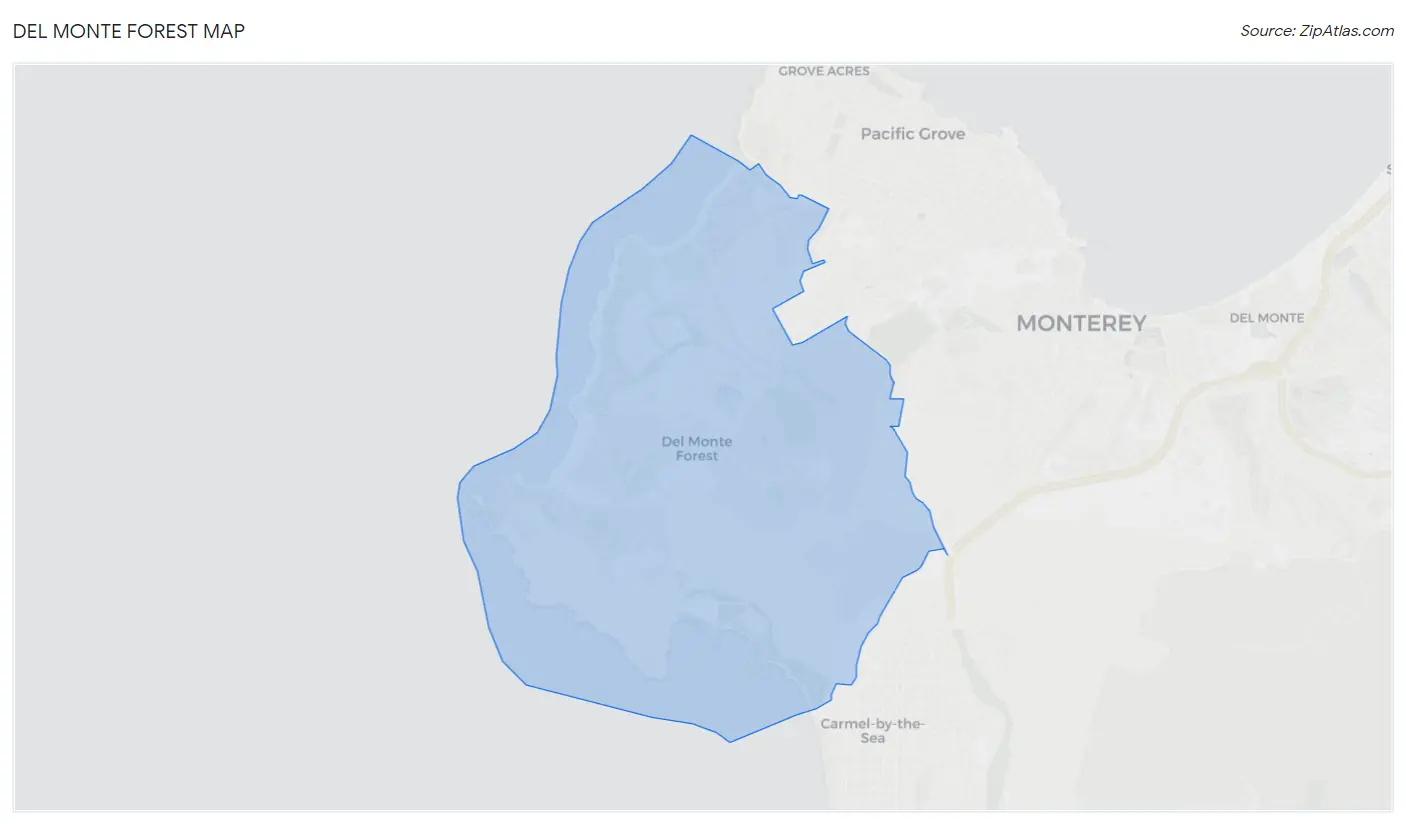
Del Monte Forest, CA Map & Demographics
Del Monte Forest Map
Del Monte Forest Overview
$119,263
PER CAPITA INCOME
$161,583
AVG FAMILY INCOME
$145,250
AVG HOUSEHOLD INCOME
11.8%
WAGE / INCOME GAP [ % ]
88.2¢/ $1
WAGE / INCOME GAP [ $ ]
0.55
INEQUALITY / GINI INDEX
3,416
TOTAL POPULATION
1,648
MALE POPULATION
1,768
FEMALE POPULATION
93.21
MALES / 100 FEMALES
107.28
FEMALES / 100 MALES
61.8
MEDIAN AGE
2.5
AVG FAMILY SIZE
2.0
AVG HOUSEHOLD SIZE
1,212
LABOR FORCE [ PEOPLE ]
40.6%
PERCENT IN LABOR FORCE
5.1%
UNEMPLOYMENT RATE
Income in Del Monte Forest
Income Overview in Del Monte Forest
Per Capita Income in Del Monte Forest is $119,263, while median incomes of families and households are $161,583 and $145,250 respectively.
| Characteristic | Number | Measure |
| Per Capita Income | 3,416 | $119,263 |
| Median Family Income | 981 | $161,583 |
| Mean Family Income | 981 | $289,324 |
| Median Household Income | 1,582 | $145,250 |
| Mean Household Income | 1,582 | $257,207 |
| Income Deficit | 981 | $0 |
| Wage / Income Gap (%) | 3,416 | 11.78% |
| Wage / Income Gap ($) | 3,416 | 88.22¢ per $1 |
| Gini / Inequality Index | 3,416 | 0.55 |
Earnings by Sex in Del Monte Forest
Average Earnings in Del Monte Forest are $57,850, $57,344 for men and $65,000 for women, a difference of 11.8%.
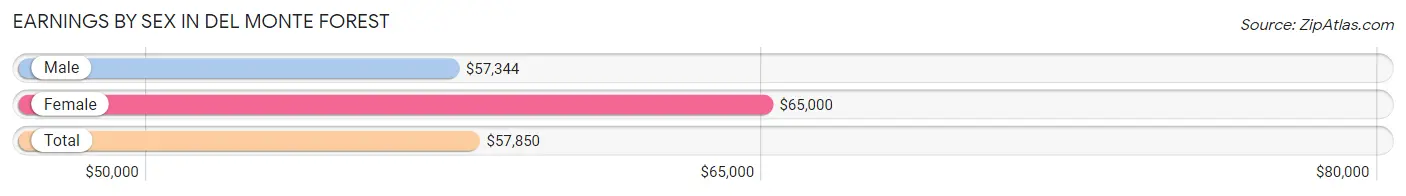
| Sex | Number | Average Earnings |
| Male | 789 (53.1%) | $57,344 |
| Female | 698 (46.9%) | $65,000 |
| Total | 1,487 (100.0%) | $57,850 |
Earnings by Sex by Income Bracket in Del Monte Forest
The most common earnings brackets in Del Monte Forest are $100,000+ for men (335 | 42.5%) and $100,000+ for women (272 | 39.0%).
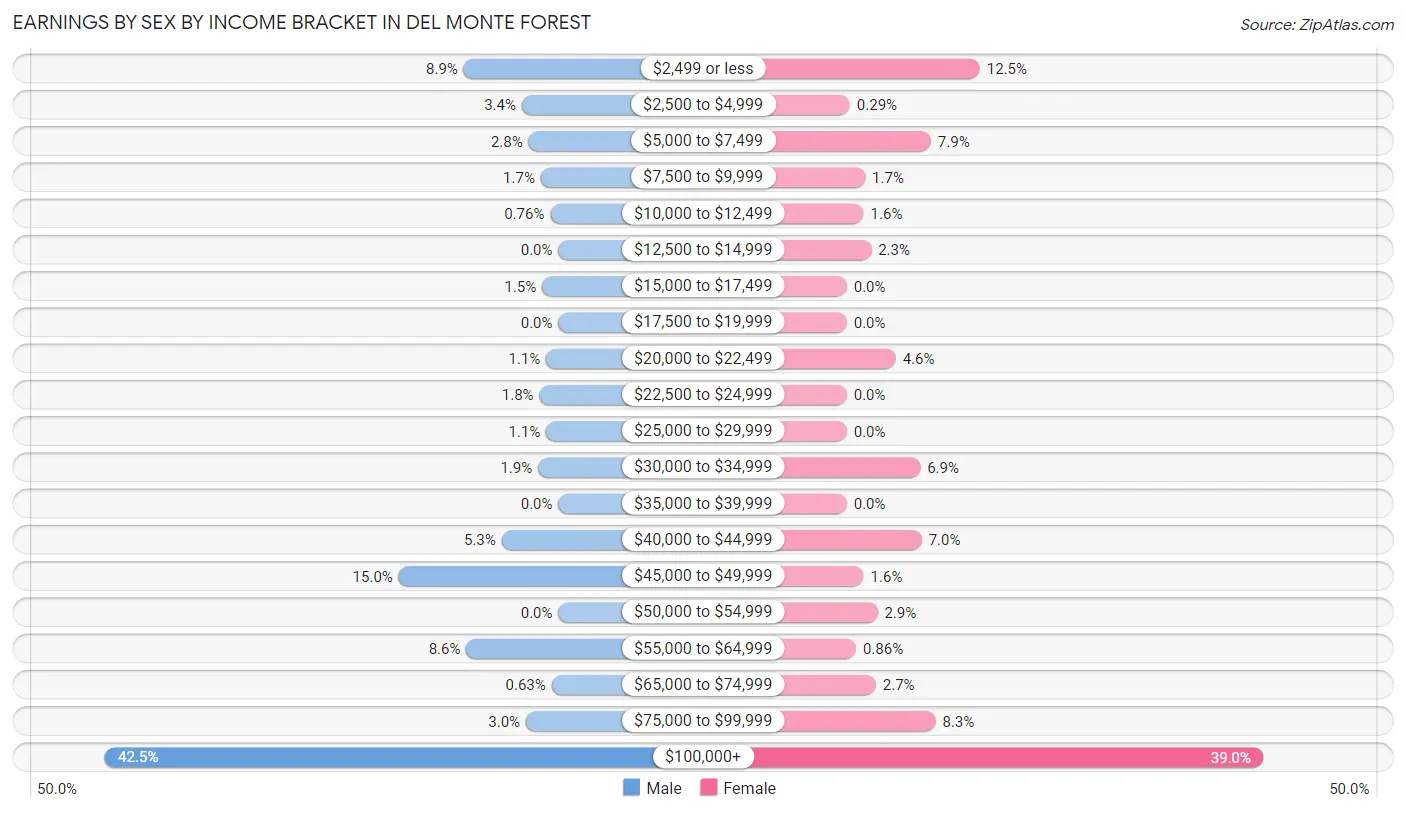
| Income | Male | Female |
| $2,499 or less | 70 (8.9%) | 87 (12.5%) |
| $2,500 to $4,999 | 27 (3.4%) | 2 (0.3%) |
| $5,000 to $7,499 | 22 (2.8%) | 55 (7.9%) |
| $7,500 to $9,999 | 13 (1.7%) | 12 (1.7%) |
| $10,000 to $12,499 | 6 (0.8%) | 11 (1.6%) |
| $12,500 to $14,999 | 0 (0.0%) | 16 (2.3%) |
| $15,000 to $17,499 | 12 (1.5%) | 0 (0.0%) |
| $17,500 to $19,999 | 0 (0.0%) | 0 (0.0%) |
| $20,000 to $22,499 | 9 (1.1%) | 32 (4.6%) |
| $22,500 to $24,999 | 14 (1.8%) | 0 (0.0%) |
| $25,000 to $29,999 | 9 (1.1%) | 0 (0.0%) |
| $30,000 to $34,999 | 15 (1.9%) | 48 (6.9%) |
| $35,000 to $39,999 | 0 (0.0%) | 0 (0.0%) |
| $40,000 to $44,999 | 42 (5.3%) | 49 (7.0%) |
| $45,000 to $49,999 | 118 (15.0%) | 11 (1.6%) |
| $50,000 to $54,999 | 0 (0.0%) | 20 (2.9%) |
| $55,000 to $64,999 | 68 (8.6%) | 6 (0.9%) |
| $65,000 to $74,999 | 5 (0.6%) | 19 (2.7%) |
| $75,000 to $99,999 | 24 (3.0%) | 58 (8.3%) |
| $100,000+ | 335 (42.5%) | 272 (39.0%) |
| Total | 789 (100.0%) | 698 (100.0%) |
Earnings by Sex by Educational Attainment in Del Monte Forest
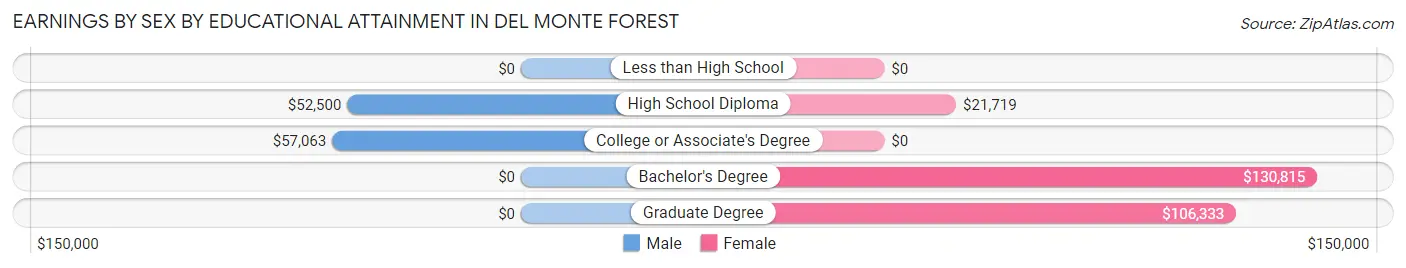
| Educational Attainment | Male Income | Female Income |
| Less than High School | - | - |
| High School Diploma | $52,500 | $21,719 |
| College or Associate's Degree | $57,063 | $0 |
| Bachelor's Degree | - | - |
| Graduate Degree | - | - |
| Total | - | - |
Family Income in Del Monte Forest
Family Income Brackets in Del Monte Forest
According to the Del Monte Forest family income data, there are 433 families falling into the $200,000+ income range, which is the most common income bracket and makes up 44.1% of all families.
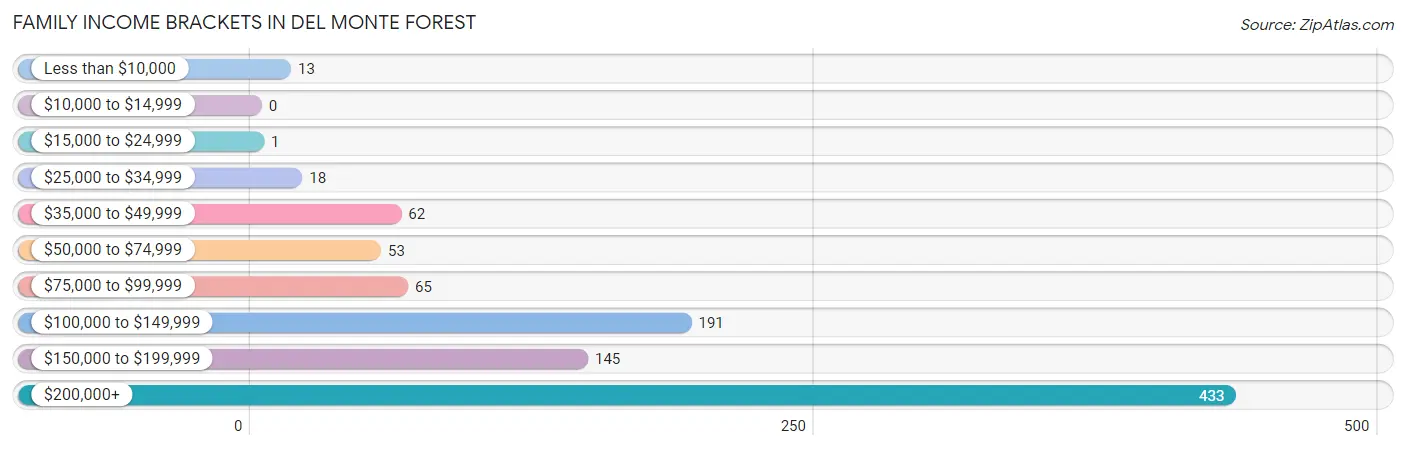
| Income Bracket | # Families | % Families |
| Less than $10,000 | 13 | 1.3% |
| $10,000 to $14,999 | 0 | 0.0% |
| $15,000 to $24,999 | 1 | 0.1% |
| $25,000 to $34,999 | 18 | 1.8% |
| $35,000 to $49,999 | 62 | 6.3% |
| $50,000 to $74,999 | 53 | 5.4% |
| $75,000 to $99,999 | 65 | 6.6% |
| $100,000 to $149,999 | 191 | 19.5% |
| $150,000 to $199,999 | 145 | 14.8% |
| $200,000+ | 433 | 44.1% |
Family Income by Famaliy Size in Del Monte Forest
3-person families (37 | 3.8%) account for the highest median family income in Del Monte Forest with $250,001 per family, while 3-person families (37 | 3.8%) have the highest median income of $83,334 per family member.
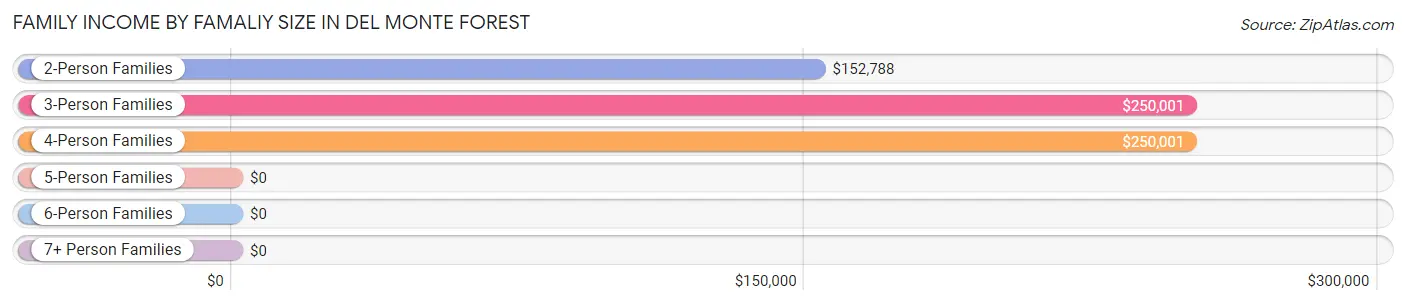
| Income Bracket | # Families | Median Income |
| 2-Person Families | 724 (73.8%) | $152,788 |
| 3-Person Families | 37 (3.8%) | $250,001 |
| 4-Person Families | 193 (19.7%) | $250,001 |
| 5-Person Families | 17 (1.7%) | $0 |
| 6-Person Families | 10 (1.0%) | $0 |
| 7+ Person Families | 0 (0.0%) | $0 |
| Total | 981 (100.0%) | $161,583 |
Family Income by Number of Earners in Del Monte Forest
The median family income in Del Monte Forest is $161,583, with families comprising 2 earners (288) having the highest median family income of $250,001, while families with no earners (324) have the lowest median family income of $138,125, accounting for 29.4% and 33.0% of families, respectively.
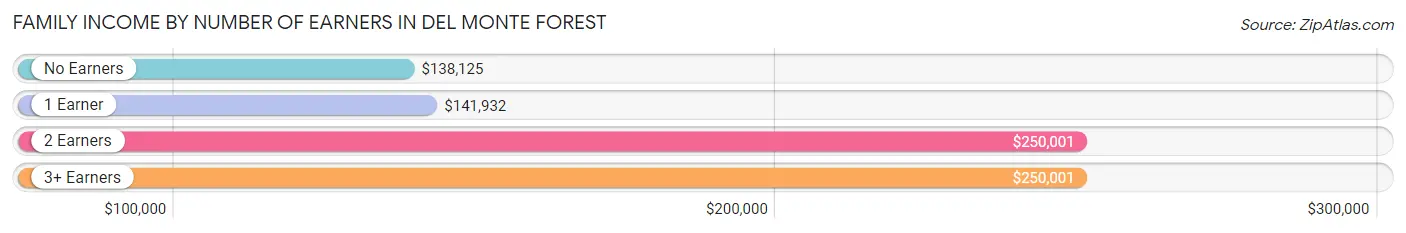
| Number of Earners | # Families | Median Income |
| No Earners | 324 (33.0%) | $138,125 |
| 1 Earner | 309 (31.5%) | $141,932 |
| 2 Earners | 288 (29.4%) | $250,001 |
| 3+ Earners | 60 (6.1%) | $250,001 |
| Total | 981 (100.0%) | $161,583 |
Household Income in Del Monte Forest
Household Income Brackets in Del Monte Forest
With 566 households falling in the category, the $200,000+ income range is the most frequent in Del Monte Forest, accounting for 35.8% of all households.
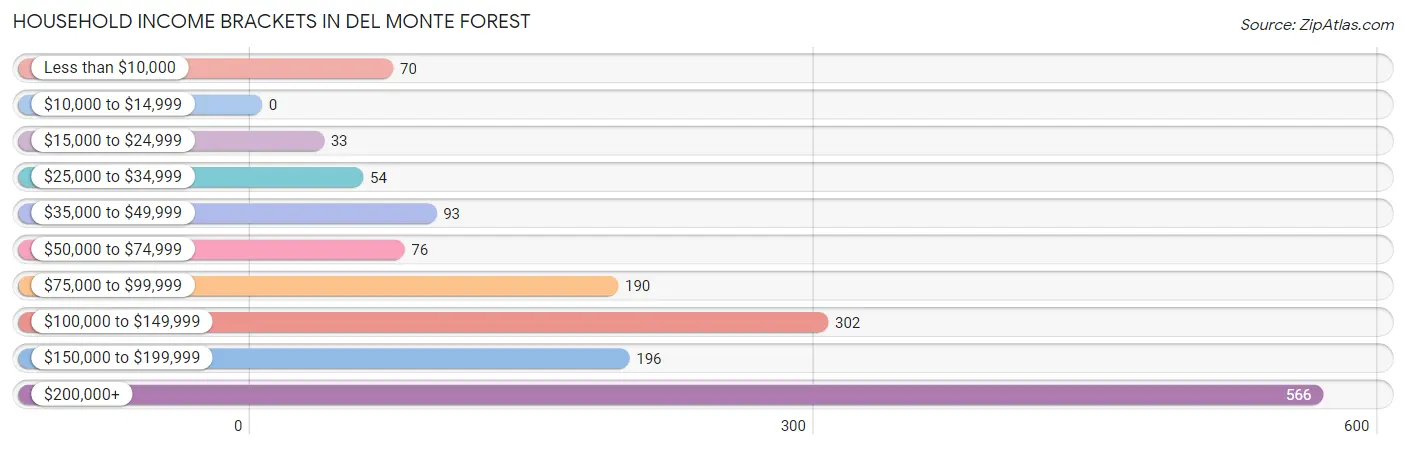
| Income Bracket | # Households | % Households |
| Less than $10,000 | 70 | 4.4% |
| $10,000 to $14,999 | 0 | 0.0% |
| $15,000 to $24,999 | 33 | 2.1% |
| $25,000 to $34,999 | 54 | 3.4% |
| $35,000 to $49,999 | 93 | 5.9% |
| $50,000 to $74,999 | 76 | 4.8% |
| $75,000 to $99,999 | 190 | 12.0% |
| $100,000 to $149,999 | 302 | 19.1% |
| $150,000 to $199,999 | 196 | 12.4% |
| $200,000+ | 566 | 35.8% |
Household Income by Householder Age in Del Monte Forest
The median household income in Del Monte Forest is $145,250, with the highest median household income of $212,434 found in the 25 to 44 years age bracket for the primary householder. A total of 211 households (13.3%) fall into this category.
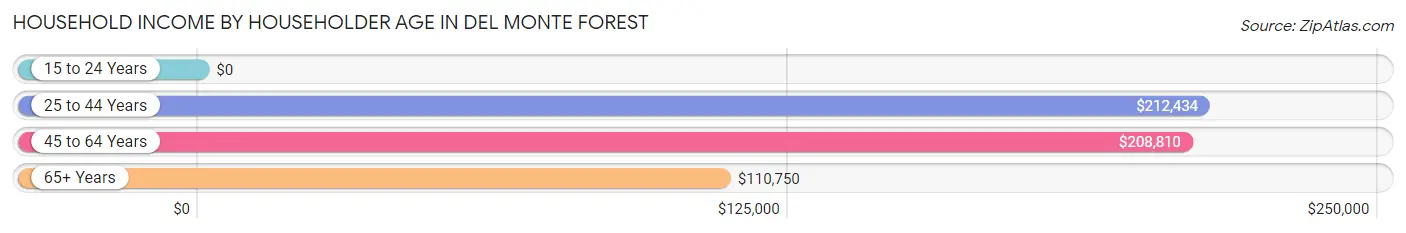
| Income Bracket | # Households | Median Income |
| 15 to 24 Years | 0 (0.0%) | $0 |
| 25 to 44 Years | 211 (13.3%) | $212,434 |
| 45 to 64 Years | 348 (22.0%) | $208,810 |
| 65+ Years | 1,023 (64.7%) | $110,750 |
| Total | 1,582 (100.0%) | $145,250 |
Poverty in Del Monte Forest
Income Below Poverty by Sex and Age in Del Monte Forest
With 1.4% poverty level for males and 6.0% for females among the residents of Del Monte Forest, 55 to 64 year old males and 18 to 24 year old females are the most vulnerable to poverty, with 21 males (10.0%) and 12 females (26.1%) in their respective age groups living below the poverty level.
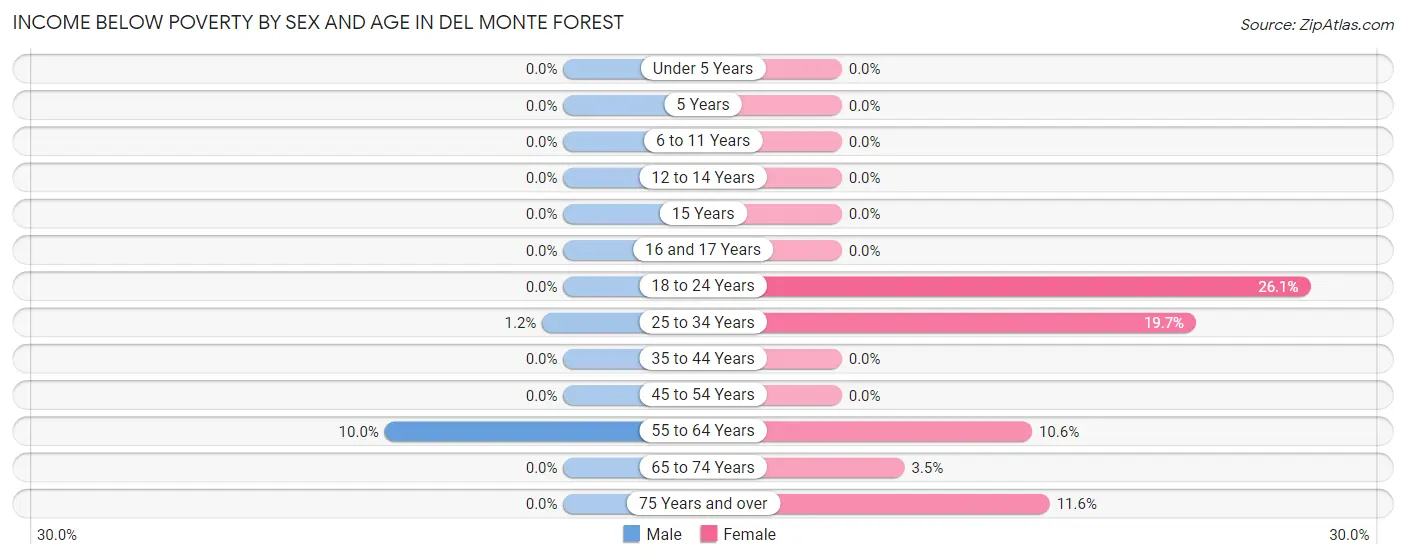
| Age Bracket | Male | Female |
| Under 5 Years | 0 (0.0%) | 0 (0.0%) |
| 5 Years | 0 (0.0%) | 0 (0.0%) |
| 6 to 11 Years | 0 (0.0%) | 0 (0.0%) |
| 12 to 14 Years | 0 (0.0%) | 0 (0.0%) |
| 15 Years | 0 (0.0%) | 0 (0.0%) |
| 16 and 17 Years | 0 (0.0%) | 0 (0.0%) |
| 18 to 24 Years | 0 (0.0%) | 12 (26.1%) |
| 25 to 34 Years | 1 (1.2%) | 14 (19.7%) |
| 35 to 44 Years | 0 (0.0%) | 0 (0.0%) |
| 45 to 54 Years | 0 (0.0%) | 0 (0.0%) |
| 55 to 64 Years | 21 (10.0%) | 18 (10.6%) |
| 65 to 74 Years | 0 (0.0%) | 16 (3.5%) |
| 75 Years and over | 0 (0.0%) | 41 (11.6%) |
| Total | 22 (1.4%) | 101 (6.0%) |
Income Above Poverty by Sex and Age in Del Monte Forest
According to the poverty statistics in Del Monte Forest, males aged under 5 years and females aged under 5 years are the age groups that are most secure financially, with 100.0% of males and 100.0% of females in these age groups living above the poverty line.
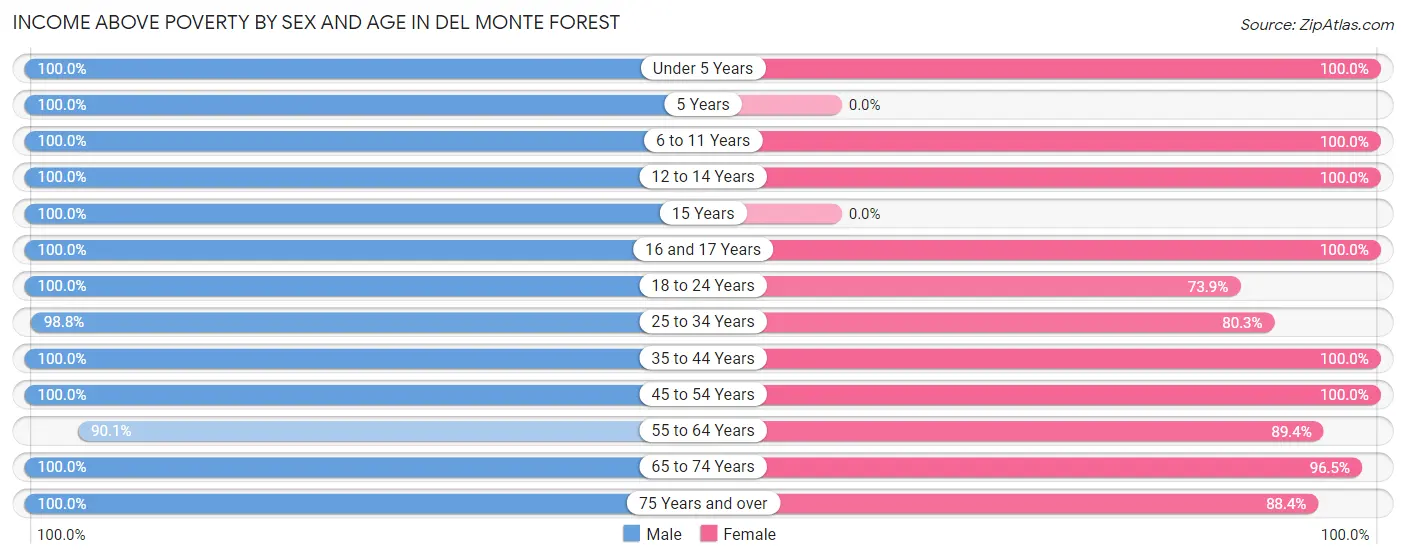
| Age Bracket | Male | Female |
| Under 5 Years | 36 (100.0%) | 87 (100.0%) |
| 5 Years | 11 (100.0%) | 0 (0.0%) |
| 6 to 11 Years | 85 (100.0%) | 40 (100.0%) |
| 12 to 14 Years | 48 (100.0%) | 70 (100.0%) |
| 15 Years | 28 (100.0%) | 0 (0.0%) |
| 16 and 17 Years | 10 (100.0%) | 42 (100.0%) |
| 18 to 24 Years | 26 (100.0%) | 34 (73.9%) |
| 25 to 34 Years | 84 (98.8%) | 57 (80.3%) |
| 35 to 44 Years | 111 (100.0%) | 200 (100.0%) |
| 45 to 54 Years | 134 (100.0%) | 142 (100.0%) |
| 55 to 64 Years | 190 (90.0%) | 152 (89.4%) |
| 65 to 74 Years | 346 (100.0%) | 442 (96.5%) |
| 75 Years and over | 429 (100.0%) | 313 (88.4%) |
| Total | 1,538 (98.6%) | 1,579 (94.0%) |
Income Below Poverty Among Married-Couple Families in Del Monte Forest
The poverty statistics for married-couple families in Del Monte Forest show that 0.6% or 5 of the total 886 families live below the poverty line. Families with no children have the highest poverty rate of 0.7%, comprising of 5 families. On the other hand, families with 1 or 2 children have the lowest poverty rate of 0.0%, which includes 0 families.
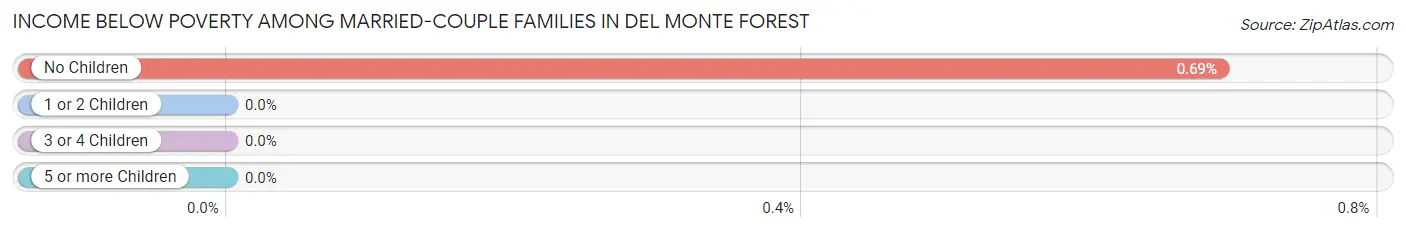
| Children | Above Poverty | Below Poverty |
| No Children | 720 (99.3%) | 5 (0.7%) |
| 1 or 2 Children | 144 (100.0%) | 0 (0.0%) |
| 3 or 4 Children | 17 (100.0%) | 0 (0.0%) |
| 5 or more Children | 0 (0.0%) | 0 (0.0%) |
| Total | 881 (99.4%) | 5 (0.6%) |
Income Below Poverty Among Single-Parent Households in Del Monte Forest
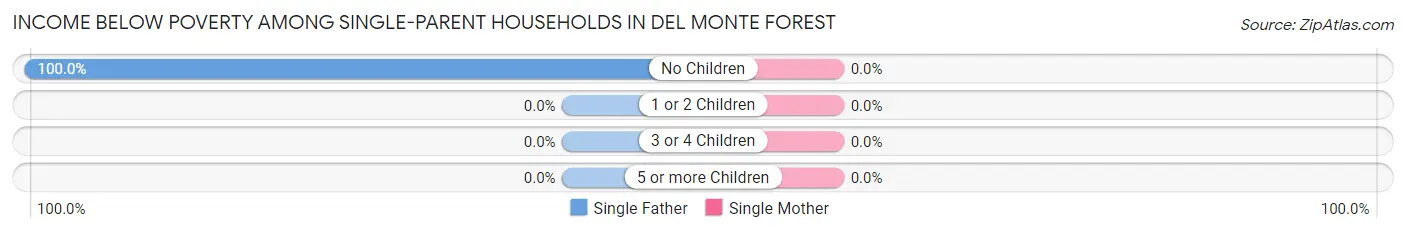
| Children | Single Father | Single Mother |
| No Children | 9 (100.0%) | 0 (0.0%) |
| 1 or 2 Children | 0 (0.0%) | 0 (0.0%) |
| 3 or 4 Children | 0 (0.0%) | 0 (0.0%) |
| 5 or more Children | 0 (0.0%) | 0 (0.0%) |
| Total | 9 (24.3%) | 0 (0.0%) |
Income Below Poverty Among Married-Couple vs Single-Parent Households in Del Monte Forest
The poverty data for Del Monte Forest shows that 5 of the married-couple family households (0.6%) and 9 of the single-parent households (9.5%) are living below the poverty level. Within the married-couple family households, those with no children have the highest poverty rate, with 5 households (0.7%) falling below the poverty line. Among the single-parent households, those with no children have the highest poverty rate, with 9 household (25.7%) living below poverty.
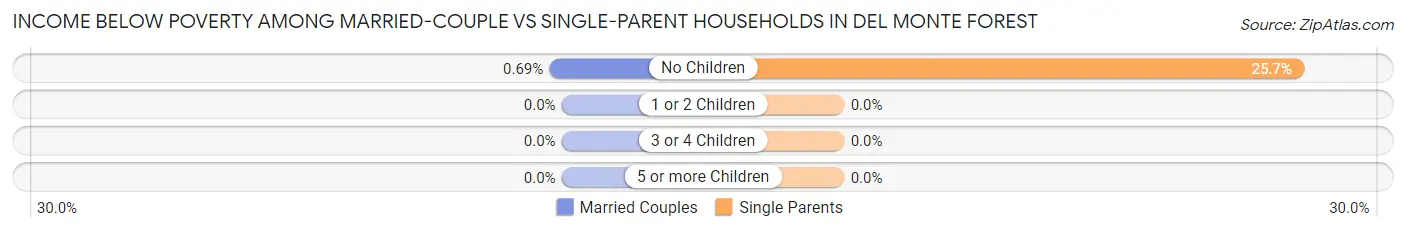
| Children | Married-Couple Families | Single-Parent Households |
| No Children | 5 (0.7%) | 9 (25.7%) |
| 1 or 2 Children | 0 (0.0%) | 0 (0.0%) |
| 3 or 4 Children | 0 (0.0%) | 0 (0.0%) |
| 5 or more Children | 0 (0.0%) | 0 (0.0%) |
| Total | 5 (0.6%) | 9 (9.5%) |
Race in Del Monte Forest
The most populous races in Del Monte Forest are White / Caucasian (2,897 | 84.8%), Asian (303 | 8.9%), and Hispanic or Latino (182 | 5.3%).
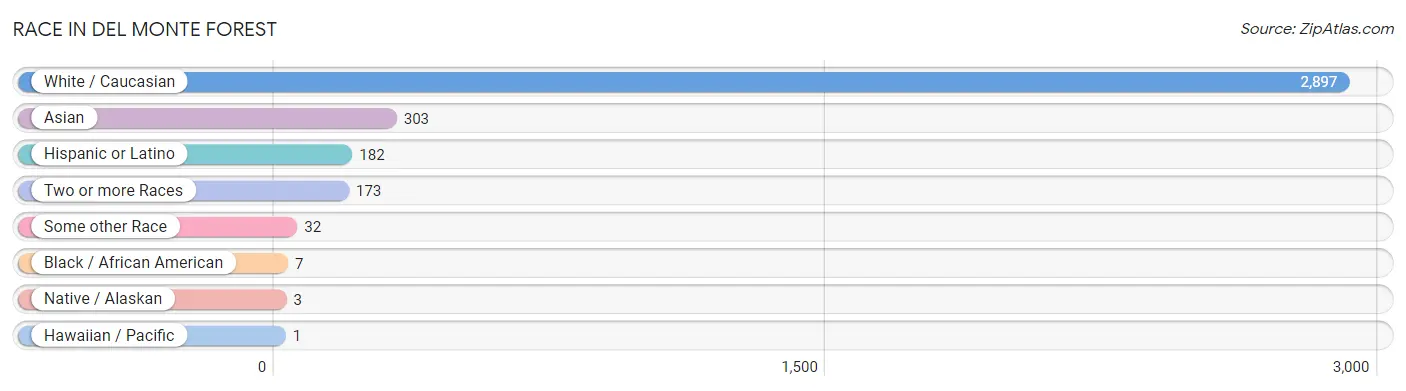
| Race | # Population | % Population |
| Asian | 303 | 8.9% |
| Black / African American | 7 | 0.2% |
| Hawaiian / Pacific | 1 | 0.0% |
| Hispanic or Latino | 182 | 5.3% |
| Native / Alaskan | 3 | 0.1% |
| White / Caucasian | 2,897 | 84.8% |
| Two or more Races | 173 | 5.1% |
| Some other Race | 32 | 0.9% |
| Total | 3,416 | 100.0% |
Ancestry in Del Monte Forest
The most populous ancestries reported in Del Monte Forest are English (518 | 15.2%), German (488 | 14.3%), Irish (459 | 13.4%), Italian (304 | 8.9%), and American (244 | 7.1%), together accounting for 58.9% of all Del Monte Forest residents.
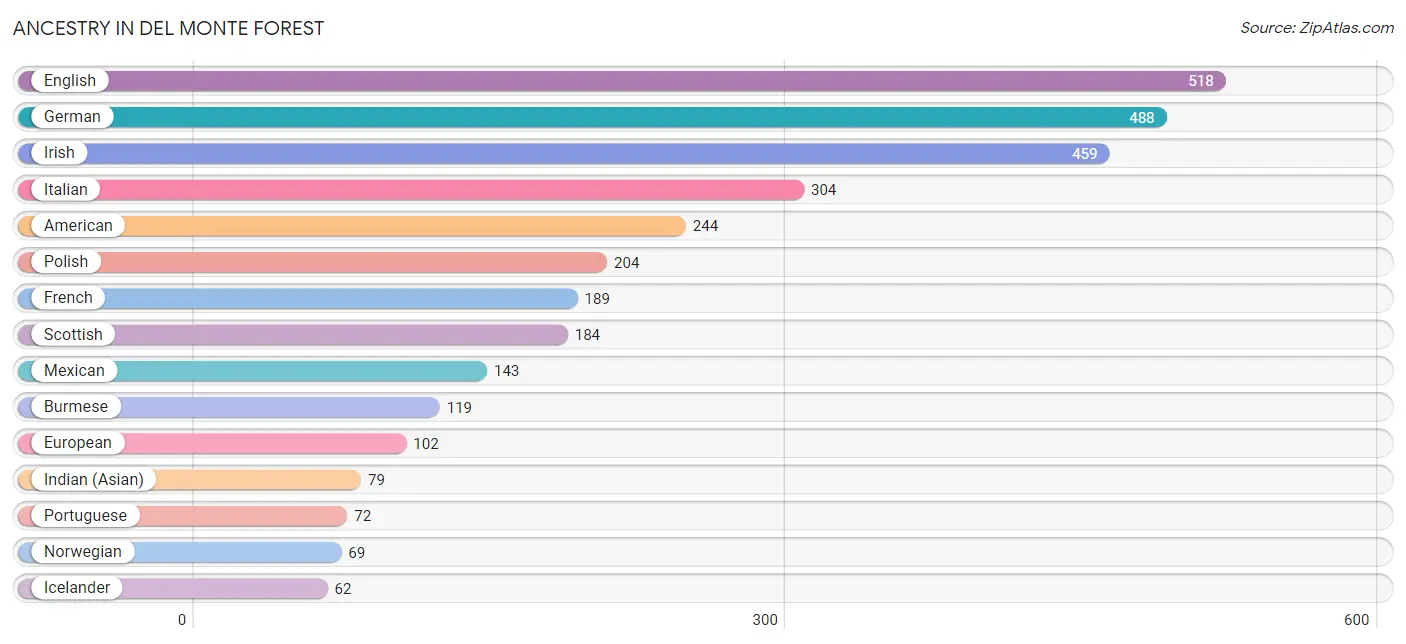
| Ancestry | # Population | % Population |
| Afghan | 9 | 0.3% |
| African | 1 | 0.0% |
| American | 244 | 7.1% |
| Arab | 22 | 0.6% |
| Armenian | 23 | 0.7% |
| Austrian | 26 | 0.8% |
| Bhutanese | 50 | 1.5% |
| British | 16 | 0.5% |
| Burmese | 119 | 3.5% |
| Colombian | 32 | 0.9% |
| Croatian | 18 | 0.5% |
| Czech | 30 | 0.9% |
| Czechoslovakian | 5 | 0.2% |
| Danish | 17 | 0.5% |
| Dutch | 34 | 1.0% |
| Eastern European | 8 | 0.2% |
| English | 518 | 15.2% |
| European | 102 | 3.0% |
| Finnish | 9 | 0.3% |
| French | 189 | 5.5% |
| French Canadian | 19 | 0.6% |
| German | 488 | 14.3% |
| Greek | 19 | 0.6% |
| Hungarian | 28 | 0.8% |
| Icelander | 62 | 1.8% |
| Indian (Asian) | 79 | 2.3% |
| Iranian | 10 | 0.3% |
| Iraqi | 1 | 0.0% |
| Irish | 459 | 13.4% |
| Italian | 304 | 8.9% |
| Korean | 56 | 1.6% |
| Lebanese | 21 | 0.6% |
| Mexican | 143 | 4.2% |
| Native Hawaiian | 1 | 0.0% |
| Northern European | 5 | 0.2% |
| Norwegian | 69 | 2.0% |
| Polish | 204 | 6.0% |
| Portuguese | 72 | 2.1% |
| Puerto Rican | 7 | 0.2% |
| Russian | 30 | 0.9% |
| Scotch-Irish | 47 | 1.4% |
| Scottish | 184 | 5.4% |
| Slovak | 6 | 0.2% |
| South American | 32 | 0.9% |
| Subsaharan African | 1 | 0.0% |
| Swedish | 41 | 1.2% |
| Swiss | 8 | 0.2% |
| Thai | 18 | 0.5% |
| Turkish | 16 | 0.5% |
| Ukrainian | 7 | 0.2% |
| Welsh | 49 | 1.4% | View All 51 Rows |
Immigrants in Del Monte Forest
The most numerous immigrant groups reported in Del Monte Forest came from Asia (270 | 7.9%), Eastern Asia (196 | 5.7%), Korea (109 | 3.2%), Europe (80 | 2.3%), and China (66 | 1.9%), together accounting for 21.1% of all Del Monte Forest residents.
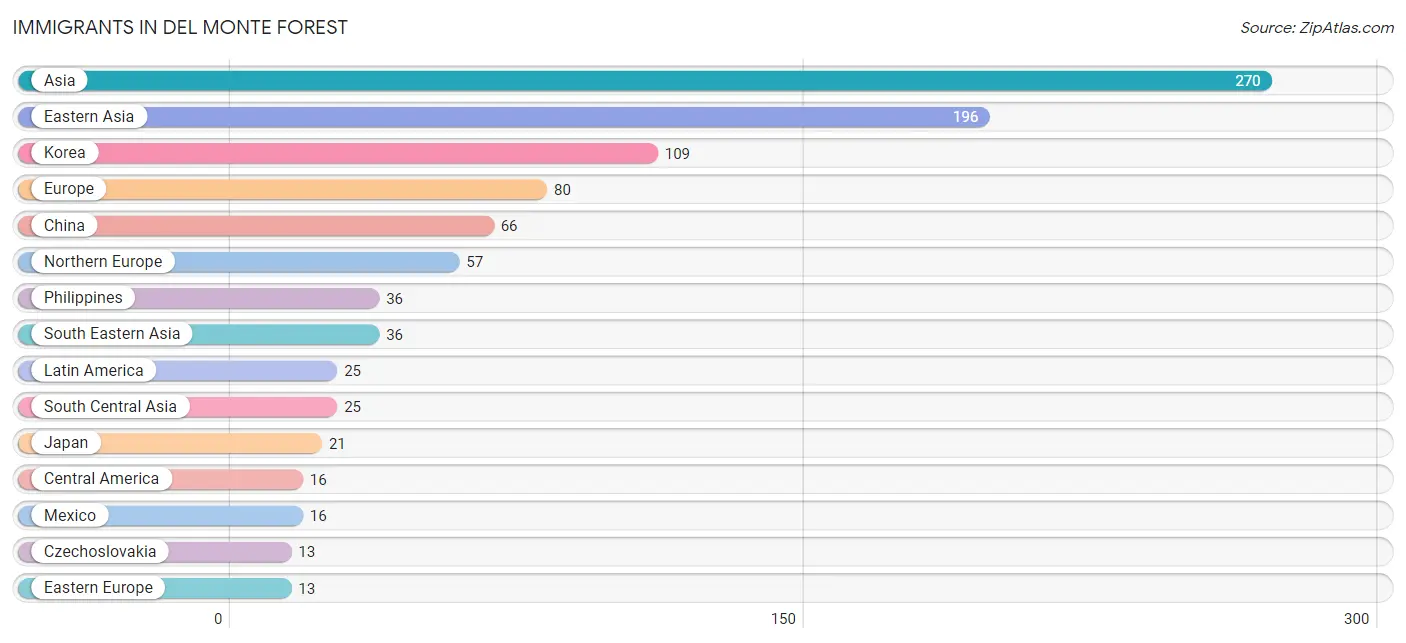
| Immigration Origin | # Population | % Population |
| Afghanistan | 9 | 0.3% |
| Asia | 270 | 7.9% |
| Australia | 5 | 0.2% |
| Canada | 5 | 0.2% |
| Central America | 16 | 0.5% |
| China | 66 | 1.9% |
| Czechoslovakia | 13 | 0.4% |
| Eastern Asia | 196 | 5.7% |
| Eastern Europe | 13 | 0.4% |
| Ecuador | 9 | 0.3% |
| England | 6 | 0.2% |
| Europe | 80 | 2.3% |
| Germany | 6 | 0.2% |
| India | 5 | 0.2% |
| Iran | 11 | 0.3% |
| Ireland | 9 | 0.3% |
| Israel | 8 | 0.2% |
| Italy | 4 | 0.1% |
| Japan | 21 | 0.6% |
| Korea | 109 | 3.2% |
| Latin America | 25 | 0.7% |
| Mexico | 16 | 0.5% |
| Northern Europe | 57 | 1.7% |
| Oceania | 5 | 0.2% |
| Philippines | 36 | 1.1% |
| Scotland | 13 | 0.4% |
| South America | 9 | 0.3% |
| South Central Asia | 25 | 0.7% |
| South Eastern Asia | 36 | 1.1% |
| Southern Europe | 4 | 0.1% |
| Turkey | 5 | 0.2% |
| Western Asia | 13 | 0.4% |
| Western Europe | 6 | 0.2% | View All 33 Rows |
Sex and Age in Del Monte Forest
Sex and Age in Del Monte Forest
The most populous age groups in Del Monte Forest are 65 to 69 Years (192 | 11.7%) for men and 65 to 69 Years (242 | 13.7%) for women.
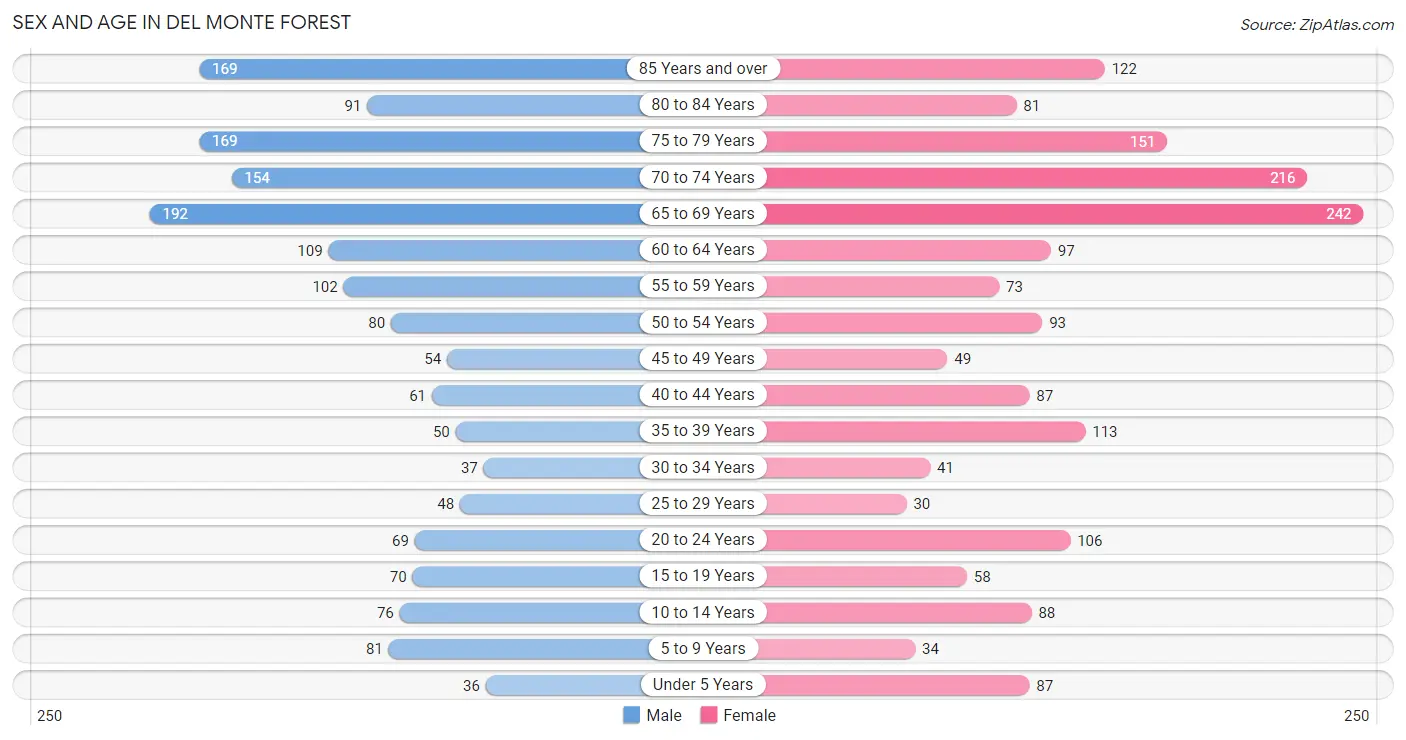
| Age Bracket | Male | Female |
| Under 5 Years | 36 (2.2%) | 87 (4.9%) |
| 5 to 9 Years | 81 (4.9%) | 34 (1.9%) |
| 10 to 14 Years | 76 (4.6%) | 88 (5.0%) |
| 15 to 19 Years | 70 (4.3%) | 58 (3.3%) |
| 20 to 24 Years | 69 (4.2%) | 106 (6.0%) |
| 25 to 29 Years | 48 (2.9%) | 30 (1.7%) |
| 30 to 34 Years | 37 (2.2%) | 41 (2.3%) |
| 35 to 39 Years | 50 (3.0%) | 113 (6.4%) |
| 40 to 44 Years | 61 (3.7%) | 87 (4.9%) |
| 45 to 49 Years | 54 (3.3%) | 49 (2.8%) |
| 50 to 54 Years | 80 (4.9%) | 93 (5.3%) |
| 55 to 59 Years | 102 (6.2%) | 73 (4.1%) |
| 60 to 64 Years | 109 (6.6%) | 97 (5.5%) |
| 65 to 69 Years | 192 (11.7%) | 242 (13.7%) |
| 70 to 74 Years | 154 (9.3%) | 216 (12.2%) |
| 75 to 79 Years | 169 (10.2%) | 151 (8.5%) |
| 80 to 84 Years | 91 (5.5%) | 81 (4.6%) |
| 85 Years and over | 169 (10.2%) | 122 (6.9%) |
| Total | 1,648 (100.0%) | 1,768 (100.0%) |
Families and Households in Del Monte Forest
Median Family Size in Del Monte Forest
The median family size in Del Monte Forest is 2.55 persons per family, with single male/father families (37 | 3.8%) accounting for the largest median family size of 3.16 persons per family. On the other hand, married-couple families (886 | 90.3%) represent the smallest median family size with 2.51 persons per family.
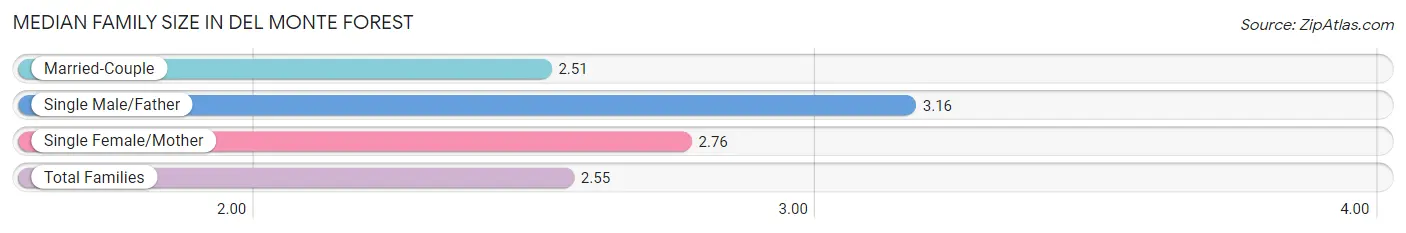
| Family Type | # Families | Family Size |
| Married-Couple | 886 (90.3%) | 2.51 |
| Single Male/Father | 37 (3.8%) | 3.16 |
| Single Female/Mother | 58 (5.9%) | 2.76 |
| Total Families | 981 (100.0%) | 2.55 |
Median Household Size in Del Monte Forest
The median household size in Del Monte Forest is 2.03 persons per household, with single male/father households (37 | 2.3%) accounting for the largest median household size of 3.35 persons per household. non-family households (601 | 38.0%) represent the smallest median household size with 1.13 persons per household.
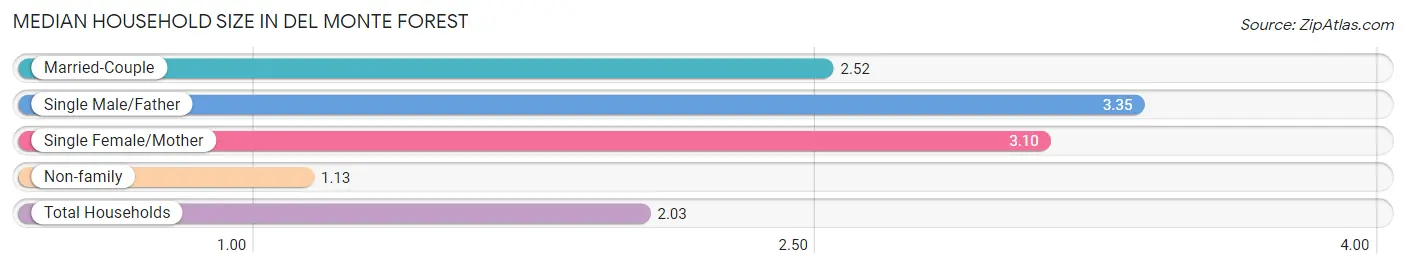
| Household Type | # Households | Household Size |
| Married-Couple | 886 (56.0%) | 2.52 |
| Single Male/Father | 37 (2.3%) | 3.35 |
| Single Female/Mother | 58 (3.7%) | 3.10 |
| Non-family | 601 (38.0%) | 1.13 |
| Total Households | 1,582 (100.0%) | 2.03 |
Household Size by Marriage Status in Del Monte Forest
Out of a total of 1,582 households in Del Monte Forest, 981 (62.0%) are family households, while 601 (38.0%) are nonfamily households. The most numerous type of family households are 2-person households, comprising 716, and the most common type of nonfamily households are 1-person households, comprising 550.
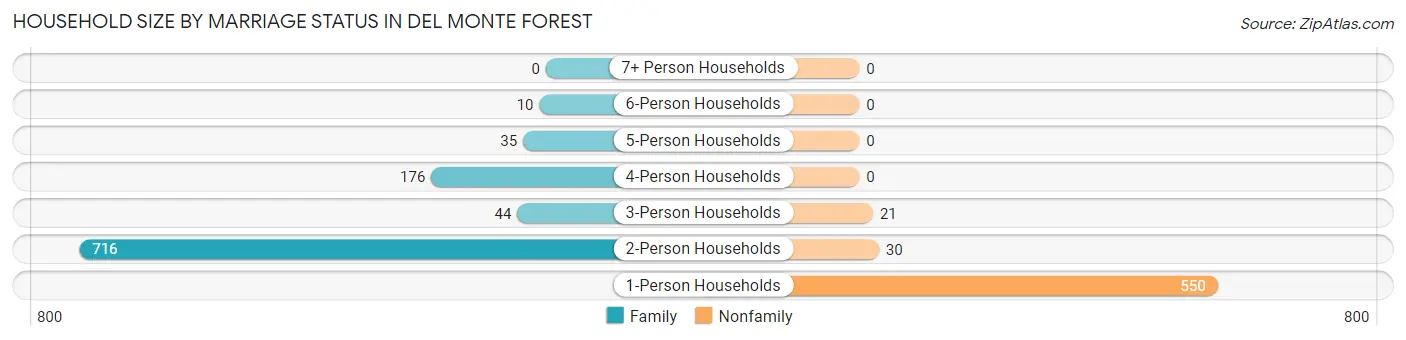
| Household Size | Family Households | Nonfamily Households |
| 1-Person Households | - | 550 (34.8%) |
| 2-Person Households | 716 (45.3%) | 30 (1.9%) |
| 3-Person Households | 44 (2.8%) | 21 (1.3%) |
| 4-Person Households | 176 (11.1%) | 0 (0.0%) |
| 5-Person Households | 35 (2.2%) | 0 (0.0%) |
| 6-Person Households | 10 (0.6%) | 0 (0.0%) |
| 7+ Person Households | 0 (0.0%) | 0 (0.0%) |
| Total | 981 (62.0%) | 601 (38.0%) |
Female Fertility in Del Monte Forest
Fertility by Age in Del Monte Forest
Average fertility rate in Del Monte Forest is 112.0 births per 1,000 women. Women in the age bracket of 35 to 50 years have the highest fertility rate with 198.0 births per 1,000 women. Women in the age bracket of 35 to 50 years acount for 100.0% of all women with births.
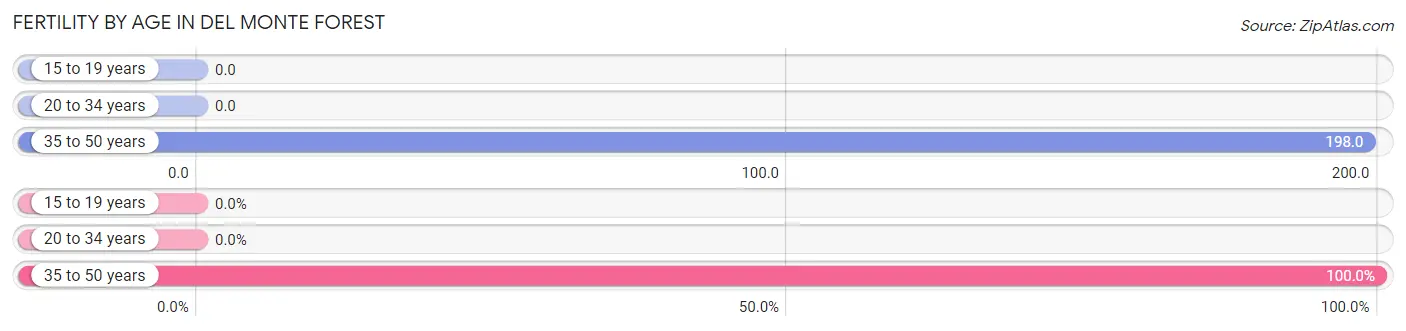
| Age Bracket | Women with Births | Births / 1,000 Women |
| 15 to 19 years | 0 (0.0%) | 0.0 |
| 20 to 34 years | 0 (0.0%) | 0.0 |
| 35 to 50 years | 61 (100.0%) | 198.0 |
| Total | 61 (100.0%) | 112.0 |
Fertility by Age by Marriage Status in Del Monte Forest
88.5% of women with births (61) in Del Monte Forest are married. The highest percentage of unmarried women with births falls into 35 to 50 years age bracket with 11.5% of them unmarried at the time of birth, while the lowest percentage of unmarried women with births belong to 35 to 50 years age bracket with 11.5% of them unmarried.
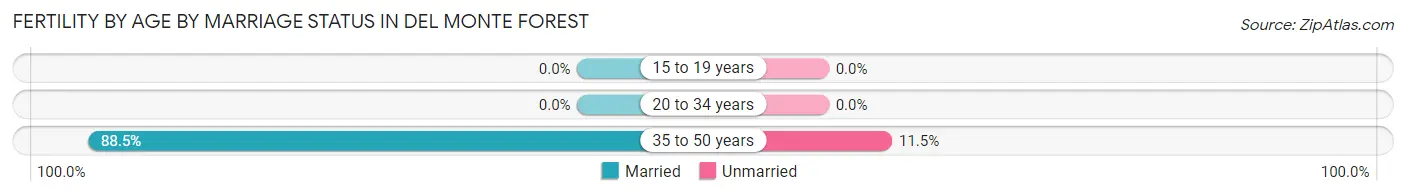
| Age Bracket | Married | Unmarried |
| 15 to 19 years | 0 (0.0%) | 0 (0.0%) |
| 20 to 34 years | 0 (0.0%) | 0 (0.0%) |
| 35 to 50 years | 54 (88.5%) | 7 (11.5%) |
| Total | 54 (88.5%) | 7 (11.5%) |
Fertility by Education in Del Monte Forest
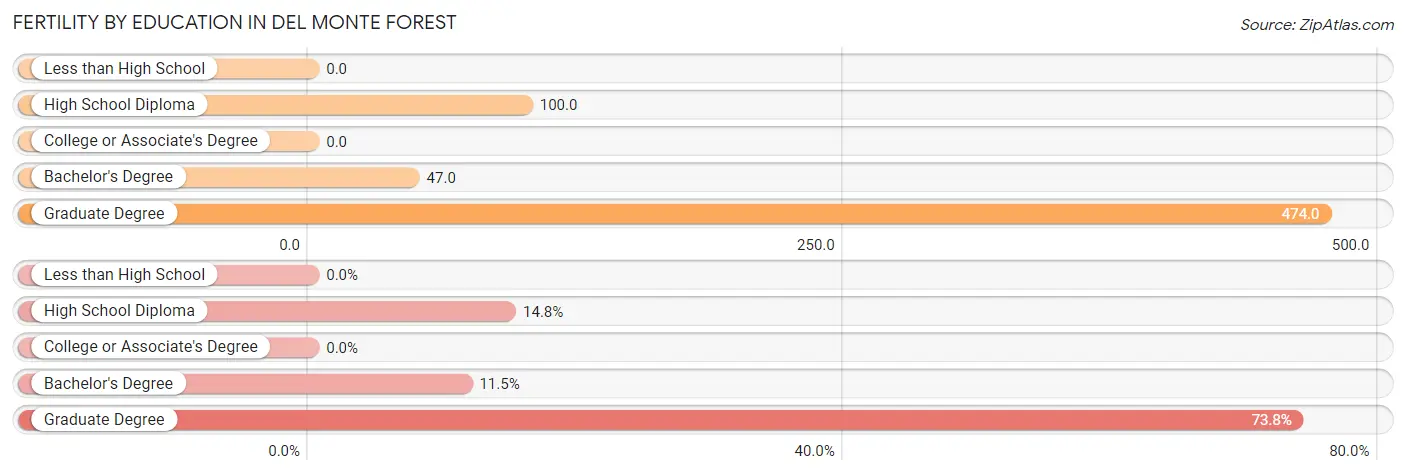
| Educational Attainment | Women with Births | Births / 1,000 Women |
| Less than High School | 0 (0.0%) | 0.0 |
| High School Diploma | 9 (14.7%) | 100.0 |
| College or Associate's Degree | 0 (0.0%) | 0.0 |
| Bachelor's Degree | 7 (11.5%) | 47.0 |
| Graduate Degree | 45 (73.8%) | 474.0 |
| Total | 61 (100.0%) | 112.0 |
Fertility by Education by Marriage Status in Del Monte Forest
11.5% of women with births in Del Monte Forest are unmarried. Women with the educational attainment of high school diploma are most likely to be married with 100.0% of them married at childbirth, while women with the educational attainment of bachelor's degree are least likely to be married with 100.0% of them unmarried at childbirth.
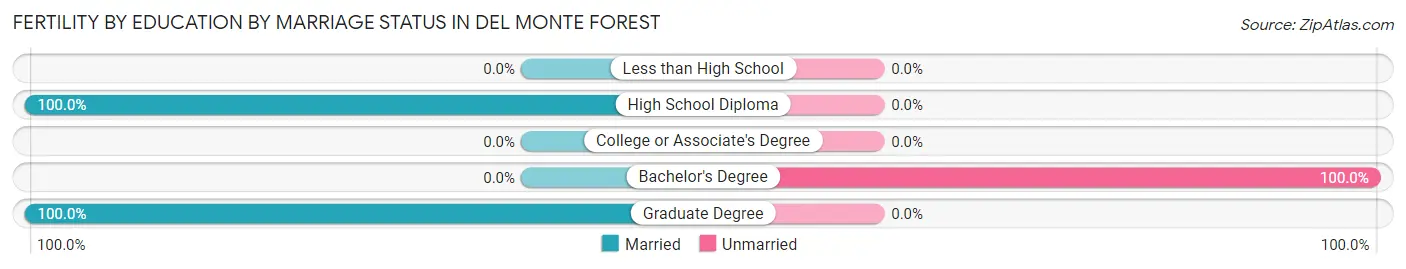
| Educational Attainment | Married | Unmarried |
| Less than High School | 0 (0.0%) | 0 (0.0%) |
| High School Diploma | 9 (100.0%) | 0 (0.0%) |
| College or Associate's Degree | 0 (0.0%) | 0 (0.0%) |
| Bachelor's Degree | 0 (0.0%) | 7 (100.0%) |
| Graduate Degree | 45 (100.0%) | 0 (0.0%) |
| Total | 54 (88.5%) | 7 (11.5%) |
Employment Characteristics in Del Monte Forest
Employment by Class of Employer in Del Monte Forest
Among the 1,140 employed individuals in Del Monte Forest, private company employees (493 | 43.2%), self-employed (not incorporated) (184 | 16.1%), and not-for-profit organizations (142 | 12.5%) make up the most common classes of employment.
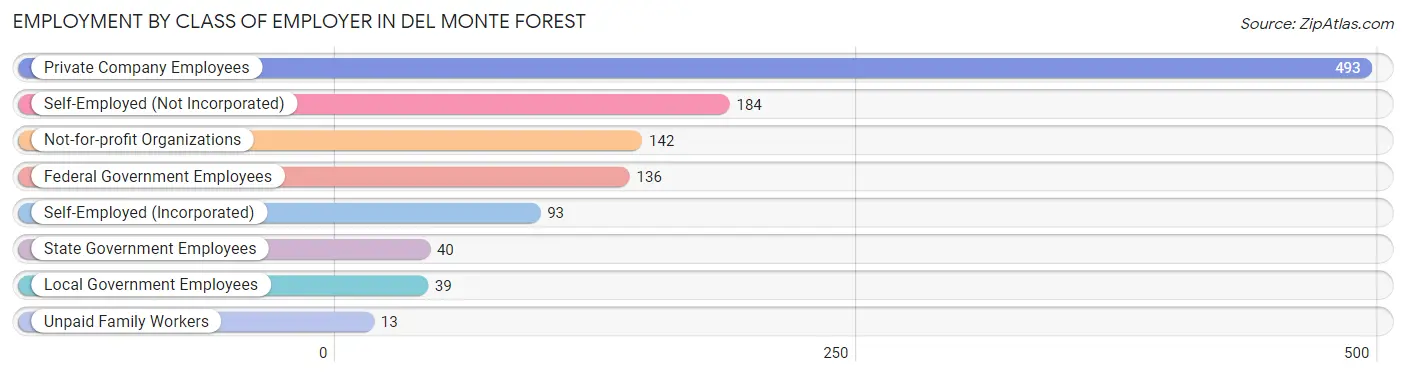
| Employer Class | # Employees | % Employees |
| Private Company Employees | 493 | 43.2% |
| Self-Employed (Incorporated) | 93 | 8.2% |
| Self-Employed (Not Incorporated) | 184 | 16.1% |
| Not-for-profit Organizations | 142 | 12.5% |
| Local Government Employees | 39 | 3.4% |
| State Government Employees | 40 | 3.5% |
| Federal Government Employees | 136 | 11.9% |
| Unpaid Family Workers | 13 | 1.1% |
| Total | 1,140 | 100.0% |
Employment Status by Age in Del Monte Forest
According to the labor force statistics for Del Monte Forest, out of the total population over 16 years of age (2,986), 40.6% or 1,212 individuals are in the labor force, with 5.1% or 62 of them unemployed. The age group with the highest labor force participation rate is 25 to 29 years, with 89.7% or 70 individuals in the labor force. Within the labor force, the 20 to 24 years age range has the highest percentage of unemployed individuals, with 31.4% or 33 of them being unemployed.
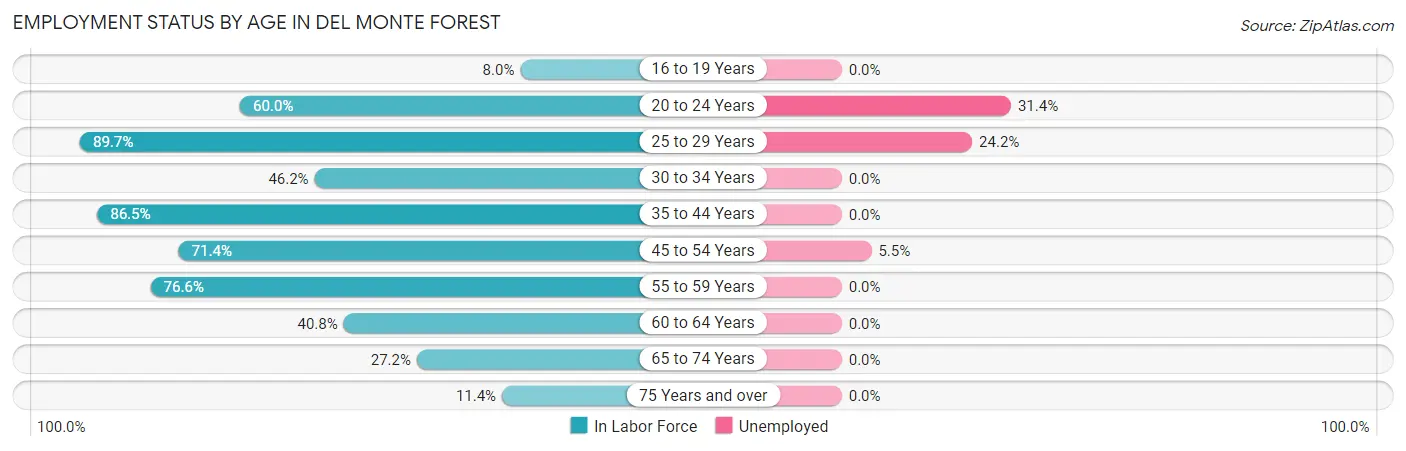
| Age Bracket | In Labor Force | Unemployed |
| 16 to 19 Years | 8 (8.0%) | 0 (0.0%) |
| 20 to 24 Years | 105 (60.0%) | 33 (31.4%) |
| 25 to 29 Years | 70 (89.7%) | 17 (24.2%) |
| 30 to 34 Years | 36 (46.2%) | 0 (0.0%) |
| 35 to 44 Years | 269 (86.5%) | 0 (0.0%) |
| 45 to 54 Years | 197 (71.4%) | 11 (5.5%) |
| 55 to 59 Years | 134 (76.6%) | 0 (0.0%) |
| 60 to 64 Years | 84 (40.8%) | 0 (0.0%) |
| 65 to 74 Years | 219 (27.2%) | 0 (0.0%) |
| 75 Years and over | 89 (11.4%) | 0 (0.0%) |
| Total | 1,212 (40.6%) | 62 (5.1%) |
Employment Status by Educational Attainment in Del Monte Forest
According to labor force statistics for Del Monte Forest, 70.3% of individuals (790) out of the total population between 25 and 64 years of age (1,124) are in the labor force, with 3.5% or 28 of them being unemployed. The group with the highest labor force participation rate are those with the educational attainment of bachelor's degree or higher, with 81.5% or 592 individuals in the labor force. Within the labor force, individuals with high school diploma education have the highest percentage of unemployment, with 14.9% or 15 of them being unemployed.
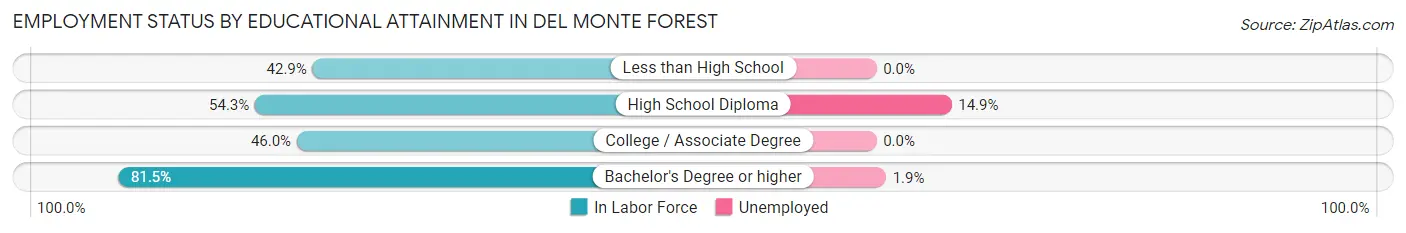
| Educational Attainment | In Labor Force | Unemployed |
| Less than High School | 6 (42.9%) | 0 (0.0%) |
| High School Diploma | 101 (54.3%) | 28 (14.9%) |
| College / Associate Degree | 91 (46.0%) | 0 (0.0%) |
| Bachelor's Degree or higher | 592 (81.5%) | 14 (1.9%) |
| Total | 790 (70.3%) | 39 (3.5%) |
Employment Occupations by Sex in Del Monte Forest
Management, Business, Science and Arts Occupations
The most common Management, Business, Science and Arts occupations in Del Monte Forest are Management (304 | 28.1%), Community & Social Service (205 | 19.0%), Education Instruction & Library (127 | 11.8%), Business & Financial (115 | 10.6%), and Computers, Engineering & Science (100 | 9.3%).
Management, Business, Science and Arts Occupations by Sex
Within the Management, Business, Science and Arts occupations in Del Monte Forest, the most male-oriented occupations are Computers & Mathematics (100.0%), Architecture & Engineering (100.0%), and Management (68.4%), while the most female-oriented occupations are Business & Financial (87.8%), Life, Physical & Social Science (74.4%), and Education Instruction & Library (68.5%).
| Occupation | Male | Female |
| Management | 208 (68.4%) | 96 (31.6%) |
| Business & Financial | 14 (12.2%) | 101 (87.8%) |
| Computers, Engineering & Science | 68 (68.0%) | 32 (32.0%) |
| Computers & Mathematics | 12 (100.0%) | 0 (0.0%) |
| Architecture & Engineering | 45 (100.0%) | 0 (0.0%) |
| Life, Physical & Social Science | 11 (25.6%) | 32 (74.4%) |
| Community & Social Service | 74 (36.1%) | 131 (63.9%) |
| Education, Arts & Media | 5 (50.0%) | 5 (50.0%) |
| Legal Services & Support | 8 (57.1%) | 6 (42.9%) |
| Education Instruction & Library | 40 (31.5%) | 87 (68.5%) |
| Arts, Media & Entertainment | 21 (38.9%) | 33 (61.1%) |
| Health Diagnosing & Treating | 27 (56.2%) | 21 (43.8%) |
| Health Technologists | 27 (56.2%) | 21 (43.8%) |
| Total (Category) | 391 (50.6%) | 381 (49.3%) |
| Total (Overall) | 569 (52.7%) | 511 (47.3%) |
Services Occupations
The most common Services occupations in Del Monte Forest are Personal Care & Service (49 | 4.5%), Healthcare Support (20 | 1.8%), and Food Preparation & Serving (7 | 0.6%).
Services Occupations by Sex
| Occupation | Male | Female |
| Healthcare Support | 20 (100.0%) | 0 (0.0%) |
| Security & Protection | 0 (0.0%) | 0 (0.0%) |
| Firefighting & Prevention | 0 (0.0%) | 0 (0.0%) |
| Law Enforcement | 0 (0.0%) | 0 (0.0%) |
| Food Preparation & Serving | 7 (100.0%) | 0 (0.0%) |
| Cleaning & Maintenance | 0 (0.0%) | 0 (0.0%) |
| Personal Care & Service | 31 (63.3%) | 18 (36.7%) |
| Total (Category) | 58 (76.3%) | 18 (23.7%) |
| Total (Overall) | 569 (52.7%) | 511 (47.3%) |
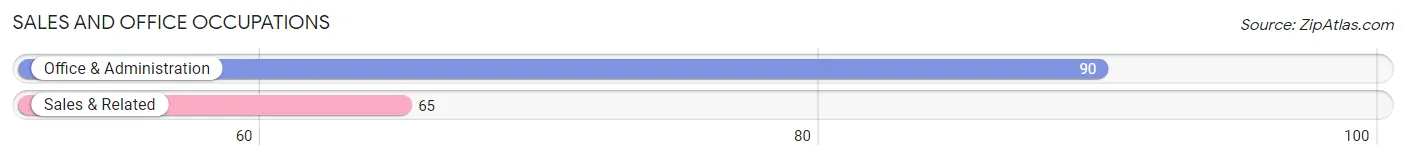
Sales and Office Occupations
The most common Sales and Office occupations in Del Monte Forest are Office & Administration (90 | 8.3%), and Sales & Related (65 | 6.0%).
Sales and Office Occupations by Sex
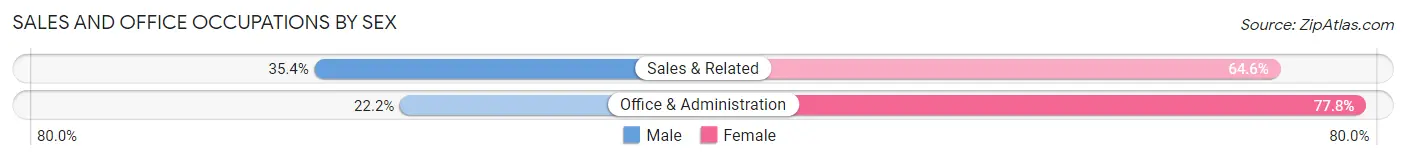
| Occupation | Male | Female |
| Sales & Related | 23 (35.4%) | 42 (64.6%) |
| Office & Administration | 20 (22.2%) | 70 (77.8%) |
| Total (Category) | 43 (27.7%) | 112 (72.3%) |
| Total (Overall) | 569 (52.7%) | 511 (47.3%) |
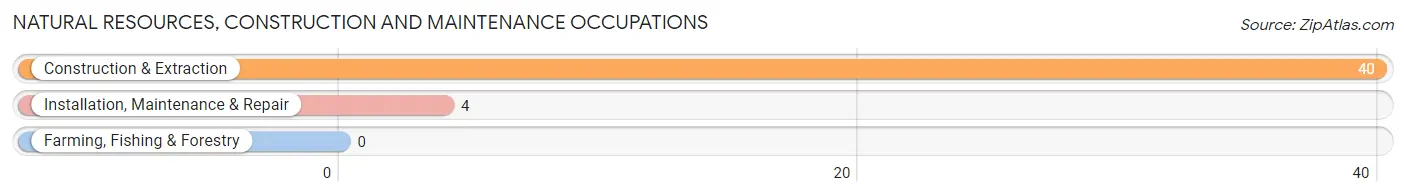
Natural Resources, Construction and Maintenance Occupations
The most common Natural Resources, Construction and Maintenance occupations in Del Monte Forest are Construction & Extraction (40 | 3.7%), and Installation, Maintenance & Repair (4 | 0.4%).
Natural Resources, Construction and Maintenance Occupations by Sex
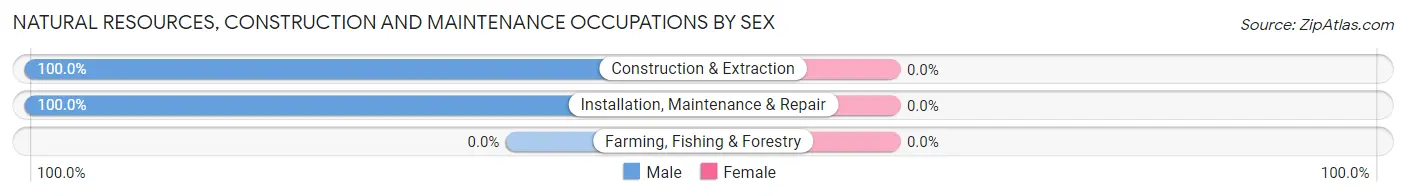
| Occupation | Male | Female |
| Farming, Fishing & Forestry | 0 (0.0%) | 0 (0.0%) |
| Construction & Extraction | 40 (100.0%) | 0 (0.0%) |
| Installation, Maintenance & Repair | 4 (100.0%) | 0 (0.0%) |
| Total (Category) | 44 (100.0%) | 0 (0.0%) |
| Total (Overall) | 569 (52.7%) | 511 (47.3%) |
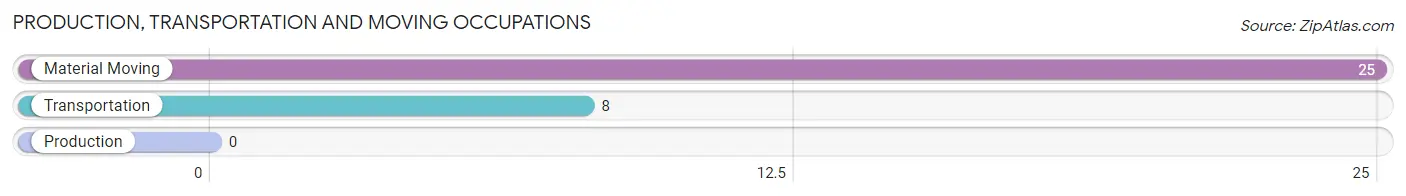
Production, Transportation and Moving Occupations
The most common Production, Transportation and Moving occupations in Del Monte Forest are Material Moving (25 | 2.3%), and Transportation (8 | 0.7%).
Production, Transportation and Moving Occupations by Sex
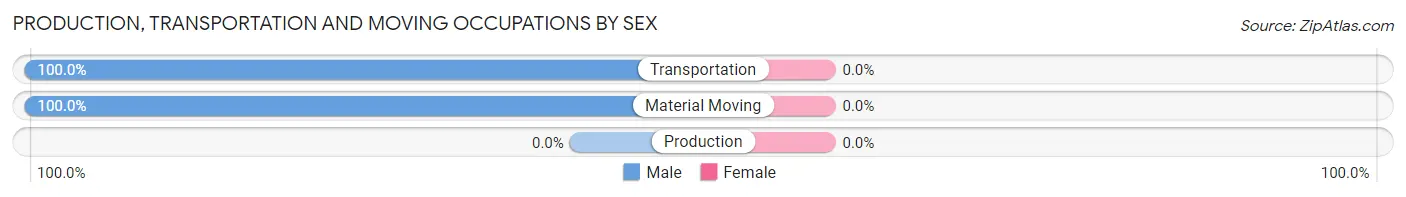
| Occupation | Male | Female |
| Production | 0 (0.0%) | 0 (0.0%) |
| Transportation | 8 (100.0%) | 0 (0.0%) |
| Material Moving | 25 (100.0%) | 0 (0.0%) |
| Total (Category) | 33 (100.0%) | 0 (0.0%) |
| Total (Overall) | 569 (52.7%) | 511 (47.3%) |
Employment Industries by Sex in Del Monte Forest
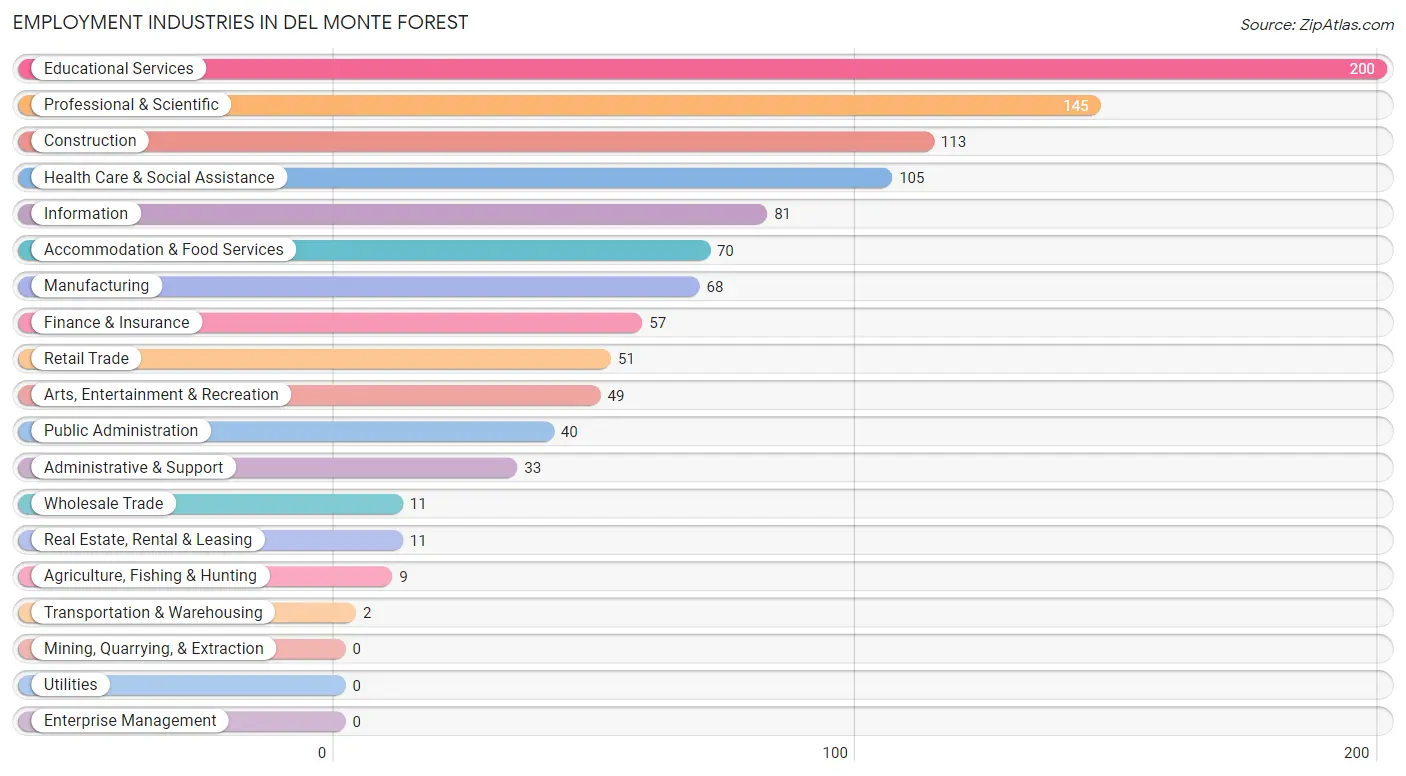
Employment Industries in Del Monte Forest
The major employment industries in Del Monte Forest include Educational Services (200 | 18.5%), Professional & Scientific (145 | 13.4%), Construction (113 | 10.5%), Health Care & Social Assistance (105 | 9.7%), and Information (81 | 7.5%).
Employment Industries by Sex in Del Monte Forest
The Del Monte Forest industries that see more men than women are Agriculture, Fishing & Hunting (100.0%), Transportation & Warehousing (100.0%), and Administrative & Support (100.0%), whereas the industries that tend to have a higher number of women are Wholesale Trade (100.0%), Real Estate, Rental & Leasing (100.0%), and Arts, Entertainment & Recreation (71.4%).
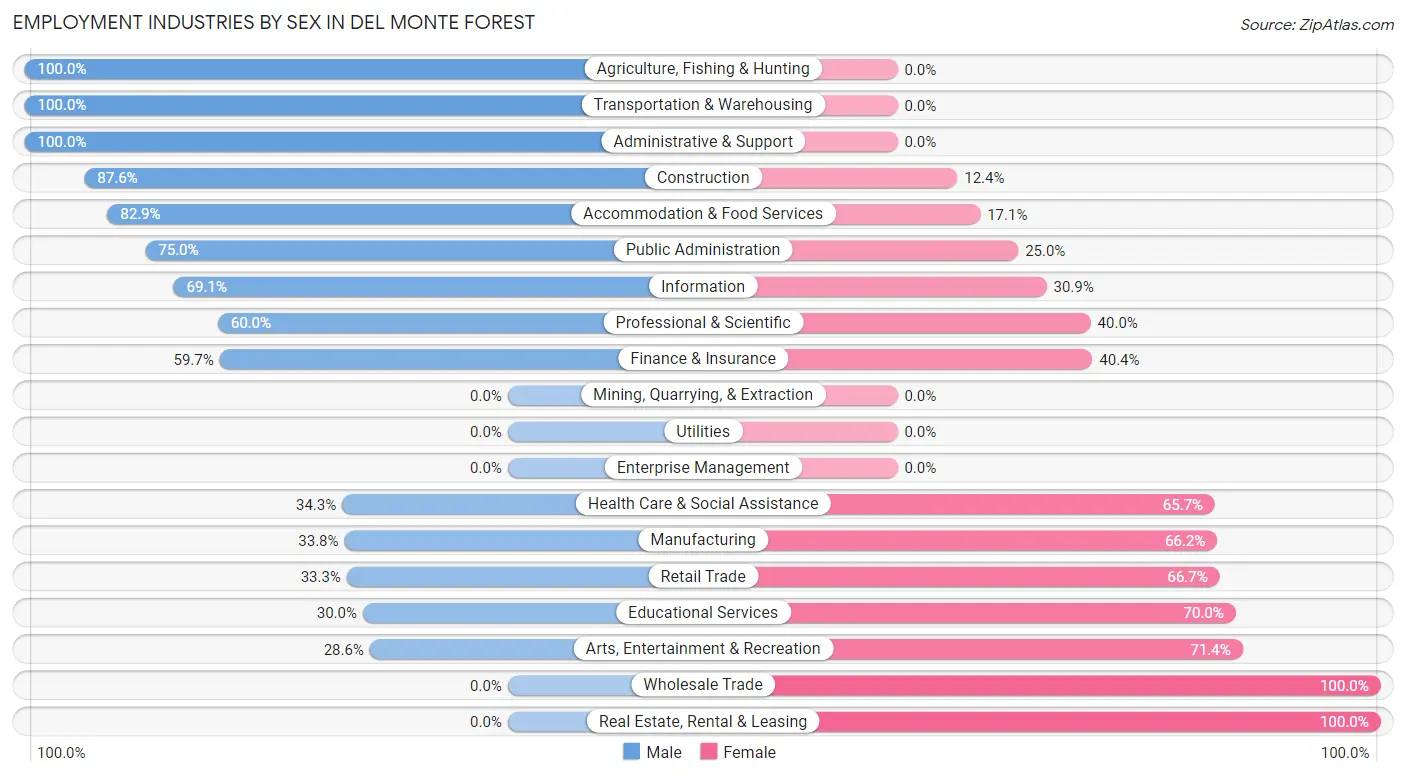
| Industry | Male | Female |
| Agriculture, Fishing & Hunting | 9 (100.0%) | 0 (0.0%) |
| Mining, Quarrying, & Extraction | 0 (0.0%) | 0 (0.0%) |
| Construction | 99 (87.6%) | 14 (12.4%) |
| Manufacturing | 23 (33.8%) | 45 (66.2%) |
| Wholesale Trade | 0 (0.0%) | 11 (100.0%) |
| Retail Trade | 17 (33.3%) | 34 (66.7%) |
| Transportation & Warehousing | 2 (100.0%) | 0 (0.0%) |
| Utilities | 0 (0.0%) | 0 (0.0%) |
| Information | 56 (69.1%) | 25 (30.9%) |
| Finance & Insurance | 34 (59.7%) | 23 (40.4%) |
| Real Estate, Rental & Leasing | 0 (0.0%) | 11 (100.0%) |
| Professional & Scientific | 87 (60.0%) | 58 (40.0%) |
| Enterprise Management | 0 (0.0%) | 0 (0.0%) |
| Administrative & Support | 33 (100.0%) | 0 (0.0%) |
| Educational Services | 60 (30.0%) | 140 (70.0%) |
| Health Care & Social Assistance | 36 (34.3%) | 69 (65.7%) |
| Arts, Entertainment & Recreation | 14 (28.6%) | 35 (71.4%) |
| Accommodation & Food Services | 58 (82.9%) | 12 (17.1%) |
| Public Administration | 30 (75.0%) | 10 (25.0%) |
| Total | 569 (52.7%) | 511 (47.3%) |
Education in Del Monte Forest
School Enrollment in Del Monte Forest
The most common levels of schooling among the 594 students in Del Monte Forest are college / undergraduate (200 | 33.7%), middle school (135 | 22.7%), and high school (109 | 18.3%).
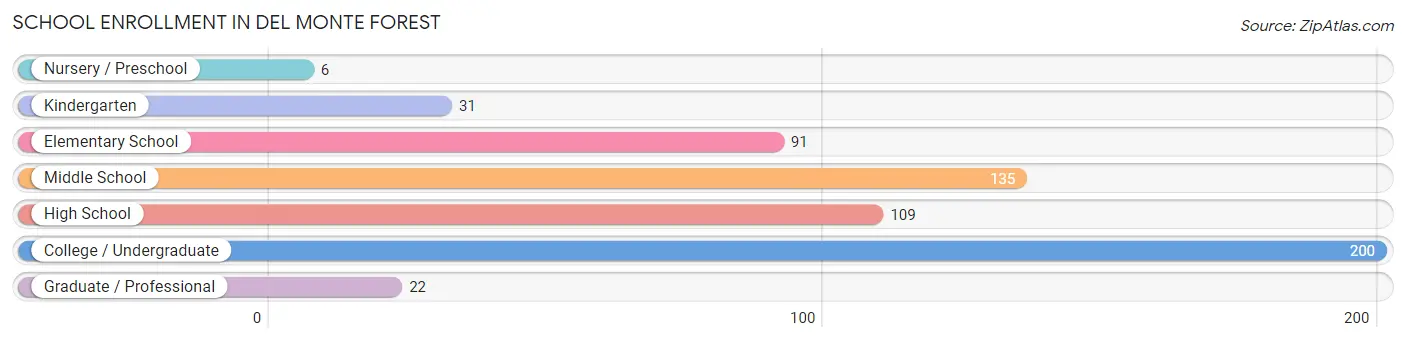
| School Level | # Students | % Students |
| Nursery / Preschool | 6 | 1.0% |
| Kindergarten | 31 | 5.2% |
| Elementary School | 91 | 15.3% |
| Middle School | 135 | 22.7% |
| High School | 109 | 18.3% |
| College / Undergraduate | 200 | 33.7% |
| Graduate / Professional | 22 | 3.7% |
| Total | 594 | 100.0% |
School Enrollment by Age by Funding Source in Del Monte Forest
Out of a total of 594 students who are enrolled in schools in Del Monte Forest, 189 (31.8%) attend a private institution, while the remaining 405 (68.2%) are enrolled in public schools. The age group of 20 to 24 year olds has the highest likelihood of being enrolled in private schools, with 93 (65.0% in the age bracket) enrolled. Conversely, the age group of 3 to 4 year olds has the lowest likelihood of being enrolled in a private school, with 13 (100.0% in the age bracket) attending a public institution.
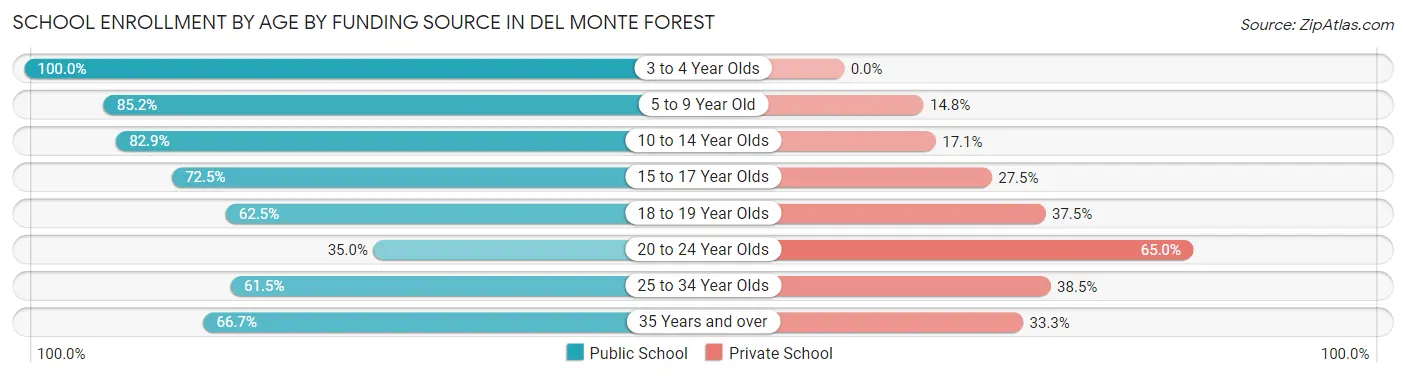
| Age Bracket | Public School | Private School |
| 3 to 4 Year Olds | 13 (100.0%) | 0 (0.0%) |
| 5 to 9 Year Old | 98 (85.2%) | 17 (14.8%) |
| 10 to 14 Year Olds | 136 (82.9%) | 28 (17.1%) |
| 15 to 17 Year Olds | 58 (72.5%) | 22 (27.5%) |
| 18 to 19 Year Olds | 30 (62.5%) | 18 (37.5%) |
| 20 to 24 Year Olds | 50 (35.0%) | 93 (65.0%) |
| 25 to 34 Year Olds | 8 (61.5%) | 5 (38.5%) |
| 35 Years and over | 12 (66.7%) | 6 (33.3%) |
| Total | 405 (68.2%) | 189 (31.8%) |
Educational Attainment by Field of Study in Del Monte Forest
Business (261 | 12.6%), literature & languages (232 | 11.2%), social sciences (216 | 10.4%), liberal arts & history (213 | 10.3%), and engineering (210 | 10.2%) are the most common fields of study among 2,067 individuals in Del Monte Forest who have obtained a bachelor's degree or higher.
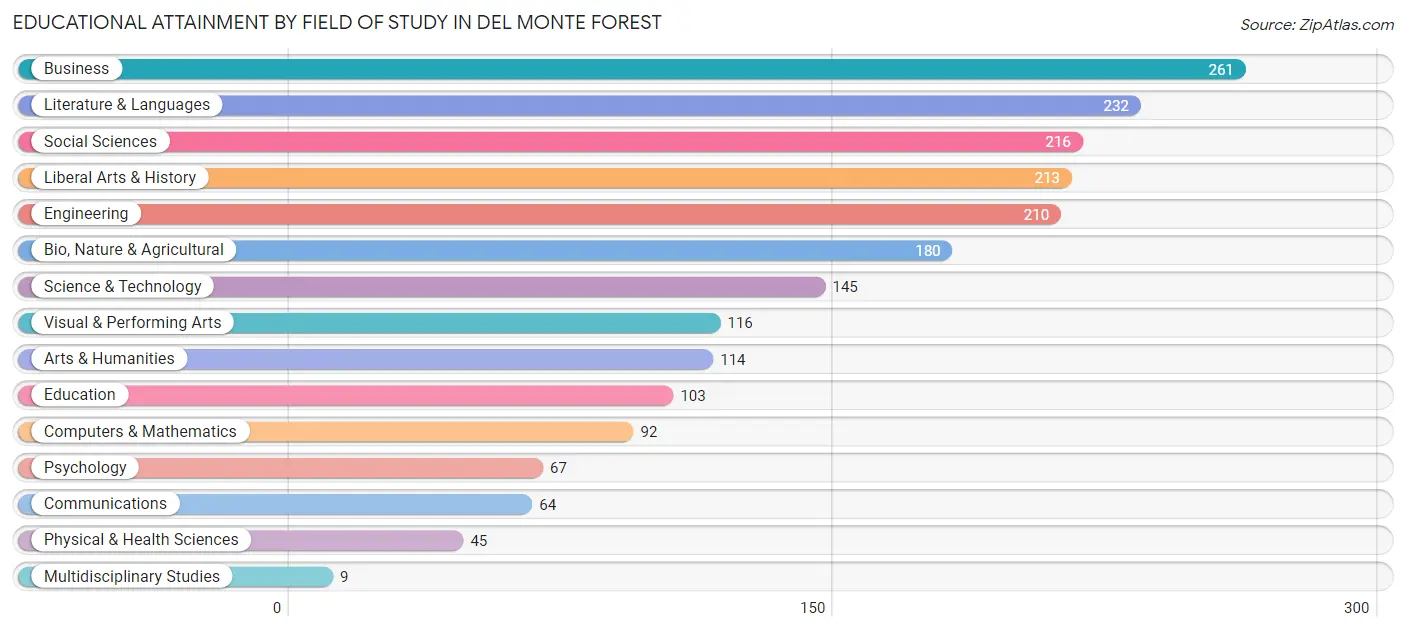
| Field of Study | # Graduates | % Graduates |
| Computers & Mathematics | 92 | 4.4% |
| Bio, Nature & Agricultural | 180 | 8.7% |
| Physical & Health Sciences | 45 | 2.2% |
| Psychology | 67 | 3.2% |
| Social Sciences | 216 | 10.4% |
| Engineering | 210 | 10.2% |
| Multidisciplinary Studies | 9 | 0.4% |
| Science & Technology | 145 | 7.0% |
| Business | 261 | 12.6% |
| Education | 103 | 5.0% |
| Literature & Languages | 232 | 11.2% |
| Liberal Arts & History | 213 | 10.3% |
| Visual & Performing Arts | 116 | 5.6% |
| Communications | 64 | 3.1% |
| Arts & Humanities | 114 | 5.5% |
| Total | 2,067 | 100.0% |
Transportation & Commute in Del Monte Forest
Vehicle Availability by Sex in Del Monte Forest
The most prevalent vehicle ownership categories in Del Monte Forest are males with 2 vehicles (263, accounting for 47.0%) and females with 2 vehicles (290, making up 54.9%).
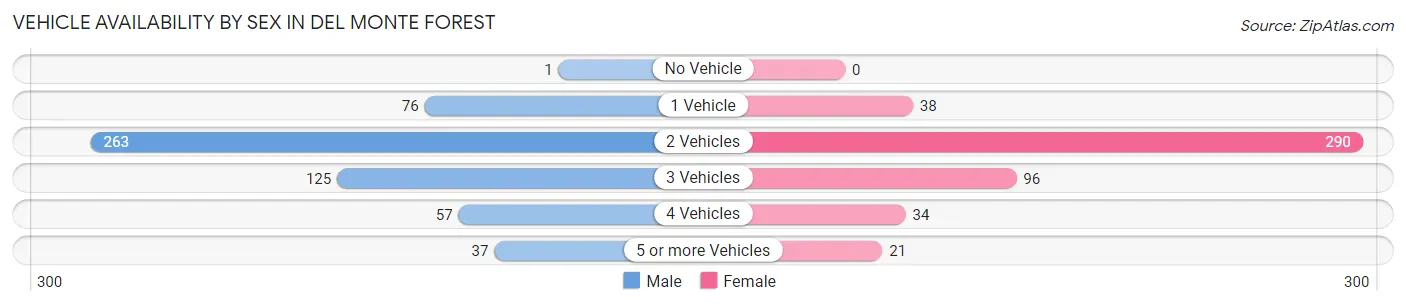
| Vehicles Available | Male | Female |
| No Vehicle | 1 (0.2%) | 0 (0.0%) |
| 1 Vehicle | 76 (13.6%) | 38 (7.9%) |
| 2 Vehicles | 263 (47.0%) | 290 (60.5%) |
| 3 Vehicles | 125 (22.4%) | 96 (20.0%) |
| 4 Vehicles | 57 (10.2%) | 34 (7.1%) |
| 5 or more Vehicles | 37 (6.6%) | 21 (4.4%) |
| Total | 559 (100.0%) | 479 (100.0%) |
Commute Time in Del Monte Forest
The most frequently occuring commute durations in Del Monte Forest are 15 to 19 minutes (171 commuters, 21.0%), 5 to 9 minutes (158 commuters, 19.4%), and 20 to 24 minutes (127 commuters, 15.6%).
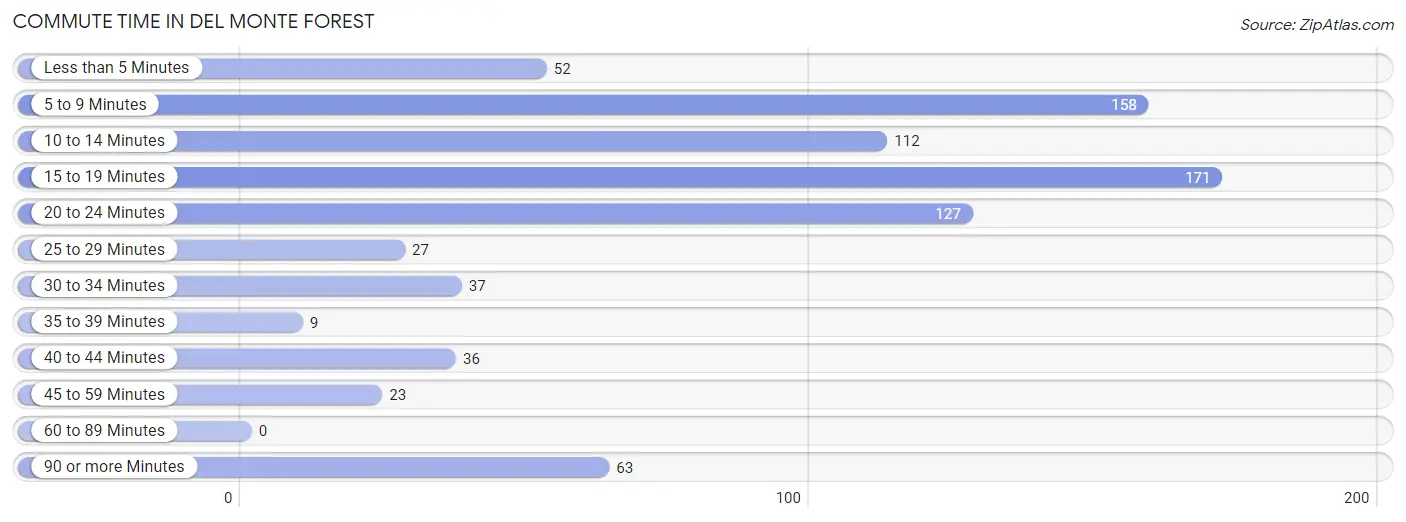
| Commute Time | # Commuters | % Commuters |
| Less than 5 Minutes | 52 | 6.4% |
| 5 to 9 Minutes | 158 | 19.4% |
| 10 to 14 Minutes | 112 | 13.7% |
| 15 to 19 Minutes | 171 | 21.0% |
| 20 to 24 Minutes | 127 | 15.6% |
| 25 to 29 Minutes | 27 | 3.3% |
| 30 to 34 Minutes | 37 | 4.5% |
| 35 to 39 Minutes | 9 | 1.1% |
| 40 to 44 Minutes | 36 | 4.4% |
| 45 to 59 Minutes | 23 | 2.8% |
| 60 to 89 Minutes | 0 | 0.0% |
| 90 or more Minutes | 63 | 7.7% |
Commute Time by Sex in Del Monte Forest
The most common commute times in Del Monte Forest are 5 to 9 minutes (122 commuters, 27.8%) for males and 20 to 24 minutes (93 commuters, 24.7%) for females.
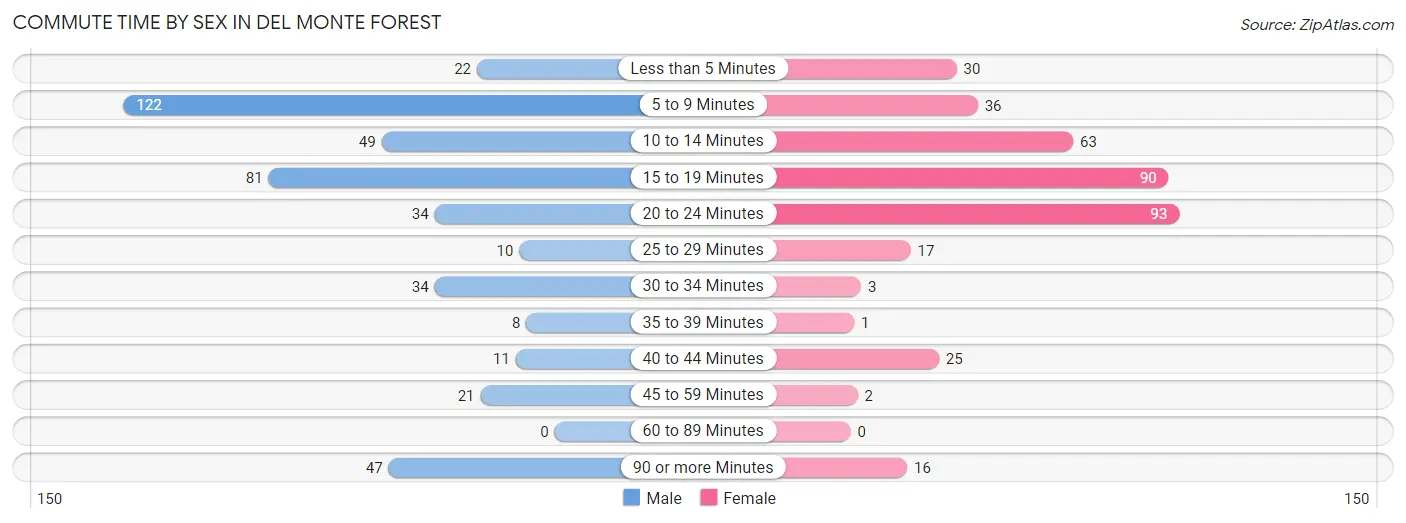
| Commute Time | Male | Female |
| Less than 5 Minutes | 22 (5.0%) | 30 (8.0%) |
| 5 to 9 Minutes | 122 (27.8%) | 36 (9.6%) |
| 10 to 14 Minutes | 49 (11.2%) | 63 (16.8%) |
| 15 to 19 Minutes | 81 (18.4%) | 90 (23.9%) |
| 20 to 24 Minutes | 34 (7.7%) | 93 (24.7%) |
| 25 to 29 Minutes | 10 (2.3%) | 17 (4.5%) |
| 30 to 34 Minutes | 34 (7.7%) | 3 (0.8%) |
| 35 to 39 Minutes | 8 (1.8%) | 1 (0.3%) |
| 40 to 44 Minutes | 11 (2.5%) | 25 (6.7%) |
| 45 to 59 Minutes | 21 (4.8%) | 2 (0.5%) |
| 60 to 89 Minutes | 0 (0.0%) | 0 (0.0%) |
| 90 or more Minutes | 47 (10.7%) | 16 (4.3%) |
Time of Departure to Work by Sex in Del Monte Forest
The most frequent times of departure to work in Del Monte Forest are 7:00 AM to 7:29 AM (130, 29.6%) for males and 8:00 AM to 8:29 AM (81, 21.5%) for females.
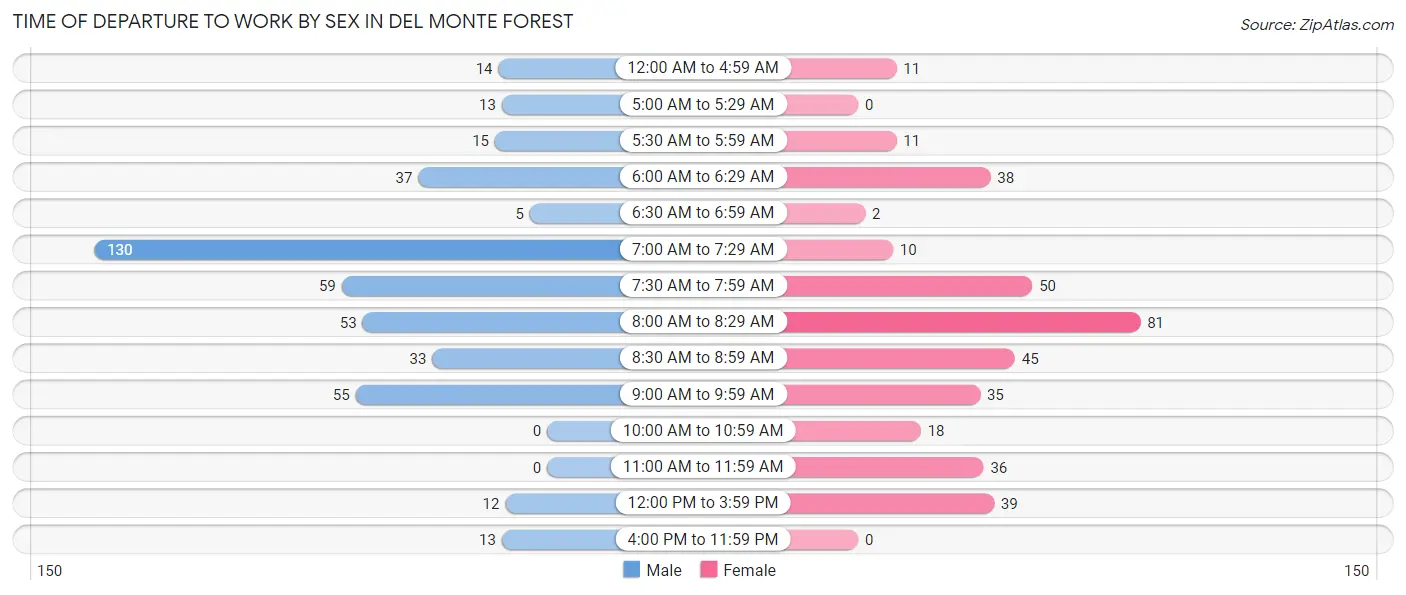
| Time of Departure | Male | Female |
| 12:00 AM to 4:59 AM | 14 (3.2%) | 11 (2.9%) |
| 5:00 AM to 5:29 AM | 13 (3.0%) | 0 (0.0%) |
| 5:30 AM to 5:59 AM | 15 (3.4%) | 11 (2.9%) |
| 6:00 AM to 6:29 AM | 37 (8.4%) | 38 (10.1%) |
| 6:30 AM to 6:59 AM | 5 (1.1%) | 2 (0.5%) |
| 7:00 AM to 7:29 AM | 130 (29.6%) | 10 (2.7%) |
| 7:30 AM to 7:59 AM | 59 (13.4%) | 50 (13.3%) |
| 8:00 AM to 8:29 AM | 53 (12.1%) | 81 (21.5%) |
| 8:30 AM to 8:59 AM | 33 (7.5%) | 45 (12.0%) |
| 9:00 AM to 9:59 AM | 55 (12.5%) | 35 (9.3%) |
| 10:00 AM to 10:59 AM | 0 (0.0%) | 18 (4.8%) |
| 11:00 AM to 11:59 AM | 0 (0.0%) | 36 (9.6%) |
| 12:00 PM to 3:59 PM | 12 (2.7%) | 39 (10.4%) |
| 4:00 PM to 11:59 PM | 13 (3.0%) | 0 (0.0%) |
| Total | 439 (100.0%) | 376 (100.0%) |
Housing Occupancy in Del Monte Forest
Occupancy by Ownership in Del Monte Forest
Of the total 1,582 dwellings in Del Monte Forest, owner-occupied units account for 1,296 (81.9%), while renter-occupied units make up 286 (18.1%).
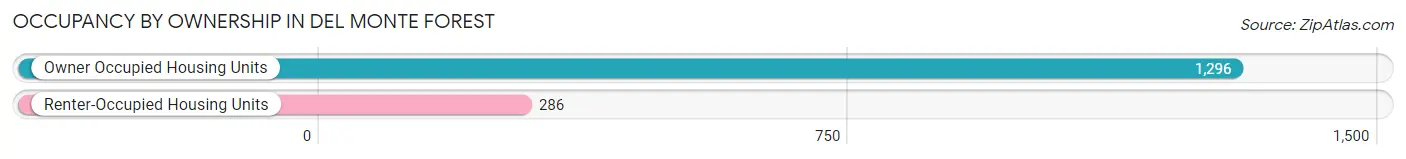
| Occupancy | # Housing Units | % Housing Units |
| Owner Occupied Housing Units | 1,296 | 81.9% |
| Renter-Occupied Housing Units | 286 | 18.1% |
| Total Occupied Housing Units | 1,582 | 100.0% |
Occupancy by Household Size in Del Monte Forest
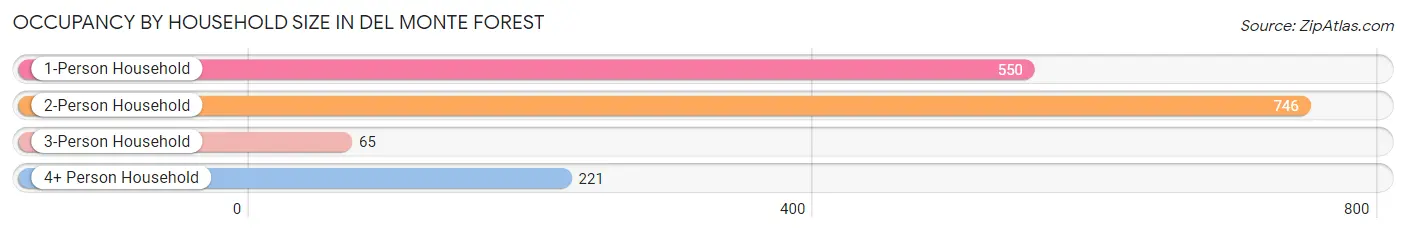
| Household Size | # Housing Units | % Housing Units |
| 1-Person Household | 550 | 34.8% |
| 2-Person Household | 746 | 47.2% |
| 3-Person Household | 65 | 4.1% |
| 4+ Person Household | 221 | 14.0% |
| Total Housing Units | 1,582 | 100.0% |
Occupancy by Ownership by Household Size in Del Monte Forest
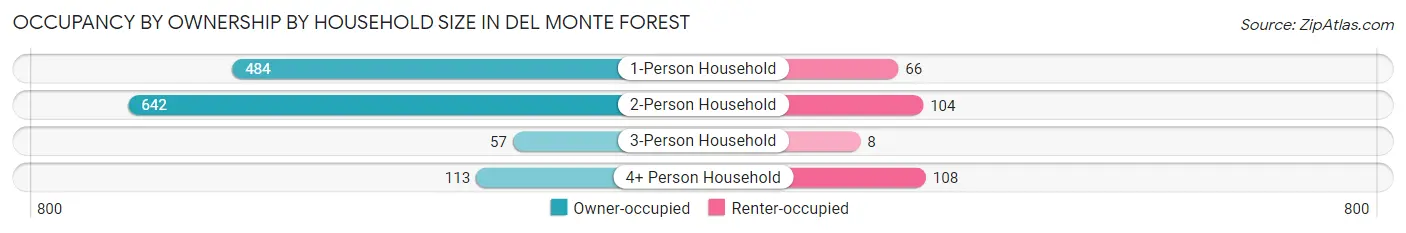
| Household Size | Owner-occupied | Renter-occupied |
| 1-Person Household | 484 (88.0%) | 66 (12.0%) |
| 2-Person Household | 642 (86.1%) | 104 (13.9%) |
| 3-Person Household | 57 (87.7%) | 8 (12.3%) |
| 4+ Person Household | 113 (51.1%) | 108 (48.9%) |
| Total Housing Units | 1,296 (81.9%) | 286 (18.1%) |
Occupancy by Educational Attainment in Del Monte Forest
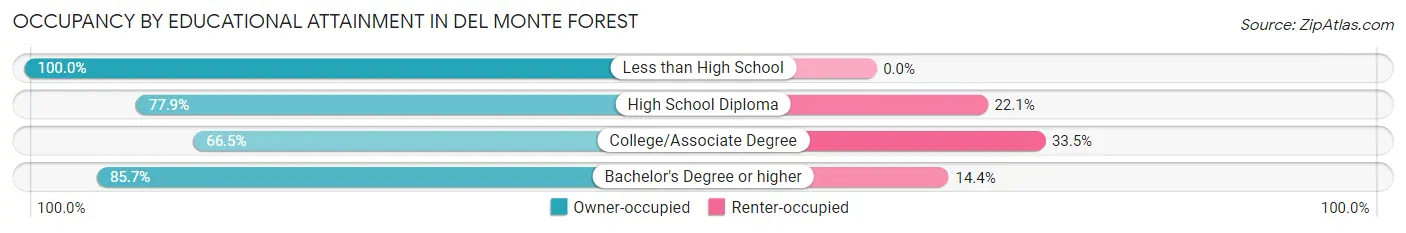
| Household Size | Owner-occupied | Renter-occupied |
| Less than High School | 9 (100.0%) | 0 (0.0%) |
| High School Diploma | 113 (77.9%) | 32 (22.1%) |
| College/Associate Degree | 171 (66.5%) | 86 (33.5%) |
| Bachelor's Degree or higher | 1,003 (85.7%) | 168 (14.3%) |
Occupancy by Age of Householder in Del Monte Forest
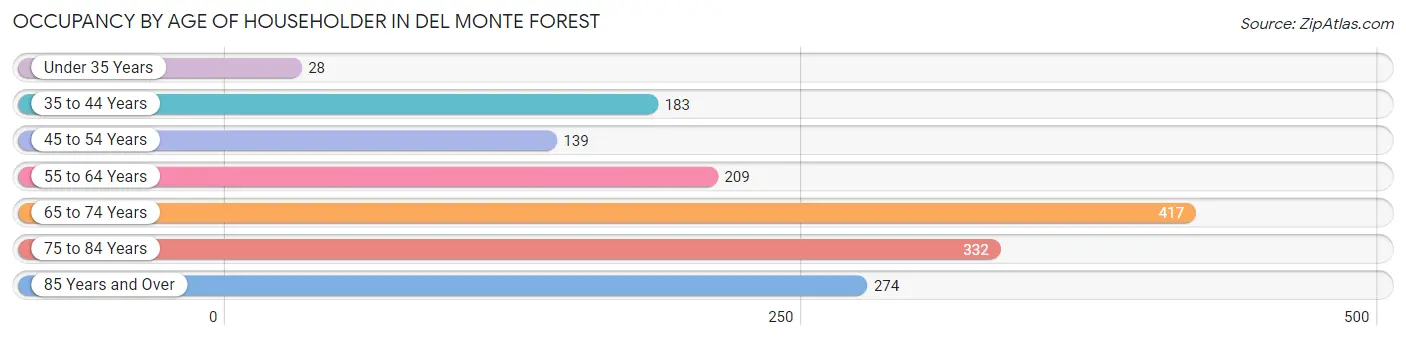
| Age Bracket | # Households | % Households |
| Under 35 Years | 28 | 1.8% |
| 35 to 44 Years | 183 | 11.6% |
| 45 to 54 Years | 139 | 8.8% |
| 55 to 64 Years | 209 | 13.2% |
| 65 to 74 Years | 417 | 26.4% |
| 75 to 84 Years | 332 | 21.0% |
| 85 Years and Over | 274 | 17.3% |
| Total | 1,582 | 100.0% |
Housing Finances in Del Monte Forest
Median Income by Occupancy in Del Monte Forest
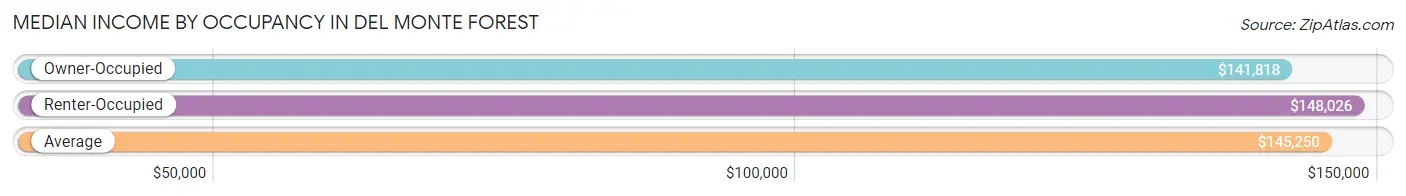
| Occupancy Type | # Households | Median Income |
| Owner-Occupied | 1,296 (81.9%) | $141,818 |
| Renter-Occupied | 286 (18.1%) | $148,026 |
| Average | 1,582 (100.0%) | $145,250 |
Occupancy by Householder Income Bracket in Del Monte Forest
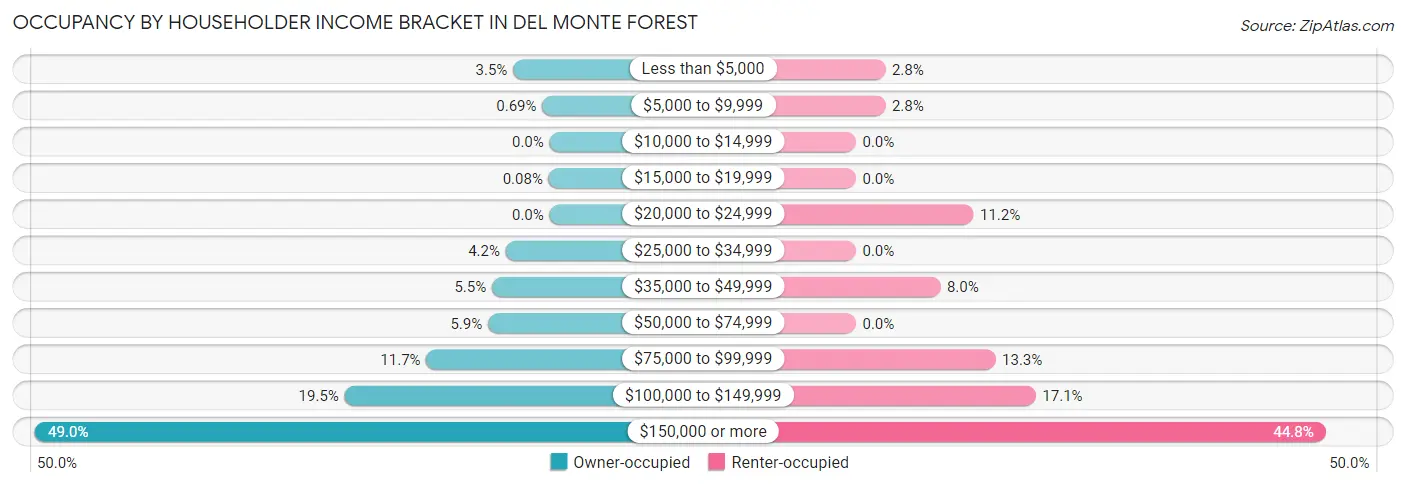
| Income Bracket | Owner-occupied | Renter-occupied |
| Less than $5,000 | 45 (3.5%) | 8 (2.8%) |
| $5,000 to $9,999 | 9 (0.7%) | 8 (2.8%) |
| $10,000 to $14,999 | 0 (0.0%) | 0 (0.0%) |
| $15,000 to $19,999 | 1 (0.1%) | 0 (0.0%) |
| $20,000 to $24,999 | 0 (0.0%) | 32 (11.2%) |
| $25,000 to $34,999 | 54 (4.2%) | 0 (0.0%) |
| $35,000 to $49,999 | 71 (5.5%) | 23 (8.0%) |
| $50,000 to $74,999 | 76 (5.9%) | 0 (0.0%) |
| $75,000 to $99,999 | 152 (11.7%) | 38 (13.3%) |
| $100,000 to $149,999 | 253 (19.5%) | 49 (17.1%) |
| $150,000 or more | 635 (49.0%) | 128 (44.8%) |
| Total | 1,296 (100.0%) | 286 (100.0%) |
Monthly Housing Cost Tiers in Del Monte Forest
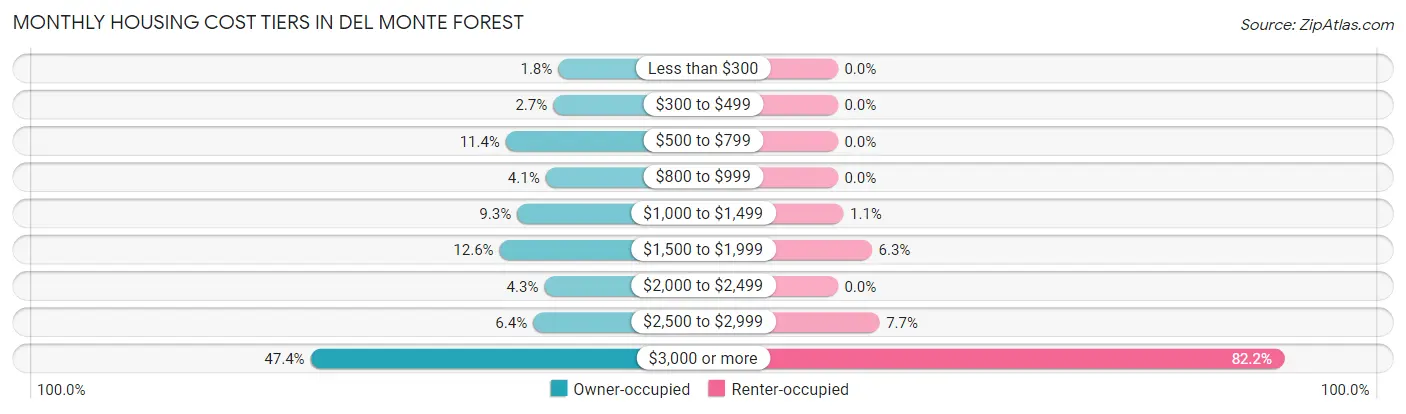
| Monthly Cost | Owner-occupied | Renter-occupied |
| Less than $300 | 23 (1.8%) | 0 (0.0%) |
| $300 to $499 | 35 (2.7%) | 0 (0.0%) |
| $500 to $799 | 148 (11.4%) | 0 (0.0%) |
| $800 to $999 | 53 (4.1%) | 0 (0.0%) |
| $1,000 to $1,499 | 121 (9.3%) | 3 (1.1%) |
| $1,500 to $1,999 | 163 (12.6%) | 18 (6.3%) |
| $2,000 to $2,499 | 56 (4.3%) | 0 (0.0%) |
| $2,500 to $2,999 | 83 (6.4%) | 22 (7.7%) |
| $3,000 or more | 614 (47.4%) | 235 (82.2%) |
| Total | 1,296 (100.0%) | 286 (100.0%) |
Physical Housing Characteristics in Del Monte Forest
Housing Structures in Del Monte Forest
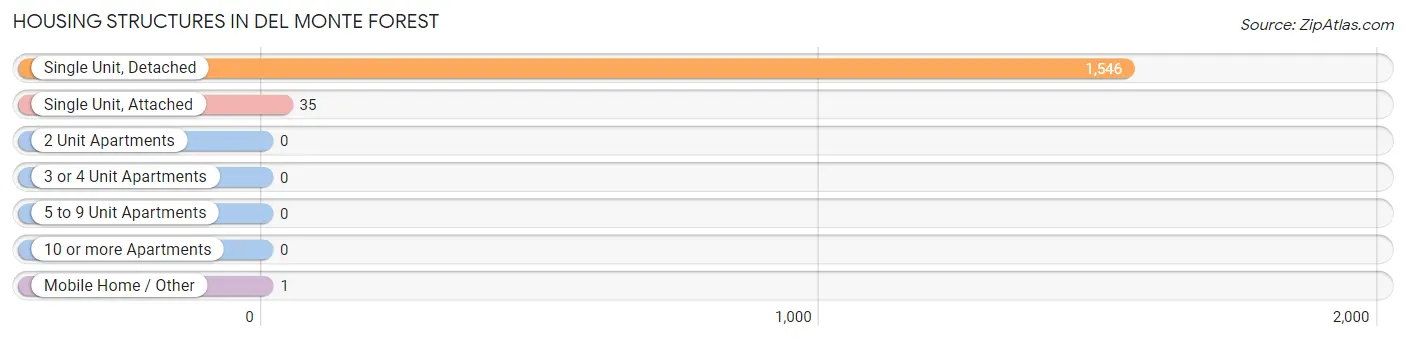
| Structure Type | # Housing Units | % Housing Units |
| Single Unit, Detached | 1,546 | 97.7% |
| Single Unit, Attached | 35 | 2.2% |
| 2 Unit Apartments | 0 | 0.0% |
| 3 or 4 Unit Apartments | 0 | 0.0% |
| 5 to 9 Unit Apartments | 0 | 0.0% |
| 10 or more Apartments | 0 | 0.0% |
| Mobile Home / Other | 1 | 0.1% |
| Total | 1,582 | 100.0% |
Housing Structures by Occupancy in Del Monte Forest
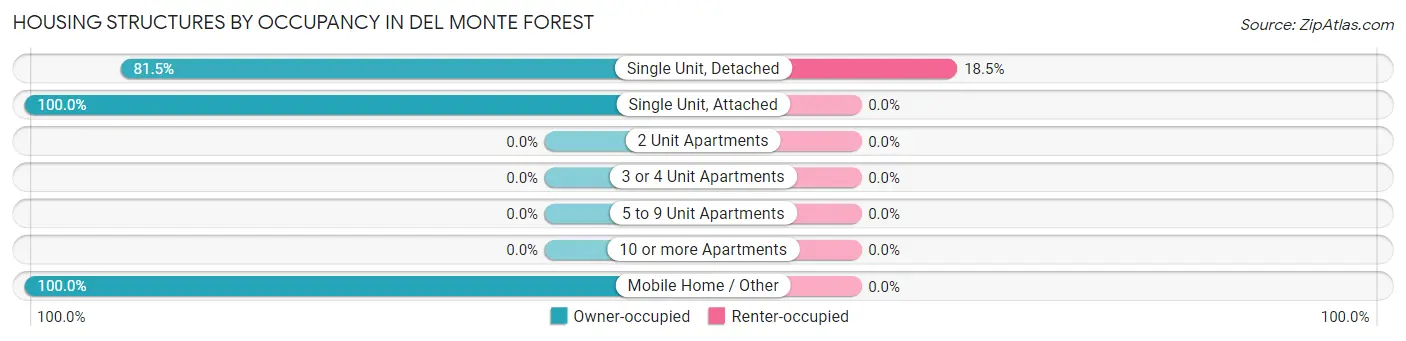
| Structure Type | Owner-occupied | Renter-occupied |
| Single Unit, Detached | 1,260 (81.5%) | 286 (18.5%) |
| Single Unit, Attached | 35 (100.0%) | 0 (0.0%) |
| 2 Unit Apartments | 0 (0.0%) | 0 (0.0%) |
| 3 or 4 Unit Apartments | 0 (0.0%) | 0 (0.0%) |
| 5 to 9 Unit Apartments | 0 (0.0%) | 0 (0.0%) |
| 10 or more Apartments | 0 (0.0%) | 0 (0.0%) |
| Mobile Home / Other | 1 (100.0%) | 0 (0.0%) |
| Total | 1,296 (81.9%) | 286 (18.1%) |
Housing Structures by Number of Rooms in Del Monte Forest
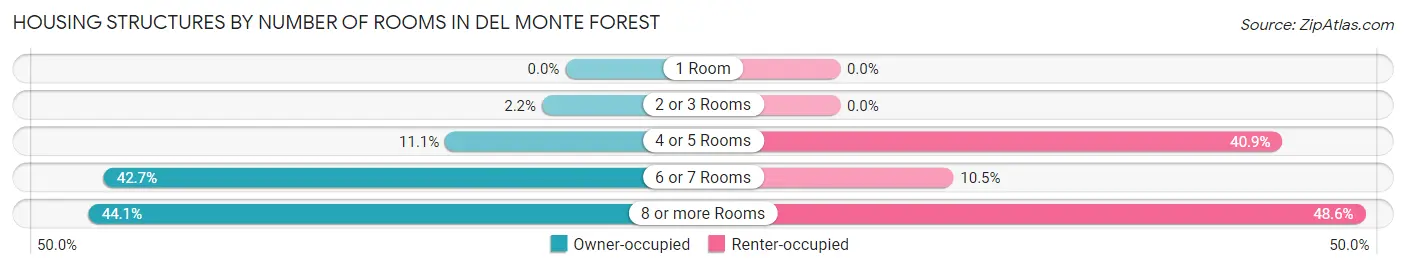
| Number of Rooms | Owner-occupied | Renter-occupied |
| 1 Room | 0 (0.0%) | 0 (0.0%) |
| 2 or 3 Rooms | 28 (2.2%) | 0 (0.0%) |
| 4 or 5 Rooms | 144 (11.1%) | 117 (40.9%) |
| 6 or 7 Rooms | 553 (42.7%) | 30 (10.5%) |
| 8 or more Rooms | 571 (44.1%) | 139 (48.6%) |
| Total | 1,296 (100.0%) | 286 (100.0%) |
Housing Structure by Heating Type in Del Monte Forest
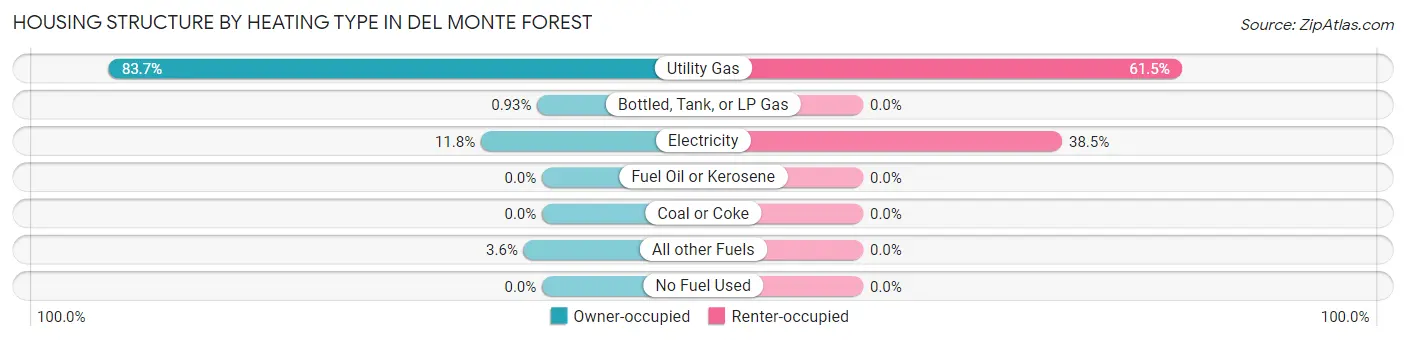
| Heating Type | Owner-occupied | Renter-occupied |
| Utility Gas | 1,085 (83.7%) | 176 (61.5%) |
| Bottled, Tank, or LP Gas | 12 (0.9%) | 0 (0.0%) |
| Electricity | 153 (11.8%) | 110 (38.5%) |
| Fuel Oil or Kerosene | 0 (0.0%) | 0 (0.0%) |
| Coal or Coke | 0 (0.0%) | 0 (0.0%) |
| All other Fuels | 46 (3.5%) | 0 (0.0%) |
| No Fuel Used | 0 (0.0%) | 0 (0.0%) |
| Total | 1,296 (100.0%) | 286 (100.0%) |
Household Vehicle Usage in Del Monte Forest
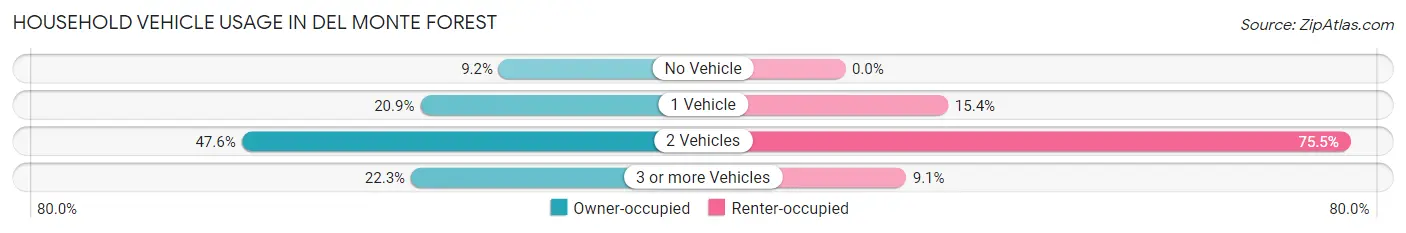
| Vehicles per Household | Owner-occupied | Renter-occupied |
| No Vehicle | 119 (9.2%) | 0 (0.0%) |
| 1 Vehicle | 271 (20.9%) | 44 (15.4%) |
| 2 Vehicles | 617 (47.6%) | 216 (75.5%) |
| 3 or more Vehicles | 289 (22.3%) | 26 (9.1%) |
| Total | 1,296 (100.0%) | 286 (100.0%) |
Real Estate & Mortgages in Del Monte Forest
Real Estate and Mortgage Overview in Del Monte Forest
| Characteristic | Without Mortgage | With Mortgage |
| Housing Units | 646 | 650 |
| Median Property Value | $1,689,100 | $1,498,600 |
| Median Household Income | $103,984 | $419 |
| Monthly Housing Costs | $1,430 | $539 |
| Real Estate Taxes | $6,227 | $10 |
Property Value by Mortgage Status in Del Monte Forest
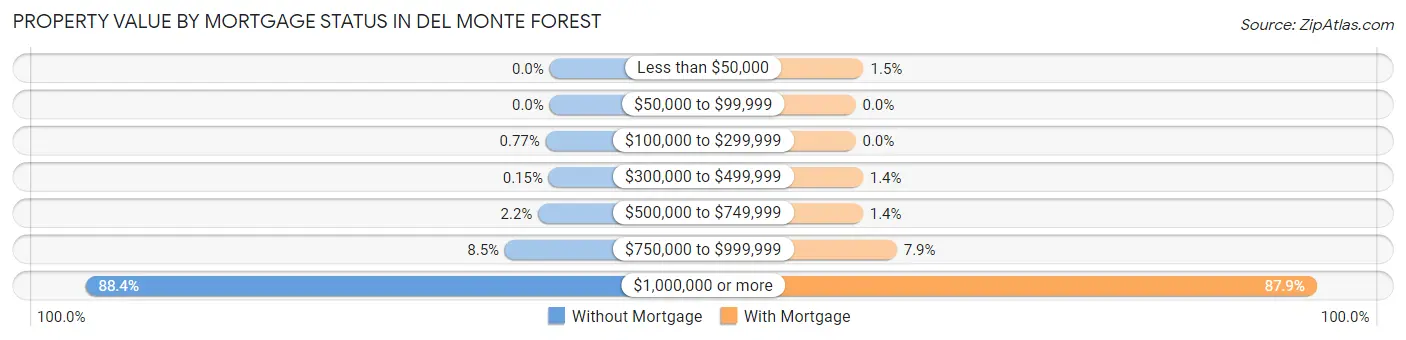
| Property Value | Without Mortgage | With Mortgage |
| Less than $50,000 | 0 (0.0%) | 10 (1.5%) |
| $50,000 to $99,999 | 0 (0.0%) | 0 (0.0%) |
| $100,000 to $299,999 | 5 (0.8%) | 0 (0.0%) |
| $300,000 to $499,999 | 1 (0.2%) | 9 (1.4%) |
| $500,000 to $749,999 | 14 (2.2%) | 9 (1.4%) |
| $750,000 to $999,999 | 55 (8.5%) | 51 (7.9%) |
| $1,000,000 or more | 571 (88.4%) | 571 (87.8%) |
| Total | 646 (100.0%) | 650 (100.0%) |
Household Income by Mortgage Status in Del Monte Forest
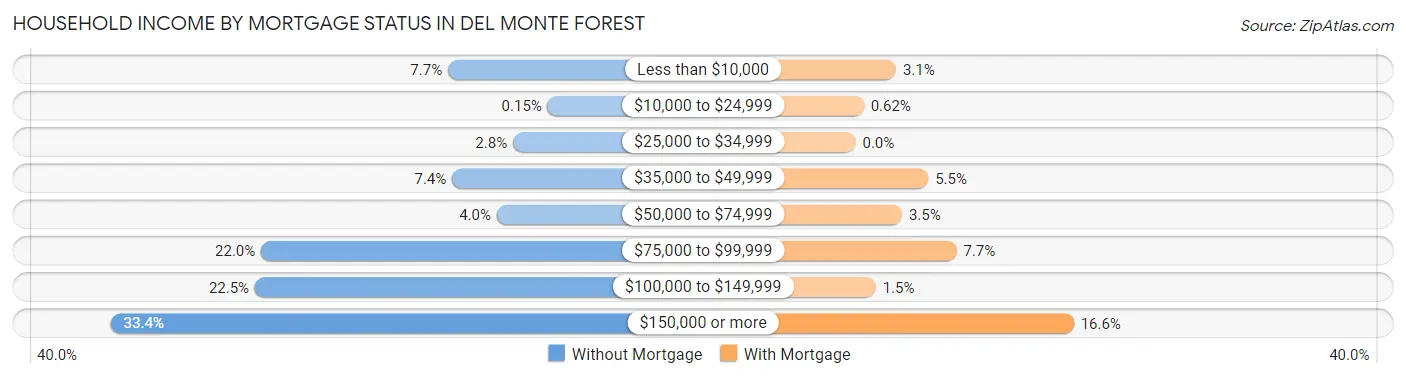
| Household Income | Without Mortgage | With Mortgage |
| Less than $10,000 | 50 (7.7%) | 20 (3.1%) |
| $10,000 to $24,999 | 1 (0.2%) | 4 (0.6%) |
| $25,000 to $34,999 | 18 (2.8%) | 0 (0.0%) |
| $35,000 to $49,999 | 48 (7.4%) | 36 (5.5%) |
| $50,000 to $74,999 | 26 (4.0%) | 23 (3.5%) |
| $75,000 to $99,999 | 142 (22.0%) | 50 (7.7%) |
| $100,000 to $149,999 | 145 (22.5%) | 10 (1.5%) |
| $150,000 or more | 216 (33.4%) | 108 (16.6%) |
| Total | 646 (100.0%) | 650 (100.0%) |
Property Value to Household Income Ratio in Del Monte Forest
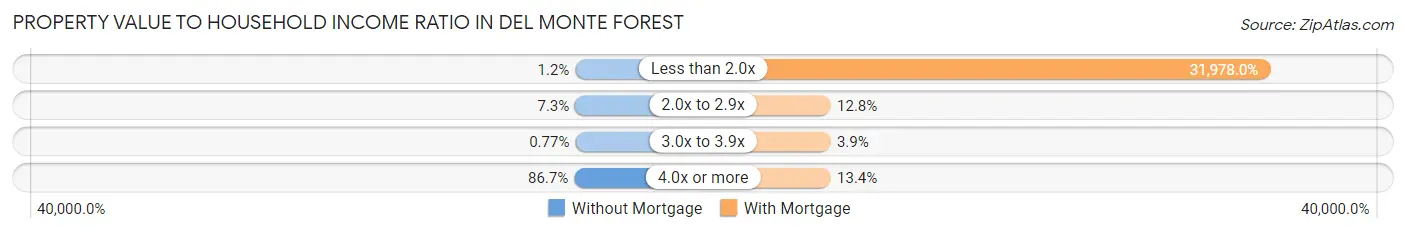
| Value-to-Income Ratio | Without Mortgage | With Mortgage |
| Less than 2.0x | 8 (1.2%) | 207,857 (31,978.0%) |
| 2.0x to 2.9x | 47 (7.3%) | 83 (12.8%) |
| 3.0x to 3.9x | 5 (0.8%) | 25 (3.8%) |
| 4.0x or more | 560 (86.7%) | 87 (13.4%) |
| Total | 646 (100.0%) | 650 (100.0%) |
Real Estate Taxes by Mortgage Status in Del Monte Forest
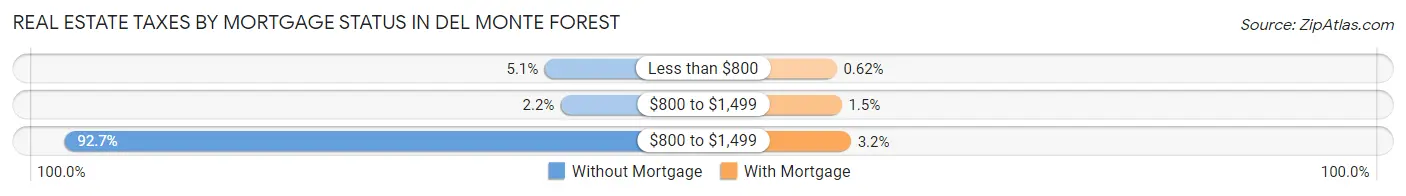
| Property Taxes | Without Mortgage | With Mortgage |
| Less than $800 | 33 (5.1%) | 4 (0.6%) |
| $800 to $1,499 | 14 (2.2%) | 10 (1.5%) |
| $800 to $1,499 | 599 (92.7%) | 21 (3.2%) |
| Total | 646 (100.0%) | 650 (100.0%) |
Health & Disability in Del Monte Forest
Health Insurance Coverage by Age in Del Monte Forest
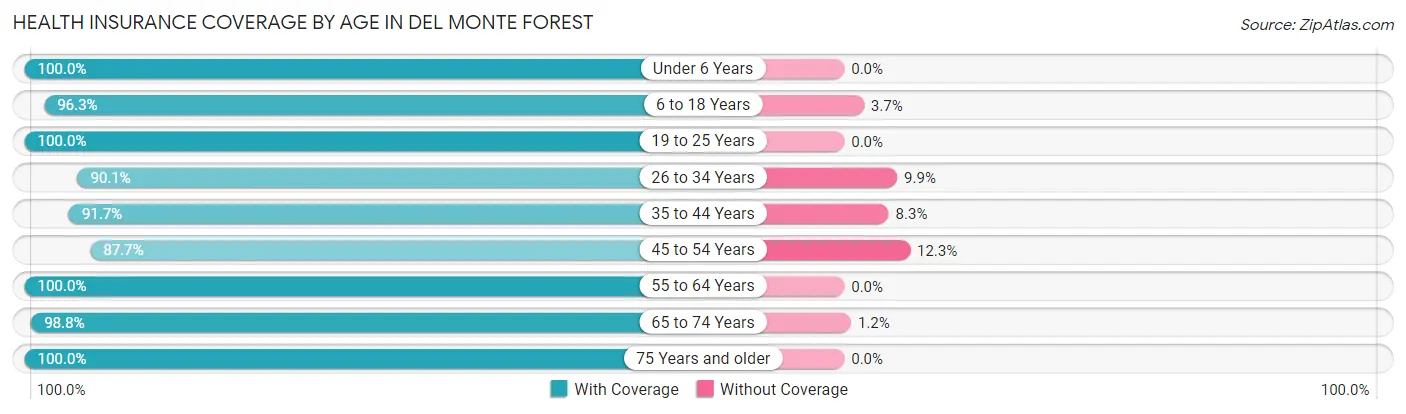
| Age Bracket | With Coverage | Without Coverage |
| Under 6 Years | 134 (100.0%) | 0 (0.0%) |
| 6 to 18 Years | 342 (96.3%) | 13 (3.7%) |
| 19 to 25 Years | 217 (100.0%) | 0 (0.0%) |
| 26 to 34 Years | 128 (90.1%) | 14 (9.9%) |
| 35 to 44 Years | 244 (91.7%) | 22 (8.3%) |
| 45 to 54 Years | 229 (87.7%) | 32 (12.3%) |
| 55 to 64 Years | 381 (100.0%) | 0 (0.0%) |
| 65 to 74 Years | 794 (98.8%) | 10 (1.2%) |
| 75 Years and older | 783 (100.0%) | 0 (0.0%) |
| Total | 3,252 (97.3%) | 91 (2.7%) |
Health Insurance Coverage by Citizenship Status in Del Monte Forest
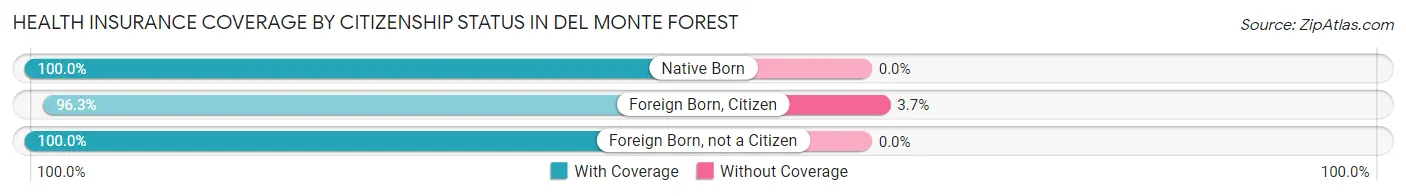
| Citizenship Status | With Coverage | Without Coverage |
| Native Born | 134 (100.0%) | 0 (0.0%) |
| Foreign Born, Citizen | 342 (96.3%) | 13 (3.7%) |
| Foreign Born, not a Citizen | 217 (100.0%) | 0 (0.0%) |
Health Insurance Coverage by Household Income in Del Monte Forest
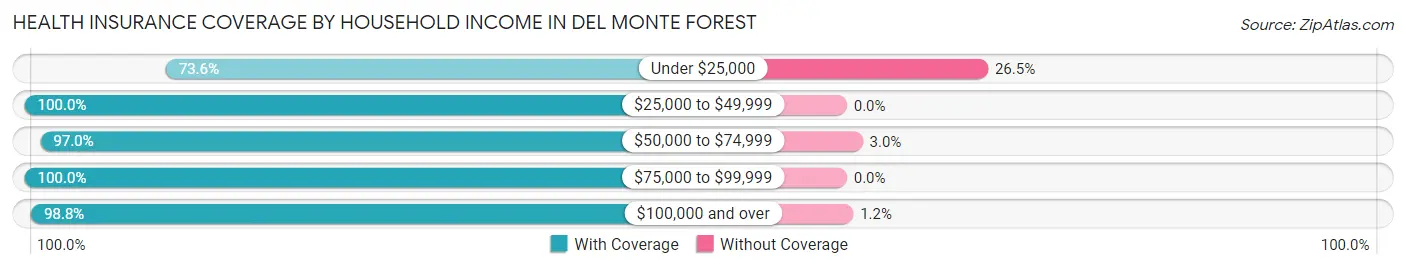
| Household Income | With Coverage | Without Coverage |
| Under $25,000 | 89 (73.6%) | 32 (26.5%) |
| $25,000 to $49,999 | 203 (100.0%) | 0 (0.0%) |
| $50,000 to $74,999 | 197 (97.0%) | 6 (3.0%) |
| $75,000 to $99,999 | 367 (100.0%) | 0 (0.0%) |
| $100,000 and over | 2,220 (98.8%) | 27 (1.2%) |
Public vs Private Health Insurance Coverage by Age in Del Monte Forest
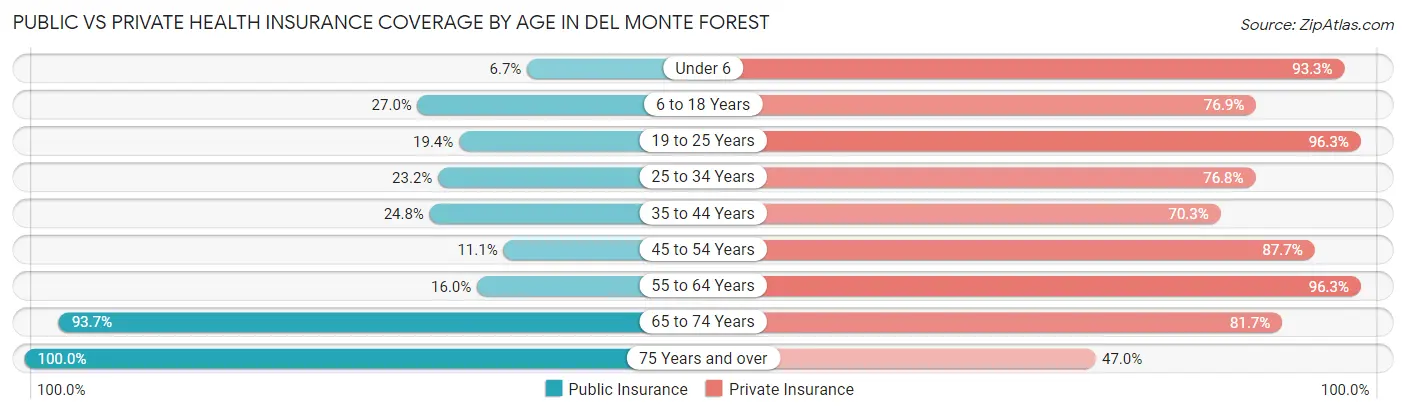
| Age Bracket | Public Insurance | Private Insurance |
| Under 6 | 9 (6.7%) | 125 (93.3%) |
| 6 to 18 Years | 96 (27.0%) | 273 (76.9%) |
| 19 to 25 Years | 42 (19.4%) | 209 (96.3%) |
| 25 to 34 Years | 33 (23.2%) | 109 (76.8%) |
| 35 to 44 Years | 66 (24.8%) | 187 (70.3%) |
| 45 to 54 Years | 29 (11.1%) | 229 (87.7%) |
| 55 to 64 Years | 61 (16.0%) | 367 (96.3%) |
| 65 to 74 Years | 753 (93.7%) | 657 (81.7%) |
| 75 Years and over | 783 (100.0%) | 368 (47.0%) |
| Total | 1,872 (56.0%) | 2,524 (75.5%) |
Disability Status by Sex by Age in Del Monte Forest
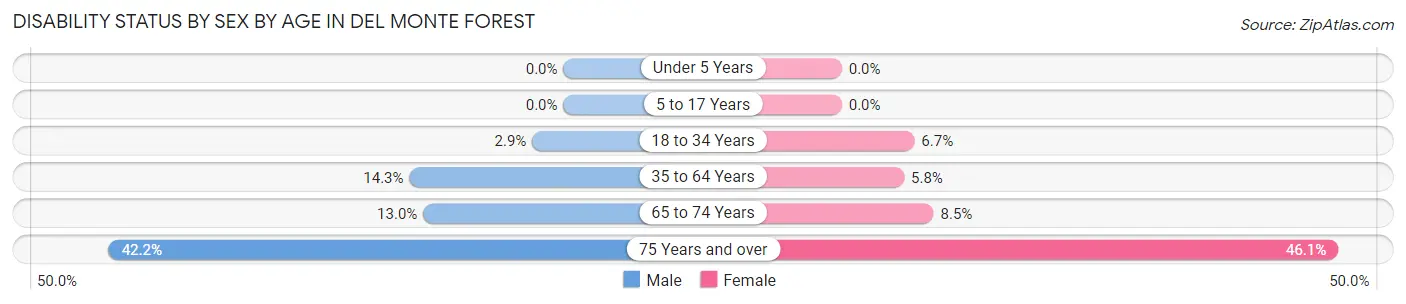
| Age Bracket | Male | Female |
| Under 5 Years | 0 (0.0%) | 0 (0.0%) |
| 5 to 17 Years | 0 (0.0%) | 0 (0.0%) |
| 18 to 34 Years | 5 (2.9%) | 13 (6.7%) |
| 35 to 64 Years | 63 (14.3%) | 27 (5.8%) |
| 65 to 74 Years | 45 (13.0%) | 39 (8.5%) |
| 75 Years and over | 181 (42.2%) | 163 (46.1%) |
Disability Class by Sex by Age in Del Monte Forest
Disability Class: Hearing Difficulty
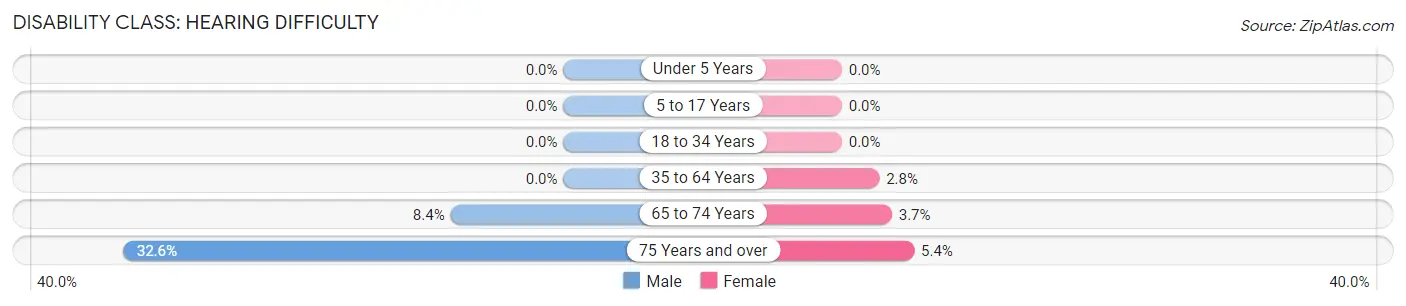
| Age Bracket | Male | Female |
| Under 5 Years | 0 (0.0%) | 0 (0.0%) |
| 5 to 17 Years | 0 (0.0%) | 0 (0.0%) |
| 18 to 34 Years | 0 (0.0%) | 0 (0.0%) |
| 35 to 64 Years | 0 (0.0%) | 13 (2.8%) |
| 65 to 74 Years | 29 (8.4%) | 17 (3.7%) |
| 75 Years and over | 140 (32.6%) | 19 (5.4%) |
Disability Class: Vision Difficulty
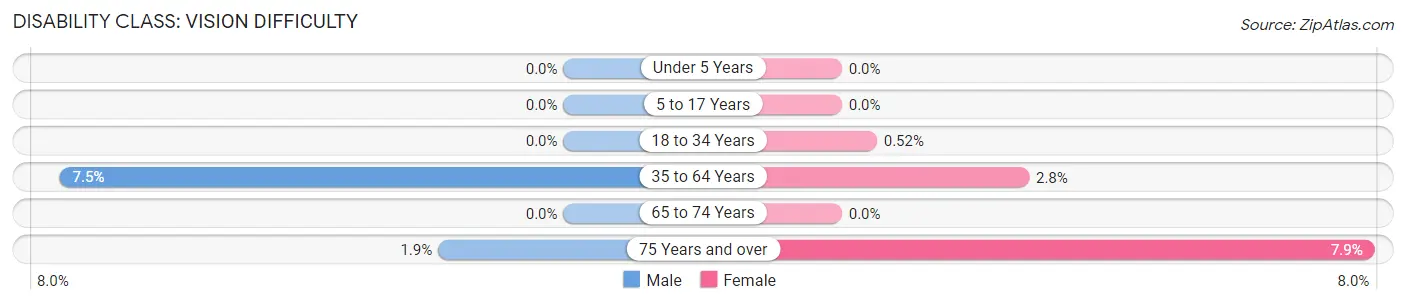
| Age Bracket | Male | Female |
| Under 5 Years | 0 (0.0%) | 0 (0.0%) |
| 5 to 17 Years | 0 (0.0%) | 0 (0.0%) |
| 18 to 34 Years | 0 (0.0%) | 1 (0.5%) |
| 35 to 64 Years | 33 (7.5%) | 13 (2.8%) |
| 65 to 74 Years | 0 (0.0%) | 0 (0.0%) |
| 75 Years and over | 8 (1.9%) | 28 (7.9%) |
Disability Class: Cognitive Difficulty
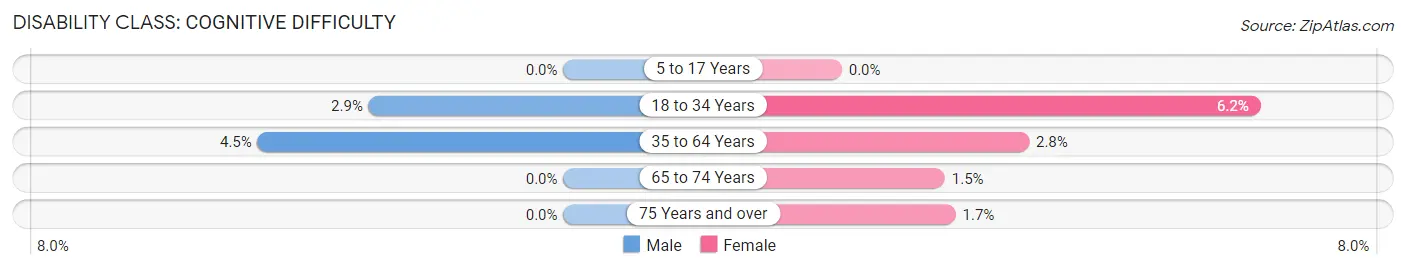
| Age Bracket | Male | Female |
| 5 to 17 Years | 0 (0.0%) | 0 (0.0%) |
| 18 to 34 Years | 5 (2.9%) | 12 (6.2%) |
| 35 to 64 Years | 20 (4.5%) | 13 (2.8%) |
| 65 to 74 Years | 0 (0.0%) | 7 (1.5%) |
| 75 Years and over | 0 (0.0%) | 6 (1.7%) |
Disability Class: Ambulatory Difficulty
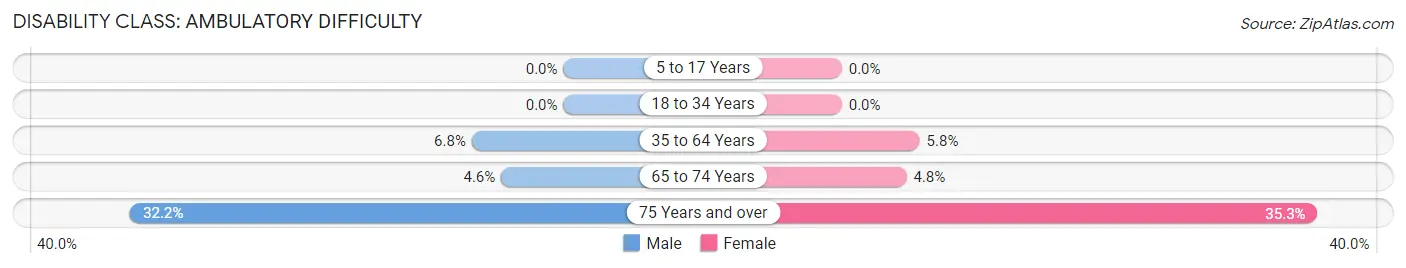
| Age Bracket | Male | Female |
| 5 to 17 Years | 0 (0.0%) | 0 (0.0%) |
| 18 to 34 Years | 0 (0.0%) | 0 (0.0%) |
| 35 to 64 Years | 30 (6.8%) | 27 (5.8%) |
| 65 to 74 Years | 16 (4.6%) | 22 (4.8%) |
| 75 Years and over | 138 (32.2%) | 125 (35.3%) |
Disability Class: Self-Care Difficulty
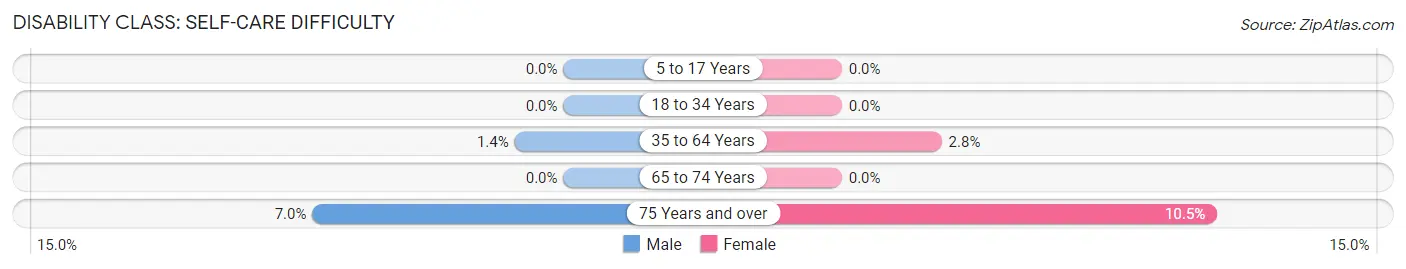
| Age Bracket | Male | Female |
| 5 to 17 Years | 0 (0.0%) | 0 (0.0%) |
| 18 to 34 Years | 0 (0.0%) | 0 (0.0%) |
| 35 to 64 Years | 6 (1.4%) | 13 (2.8%) |
| 65 to 74 Years | 0 (0.0%) | 0 (0.0%) |
| 75 Years and over | 30 (7.0%) | 37 (10.4%) |
Technology Access in Del Monte Forest
Computing Device Access in Del Monte Forest
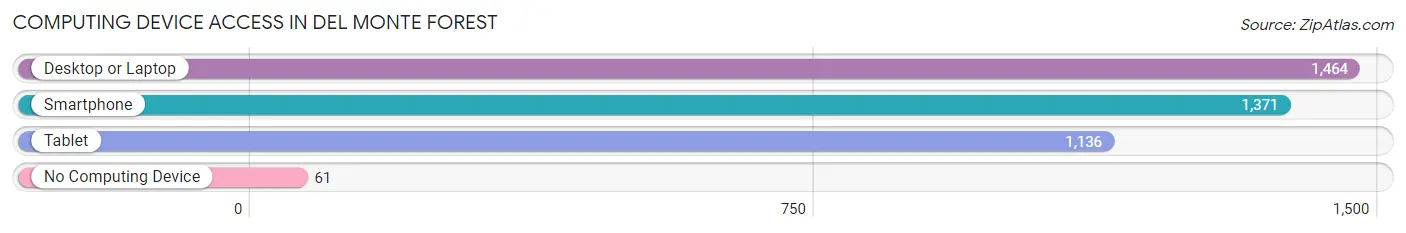
| Device Type | # Households | % Households |
| Desktop or Laptop | 1,464 | 92.5% |
| Smartphone | 1,371 | 86.7% |
| Tablet | 1,136 | 71.8% |
| No Computing Device | 61 | 3.9% |
| Total | 1,582 | 100.0% |
Internet Access in Del Monte Forest
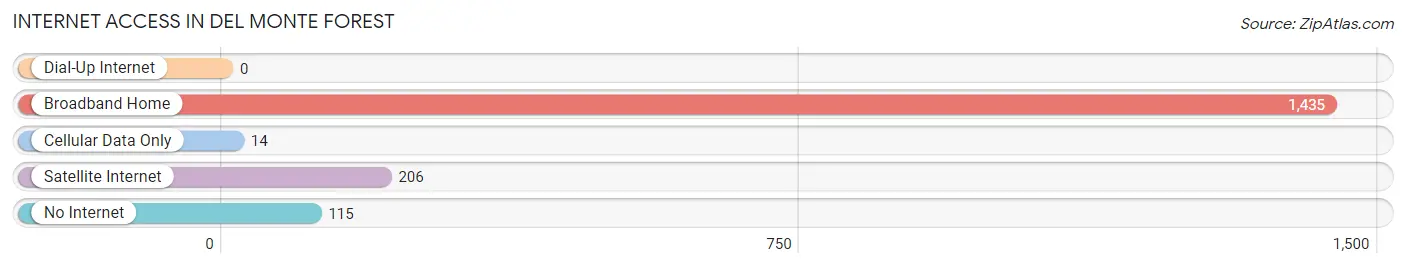
| Internet Type | # Households | % Households |
| Dial-Up Internet | 0 | 0.0% |
| Broadband Home | 1,435 | 90.7% |
| Cellular Data Only | 14 | 0.9% |
| Satellite Internet | 206 | 13.0% |
| No Internet | 115 | 7.3% |
| Total | 1,582 | 100.0% |
Del Monte Forest Summary
Del Monte Forest is a census-designated place (CDP) located in Monterey County, California, United States. It is situated on the Monterey Peninsula, between the cities of Monterey and Carmel-by-the-Sea. As of the 2010 census, the population of Del Monte Forest was 1,890.
History
Del Monte Forest was originally inhabited by the Ohlone people, who lived in the area for thousands of years before the arrival of Europeans. The first Europeans to settle in the area were Spanish missionaries, who established the nearby Mission San Carlos Borromeo de Carmelo in 1770.
In the late 19th century, the area was developed as a resort destination, with the Del Monte Hotel opening in 1880. The hotel was a popular destination for wealthy San Franciscans, who would come to the area to enjoy the mild climate and scenic beauty.
In the early 20th century, the area was developed as a residential community, with the Del Monte Forest subdivision being established in the 1920s. The area was incorporated as a city in 1929, but was later annexed by the city of Monterey in 1959.
Geography
Del Monte Forest is located at 36°35'25"N 121°54'17"W (36.590278, -121.904722). It has an area of 2.3 square miles (6.0 km2), all of which is land.
The CDP is located on the Monterey Peninsula, between the cities of Monterey and Carmel-by-the-Sea. It is bordered to the north by the city of Monterey, to the east by the city of Pacific Grove, to the south by the city of Carmel-by-the-Sea, and to the west by the Pacific Ocean.
Economy
The economy of Del Monte Forest is largely based on tourism and real estate. The area is home to several luxury resorts, including the Del Monte Lodge and the Hyatt Regency Monterey. The area is also home to several golf courses, including the Del Monte Golf Course and the Monterey Peninsula Country Club.
The area is also home to several high-end residential communities, including the Del Monte Forest subdivision and the Del Monte Estates. These communities are popular with wealthy retirees and second-home owners.
Demographics
As of the 2010 census, there were 1,890 people, 845 households, and 517 families residing in the CDP. The population density was 817.3 people per square mile (315.7/km2). There were 945 housing units at an average density of 409.7 per square mile (158.2/km2). The racial makeup of the CDP was 87.2% White, 0.9% African American, 0.7% Native American, 5.2% Asian, 0.1% Pacific Islander, 2.7% from other races, and 3.2% from two or more races. Hispanic or Latino of any race were 8.2% of the population.
There were 845 households, out of which 19.2% had children under the age of 18 living with them, 51.2% were married couples living together, 6.2% had a female householder with no husband present, and 39.2% were non-families. 33.2% of all households were made up of individuals, and 14.2% had someone living alone who was 65 years of age or older. The average household size was 2.23 and the average family size was 2.86.
In the CDP, the population was spread out, with 17.2% under the age of 18, 4.2% from 18 to 24, 22.2% from 25 to 44, 33.2% from 45 to 64, and 23.2% who were 65 years of age or older. The median age was 49 years. For every 100 females, there were 94.2 males. For every 100 females age 18 and over, there were 91.2 males.
The median income for a household in the CDP was $76,944, and the median income for a family was $90,000. Males had a median income of $60,000 versus $45,000 for females. The per capita income for the CDP was $45,945. About 3.2% of families and 5.2% of the population were below the poverty line, including 6.2% of those under age 18 and 4.2% of those age 65 or over.
Common Questions
What is Per Capita Income in Del Monte Forest?
Per Capita income in Del Monte Forest is $119,263.
What is the Median Family Income in Del Monte Forest?
Median Family Income in Del Monte Forest is $161,583.
What is the Median Household income in Del Monte Forest?
Median Household Income in Del Monte Forest is $145,250.
What is Income or Wage Gap in Del Monte Forest?
Income or Wage Gap in Del Monte Forest is 11.8%.
Women in Del Monte Forest earn 88.2 cents for every dollar earned by a man.
What is Inequality or Gini Index in Del Monte Forest?
Inequality or Gini Index in Del Monte Forest is 0.55.
What is the Total Population of Del Monte Forest?
Total Population of Del Monte Forest is 3,416.
What is the Total Male Population of Del Monte Forest?
Total Male Population of Del Monte Forest is 1,648.
What is the Total Female Population of Del Monte Forest?
Total Female Population of Del Monte Forest is 1,768.
What is the Ratio of Males per 100 Females in Del Monte Forest?
There are 93.21 Males per 100 Females in Del Monte Forest.
What is the Ratio of Females per 100 Males in Del Monte Forest?
There are 107.28 Females per 100 Males in Del Monte Forest.
What is the Median Population Age in Del Monte Forest?
Median Population Age in Del Monte Forest is 61.8 Years.
What is the Average Family Size in Del Monte Forest
Average Family Size in Del Monte Forest is 2.5 People.
What is the Average Household Size in Del Monte Forest
Average Household Size in Del Monte Forest is 2.0 People.
How Large is the Labor Force in Del Monte Forest?
There are 1,212 People in the Labor Forcein in Del Monte Forest.
What is the Percentage of People in the Labor Force in Del Monte Forest?
40.6% of People are in the Labor Force in Del Monte Forest.
What is the Unemployment Rate in Del Monte Forest?
Unemployment Rate in Del Monte Forest is 5.1%.