Cities with the Lowest Percentage of Births to Unmarried Women over the Age of 35 in the United States
RELATED REPORTS & OPTIONS
Lowest Illegitimacy | Women 35+
United States
Compare Cities
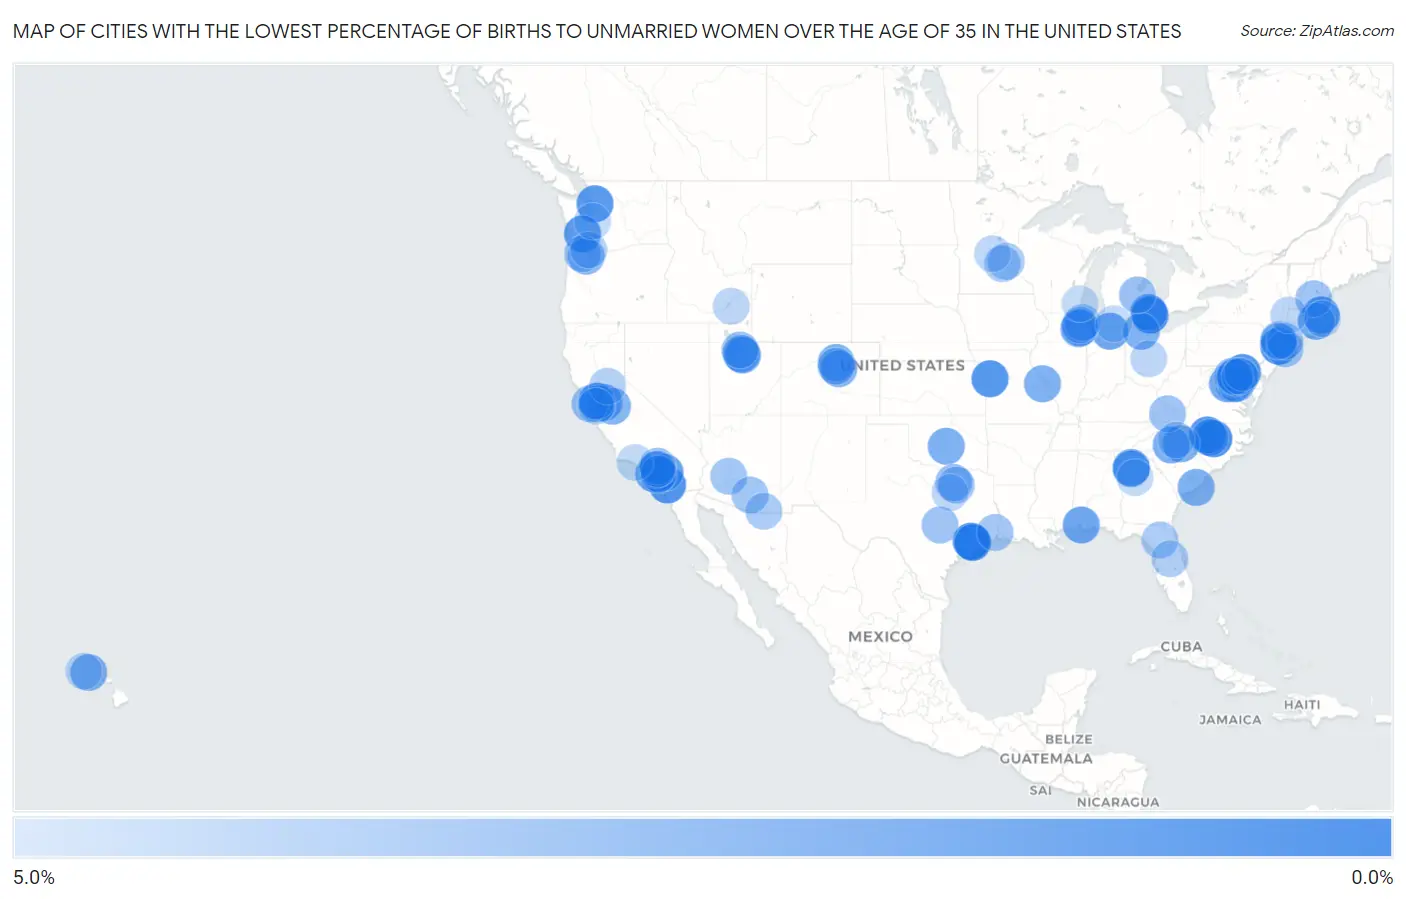
Map of Cities with the Lowest Percentage of Births to Unmarried Women over the Age of 35 in the United States
5.0%
0.0%
Cities with the Lowest Percentage of Births to Unmarried Women over the Age of 35 in the United States
| City | % Unmarried | vs State | vs National | |
| 1. | Sugar Land | 0.20% | 19.4%(-19.2)#1 | 20.1%(-19.9)#1 |
| 2. | Hamtramck | 0.40% | 20.9%(-20.5)#1 | 20.1%(-19.7)#2 |
| 3. | Garner | 0.70% | 19.1%(-18.4)#1 | 20.1%(-19.4)#3 |
| 4. | Union City | 0.80% | 17.5%(-16.7)#1 | 20.1%(-19.3)#4 |
| 5. | Poway | 1.0% | 19.8%(-18.8)#1 | 20.1%(-19.1)#5 |
| 6. | Missouri City | 1.1% | 19.4%(-18.3)#2 | 20.1%(-19.0)#6 |
| 7. | Chapel Hill | 1.1% | 19.1%(-18.0)#2 | 20.1%(-19.0)#7 |
| 8. | Blue Springs | 1.1% | 19.2%(-18.1)#1 | 20.1%(-19.0)#8 |
| 9. | Everett | 1.2% | 15.4%(-14.2)#1 | 20.1%(-18.9)#9 |
| 10. | Winlock | 1.2% | 15.4%(-14.2)#2 | 20.1%(-18.9)#10 |
| 11. | Malden | 1.3% | 14.4%(-13.1)#1 | 20.1%(-18.8)#11 |
| 12. | Costa Mesa | 1.7% | 19.8%(-18.1)#2 | 20.1%(-18.4)#12 |
| 13. | Menifee | 1.7% | 19.8%(-18.1)#3 | 20.1%(-18.4)#13 |
| 14. | Roswell | 1.7% | 22.7%(-21.0)#1 | 20.1%(-18.4)#14 |
| 15. | Odenton | 1.7% | 19.5%(-17.8)#1 | 20.1%(-18.4)#15 |
| 16. | Newington | 1.7% | 16.7%(-15.0)#1 | 20.1%(-18.4)#16 |
| 17. | Kingston Borough | 1.7% | 19.9%(-18.2)#1 | 20.1%(-18.4)#17 |
| 18. | San Ramon | 1.8% | 19.8%(-18.0)#4 | 20.1%(-18.3)#18 |
| 19. | Aliso Viejo | 1.8% | 19.8%(-18.0)#5 | 20.1%(-18.3)#19 |
| 20. | Goshen | 1.9% | 22.1%(-20.2)#1 | 20.1%(-18.2)#20 |
| 21. | Franklin Town | 1.9% | 14.4%(-12.5)#2 | 20.1%(-18.2)#21 |
| 22. | Daphne | 1.9% | 22.4%(-20.5)#1 | 20.1%(-18.2)#22 |
| 23. | Cary | 2.1% | 19.1%(-17.0)#3 | 20.1%(-18.0)#23 |
| 24. | Linton Hall | 2.1% | 16.7%(-14.6)#2 | 20.1%(-18.0)#24 |
| 25. | Tracy | 2.2% | 19.8%(-17.6)#6 | 20.1%(-17.9)#25 |
| 26. | Troy | 2.2% | 20.9%(-18.7)#2 | 20.1%(-17.9)#26 |
| 27. | Yorba Linda | 2.2% | 19.8%(-17.6)#7 | 20.1%(-17.9)#27 |
| 28. | American Fork | 2.2% | 11.4%(-9.20)#1 | 20.1%(-17.9)#28 |
| 29. | Edgewater Borough | 2.2% | 17.5%(-15.3)#2 | 20.1%(-17.9)#29 |
| 30. | Overlea | 2.2% | 19.5%(-17.3)#2 | 20.1%(-17.9)#30 |
| 31. | Norman | 2.3% | 22.0%(-19.7)#1 | 20.1%(-17.8)#31 |
| 32. | Mount Pleasant | 2.3% | 25.7%(-23.4)#1 | 20.1%(-17.8)#32 |
| 33. | Huntersville | 2.3% | 19.1%(-16.8)#4 | 20.1%(-17.8)#33 |
| 34. | Downers Grove | 2.3% | 19.2%(-16.9)#1 | 20.1%(-17.8)#34 |
| 35. | Shelby | 2.3% | 19.1%(-16.8)#5 | 20.1%(-17.8)#35 |
| 36. | Westminster | 2.4% | 15.3%(-12.9)#1 | 20.1%(-17.7)#36 |
| 37. | Orem | 2.4% | 11.4%(-9.00)#2 | 20.1%(-17.7)#37 |
| 38. | St Peters | 2.4% | 19.2%(-16.8)#2 | 20.1%(-17.7)#38 |
| 39. | East Honolulu | 2.4% | 18.3%(-15.9)#1 | 20.1%(-17.7)#39 |
| 40. | Maumee | 2.4% | 20.4%(-18.0)#1 | 20.1%(-17.7)#40 |
| 41. | Highlands Ranch | 2.5% | 15.3%(-12.8)#2 | 20.1%(-17.6)#41 |
| 42. | Turlock | 2.6% | 19.8%(-17.2)#8 | 20.1%(-17.5)#42 |
| 43. | Potomac | 2.6% | 19.5%(-16.9)#3 | 20.1%(-17.5)#43 |
| 44. | Bolingbrook | 2.7% | 19.2%(-16.5)#2 | 20.1%(-17.4)#44 |
| 45. | Spring Valley | 2.7% | 18.7%(-16.0)#1 | 20.1%(-17.4)#45 |
| 46. | Sandy Springs | 2.8% | 22.7%(-19.9)#2 | 20.1%(-17.3)#46 |
| 47. | Gaithersburg | 2.8% | 19.5%(-16.7)#4 | 20.1%(-17.3)#47 |
| 48. | Lake Oswego | 2.8% | 16.9%(-14.1)#1 | 20.1%(-17.3)#48 |
| 49. | Pleasanton | 3.0% | 19.8%(-16.8)#9 | 20.1%(-17.1)#49 |
| 50. | Frisco | 3.2% | 19.4%(-16.2)#3 | 20.1%(-16.9)#50 |
| 51. | Lakewood | 3.2% | 15.3%(-12.1)#3 | 20.1%(-16.9)#51 |
| 52. | Daly City | 3.2% | 19.8%(-16.6)#10 | 20.1%(-16.9)#52 |
| 53. | Saginaw | 3.2% | 20.9%(-17.7)#3 | 20.1%(-16.9)#53 |
| 54. | Claremont | 3.3% | 19.8%(-16.5)#11 | 20.1%(-16.8)#54 |
| 55. | Richardson | 3.4% | 19.4%(-16.0)#4 | 20.1%(-16.7)#55 |
| 56. | Sandy | 3.4% | 11.4%(-8.00)#3 | 20.1%(-16.7)#56 |
| 57. | Leander | 3.4% | 19.4%(-16.0)#5 | 20.1%(-16.7)#57 |
| 58. | Concord | 3.4% | 18.1%(-14.7)#1 | 20.1%(-16.7)#58 |
| 59. | Merrick | 3.4% | 18.7%(-15.3)#2 | 20.1%(-16.7)#59 |
| 60. | Somerville Borough | 3.4% | 17.5%(-14.1)#3 | 20.1%(-16.7)#60 |
| 61. | Richlands | 3.4% | 16.7%(-13.3)#3 | 20.1%(-16.7)#61 |
| 62. | Buckeye | 3.5% | 23.9%(-20.4)#1 | 20.1%(-16.6)#62 |
| 63. | Marana | 3.5% | 23.9%(-20.4)#2 | 20.1%(-16.6)#63 |
| 64. | Oxon Hill | 3.5% | 19.5%(-16.0)#5 | 20.1%(-16.6)#64 |
| 65. | Cos Cob | 3.5% | 16.7%(-13.2)#1 | 20.1%(-16.6)#65 |
| 66. | Hillsboro | 3.6% | 16.9%(-13.3)#2 | 20.1%(-16.5)#66 |
| 67. | Aspen Hill | 3.6% | 19.5%(-15.9)#6 | 20.1%(-16.5)#67 |
| 68. | Rancho Santa Margarita | 3.6% | 19.8%(-16.2)#12 | 20.1%(-16.5)#68 |
| 69. | Vidor | 3.6% | 19.4%(-15.8)#6 | 20.1%(-16.5)#69 |
| 70. | Park Ridge | 3.7% | 19.2%(-15.5)#3 | 20.1%(-16.4)#70 |
| 71. | Gainesville | 3.8% | 26.5%(-22.7)#1 | 20.1%(-16.3)#71 |
| 72. | Blaine | 3.8% | 14.8%(-11.0)#1 | 20.1%(-16.3)#72 |
| 73. | Olney | 3.8% | 19.5%(-15.7)#7 | 20.1%(-16.3)#73 |
| 74. | Parkville | 3.8% | 19.5%(-15.7)#8 | 20.1%(-16.3)#74 |
| 75. | Sierra Vista Southeast | 3.8% | 23.9%(-20.1)#3 | 20.1%(-16.3)#75 |
| 76. | Plymouth | 3.9% | 14.8%(-10.9)#2 | 20.1%(-16.2)#76 |
| 77. | Winter Garden | 3.9% | 26.5%(-22.6)#2 | 20.1%(-16.2)#77 |
| 78. | Elmhurst | 4.0% | 19.2%(-15.2)#4 | 20.1%(-16.1)#78 |
| 79. | Danville | 4.0% | 19.8%(-15.8)#13 | 20.1%(-16.1)#79 |
| 80. | Orchards | 4.0% | 15.4%(-11.4)#3 | 20.1%(-16.1)#80 |
| 81. | Fair Oaks | 4.1% | 19.8%(-15.7)#14 | 20.1%(-16.0)#81 |
| 82. | Pocatello | 4.3% | 14.3%(-10.0)#1 | 20.1%(-15.8)#82 |
| 83. | Dublin | 4.3% | 20.4%(-16.1)#2 | 20.1%(-15.8)#83 |
| 84. | Pittsfield | 4.3% | 14.4%(-10.1)#3 | 20.1%(-15.8)#84 |
| 85. | Pearl River | 4.3% | 18.7%(-14.4)#3 | 20.1%(-15.8)#85 |
| 86. | Maiden | 4.3% | 19.1%(-14.8)#6 | 20.1%(-15.8)#86 |
| 87. | Mansfield | 4.4% | 19.4%(-15.0)#7 | 20.1%(-15.7)#87 |
| 88. | St Cloud | 4.4% | 14.8%(-10.4)#3 | 20.1%(-15.7)#88 |
| 89. | Waipahu | 4.4% | 18.3%(-13.9)#2 | 20.1%(-15.7)#89 |
| 90. | San Buenaventura Ventura | 4.5% | 19.8%(-15.3)#15 | 20.1%(-15.6)#90 |
| 91. | Weymouth Town | 4.5% | 14.4%(-9.90)#4 | 20.1%(-15.6)#91 |
| 92. | Severn | 4.5% | 19.5%(-15.0)#9 | 20.1%(-15.6)#92 |
| 93. | Mcdonough | 4.5% | 22.7%(-18.2)#3 | 20.1%(-15.6)#93 |
| 94. | North Plainfield Borough | 4.5% | 17.5%(-13.0)#4 | 20.1%(-15.6)#94 |
| 95. | Little Ferry Borough | 4.5% | 17.5%(-13.0)#5 | 20.1%(-15.6)#95 |
| 96. | Three Rivers | 4.5% | 20.9%(-16.4)#4 | 20.1%(-15.6)#96 |
| 97. | Fremont | 4.6% | 19.8%(-15.2)#16 | 20.1%(-15.5)#97 |
| 98. | Chino Hills | 4.6% | 19.8%(-15.2)#17 | 20.1%(-15.5)#98 |
| 99. | South Hill | 4.6% | 15.4%(-10.8)#4 | 20.1%(-15.5)#99 |
| 100. | West Allis | 4.6% | 17.7%(-13.1)#1 | 20.1%(-15.5)#100 |
Common Questions
What are the Top 10 Cities with the Lowest Percentage of Births to Unmarried Women over the Age of 35 in the United States?
Top 10 Cities with the Lowest Percentage of Births to Unmarried Women over the Age of 35 in the United States are:
#1
0.20%
#2
0.40%
#3
0.70%
#4
0.80%
#5
1.0%
#6
1.1%
#7
1.1%
#8
1.1%
#9
1.2%
#10
1.2%
What city has the Lowest Percentage of Births to Unmarried Women over the Age of 35 in the United States?
Sugar Land has the Lowest Percentage of Births to Unmarried Women over the Age of 35 in the United States with 0.20%.
What is the Percentage of Births to Unmarried Women over the Age of 35 in the United States?
Percentage of Births to Unmarried Women over the Age of 35 in the United States is 20.1%.