Cities with the Lowest Percentage of Births to Unmarried Women over the Age of 35 in Ohio
RELATED REPORTS & OPTIONS
Lowest Illegitimacy | Women 35+
Ohio
Compare Cities
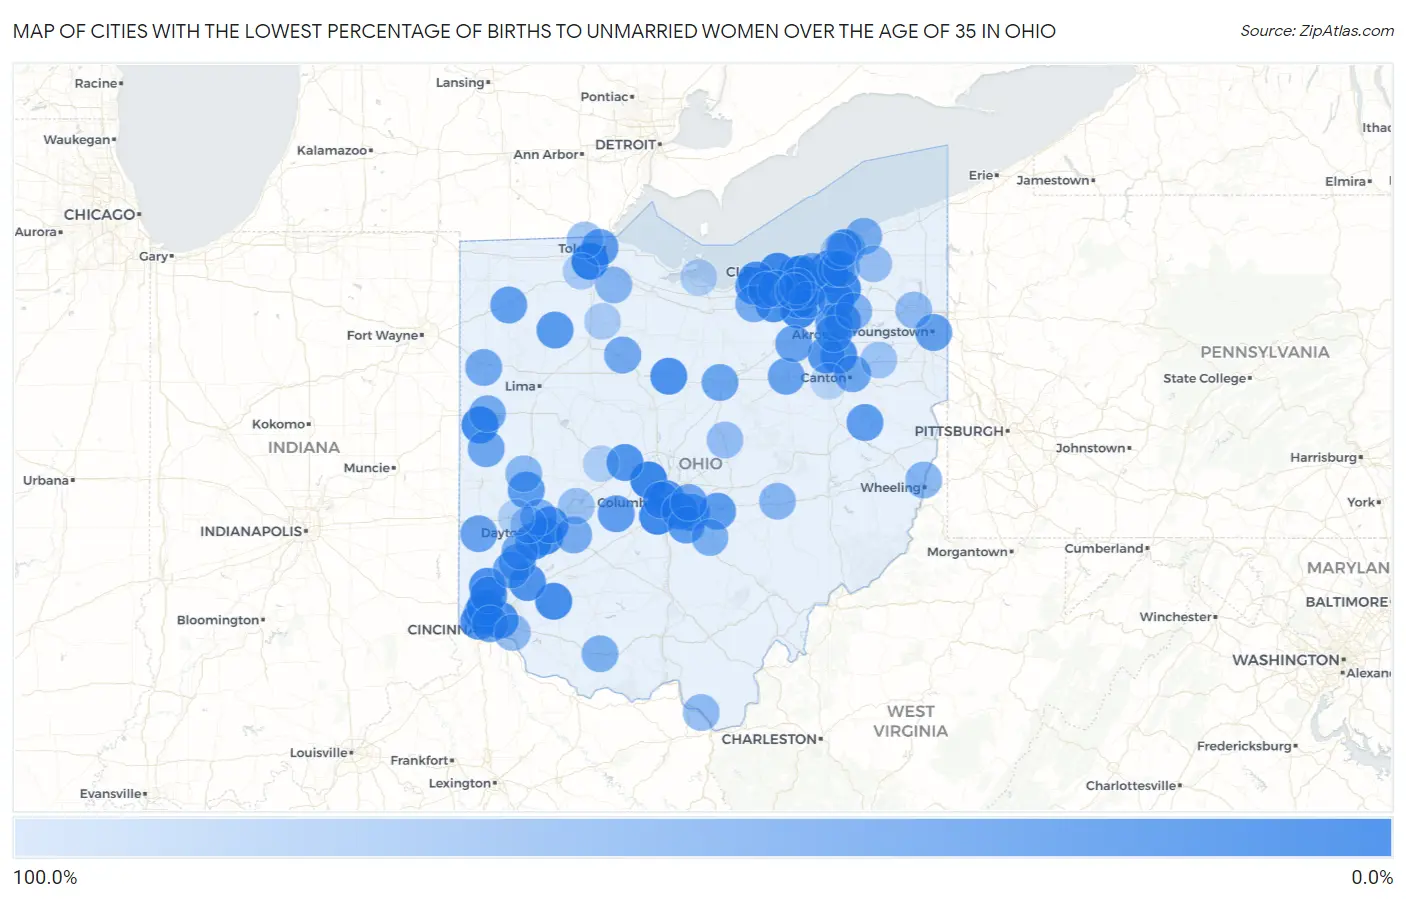
Map of Cities with the Lowest Percentage of Births to Unmarried Women over the Age of 35 in Ohio
100.0%
0.0%
Cities with the Lowest Percentage of Births to Unmarried Women over the Age of 35 in Ohio
| City | % Unmarried | vs State | vs National | |
| 1. | Maumee | 2.4% | 20.4%(-18.0)#1 | 20.1%(-17.7)#40 |
| 2. | Dublin | 4.3% | 20.4%(-16.1)#2 | 20.1%(-15.8)#83 |
| 3. | Rocky River | 5.8% | 20.4%(-14.6)#3 | 20.1%(-14.3)#155 |
| 4. | Grove City | 7.7% | 20.4%(-12.7)#4 | 20.1%(-12.4)#237 |
| 5. | Brunswick | 8.7% | 20.4%(-11.7)#5 | 20.1%(-11.4)#288 |
| 6. | Avon Lake | 8.7% | 20.4%(-11.7)#6 | 20.1%(-11.4)#289 |
| 7. | Coldwater | 9.1% | 20.4%(-11.3)#7 | 20.1%(-11.0)#309 |
| 8. | Solon | 9.2% | 20.4%(-11.2)#8 | 20.1%(-10.9)#313 |
| 9. | Beavercreek | 9.8% | 20.4%(-10.6)#9 | 20.1%(-10.3)#337 |
| 10. | Kettering | 10.5% | 20.4%(-9.90)#10 | 20.1%(-9.60)#369 |
| 11. | Cleveland Heights | 11.0% | 20.4%(-9.40)#11 | 20.1%(-9.10)#388 |
| 12. | Strongsville | 12.0% | 20.4%(-8.40)#12 | 20.1%(-8.10)#432 |
| 13. | Blanchester | 12.8% | 20.4%(-7.60)#13 | 20.1%(-7.30)#483 |
| 14. | Hamilton | 13.3% | 20.4%(-7.10)#14 | 20.1%(-6.80)#503 |
| 15. | Green | 13.4% | 20.4%(-7.00)#15 | 20.1%(-6.70)#511 |
| 16. | White Oak | 13.9% | 20.4%(-6.50)#16 | 20.1%(-6.20)#546 |
| 17. | Parma | 14.3% | 20.4%(-6.10)#17 | 20.1%(-5.80)#565 |
| 18. | Lakewood | 14.3% | 20.4%(-6.10)#18 | 20.1%(-5.80)#566 |
| 19. | Fairborn | 14.6% | 20.4%(-5.80)#19 | 20.1%(-5.50)#588 |
| 20. | Norwood | 14.7% | 20.4%(-5.70)#20 | 20.1%(-5.40)#602 |
| 21. | Grafton | 15.8% | 20.4%(-4.60)#21 | 20.1%(-4.30)#666 |
| 22. | Bridgetown | 16.7% | 20.4%(-3.70)#22 | 20.1%(-3.40)#709 |
| 23. | Bucyrus | 16.7% | 20.4%(-3.70)#23 | 20.1%(-3.40)#710 |
| 24. | Amherst | 17.0% | 20.4%(-3.40)#24 | 20.1%(-3.10)#734 |
| 25. | Shaker Heights | 17.7% | 20.4%(-2.70)#25 | 20.1%(-2.40)#765 |
| 26. | Lorain | 18.1% | 20.4%(-2.30)#26 | 20.1%(-2.00)#787 |
| 27. | Lebanon | 18.4% | 20.4%(-2.00)#27 | 20.1%(-1.70)#805 |
| 28. | Marysville | 18.8% | 20.4%(-1.60)#28 | 20.1%(-1.30)#827 |
| 29. | Middleburg Heights | 19.5% | 20.4%(-0.900)#29 | 20.1%(-0.600)#854 |
| 30. | Columbus | 19.7% | 20.4%(-0.700)#30 | 20.1%(-0.400)#861 |
| 31. | Macedonia | 21.1% | 20.4%(+0.700)#31 | 20.1%(+1.00)#936 |
| 32. | Northbrook | 22.2% | 20.4%(+1.80)#32 | 20.1%(+2.10)#992 |
| 33. | Fairfield | 22.5% | 20.4%(+2.10)#33 | 20.1%(+2.40)#1,005 |
| 34. | Grandview Heights | 22.6% | 20.4%(+2.20)#34 | 20.1%(+2.50)#1,010 |
| 35. | New Franklin | 22.9% | 20.4%(+2.50)#35 | 20.1%(+2.80)#1,018 |
| 36. | Pickerington | 23.5% | 20.4%(+3.10)#36 | 20.1%(+3.40)#1,045 |
| 37. | Blacklick Estates | 23.5% | 20.4%(+3.10)#37 | 20.1%(+3.40)#1,047 |
| 38. | Leipsic | 25.0% | 20.4%(+4.60)#38 | 20.1%(+4.90)#1,113 |
| 39. | Cuyahoga Falls | 25.6% | 20.4%(+5.20)#39 | 20.1%(+5.50)#1,135 |
| 40. | Troy | 27.2% | 20.4%(+6.80)#40 | 20.1%(+7.10)#1,208 |
| 41. | Lithopolis | 27.3% | 20.4%(+6.90)#41 | 20.1%(+7.20)#1,216 |
| 42. | Millersport | 27.3% | 20.4%(+6.90)#42 | 20.1%(+7.20)#1,219 |
| 43. | Stow | 27.8% | 20.4%(+7.40)#43 | 20.1%(+7.70)#1,235 |
| 44. | London | 28.9% | 20.4%(+8.50)#44 | 20.1%(+8.80)#1,295 |
| 45. | Toledo | 29.3% | 20.4%(+8.90)#45 | 20.1%(+9.20)#1,310 |
| 46. | Sherrodsville | 30.0% | 20.4%(+9.60)#46 | 20.1%(+9.90)#1,347 |
| 47. | Defiance | 31.4% | 20.4%(+11.0)#47 | 20.1%(+11.3)#1,396 |
| 48. | Willoughby | 32.0% | 20.4%(+11.6)#48 | 20.1%(+11.9)#1,418 |
| 49. | Youngstown | 34.1% | 20.4%(+13.7)#49 | 20.1%(+14.0)#1,524 |
| 50. | Franklin | 34.8% | 20.4%(+14.4)#50 | 20.1%(+14.7)#1,552 |
| 51. | Eaton | 35.0% | 20.4%(+14.6)#51 | 20.1%(+14.9)#1,566 |
| 52. | Wooster | 35.7% | 20.4%(+15.3)#52 | 20.1%(+15.6)#1,590 |
| 53. | Seville | 35.7% | 20.4%(+15.3)#53 | 20.1%(+15.6)#1,594 |
| 54. | Cincinnati | 36.5% | 20.4%(+16.1)#54 | 20.1%(+16.4)#1,619 |
| 55. | Middletown | 37.8% | 20.4%(+17.4)#55 | 20.1%(+17.7)#1,670 |
| 56. | Mansfield | 38.2% | 20.4%(+17.8)#56 | 20.1%(+18.1)#1,691 |
| 57. | Canton | 39.1% | 20.4%(+18.7)#57 | 20.1%(+19.0)#1,716 |
| 58. | North Star | 40.0% | 20.4%(+19.6)#58 | 20.1%(+19.9)#1,762 |
| 59. | Reynoldsburg | 40.8% | 20.4%(+20.4)#59 | 20.1%(+20.7)#1,778 |
| 60. | Van Wert | 42.9% | 20.4%(+22.5)#60 | 20.1%(+22.8)#1,830 |
| 61. | Carey | 42.9% | 20.4%(+22.5)#61 | 20.1%(+22.8)#1,834 |
| 62. | Miamisburg | 43.7% | 20.4%(+23.3)#62 | 20.1%(+23.6)#1,858 |
| 63. | Celina | 44.1% | 20.4%(+23.7)#63 | 20.1%(+24.0)#1,877 |
| 64. | Cleveland | 44.7% | 20.4%(+24.3)#64 | 20.1%(+24.6)#1,895 |
| 65. | Akron | 44.7% | 20.4%(+24.3)#65 | 20.1%(+24.6)#1,896 |
| 66. | Lyndhurst | 45.3% | 20.4%(+24.9)#66 | 20.1%(+25.2)#1,910 |
| 67. | Oberlin | 45.5% | 20.4%(+25.1)#67 | 20.1%(+25.4)#1,916 |
| 68. | Cedarville | 45.5% | 20.4%(+25.1)#68 | 20.1%(+25.4)#1,919 |
| 69. | Painesville | 47.1% | 20.4%(+26.7)#69 | 20.1%(+27.0)#1,963 |
| 70. | North Ridgeville | 49.5% | 20.4%(+29.1)#70 | 20.1%(+29.4)#2,019 |
| 71. | Lancaster | 50.0% | 20.4%(+29.6)#71 | 20.1%(+29.9)#2,024 |
| 72. | Seaman | 50.0% | 20.4%(+29.6)#72 | 20.1%(+29.9)#2,060 |
| 73. | Huber Heights | 51.2% | 20.4%(+30.8)#73 | 20.1%(+31.1)#2,098 |
| 74. | Mayfield Heights | 52.4% | 20.4%(+32.0)#74 | 20.1%(+32.3)#2,129 |
| 75. | Streetsboro | 53.2% | 20.4%(+32.8)#75 | 20.1%(+33.1)#2,153 |
| 76. | Martins Ferry | 53.8% | 20.4%(+33.4)#76 | 20.1%(+33.7)#2,165 |
| 77. | Eastlake | 55.6% | 20.4%(+35.2)#77 | 20.1%(+35.5)#2,197 |
| 78. | Zanesville | 56.0% | 20.4%(+35.6)#78 | 20.1%(+35.9)#2,209 |
| 79. | Pemberville | 57.1% | 20.4%(+36.7)#79 | 20.1%(+37.0)#2,235 |
| 80. | Piqua | 58.5% | 20.4%(+38.1)#80 | 20.1%(+38.4)#2,269 |
| 81. | Ironton | 60.9% | 20.4%(+40.5)#81 | 20.1%(+40.8)#2,318 |
| 82. | Elyria | 61.5% | 20.4%(+41.1)#82 | 20.1%(+41.4)#2,327 |
| 83. | Warren | 62.0% | 20.4%(+41.6)#83 | 20.1%(+41.9)#2,344 |
| 84. | Forestville | 62.5% | 20.4%(+42.1)#84 | 20.1%(+42.4)#2,357 |
| 85. | North Royalton | 62.6% | 20.4%(+42.2)#85 | 20.1%(+42.5)#2,366 |
| 86. | Mount Vernon | 65.7% | 20.4%(+45.3)#86 | 20.1%(+45.6)#2,433 |
| 87. | Sylvania | 66.7% | 20.4%(+46.3)#87 | 20.1%(+46.6)#2,442 |
| 88. | Aquilla | 66.7% | 20.4%(+46.3)#88 | 20.1%(+46.6)#2,469 |
| 89. | Springfield | 69.4% | 20.4%(+49.0)#89 | 20.1%(+49.3)#2,500 |
| 90. | Dayton | 70.1% | 20.4%(+49.7)#90 | 20.1%(+50.0)#2,512 |
| 91. | Alliance | 71.0% | 20.4%(+50.6)#91 | 20.1%(+50.9)#2,517 |
| 92. | Brook Park | 76.6% | 20.4%(+56.2)#92 | 20.1%(+56.5)#2,592 |
| 93. | Waterville | 78.3% | 20.4%(+57.9)#93 | 20.1%(+58.2)#2,612 |
| 94. | Bloomdale | 80.0% | 20.4%(+59.6)#94 | 20.1%(+59.9)#2,630 |
| 95. | Sandusky | 81.8% | 20.4%(+61.4)#95 | 20.1%(+61.7)#2,644 |
| 96. | North Lewisburg | 83.3% | 20.4%(+62.9)#96 | 20.1%(+63.2)#2,658 |
| 97. | Englewood | 83.7% | 20.4%(+63.3)#97 | 20.1%(+63.6)#2,661 |
| 98. | Berea | 84.6% | 20.4%(+64.2)#98 | 20.1%(+64.5)#2,671 |
| 99. | Willowick | 84.6% | 20.4%(+64.2)#99 | 20.1%(+64.5)#2,672 |
| 100. | Massillon | 87.9% | 20.4%(+67.5)#100 | 20.1%(+67.8)#2,690 |
Common Questions
What are the Top 10 Cities with the Lowest Percentage of Births to Unmarried Women over the Age of 35 in Ohio?
Top 10 Cities with the Lowest Percentage of Births to Unmarried Women over the Age of 35 in Ohio are:
#1
2.4%
#2
4.3%
#3
5.8%
#4
7.7%
#5
8.7%
#6
8.7%
#7
9.1%
#8
9.2%
#9
9.8%
#10
10.5%
What city has the Lowest Percentage of Births to Unmarried Women over the Age of 35 in Ohio?
Maumee has the Lowest Percentage of Births to Unmarried Women over the Age of 35 in Ohio with 2.4%.
What is the Percentage of Births to Unmarried Women over the Age of 35 in the State of Ohio?
Percentage of Births to Unmarried Women over the Age of 35 in Ohio is 20.4%.
What is the Percentage of Births to Unmarried Women over the Age of 35 in the United States?
Percentage of Births to Unmarried Women over the Age of 35 in the United States is 20.1%.