Linda, CA Map & Demographics
Linda Map
Linda Overview
$22,333
PER CAPITA INCOME
$58,750
AVG FAMILY INCOME
$57,427
AVG HOUSEHOLD INCOME
31.7%
WAGE / INCOME GAP [ % ]
68.3¢/ $1
WAGE / INCOME GAP [ $ ]
$11,637
FAMILY INCOME DEFICIT
0.40
INEQUALITY / GINI INDEX
23,262
TOTAL POPULATION
12,013
MALE POPULATION
11,249
FEMALE POPULATION
106.79
MALES / 100 FEMALES
93.64
FEMALES / 100 MALES
29.9
MEDIAN AGE
3.8
AVG FAMILY SIZE
3.3
AVG HOUSEHOLD SIZE
9,391
LABOR FORCE [ PEOPLE ]
56.1%
PERCENT IN LABOR FORCE
10.3%
UNEMPLOYMENT RATE
Linda Area Codes
Income in Linda
Income Overview in Linda
Per Capita Income in Linda is $22,333, while median incomes of families and households are $58,750 and $57,427 respectively.
| Characteristic | Number | Measure |
| Per Capita Income | 23,262 | $22,333 |
| Median Family Income | 5,241 | $58,750 |
| Mean Family Income | 5,241 | $71,953 |
| Median Household Income | 7,095 | $57,427 |
| Mean Household Income | 7,095 | $70,993 |
| Income Deficit | 5,241 | $11,637 |
| Wage / Income Gap (%) | 23,262 | 31.71% |
| Wage / Income Gap ($) | 23,262 | 68.29¢ per $1 |
| Gini / Inequality Index | 23,262 | 0.40 |
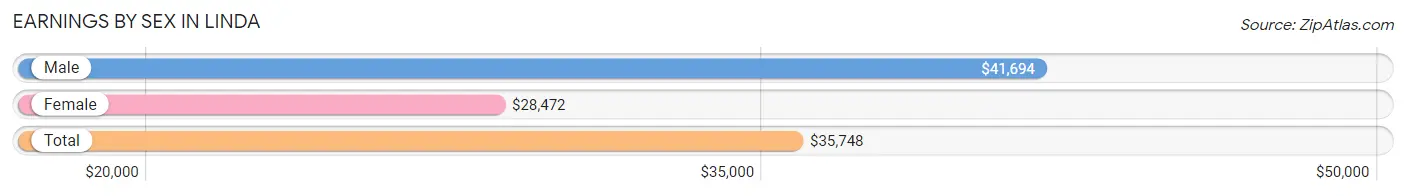
Earnings by Sex in Linda
Average Earnings in Linda are $35,748, $41,694 for men and $28,472 for women, a difference of 31.7%.
| Sex | Number | Average Earnings |
| Male | 5,547 (56.3%) | $41,694 |
| Female | 4,306 (43.7%) | $28,472 |
| Total | 9,853 (100.0%) | $35,748 |
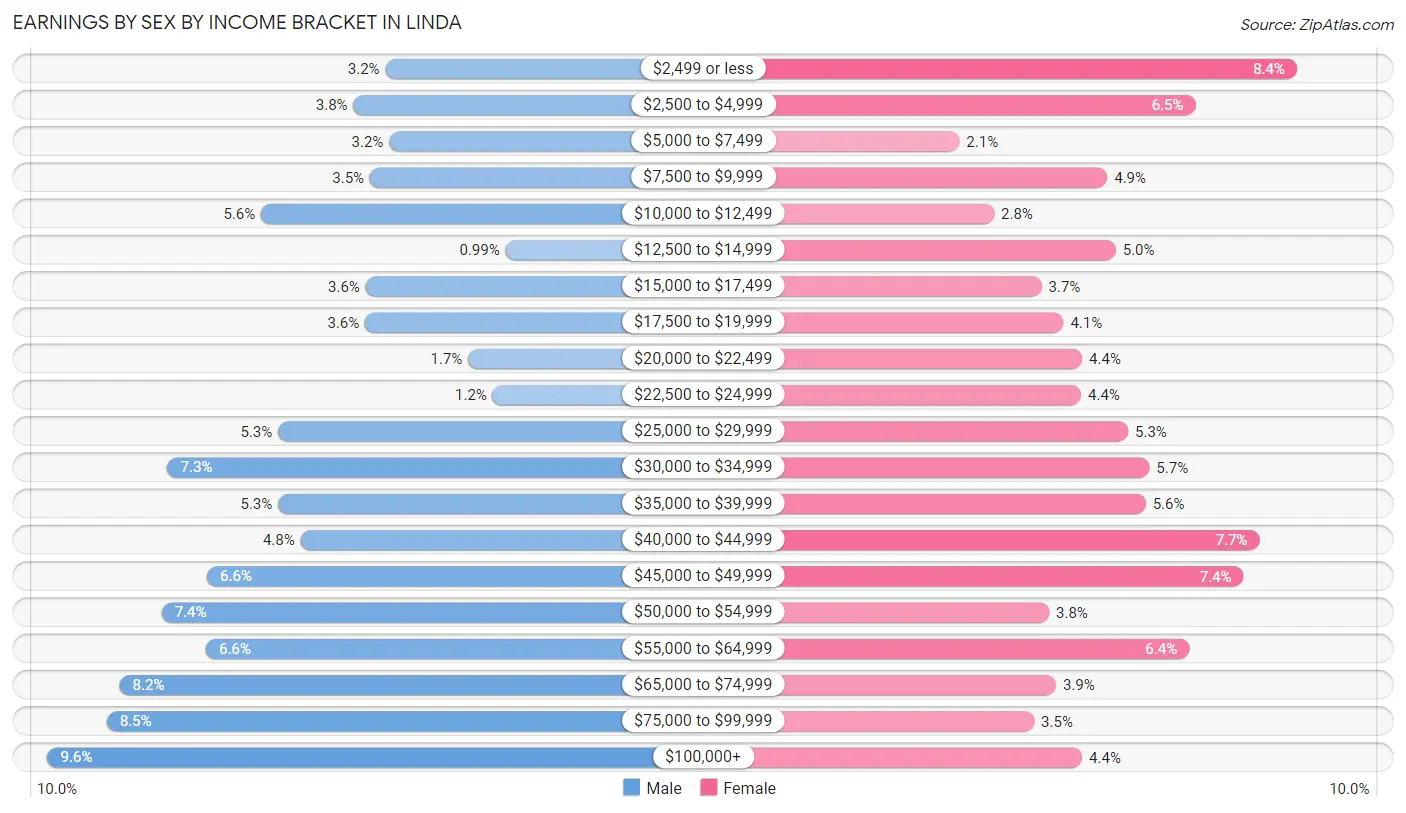
Earnings by Sex by Income Bracket in Linda
The most common earnings brackets in Linda are $100,000+ for men (531 | 9.6%) and $2,499 or less for women (363 | 8.4%).
| Income | Male | Female |
| $2,499 or less | 180 (3.2%) | 363 (8.4%) |
| $2,500 to $4,999 | 213 (3.8%) | 281 (6.5%) |
| $5,000 to $7,499 | 176 (3.2%) | 91 (2.1%) |
| $7,500 to $9,999 | 196 (3.5%) | 210 (4.9%) |
| $10,000 to $12,499 | 309 (5.6%) | 119 (2.8%) |
| $12,500 to $14,999 | 55 (1.0%) | 217 (5.0%) |
| $15,000 to $17,499 | 200 (3.6%) | 157 (3.6%) |
| $17,500 to $19,999 | 201 (3.6%) | 175 (4.1%) |
| $20,000 to $22,499 | 94 (1.7%) | 190 (4.4%) |
| $22,500 to $24,999 | 68 (1.2%) | 189 (4.4%) |
| $25,000 to $29,999 | 291 (5.2%) | 227 (5.3%) |
| $30,000 to $34,999 | 406 (7.3%) | 244 (5.7%) |
| $35,000 to $39,999 | 291 (5.2%) | 241 (5.6%) |
| $40,000 to $44,999 | 268 (4.8%) | 333 (7.7%) |
| $45,000 to $49,999 | 365 (6.6%) | 320 (7.4%) |
| $50,000 to $54,999 | 412 (7.4%) | 163 (3.8%) |
| $55,000 to $64,999 | 366 (6.6%) | 276 (6.4%) |
| $65,000 to $74,999 | 456 (8.2%) | 169 (3.9%) |
| $75,000 to $99,999 | 469 (8.5%) | 151 (3.5%) |
| $100,000+ | 531 (9.6%) | 190 (4.4%) |
| Total | 5,547 (100.0%) | 4,306 (100.0%) |
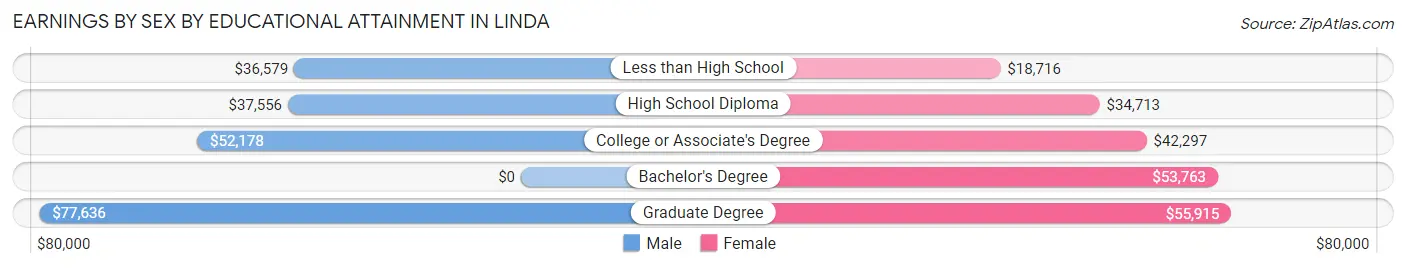
Earnings by Sex by Educational Attainment in Linda
Average earnings in Linda are $48,397 for men and $36,943 for women, a difference of 23.7%. Men with an educational attainment of graduate degree enjoy the highest average annual earnings of $77,636, while those with less than high school education earn the least with $36,579. Women with an educational attainment of graduate degree earn the most with the average annual earnings of $55,915, while those with less than high school education have the smallest earnings of $18,716.
| Educational Attainment | Male Income | Female Income |
| Less than High School | $36,579 | $18,716 |
| High School Diploma | $37,556 | $34,713 |
| College or Associate's Degree | $52,178 | $42,297 |
| Bachelor's Degree | - | - |
| Graduate Degree | $77,636 | $55,915 |
| Total | $48,397 | $36,943 |
Family Income in Linda
Family Income Brackets in Linda
According to the Linda family income data, there are 1,195 families falling into the $50,000 to $74,999 income range, which is the most common income bracket and makes up 22.8% of all families. Conversely, the $200,000+ income bracket is the least frequent group with only 142 families (2.7%) belonging to this category.
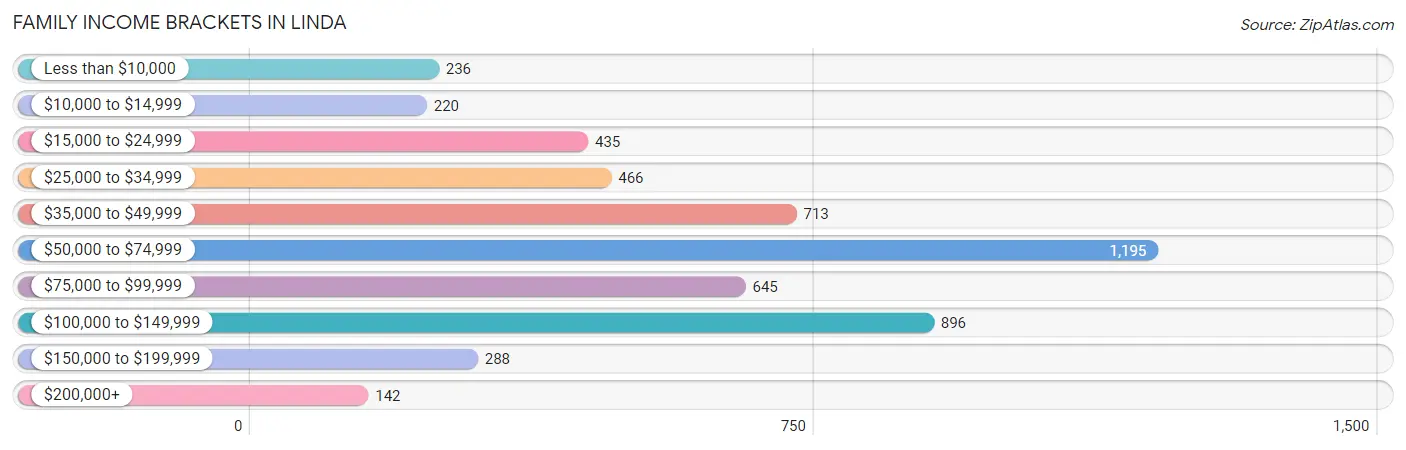
| Income Bracket | # Families | % Families |
| Less than $10,000 | 236 | 4.5% |
| $10,000 to $14,999 | 220 | 4.2% |
| $15,000 to $24,999 | 435 | 8.3% |
| $25,000 to $34,999 | 466 | 8.9% |
| $35,000 to $49,999 | 713 | 13.6% |
| $50,000 to $74,999 | 1,195 | 22.8% |
| $75,000 to $99,999 | 645 | 12.3% |
| $100,000 to $149,999 | 896 | 17.1% |
| $150,000 to $199,999 | 288 | 5.5% |
| $200,000+ | 142 | 2.7% |
Family Income by Famaliy Size in Linda
7+ person families (316 | 6.0%) account for the highest median family income in Linda with $104,944 per family, while 2-person families (1,533 | 29.2%) have the highest median income of $25,032 per family member.
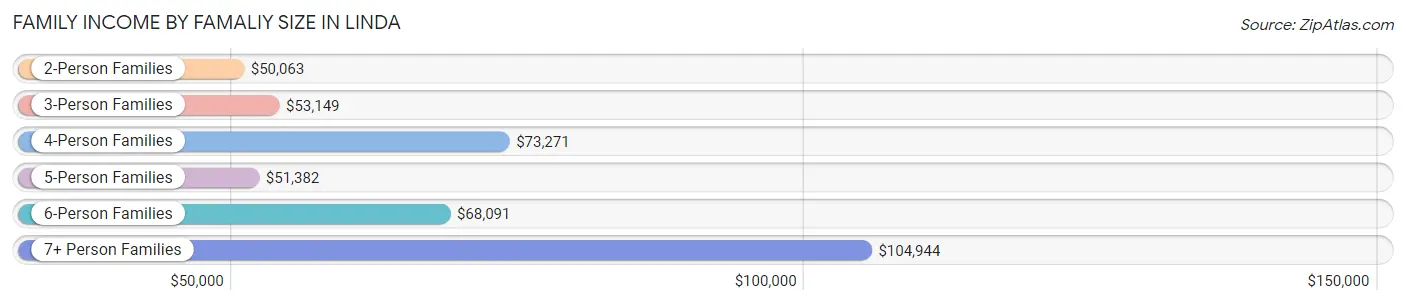
| Income Bracket | # Families | Median Income |
| 2-Person Families | 1,533 (29.2%) | $50,063 |
| 3-Person Families | 1,119 (21.3%) | $53,149 |
| 4-Person Families | 1,268 (24.2%) | $73,271 |
| 5-Person Families | 667 (12.7%) | $51,382 |
| 6-Person Families | 338 (6.5%) | $68,091 |
| 7+ Person Families | 316 (6.0%) | $104,944 |
| Total | 5,241 (100.0%) | $58,750 |
Family Income by Number of Earners in Linda
The median family income in Linda is $58,750, with families comprising 3+ earners (602) having the highest median family income of $130,179, while families with no earners (734) have the lowest median family income of $27,083, accounting for 11.5% and 14.0% of families, respectively.
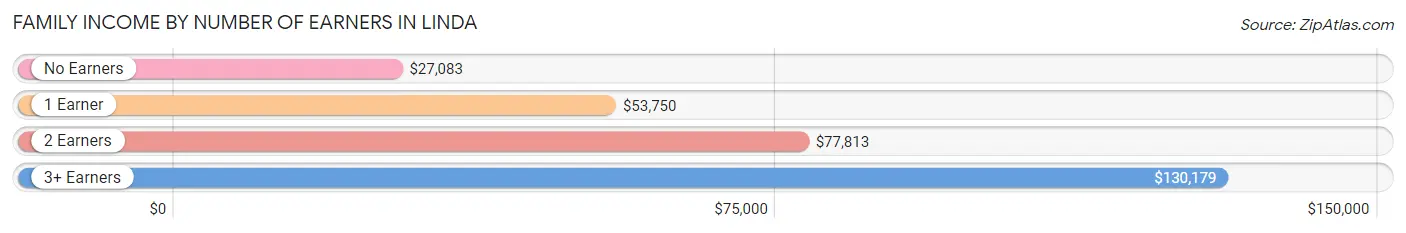
| Number of Earners | # Families | Median Income |
| No Earners | 734 (14.0%) | $27,083 |
| 1 Earner | 2,252 (43.0%) | $53,750 |
| 2 Earners | 1,653 (31.5%) | $77,813 |
| 3+ Earners | 602 (11.5%) | $130,179 |
| Total | 5,241 (100.0%) | $58,750 |
Household Income in Linda
Household Income Brackets in Linda
With 1,639 households falling in the category, the $50,000 to $74,999 income range is the most frequent in Linda, accounting for 23.1% of all households. In contrast, only 248 households (3.5%) fall into the $200,000+ income bracket, making it the least populous group.
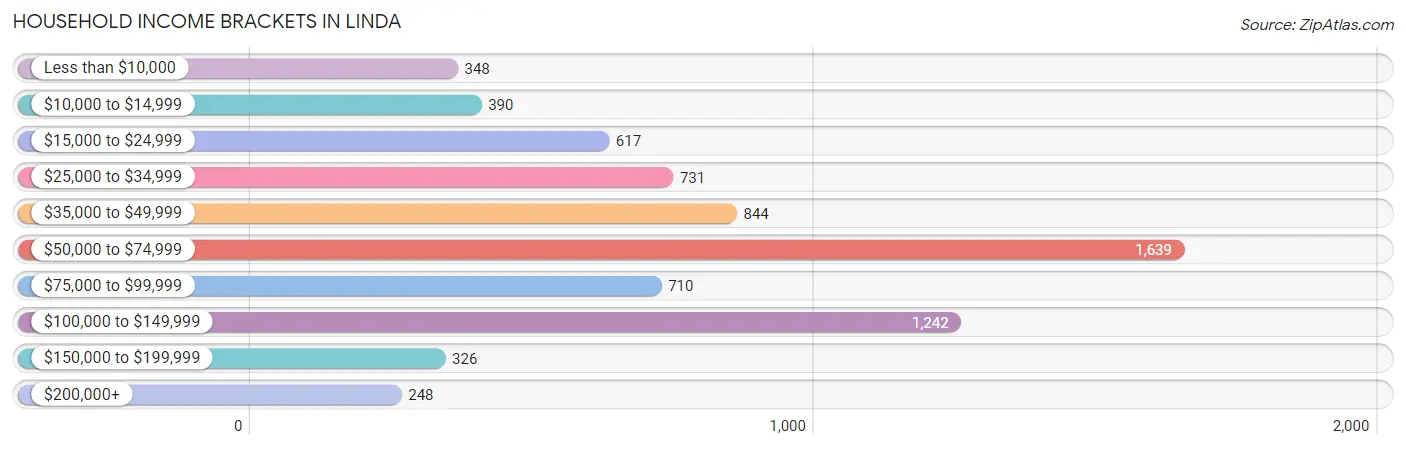
| Income Bracket | # Households | % Households |
| Less than $10,000 | 348 | 4.9% |
| $10,000 to $14,999 | 390 | 5.5% |
| $15,000 to $24,999 | 617 | 8.7% |
| $25,000 to $34,999 | 731 | 10.3% |
| $35,000 to $49,999 | 844 | 11.9% |
| $50,000 to $74,999 | 1,639 | 23.1% |
| $75,000 to $99,999 | 710 | 10.0% |
| $100,000 to $149,999 | 1,242 | 17.5% |
| $150,000 to $199,999 | 326 | 4.6% |
| $200,000+ | 248 | 3.5% |
Household Income by Householder Age in Linda
The median household income in Linda is $57,427, with the highest median household income of $67,148 found in the 25 to 44 years age bracket for the primary householder. A total of 3,011 households (42.4%) fall into this category. Meanwhile, the 15 to 24 years age bracket for the primary householder has the lowest median household income of $40,708, with 331 households (4.7%) in this group.
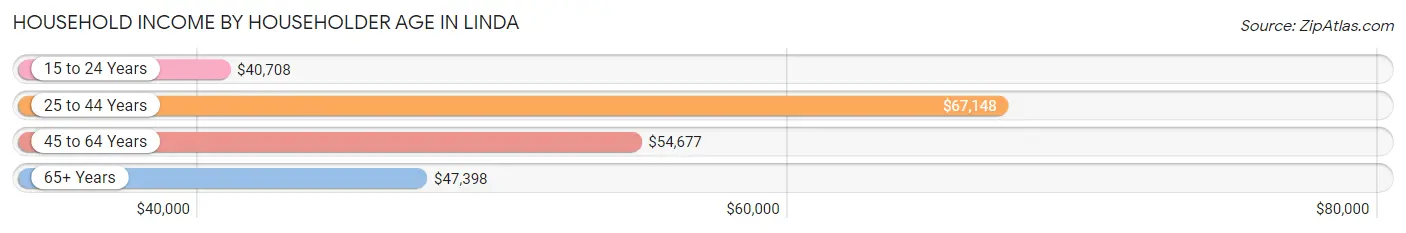
| Income Bracket | # Households | Median Income |
| 15 to 24 Years | 331 (4.7%) | $40,708 |
| 25 to 44 Years | 3,011 (42.4%) | $67,148 |
| 45 to 64 Years | 2,614 (36.8%) | $54,677 |
| 65+ Years | 1,139 (16.1%) | $47,398 |
| Total | 7,095 (100.0%) | $57,427 |
Poverty in Linda
Income Below Poverty by Sex and Age in Linda
With 22.0% poverty level for males and 23.1% for females among the residents of Linda, 5 year old males and 6 to 11 year old females are the most vulnerable to poverty, with 169 males (67.6%) and 389 females (35.5%) in their respective age groups living below the poverty level.
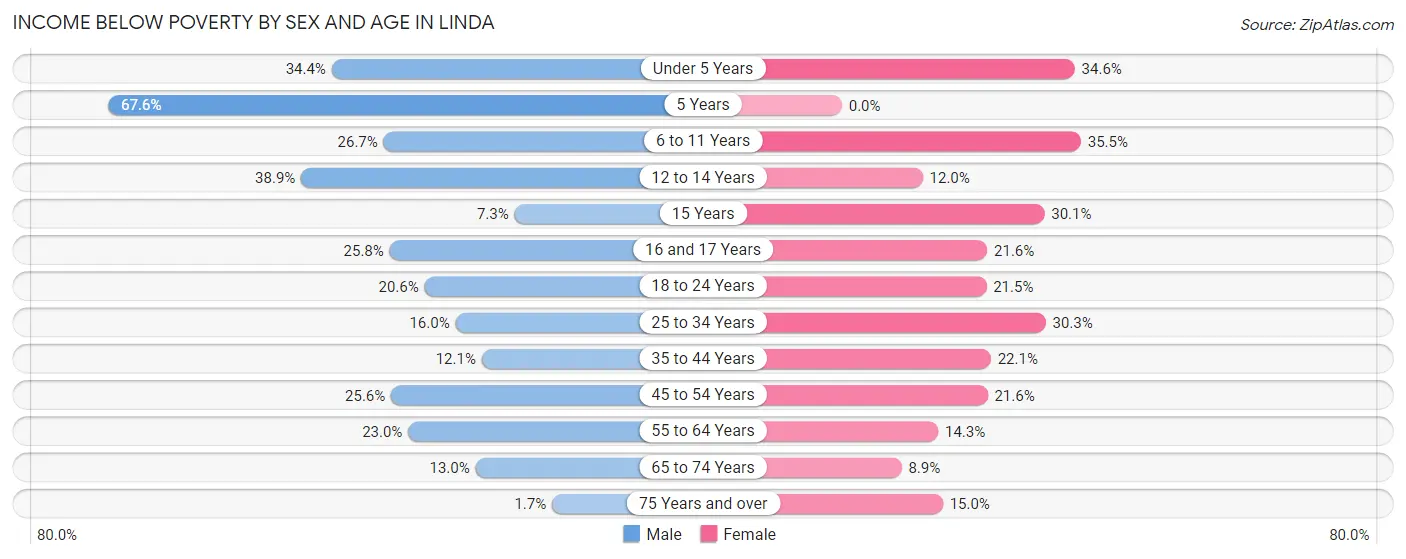
| Age Bracket | Male | Female |
| Under 5 Years | 387 (34.4%) | 350 (34.6%) |
| 5 Years | 169 (67.6%) | 0 (0.0%) |
| 6 to 11 Years | 335 (26.7%) | 389 (35.5%) |
| 12 to 14 Years | 160 (38.9%) | 103 (12.0%) |
| 15 Years | 15 (7.2%) | 43 (30.1%) |
| 16 and 17 Years | 105 (25.8%) | 60 (21.6%) |
| 18 to 24 Years | 305 (20.6%) | 245 (21.4%) |
| 25 to 34 Years | 324 (16.0%) | 522 (30.3%) |
| 35 to 44 Years | 180 (12.1%) | 340 (22.1%) |
| 45 to 54 Years | 311 (25.6%) | 281 (21.6%) |
| 55 to 64 Years | 256 (23.0%) | 143 (14.3%) |
| 65 to 74 Years | 87 (13.0%) | 66 (8.9%) |
| 75 Years and over | 6 (1.7%) | 40 (15.0%) |
| Total | 2,640 (22.0%) | 2,582 (23.1%) |
Income Above Poverty by Sex and Age in Linda
According to the poverty statistics in Linda, males aged 75 years and over and females aged 5 years are the age groups that are most secure financially, with 98.3% of males and 100.0% of females in these age groups living above the poverty line.
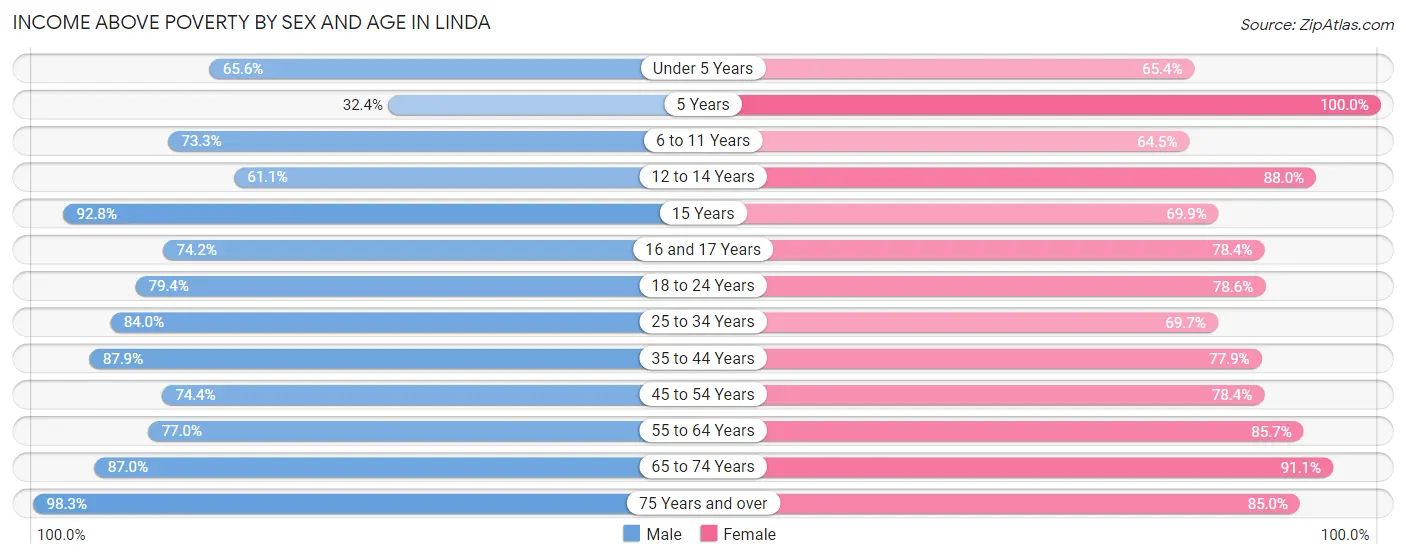
| Age Bracket | Male | Female |
| Under 5 Years | 738 (65.6%) | 662 (65.4%) |
| 5 Years | 81 (32.4%) | 53 (100.0%) |
| 6 to 11 Years | 920 (73.3%) | 707 (64.5%) |
| 12 to 14 Years | 251 (61.1%) | 755 (88.0%) |
| 15 Years | 192 (92.7%) | 100 (69.9%) |
| 16 and 17 Years | 302 (74.2%) | 218 (78.4%) |
| 18 to 24 Years | 1,175 (79.4%) | 897 (78.5%) |
| 25 to 34 Years | 1,698 (84.0%) | 1,203 (69.7%) |
| 35 to 44 Years | 1,305 (87.9%) | 1,197 (77.9%) |
| 45 to 54 Years | 905 (74.4%) | 1,018 (78.4%) |
| 55 to 64 Years | 855 (77.0%) | 858 (85.7%) |
| 65 to 74 Years | 580 (87.0%) | 679 (91.1%) |
| 75 Years and over | 351 (98.3%) | 227 (85.0%) |
| Total | 9,353 (78.0%) | 8,574 (76.9%) |
Income Below Poverty Among Married-Couple Families in Linda
The poverty statistics for married-couple families in Linda show that 12.6% or 410 of the total 3,267 families live below the poverty line. Families with 5 or more children have the highest poverty rate of 46.9%, comprising of 30 families. On the other hand, families with no children have the lowest poverty rate of 1.8%, which includes 21 families.
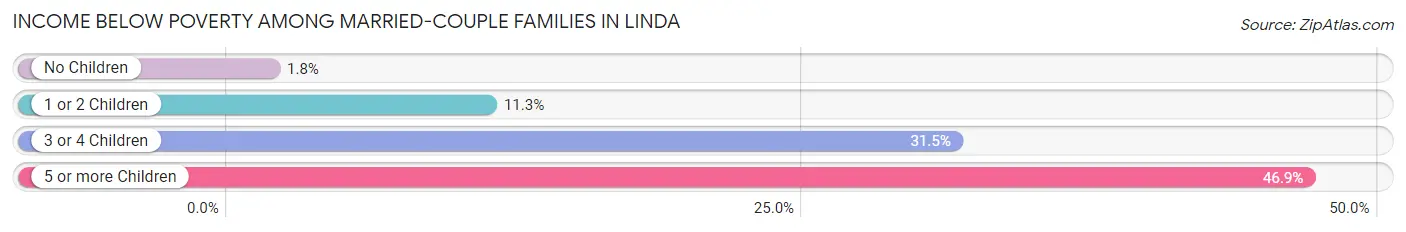
| Children | Above Poverty | Below Poverty |
| No Children | 1,126 (98.2%) | 21 (1.8%) |
| 1 or 2 Children | 1,267 (88.7%) | 161 (11.3%) |
| 3 or 4 Children | 430 (68.5%) | 198 (31.5%) |
| 5 or more Children | 34 (53.1%) | 30 (46.9%) |
| Total | 2,857 (87.5%) | 410 (12.6%) |
Income Below Poverty Among Single-Parent Households in Linda
According to the poverty data in Linda, 10.4% or 62 single-father households and 38.1% or 525 single-mother households are living below the poverty line. Among single-father households, those with 1 or 2 children have the highest poverty rate, with 39 households (14.2%) experiencing poverty. Likewise, among single-mother households, those with 5 or more children have the highest poverty rate, with 33 households (100.0%) falling below the poverty line.
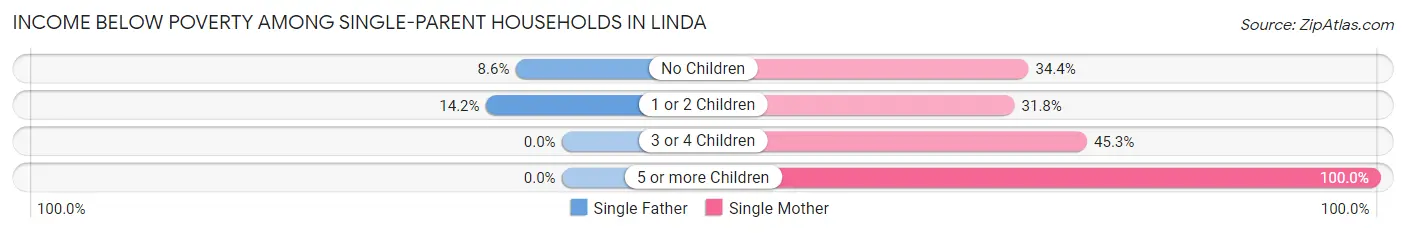
| Children | Single Father | Single Mother |
| No Children | 23 (8.6%) | 115 (34.4%) |
| 1 or 2 Children | 39 (14.2%) | 192 (31.8%) |
| 3 or 4 Children | 0 (0.0%) | 185 (45.3%) |
| 5 or more Children | 0 (0.0%) | 33 (100.0%) |
| Total | 62 (10.4%) | 525 (38.1%) |
Income Below Poverty Among Married-Couple vs Single-Parent Households in Linda
The poverty data for Linda shows that 410 of the married-couple family households (12.6%) and 587 of the single-parent households (29.7%) are living below the poverty level. Within the married-couple family households, those with 5 or more children have the highest poverty rate, with 30 households (46.9%) falling below the poverty line. Among the single-parent households, those with 5 or more children have the highest poverty rate, with 33 household (100.0%) living below poverty.
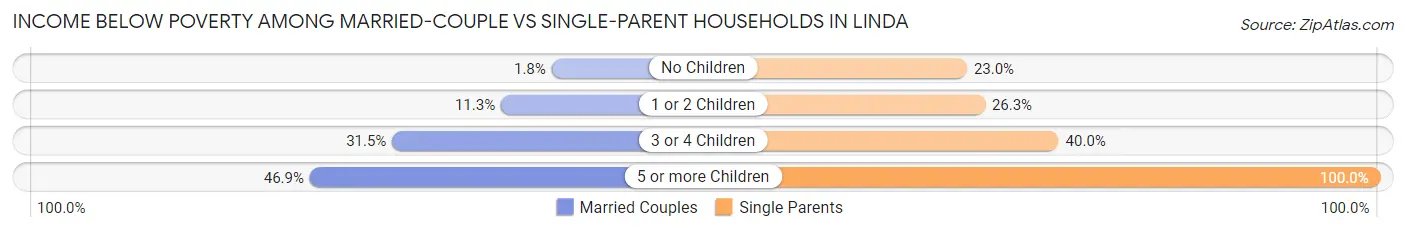
| Children | Married-Couple Families | Single-Parent Households |
| No Children | 21 (1.8%) | 138 (23.0%) |
| 1 or 2 Children | 161 (11.3%) | 231 (26.3%) |
| 3 or 4 Children | 198 (31.5%) | 185 (40.0%) |
| 5 or more Children | 30 (46.9%) | 33 (100.0%) |
| Total | 410 (12.6%) | 587 (29.7%) |
Race in Linda
The most populous races in Linda are White / Caucasian (11,992 | 51.5%), Hispanic or Latino (8,506 | 36.6%), and Two or more Races (4,518 | 19.4%).
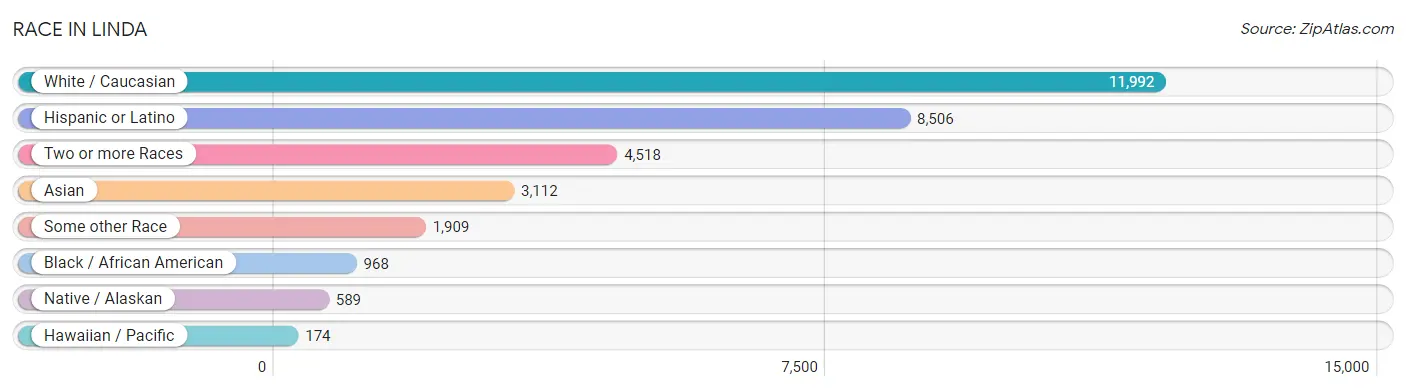
| Race | # Population | % Population |
| Asian | 3,112 | 13.4% |
| Black / African American | 968 | 4.2% |
| Hawaiian / Pacific | 174 | 0.7% |
| Hispanic or Latino | 8,506 | 36.6% |
| Native / Alaskan | 589 | 2.5% |
| White / Caucasian | 11,992 | 51.5% |
| Two or more Races | 4,518 | 19.4% |
| Some other Race | 1,909 | 8.2% |
| Total | 23,262 | 100.0% |
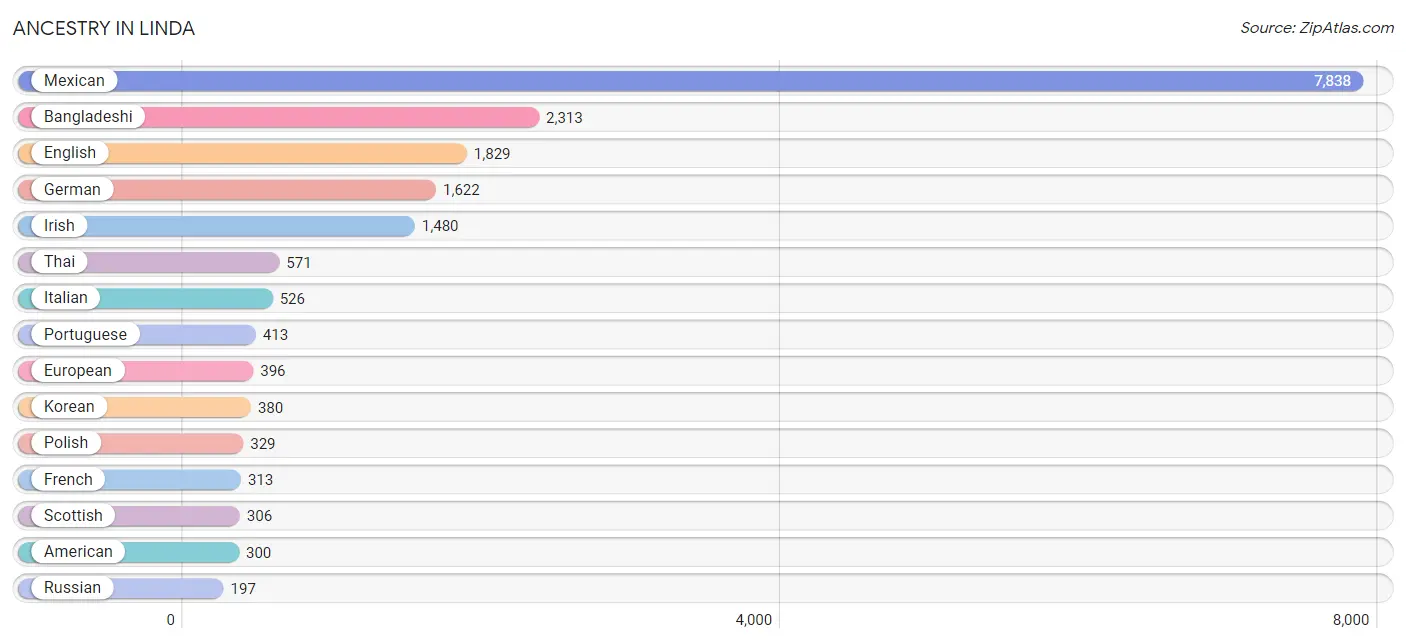
Ancestry in Linda
The most populous ancestries reported in Linda are Mexican (7,838 | 33.7%), Bangladeshi (2,313 | 9.9%), English (1,829 | 7.9%), German (1,622 | 7.0%), and Irish (1,480 | 6.4%), together accounting for 64.8% of all Linda residents.
| Ancestry | # Population | % Population |
| African | 95 | 0.4% |
| American | 300 | 1.3% |
| Apache | 188 | 0.8% |
| Arab | 10 | 0.0% |
| Australian | 6 | 0.0% |
| Bangladeshi | 2,313 | 9.9% |
| Bhutanese | 164 | 0.7% |
| Blackfeet | 64 | 0.3% |
| Brazilian | 13 | 0.1% |
| British | 157 | 0.7% |
| Cajun | 33 | 0.1% |
| Canadian | 12 | 0.1% |
| Central American | 79 | 0.3% |
| Cherokee | 194 | 0.8% |
| Cheyenne | 182 | 0.8% |
| Chilean | 91 | 0.4% |
| Choctaw | 125 | 0.5% |
| Creek | 22 | 0.1% |
| Croatian | 61 | 0.3% |
| Cuban | 15 | 0.1% |
| Danish | 55 | 0.2% |
| Dutch | 167 | 0.7% |
| Eastern European | 39 | 0.2% |
| English | 1,829 | 7.9% |
| European | 396 | 1.7% |
| Filipino | 9 | 0.0% |
| French | 313 | 1.3% |
| French American Indian | 21 | 0.1% |
| French Canadian | 63 | 0.3% |
| German | 1,622 | 7.0% |
| Greek | 4 | 0.0% |
| Guamanian / Chamorro | 112 | 0.5% |
| Honduran | 42 | 0.2% |
| Indian (Asian) | 190 | 0.8% |
| Iranian | 89 | 0.4% |
| Irish | 1,480 | 6.4% |
| Italian | 526 | 2.3% |
| Korean | 380 | 1.6% |
| Malaysian | 38 | 0.2% |
| Maltese | 52 | 0.2% |
| Mexican | 7,838 | 33.7% |
| Mexican American Indian | 165 | 0.7% |
| Native Hawaiian | 21 | 0.1% |
| Nicaraguan | 11 | 0.1% |
| Northern European | 50 | 0.2% |
| Norwegian | 134 | 0.6% |
| Paiute | 124 | 0.5% |
| Pakistani | 75 | 0.3% |
| Peruvian | 7 | 0.0% |
| Polish | 329 | 1.4% |
| Portuguese | 413 | 1.8% |
| Puerto Rican | 35 | 0.2% |
| Russian | 197 | 0.9% |
| Salvadoran | 26 | 0.1% |
| Samoan | 20 | 0.1% |
| Scandinavian | 4 | 0.0% |
| Scotch-Irish | 146 | 0.6% |
| Scottish | 306 | 1.3% |
| Shoshone | 10 | 0.0% |
| Slavic | 12 | 0.1% |
| South American | 164 | 0.7% |
| Spaniard | 111 | 0.5% |
| Spanish | 37 | 0.2% |
| Sri Lankan | 68 | 0.3% |
| Subsaharan African | 95 | 0.4% |
| Swedish | 96 | 0.4% |
| Swiss | 10 | 0.0% |
| Thai | 571 | 2.5% |
| Tlingit-Haida | 5 | 0.0% |
| Tongan | 86 | 0.4% |
| Ukrainian | 4 | 0.0% |
| Venezuelan | 17 | 0.1% |
| Welsh | 39 | 0.2% |
| Yaqui | 84 | 0.4% | View All 74 Rows |
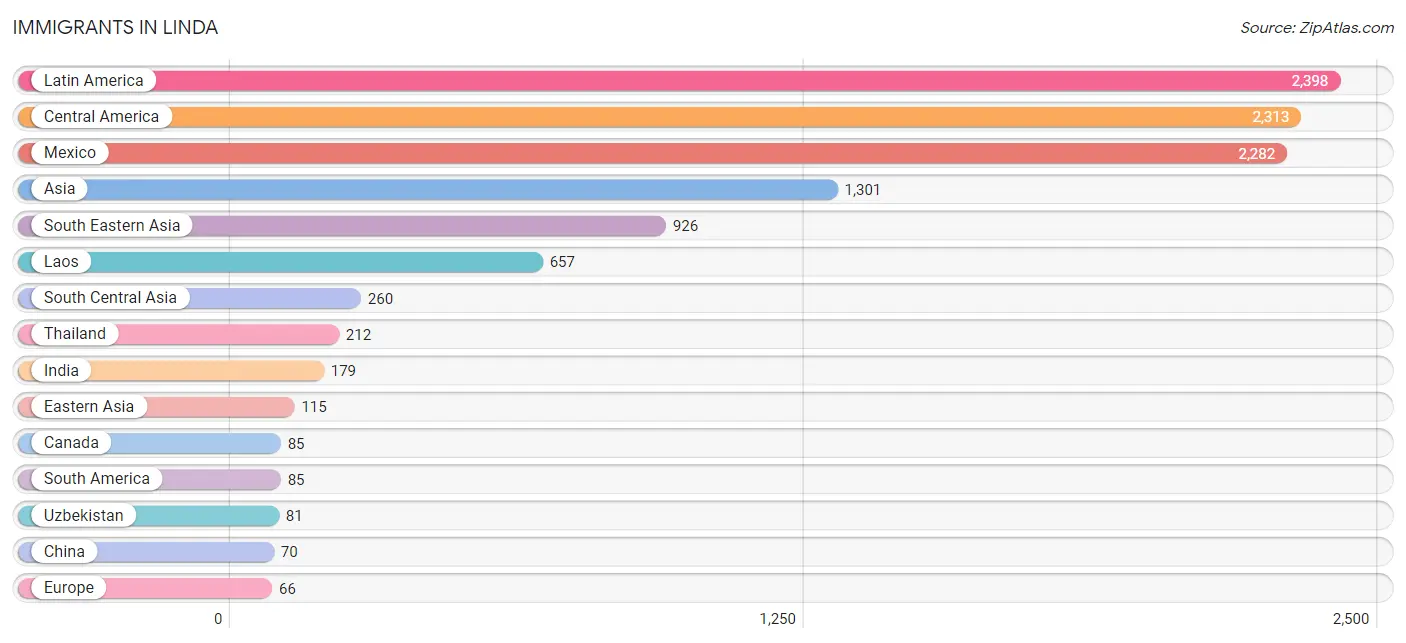
Immigrants in Linda
The most numerous immigrant groups reported in Linda came from Latin America (2,398 | 10.3%), Central America (2,313 | 9.9%), Mexico (2,282 | 9.8%), Asia (1,301 | 5.6%), and South Eastern Asia (926 | 4.0%), together accounting for 39.6% of all Linda residents.
| Immigration Origin | # Population | % Population |
| Argentina | 4 | 0.0% |
| Asia | 1,301 | 5.6% |
| Canada | 85 | 0.4% |
| Central America | 2,313 | 9.9% |
| Chile | 19 | 0.1% |
| China | 70 | 0.3% |
| Eastern Asia | 115 | 0.5% |
| El Salvador | 20 | 0.1% |
| England | 42 | 0.2% |
| Europe | 66 | 0.3% |
| Fiji | 57 | 0.3% |
| Hong Kong | 14 | 0.1% |
| India | 179 | 0.8% |
| Japan | 42 | 0.2% |
| Korea | 3 | 0.0% |
| Laos | 657 | 2.8% |
| Latin America | 2,398 | 10.3% |
| Mexico | 2,282 | 9.8% |
| Nicaragua | 11 | 0.1% |
| Northern Europe | 66 | 0.3% |
| Oceania | 62 | 0.3% |
| Peru | 56 | 0.2% |
| Philippines | 57 | 0.3% |
| South America | 85 | 0.4% |
| South Central Asia | 260 | 1.1% |
| South Eastern Asia | 926 | 4.0% |
| Taiwan | 20 | 0.1% |
| Thailand | 212 | 0.9% |
| Uzbekistan | 81 | 0.4% |
| Venezuela | 6 | 0.0% | View All 30 Rows |
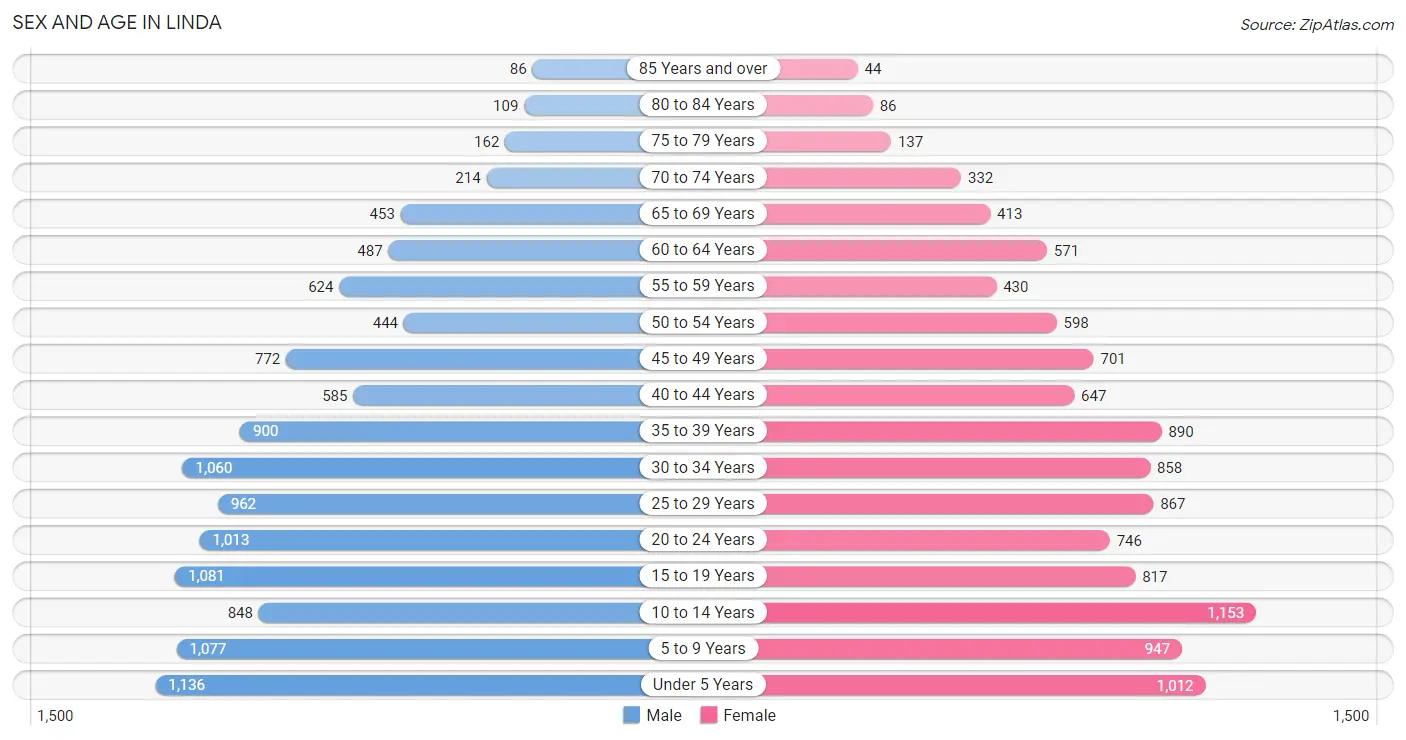
Sex and Age in Linda
Sex and Age in Linda
The most populous age groups in Linda are Under 5 Years (1,136 | 9.5%) for men and 10 to 14 Years (1,153 | 10.2%) for women.
| Age Bracket | Male | Female |
| Under 5 Years | 1,136 (9.5%) | 1,012 (9.0%) |
| 5 to 9 Years | 1,077 (9.0%) | 947 (8.4%) |
| 10 to 14 Years | 848 (7.1%) | 1,153 (10.2%) |
| 15 to 19 Years | 1,081 (9.0%) | 817 (7.3%) |
| 20 to 24 Years | 1,013 (8.4%) | 746 (6.6%) |
| 25 to 29 Years | 962 (8.0%) | 867 (7.7%) |
| 30 to 34 Years | 1,060 (8.8%) | 858 (7.6%) |
| 35 to 39 Years | 900 (7.5%) | 890 (7.9%) |
| 40 to 44 Years | 585 (4.9%) | 647 (5.8%) |
| 45 to 49 Years | 772 (6.4%) | 701 (6.2%) |
| 50 to 54 Years | 444 (3.7%) | 598 (5.3%) |
| 55 to 59 Years | 624 (5.2%) | 430 (3.8%) |
| 60 to 64 Years | 487 (4.1%) | 571 (5.1%) |
| 65 to 69 Years | 453 (3.8%) | 413 (3.7%) |
| 70 to 74 Years | 214 (1.8%) | 332 (2.9%) |
| 75 to 79 Years | 162 (1.3%) | 137 (1.2%) |
| 80 to 84 Years | 109 (0.9%) | 86 (0.8%) |
| 85 Years and over | 86 (0.7%) | 44 (0.4%) |
| Total | 12,013 (100.0%) | 11,249 (100.0%) |
Families and Households in Linda
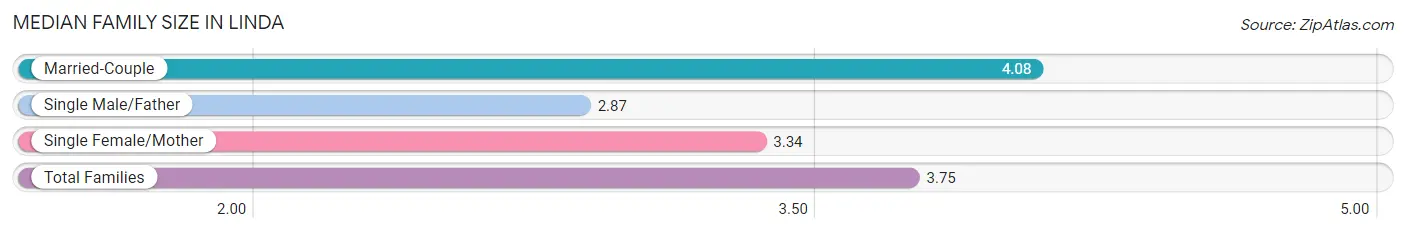
Median Family Size in Linda
The median family size in Linda is 3.75 persons per family, with married-couple families (3,267 | 62.3%) accounting for the largest median family size of 4.08 persons per family. On the other hand, single male/father families (596 | 11.4%) represent the smallest median family size with 2.87 persons per family.
| Family Type | # Families | Family Size |
| Married-Couple | 3,267 (62.3%) | 4.08 |
| Single Male/Father | 596 (11.4%) | 2.87 |
| Single Female/Mother | 1,378 (26.3%) | 3.34 |
| Total Families | 5,241 (100.0%) | 3.75 |
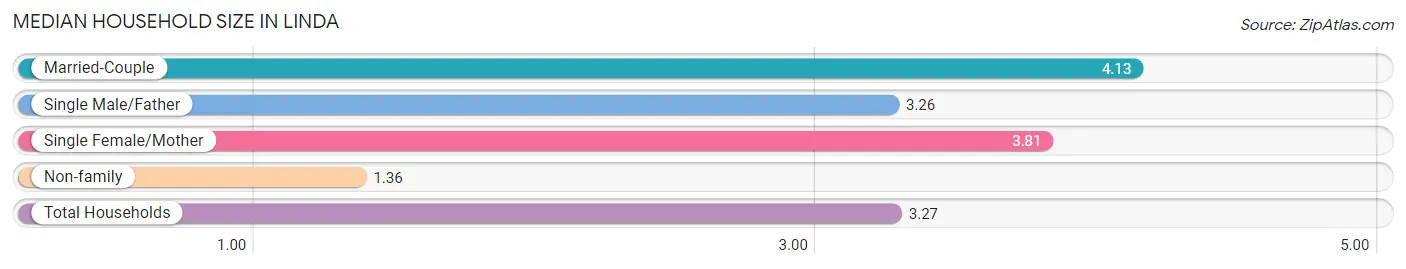
Median Household Size in Linda
The median household size in Linda is 3.27 persons per household, with married-couple households (3,267 | 46.1%) accounting for the largest median household size of 4.13 persons per household. non-family households (1,854 | 26.1%) represent the smallest median household size with 1.36 persons per household.
| Household Type | # Households | Household Size |
| Married-Couple | 3,267 (46.1%) | 4.13 |
| Single Male/Father | 596 (8.4%) | 3.26 |
| Single Female/Mother | 1,378 (19.4%) | 3.81 |
| Non-family | 1,854 (26.1%) | 1.36 |
| Total Households | 7,095 (100.0%) | 3.27 |
Household Size by Marriage Status in Linda
Out of a total of 7,095 households in Linda, 5,241 (73.9%) are family households, while 1,854 (26.1%) are nonfamily households. The most numerous type of family households are 2-person households, comprising 1,233, and the most common type of nonfamily households are 1-person households, comprising 1,295.
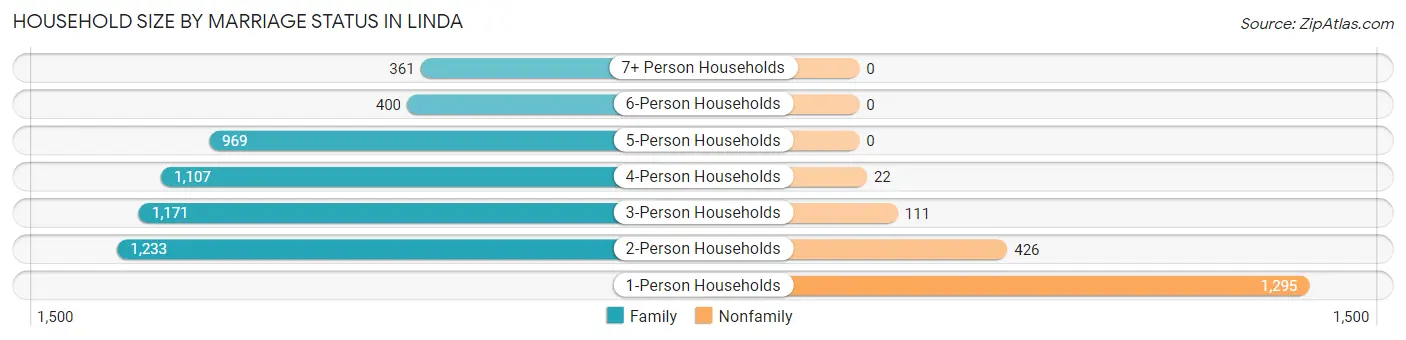
| Household Size | Family Households | Nonfamily Households |
| 1-Person Households | - | 1,295 (18.2%) |
| 2-Person Households | 1,233 (17.4%) | 426 (6.0%) |
| 3-Person Households | 1,171 (16.5%) | 111 (1.6%) |
| 4-Person Households | 1,107 (15.6%) | 22 (0.3%) |
| 5-Person Households | 969 (13.7%) | 0 (0.0%) |
| 6-Person Households | 400 (5.6%) | 0 (0.0%) |
| 7+ Person Households | 361 (5.1%) | 0 (0.0%) |
| Total | 5,241 (73.9%) | 1,854 (26.1%) |
Female Fertility in Linda
Fertility by Age in Linda
Average fertility rate in Linda is 77.0 births per 1,000 women. Women in the age bracket of 20 to 34 years have the highest fertility rate with 127.0 births per 1,000 women. Women in the age bracket of 20 to 34 years acount for 72.6% of all women with births.
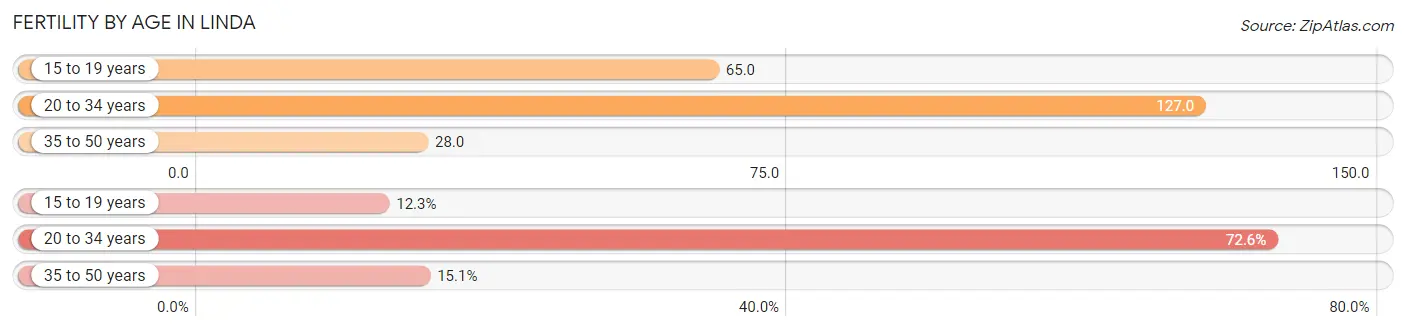
| Age Bracket | Women with Births | Births / 1,000 Women |
| 15 to 19 years | 53 (12.3%) | 65.0 |
| 20 to 34 years | 313 (72.6%) | 127.0 |
| 35 to 50 years | 65 (15.1%) | 28.0 |
| Total | 431 (100.0%) | 77.0 |
Fertility by Age by Marriage Status in Linda
42.2% of women with births (431) in Linda are married. The highest percentage of unmarried women with births falls into 15 to 19 years age bracket with 100.0% of them unmarried at the time of birth, while the lowest percentage of unmarried women with births belong to 35 to 50 years age bracket with 12.3% of them unmarried.
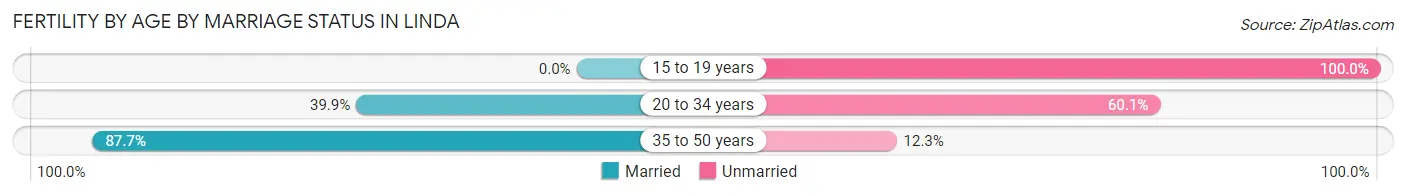
| Age Bracket | Married | Unmarried |
| 15 to 19 years | 0 (0.0%) | 53 (100.0%) |
| 20 to 34 years | 125 (39.9%) | 188 (60.1%) |
| 35 to 50 years | 57 (87.7%) | 8 (12.3%) |
| Total | 182 (42.2%) | 249 (57.8%) |
Fertility by Education in Linda
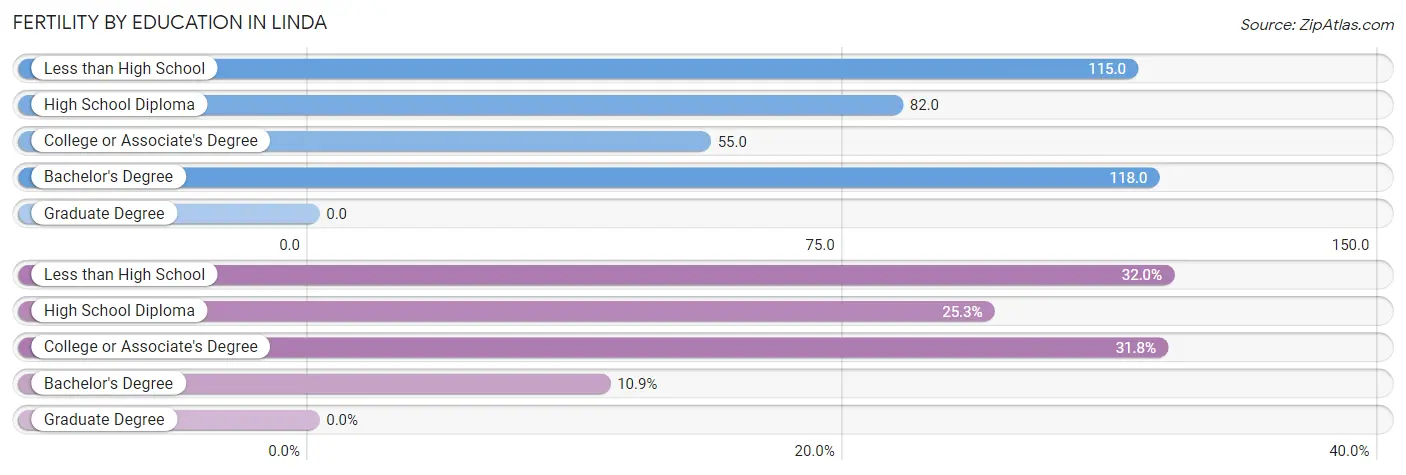
| Educational Attainment | Women with Births | Births / 1,000 Women |
| Less than High School | 138 (32.0%) | 115.0 |
| High School Diploma | 109 (25.3%) | 82.0 |
| College or Associate's Degree | 137 (31.8%) | 55.0 |
| Bachelor's Degree | 47 (10.9%) | 118.0 |
| Graduate Degree | 0 (0.0%) | 0.0 |
| Total | 431 (100.0%) | 77.0 |
Fertility by Education by Marriage Status in Linda
57.8% of women with births in Linda are unmarried. Women with the educational attainment of college or associate's degree are most likely to be married with 65.0% of them married at childbirth, while women with the educational attainment of less than high school are least likely to be married with 78.3% of them unmarried at childbirth.
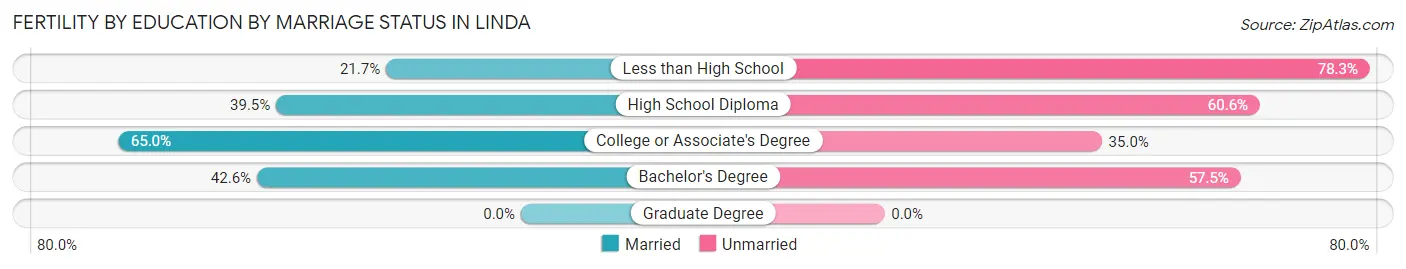
| Educational Attainment | Married | Unmarried |
| Less than High School | 30 (21.7%) | 108 (78.3%) |
| High School Diploma | 43 (39.5%) | 66 (60.6%) |
| College or Associate's Degree | 89 (65.0%) | 48 (35.0%) |
| Bachelor's Degree | 20 (42.5%) | 27 (57.5%) |
| Graduate Degree | 0 (0.0%) | 0 (0.0%) |
| Total | 182 (42.2%) | 249 (57.8%) |
Employment Characteristics in Linda
Employment by Class of Employer in Linda
Among the 8,292 employed individuals in Linda, private company employees (5,591 | 67.4%), federal government employees (703 | 8.5%), and self-employed (not incorporated) (595 | 7.2%) make up the most common classes of employment.
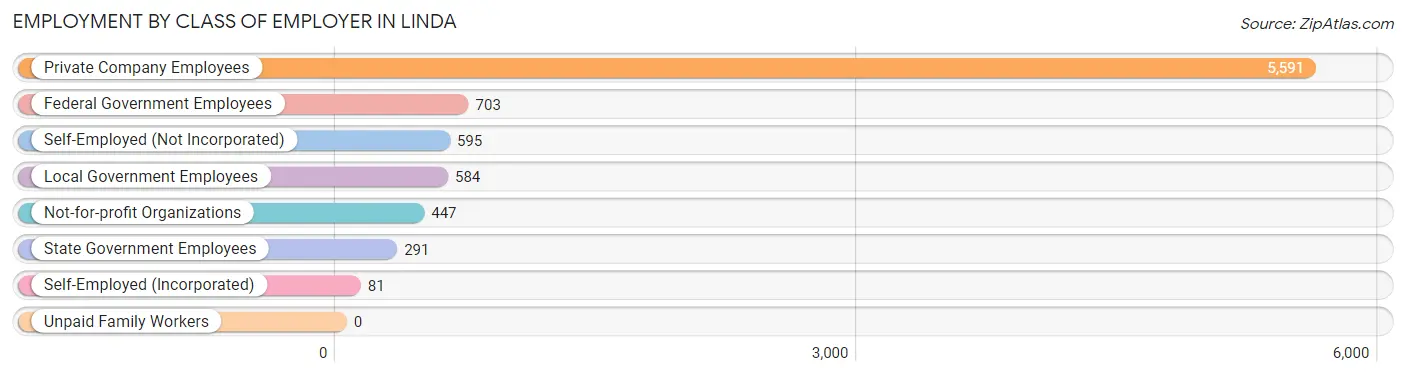
| Employer Class | # Employees | % Employees |
| Private Company Employees | 5,591 | 67.4% |
| Self-Employed (Incorporated) | 81 | 1.0% |
| Self-Employed (Not Incorporated) | 595 | 7.2% |
| Not-for-profit Organizations | 447 | 5.4% |
| Local Government Employees | 584 | 7.0% |
| State Government Employees | 291 | 3.5% |
| Federal Government Employees | 703 | 8.5% |
| Unpaid Family Workers | 0 | 0.0% |
| Total | 8,292 | 100.0% |
Employment Status by Age in Linda
According to the labor force statistics for Linda, out of the total population over 16 years of age (16,739), 56.1% or 9,391 individuals are in the labor force, with 10.3% or 967 of them unemployed. The age group with the highest labor force participation rate is 35 to 44 years, with 81.3% or 2,457 individuals in the labor force. Within the labor force, the 16 to 19 years age range has the highest percentage of unemployed individuals, with 21.4% or 110 of them being unemployed.
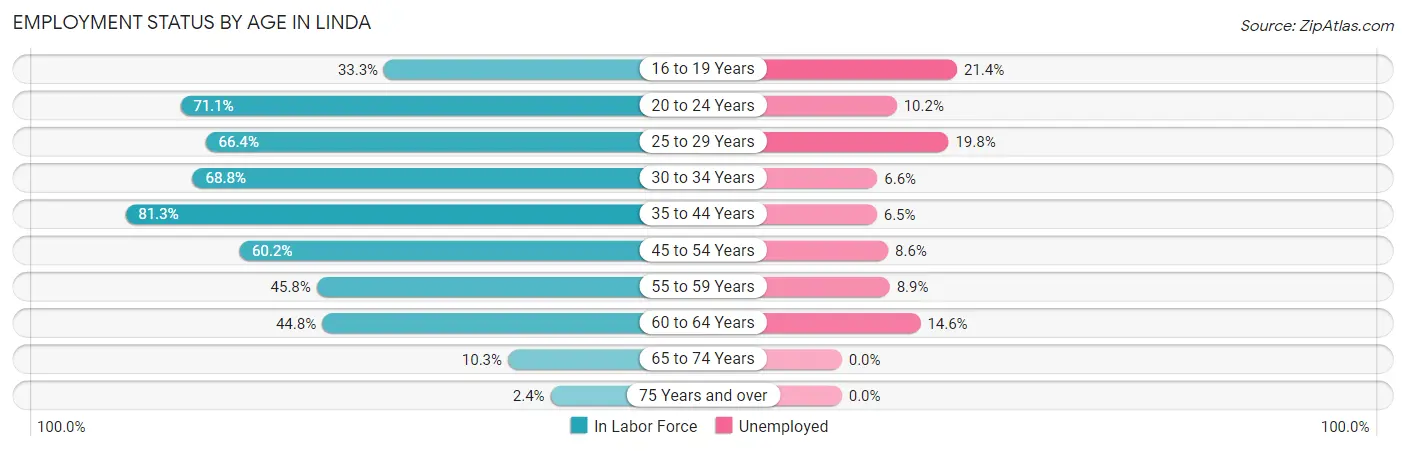
| Age Bracket | In Labor Force | Unemployed |
| 16 to 19 Years | 515 (33.3%) | 110 (21.4%) |
| 20 to 24 Years | 1,251 (71.1%) | 128 (10.2%) |
| 25 to 29 Years | 1,214 (66.4%) | 240 (19.8%) |
| 30 to 34 Years | 1,320 (68.8%) | 87 (6.6%) |
| 35 to 44 Years | 2,457 (81.3%) | 160 (6.5%) |
| 45 to 54 Years | 1,514 (60.2%) | 130 (8.6%) |
| 55 to 59 Years | 483 (45.8%) | 43 (8.9%) |
| 60 to 64 Years | 474 (44.8%) | 69 (14.6%) |
| 65 to 74 Years | 145 (10.3%) | 0 (0.0%) |
| 75 Years and over | 15 (2.4%) | 0 (0.0%) |
| Total | 9,391 (56.1%) | 967 (10.3%) |
Employment Status by Educational Attainment in Linda
According to labor force statistics for Linda, 65.5% of individuals (7,464) out of the total population between 25 and 64 years of age (11,396) are in the labor force, with 9.7% or 724 of them being unemployed. The group with the highest labor force participation rate are those with the educational attainment of bachelor's degree or higher, with 84.7% or 1,392 individuals in the labor force. Within the labor force, individuals with less than high school education have the highest percentage of unemployment, with 14.5% or 176 of them being unemployed.
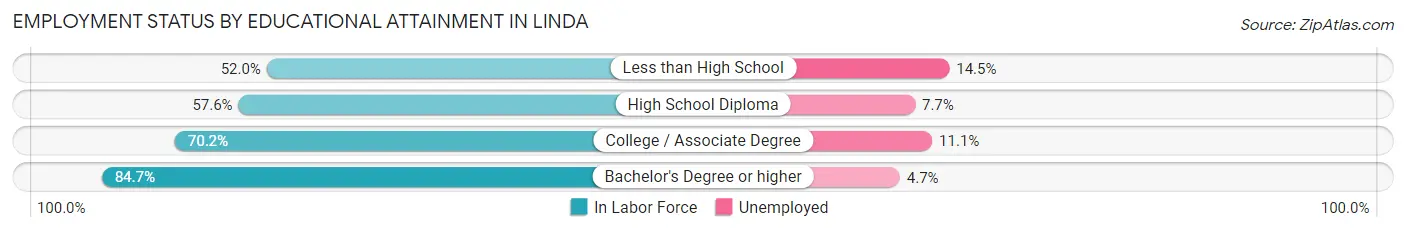
| Educational Attainment | In Labor Force | Unemployed |
| Less than High School | 1,213 (52.0%) | 338 (14.5%) |
| High School Diploma | 1,614 (57.6%) | 216 (7.7%) |
| College / Associate Degree | 3,243 (70.2%) | 513 (11.1%) |
| Bachelor's Degree or higher | 1,392 (84.7%) | 77 (4.7%) |
| Total | 7,464 (65.5%) | 1,105 (9.7%) |
Employment Occupations by Sex in Linda
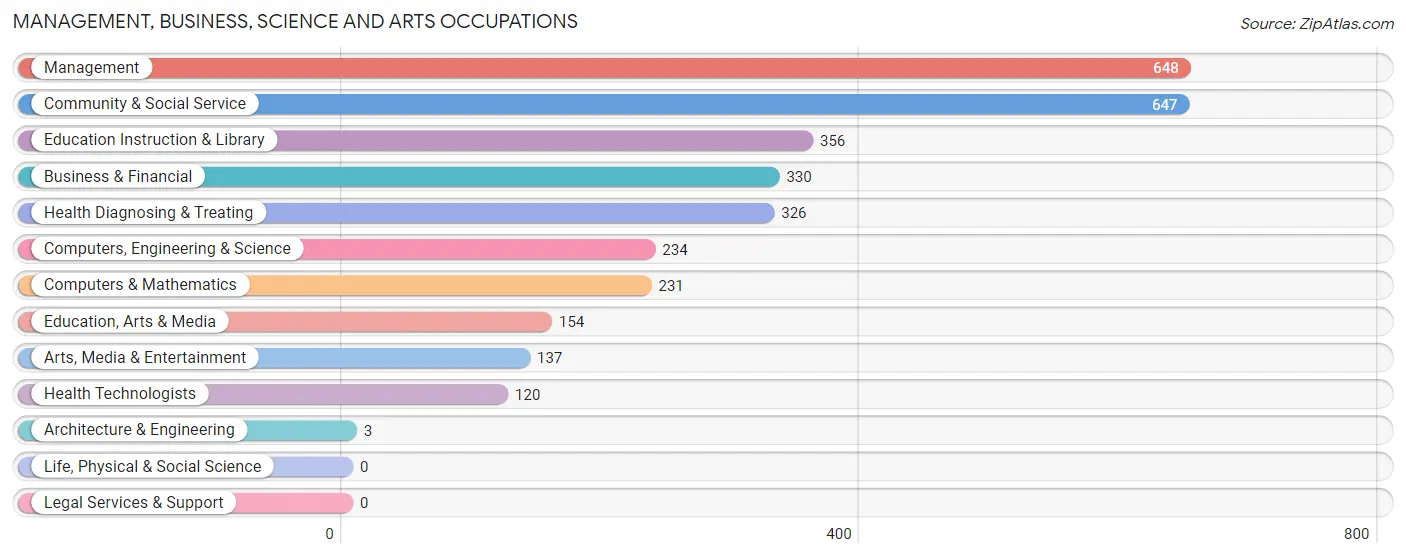
Management, Business, Science and Arts Occupations
The most common Management, Business, Science and Arts occupations in Linda are Management (648 | 8.0%), Community & Social Service (647 | 8.0%), Education Instruction & Library (356 | 4.4%), Business & Financial (330 | 4.1%), and Health Diagnosing & Treating (326 | 4.0%).
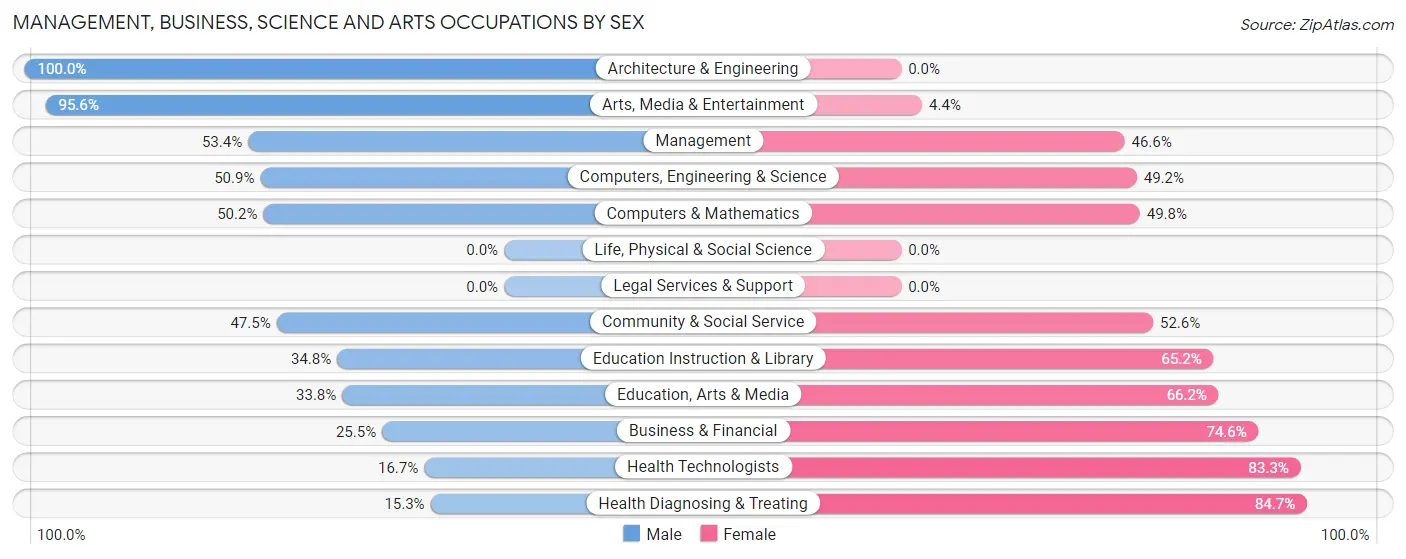
Management, Business, Science and Arts Occupations by Sex
Within the Management, Business, Science and Arts occupations in Linda, the most male-oriented occupations are Architecture & Engineering (100.0%), Arts, Media & Entertainment (95.6%), and Management (53.4%), while the most female-oriented occupations are Health Diagnosing & Treating (84.7%), Health Technologists (83.3%), and Business & Financial (74.6%).
| Occupation | Male | Female |
| Management | 346 (53.4%) | 302 (46.6%) |
| Business & Financial | 84 (25.5%) | 246 (74.6%) |
| Computers, Engineering & Science | 119 (50.8%) | 115 (49.1%) |
| Computers & Mathematics | 116 (50.2%) | 115 (49.8%) |
| Architecture & Engineering | 3 (100.0%) | 0 (0.0%) |
| Life, Physical & Social Science | 0 (0.0%) | 0 (0.0%) |
| Community & Social Service | 307 (47.4%) | 340 (52.5%) |
| Education, Arts & Media | 52 (33.8%) | 102 (66.2%) |
| Legal Services & Support | 0 (0.0%) | 0 (0.0%) |
| Education Instruction & Library | 124 (34.8%) | 232 (65.2%) |
| Arts, Media & Entertainment | 131 (95.6%) | 6 (4.4%) |
| Health Diagnosing & Treating | 50 (15.3%) | 276 (84.7%) |
| Health Technologists | 20 (16.7%) | 100 (83.3%) |
| Total (Category) | 906 (41.5%) | 1,279 (58.5%) |
| Total (Overall) | 4,443 (54.9%) | 3,652 (45.1%) |
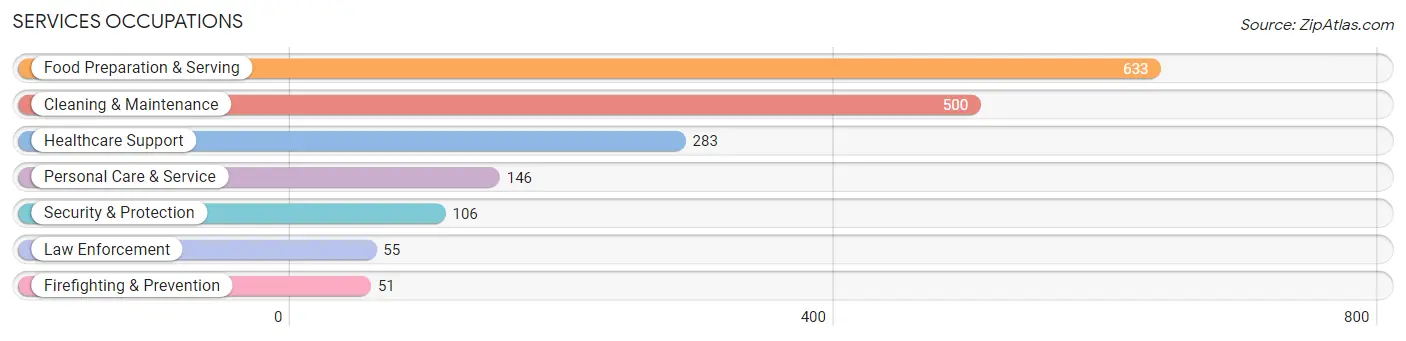
Services Occupations
The most common Services occupations in Linda are Food Preparation & Serving (633 | 7.8%), Cleaning & Maintenance (500 | 6.2%), Healthcare Support (283 | 3.5%), Personal Care & Service (146 | 1.8%), and Security & Protection (106 | 1.3%).
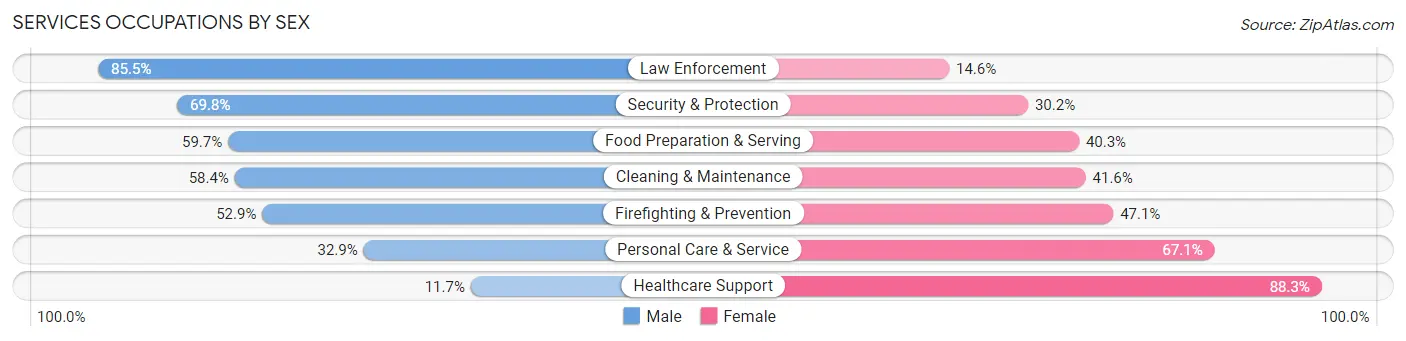
Services Occupations by Sex
Within the Services occupations in Linda, the most male-oriented occupations are Law Enforcement (85.5%), Security & Protection (69.8%), and Food Preparation & Serving (59.7%), while the most female-oriented occupations are Healthcare Support (88.3%), Personal Care & Service (67.1%), and Firefighting & Prevention (47.1%).
| Occupation | Male | Female |
| Healthcare Support | 33 (11.7%) | 250 (88.3%) |
| Security & Protection | 74 (69.8%) | 32 (30.2%) |
| Firefighting & Prevention | 27 (52.9%) | 24 (47.1%) |
| Law Enforcement | 47 (85.5%) | 8 (14.5%) |
| Food Preparation & Serving | 378 (59.7%) | 255 (40.3%) |
| Cleaning & Maintenance | 292 (58.4%) | 208 (41.6%) |
| Personal Care & Service | 48 (32.9%) | 98 (67.1%) |
| Total (Category) | 825 (49.5%) | 843 (50.5%) |
| Total (Overall) | 4,443 (54.9%) | 3,652 (45.1%) |
Sales and Office Occupations
The most common Sales and Office occupations in Linda are Office & Administration (989 | 12.2%), and Sales & Related (672 | 8.3%).
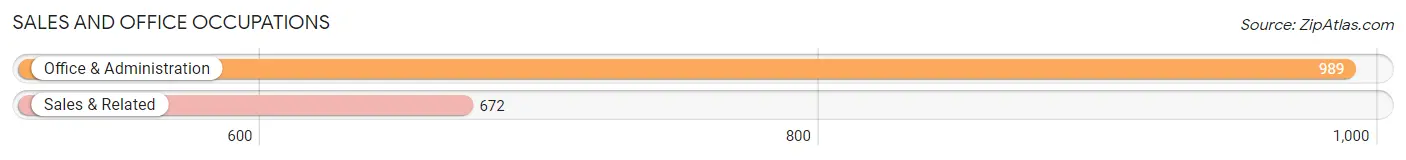
Sales and Office Occupations by Sex
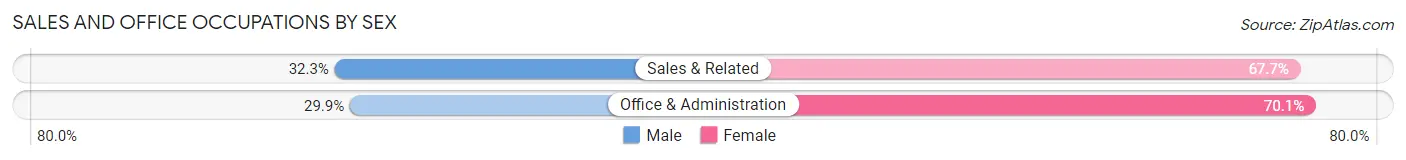
| Occupation | Male | Female |
| Sales & Related | 217 (32.3%) | 455 (67.7%) |
| Office & Administration | 296 (29.9%) | 693 (70.1%) |
| Total (Category) | 513 (30.9%) | 1,148 (69.1%) |
| Total (Overall) | 4,443 (54.9%) | 3,652 (45.1%) |
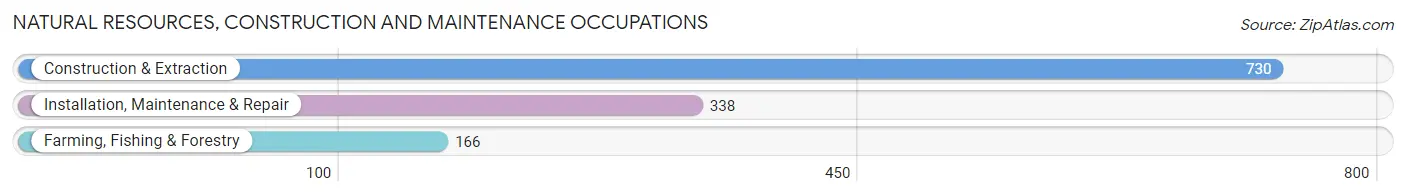
Natural Resources, Construction and Maintenance Occupations
The most common Natural Resources, Construction and Maintenance occupations in Linda are Construction & Extraction (730 | 9.0%), Installation, Maintenance & Repair (338 | 4.2%), and Farming, Fishing & Forestry (166 | 2.1%).
Natural Resources, Construction and Maintenance Occupations by Sex
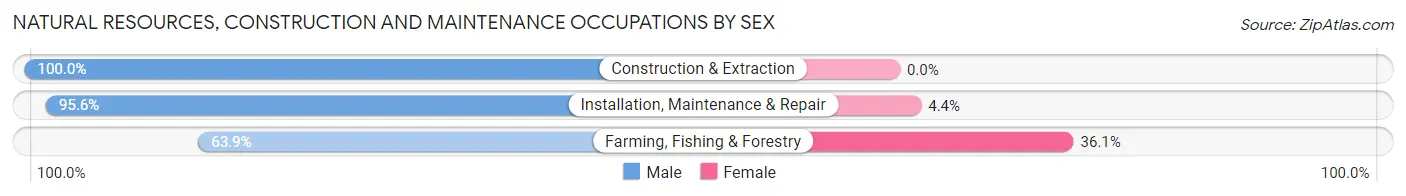
| Occupation | Male | Female |
| Farming, Fishing & Forestry | 106 (63.9%) | 60 (36.1%) |
| Construction & Extraction | 730 (100.0%) | 0 (0.0%) |
| Installation, Maintenance & Repair | 323 (95.6%) | 15 (4.4%) |
| Total (Category) | 1,159 (93.9%) | 75 (6.1%) |
| Total (Overall) | 4,443 (54.9%) | 3,652 (45.1%) |
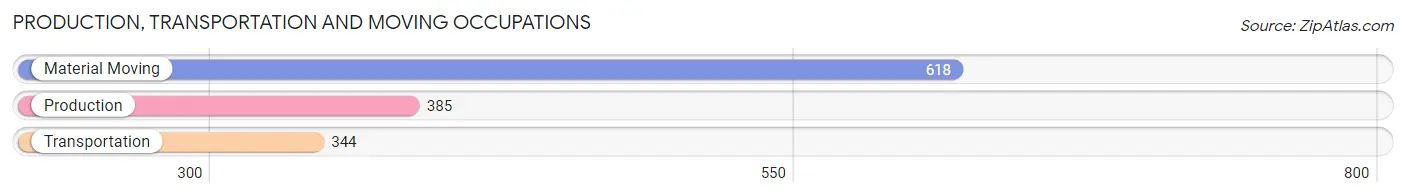
Production, Transportation and Moving Occupations
The most common Production, Transportation and Moving occupations in Linda are Material Moving (618 | 7.6%), Production (385 | 4.8%), and Transportation (344 | 4.3%).
Production, Transportation and Moving Occupations by Sex
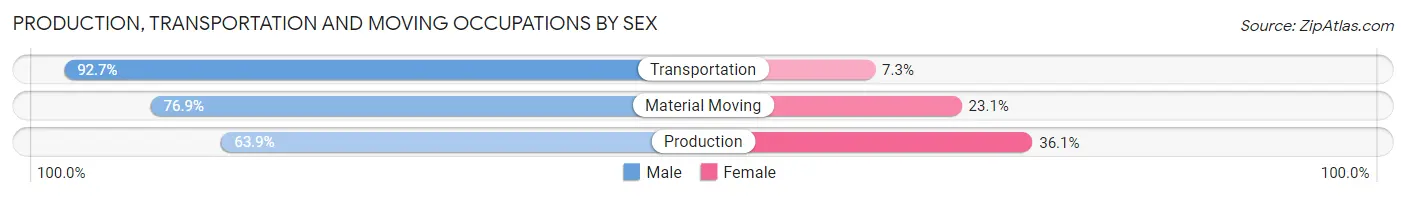
| Occupation | Male | Female |
| Production | 246 (63.9%) | 139 (36.1%) |
| Transportation | 319 (92.7%) | 25 (7.3%) |
| Material Moving | 475 (76.9%) | 143 (23.1%) |
| Total (Category) | 1,040 (77.2%) | 307 (22.8%) |
| Total (Overall) | 4,443 (54.9%) | 3,652 (45.1%) |
Employment Industries by Sex in Linda
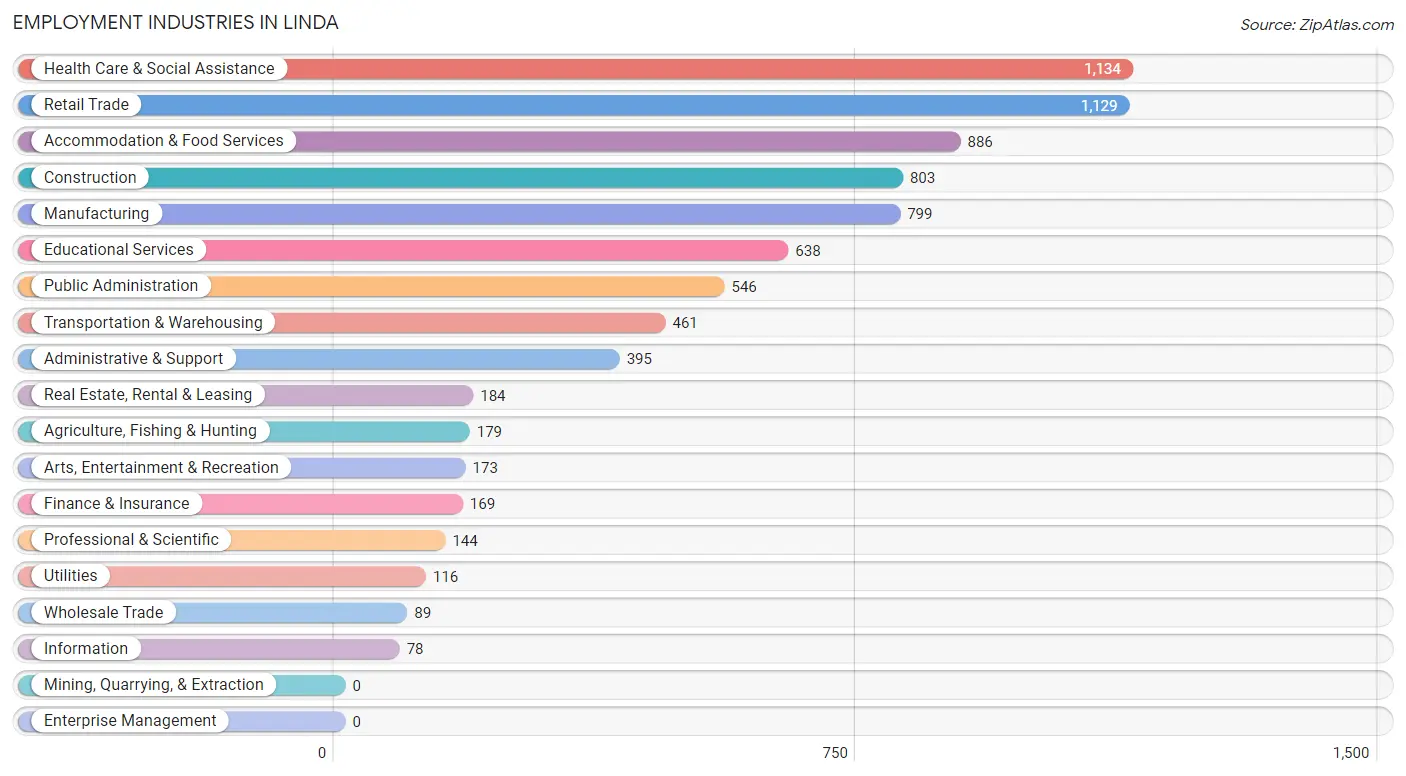
Employment Industries in Linda
The major employment industries in Linda include Health Care & Social Assistance (1,134 | 14.0%), Retail Trade (1,129 | 14.0%), Accommodation & Food Services (886 | 11.0%), Construction (803 | 9.9%), and Manufacturing (799 | 9.9%).
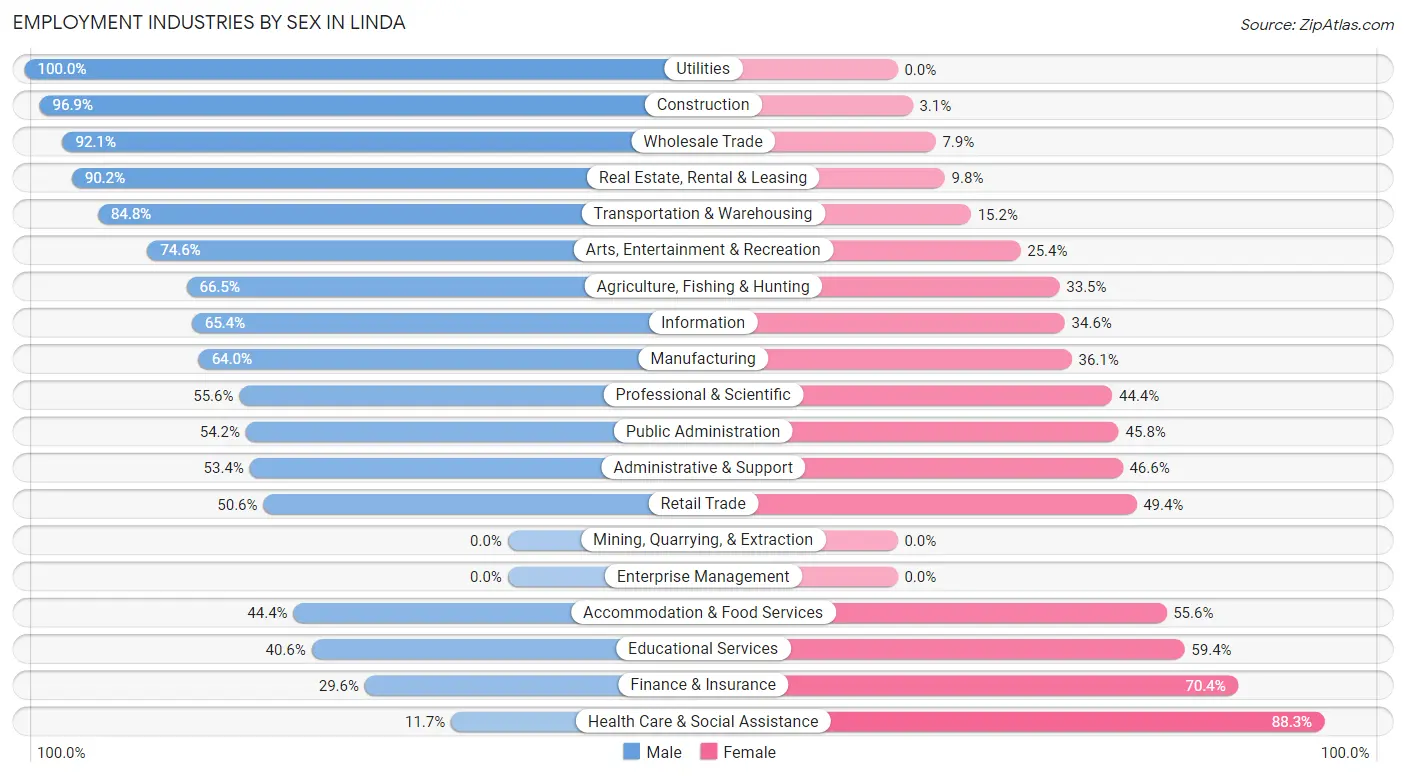
Employment Industries by Sex in Linda
The Linda industries that see more men than women are Utilities (100.0%), Construction (96.9%), and Wholesale Trade (92.1%), whereas the industries that tend to have a higher number of women are Health Care & Social Assistance (88.3%), Finance & Insurance (70.4%), and Educational Services (59.4%).
| Industry | Male | Female |
| Agriculture, Fishing & Hunting | 119 (66.5%) | 60 (33.5%) |
| Mining, Quarrying, & Extraction | 0 (0.0%) | 0 (0.0%) |
| Construction | 778 (96.9%) | 25 (3.1%) |
| Manufacturing | 511 (63.9%) | 288 (36.0%) |
| Wholesale Trade | 82 (92.1%) | 7 (7.9%) |
| Retail Trade | 571 (50.6%) | 558 (49.4%) |
| Transportation & Warehousing | 391 (84.8%) | 70 (15.2%) |
| Utilities | 116 (100.0%) | 0 (0.0%) |
| Information | 51 (65.4%) | 27 (34.6%) |
| Finance & Insurance | 50 (29.6%) | 119 (70.4%) |
| Real Estate, Rental & Leasing | 166 (90.2%) | 18 (9.8%) |
| Professional & Scientific | 80 (55.6%) | 64 (44.4%) |
| Enterprise Management | 0 (0.0%) | 0 (0.0%) |
| Administrative & Support | 211 (53.4%) | 184 (46.6%) |
| Educational Services | 259 (40.6%) | 379 (59.4%) |
| Health Care & Social Assistance | 133 (11.7%) | 1,001 (88.3%) |
| Arts, Entertainment & Recreation | 129 (74.6%) | 44 (25.4%) |
| Accommodation & Food Services | 393 (44.4%) | 493 (55.6%) |
| Public Administration | 296 (54.2%) | 250 (45.8%) |
| Total | 4,443 (54.9%) | 3,652 (45.1%) |
Education in Linda
School Enrollment in Linda
The most common levels of schooling among the 7,512 students in Linda are college / undergraduate (1,924 | 25.6%), elementary school (1,867 | 24.8%), and high school (1,436 | 19.1%).
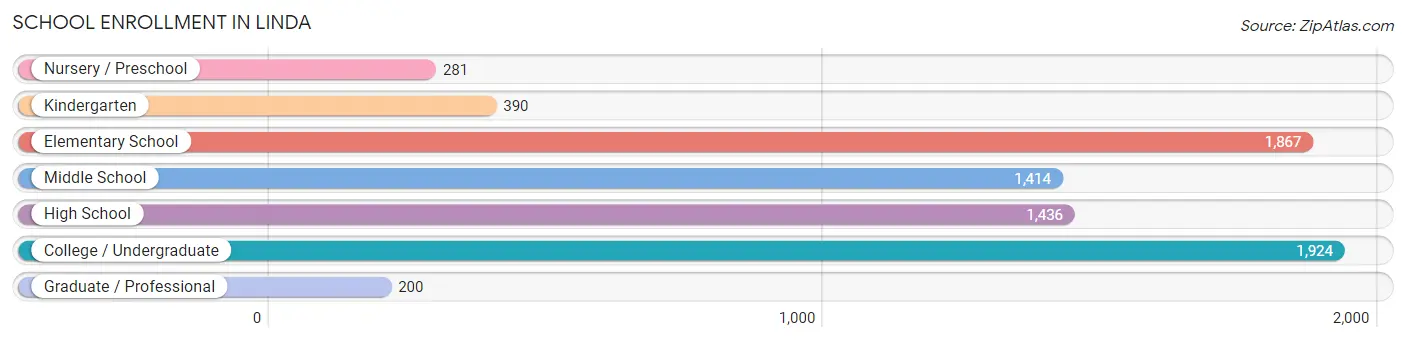
| School Level | # Students | % Students |
| Nursery / Preschool | 281 | 3.7% |
| Kindergarten | 390 | 5.2% |
| Elementary School | 1,867 | 24.8% |
| Middle School | 1,414 | 18.8% |
| High School | 1,436 | 19.1% |
| College / Undergraduate | 1,924 | 25.6% |
| Graduate / Professional | 200 | 2.7% |
| Total | 7,512 | 100.0% |
School Enrollment by Age by Funding Source in Linda
Out of a total of 7,512 students who are enrolled in schools in Linda, 639 (8.5%) attend a private institution, while the remaining 6,873 (91.5%) are enrolled in public schools. The age group of 25 to 34 year olds has the highest likelihood of being enrolled in private schools, with 186 (29.2% in the age bracket) enrolled. Conversely, the age group of 3 to 4 year olds has the lowest likelihood of being enrolled in a private school, with 275 (100.0% in the age bracket) attending a public institution.
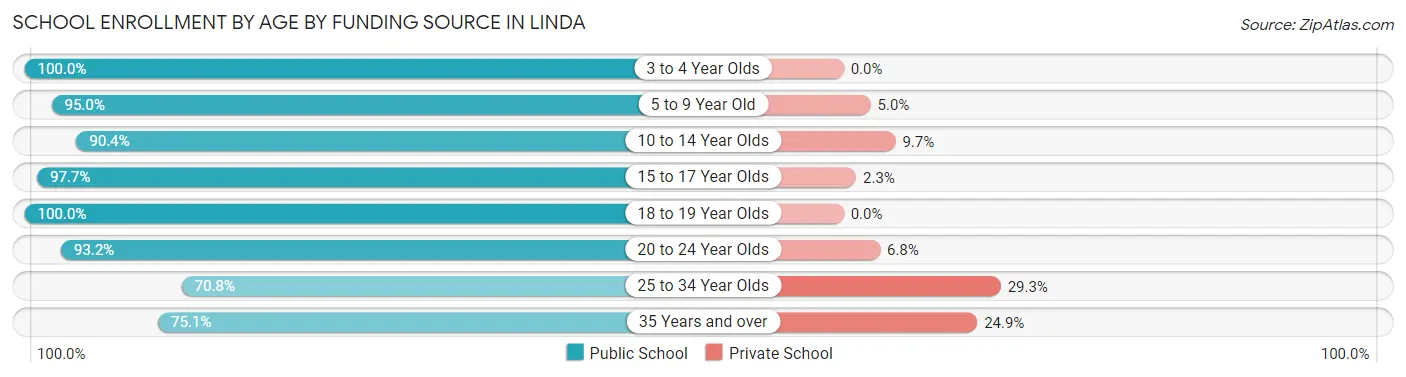
| Age Bracket | Public School | Private School |
| 3 to 4 Year Olds | 275 (100.0%) | 0 (0.0%) |
| 5 to 9 Year Old | 1,856 (95.0%) | 98 (5.0%) |
| 10 to 14 Year Olds | 1,808 (90.3%) | 193 (9.7%) |
| 15 to 17 Year Olds | 1,011 (97.7%) | 24 (2.3%) |
| 18 to 19 Year Olds | 631 (100.0%) | 0 (0.0%) |
| 20 to 24 Year Olds | 565 (93.2%) | 41 (6.8%) |
| 25 to 34 Year Olds | 450 (70.8%) | 186 (29.2%) |
| 35 Years and over | 281 (75.1%) | 93 (24.9%) |
| Total | 6,873 (91.5%) | 639 (8.5%) |
Educational Attainment by Field of Study in Linda
Business (349 | 18.4%), engineering (249 | 13.1%), arts & humanities (202 | 10.6%), science & technology (160 | 8.4%), and social sciences (159 | 8.4%) are the most common fields of study among 1,900 individuals in Linda who have obtained a bachelor's degree or higher.
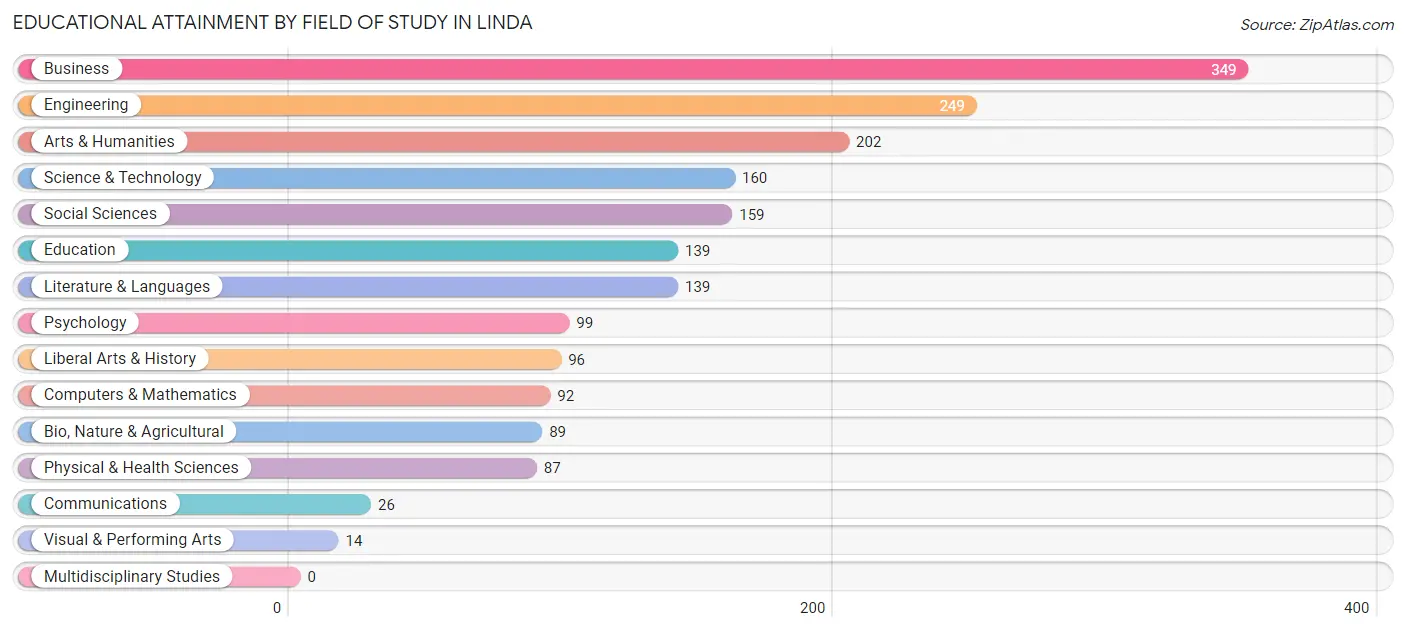
| Field of Study | # Graduates | % Graduates |
| Computers & Mathematics | 92 | 4.8% |
| Bio, Nature & Agricultural | 89 | 4.7% |
| Physical & Health Sciences | 87 | 4.6% |
| Psychology | 99 | 5.2% |
| Social Sciences | 159 | 8.4% |
| Engineering | 249 | 13.1% |
| Multidisciplinary Studies | 0 | 0.0% |
| Science & Technology | 160 | 8.4% |
| Business | 349 | 18.4% |
| Education | 139 | 7.3% |
| Literature & Languages | 139 | 7.3% |
| Liberal Arts & History | 96 | 5.1% |
| Visual & Performing Arts | 14 | 0.7% |
| Communications | 26 | 1.4% |
| Arts & Humanities | 202 | 10.6% |
| Total | 1,900 | 100.0% |
Transportation & Commute in Linda
Vehicle Availability by Sex in Linda
The most prevalent vehicle ownership categories in Linda are males with 2 vehicles (1,579, accounting for 34.2%) and females with 2 vehicles (1,100, making up 43.3%).
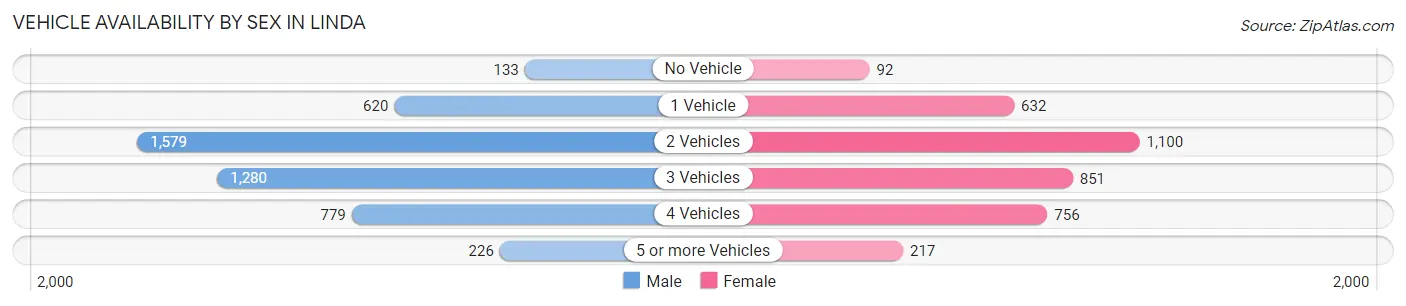
| Vehicles Available | Male | Female |
| No Vehicle | 133 (2.9%) | 92 (2.5%) |
| 1 Vehicle | 620 (13.4%) | 632 (17.3%) |
| 2 Vehicles | 1,579 (34.2%) | 1,100 (30.1%) |
| 3 Vehicles | 1,280 (27.7%) | 851 (23.3%) |
| 4 Vehicles | 779 (16.9%) | 756 (20.7%) |
| 5 or more Vehicles | 226 (4.9%) | 217 (5.9%) |
| Total | 4,617 (100.0%) | 3,648 (100.0%) |
Commute Time in Linda
The most frequently occuring commute durations in Linda are 15 to 19 minutes (1,665 commuters, 21.0%), 10 to 14 minutes (964 commuters, 12.1%), and 45 to 59 minutes (964 commuters, 12.1%).
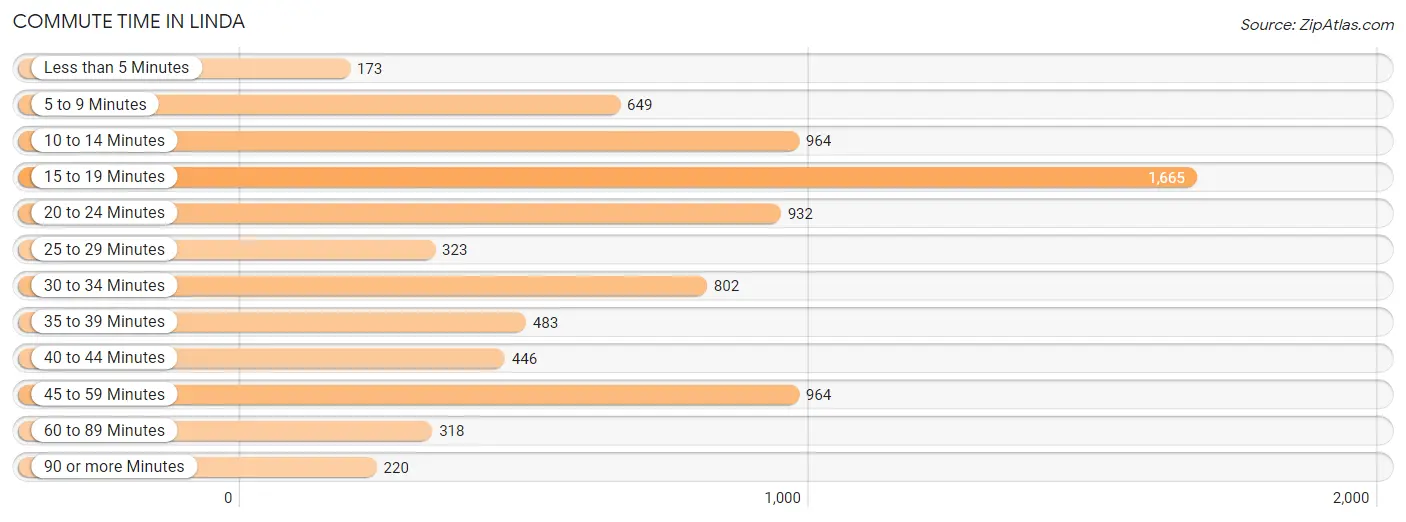
| Commute Time | # Commuters | % Commuters |
| Less than 5 Minutes | 173 | 2.2% |
| 5 to 9 Minutes | 649 | 8.2% |
| 10 to 14 Minutes | 964 | 12.1% |
| 15 to 19 Minutes | 1,665 | 21.0% |
| 20 to 24 Minutes | 932 | 11.7% |
| 25 to 29 Minutes | 323 | 4.1% |
| 30 to 34 Minutes | 802 | 10.1% |
| 35 to 39 Minutes | 483 | 6.1% |
| 40 to 44 Minutes | 446 | 5.6% |
| 45 to 59 Minutes | 964 | 12.1% |
| 60 to 89 Minutes | 318 | 4.0% |
| 90 or more Minutes | 220 | 2.8% |
Commute Time by Sex in Linda
The most common commute times in Linda are 15 to 19 minutes (1,078 commuters, 24.2%) for males and 15 to 19 minutes (587 commuters, 16.8%) for females.
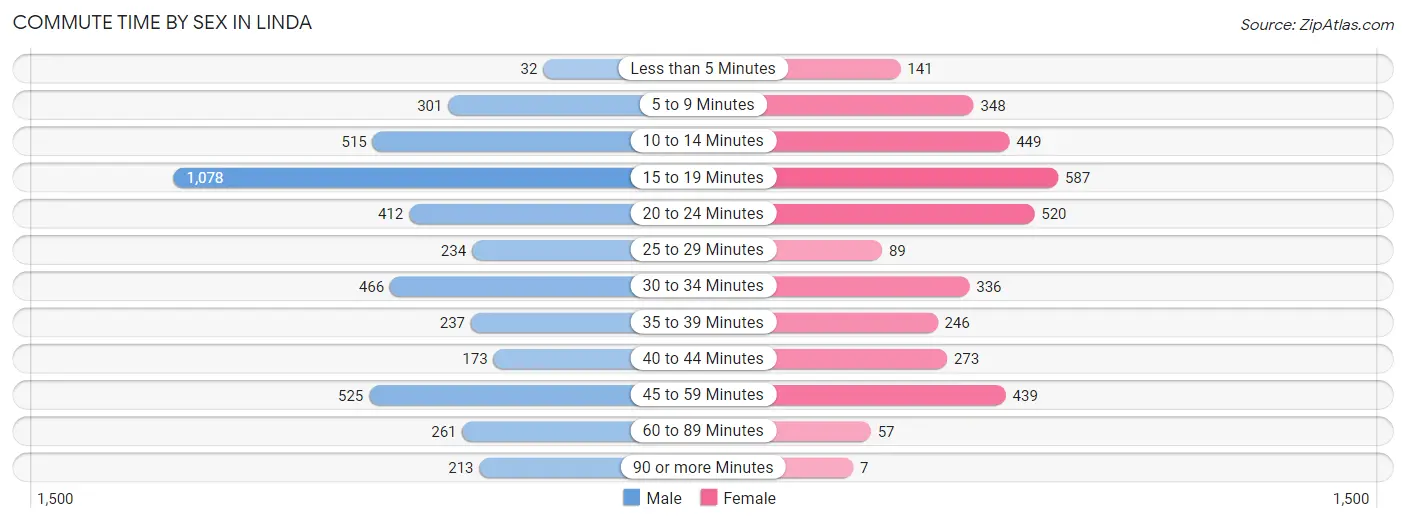
| Commute Time | Male | Female |
| Less than 5 Minutes | 32 (0.7%) | 141 (4.0%) |
| 5 to 9 Minutes | 301 (6.8%) | 348 (10.0%) |
| 10 to 14 Minutes | 515 (11.6%) | 449 (12.9%) |
| 15 to 19 Minutes | 1,078 (24.2%) | 587 (16.8%) |
| 20 to 24 Minutes | 412 (9.3%) | 520 (14.9%) |
| 25 to 29 Minutes | 234 (5.3%) | 89 (2.5%) |
| 30 to 34 Minutes | 466 (10.5%) | 336 (9.6%) |
| 35 to 39 Minutes | 237 (5.3%) | 246 (7.0%) |
| 40 to 44 Minutes | 173 (3.9%) | 273 (7.8%) |
| 45 to 59 Minutes | 525 (11.8%) | 439 (12.6%) |
| 60 to 89 Minutes | 261 (5.9%) | 57 (1.6%) |
| 90 or more Minutes | 213 (4.8%) | 7 (0.2%) |
Time of Departure to Work by Sex in Linda
The most frequent times of departure to work in Linda are 12:00 AM to 4:59 AM (674, 15.2%) for males and 7:30 AM to 7:59 AM (606, 17.3%) for females.
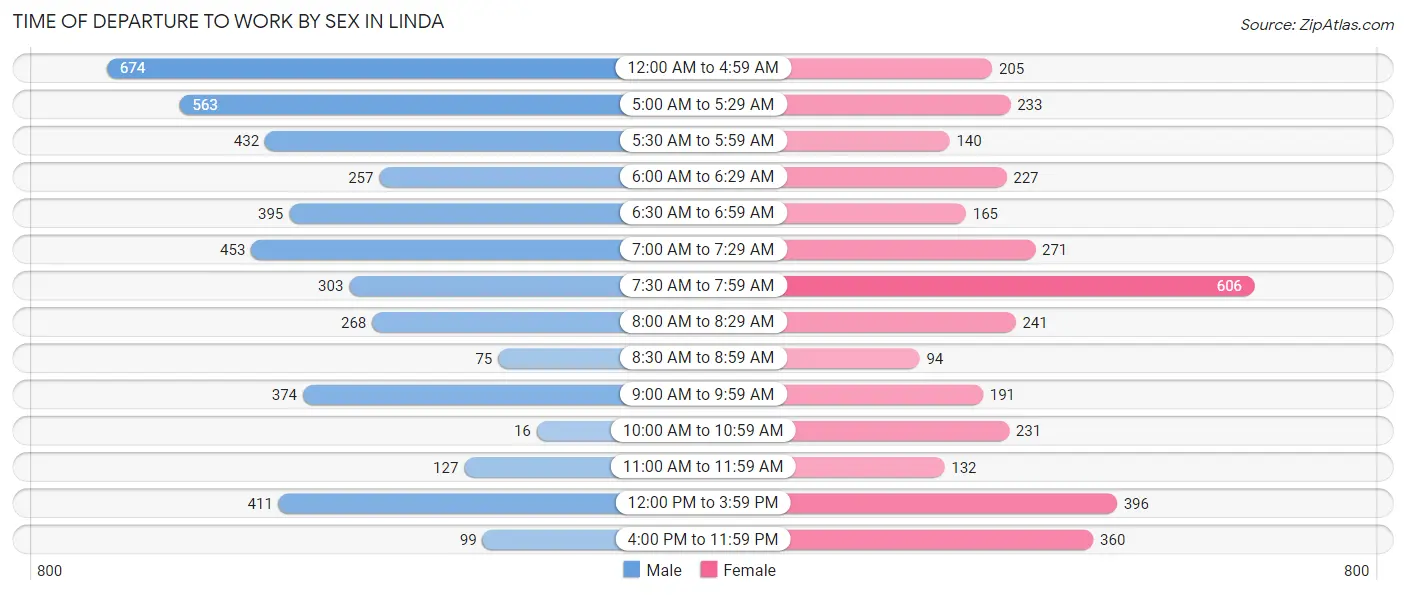
| Time of Departure | Male | Female |
| 12:00 AM to 4:59 AM | 674 (15.2%) | 205 (5.9%) |
| 5:00 AM to 5:29 AM | 563 (12.7%) | 233 (6.7%) |
| 5:30 AM to 5:59 AM | 432 (9.7%) | 140 (4.0%) |
| 6:00 AM to 6:29 AM | 257 (5.8%) | 227 (6.5%) |
| 6:30 AM to 6:59 AM | 395 (8.9%) | 165 (4.7%) |
| 7:00 AM to 7:29 AM | 453 (10.2%) | 271 (7.8%) |
| 7:30 AM to 7:59 AM | 303 (6.8%) | 606 (17.3%) |
| 8:00 AM to 8:29 AM | 268 (6.0%) | 241 (6.9%) |
| 8:30 AM to 8:59 AM | 75 (1.7%) | 94 (2.7%) |
| 9:00 AM to 9:59 AM | 374 (8.4%) | 191 (5.5%) |
| 10:00 AM to 10:59 AM | 16 (0.4%) | 231 (6.6%) |
| 11:00 AM to 11:59 AM | 127 (2.9%) | 132 (3.8%) |
| 12:00 PM to 3:59 PM | 411 (9.2%) | 396 (11.3%) |
| 4:00 PM to 11:59 PM | 99 (2.2%) | 360 (10.3%) |
| Total | 4,447 (100.0%) | 3,492 (100.0%) |
Housing Occupancy in Linda
Occupancy by Ownership in Linda
Of the total 7,095 dwellings in Linda, owner-occupied units account for 3,722 (52.5%), while renter-occupied units make up 3,373 (47.5%).
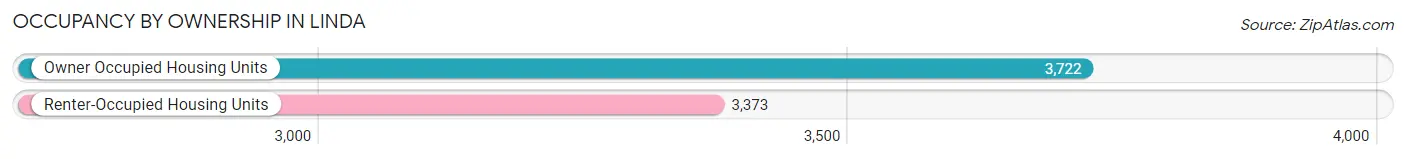
| Occupancy | # Housing Units | % Housing Units |
| Owner Occupied Housing Units | 3,722 | 52.5% |
| Renter-Occupied Housing Units | 3,373 | 47.5% |
| Total Occupied Housing Units | 7,095 | 100.0% |
Occupancy by Household Size in Linda
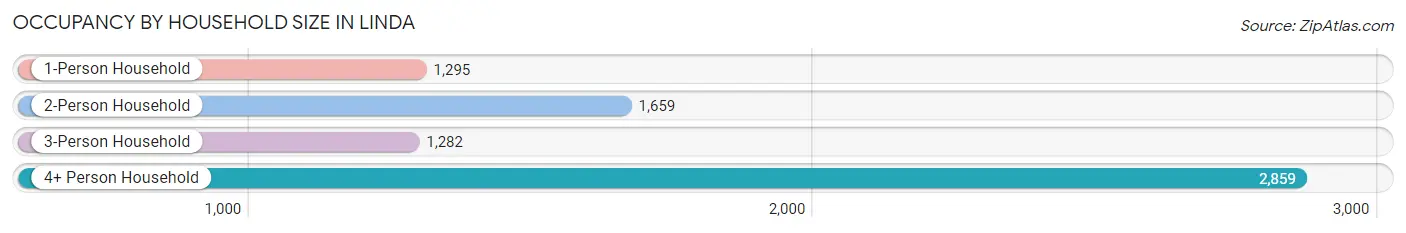
| Household Size | # Housing Units | % Housing Units |
| 1-Person Household | 1,295 | 18.2% |
| 2-Person Household | 1,659 | 23.4% |
| 3-Person Household | 1,282 | 18.1% |
| 4+ Person Household | 2,859 | 40.3% |
| Total Housing Units | 7,095 | 100.0% |
Occupancy by Ownership by Household Size in Linda
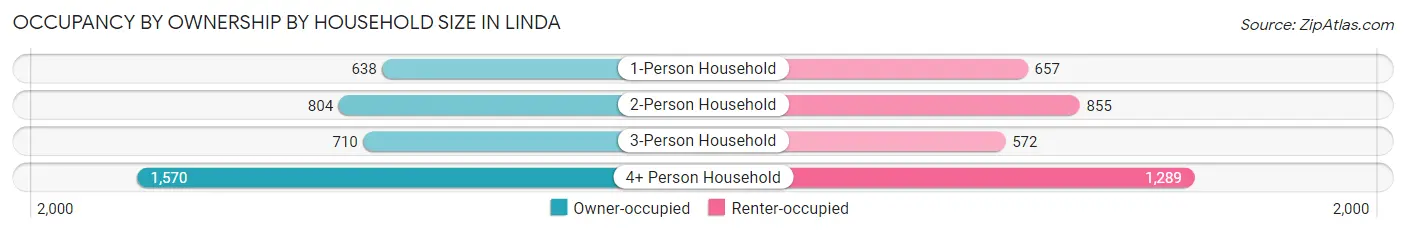
| Household Size | Owner-occupied | Renter-occupied |
| 1-Person Household | 638 (49.3%) | 657 (50.7%) |
| 2-Person Household | 804 (48.5%) | 855 (51.5%) |
| 3-Person Household | 710 (55.4%) | 572 (44.6%) |
| 4+ Person Household | 1,570 (54.9%) | 1,289 (45.1%) |
| Total Housing Units | 3,722 (52.5%) | 3,373 (47.5%) |
Occupancy by Educational Attainment in Linda
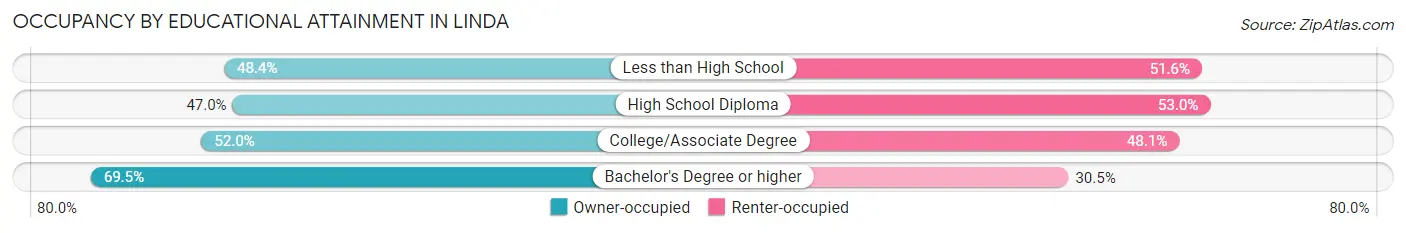
| Household Size | Owner-occupied | Renter-occupied |
| Less than High School | 692 (48.4%) | 739 (51.6%) |
| High School Diploma | 680 (47.0%) | 766 (53.0%) |
| College/Associate Degree | 1,721 (51.9%) | 1,592 (48.0%) |
| Bachelor's Degree or higher | 629 (69.5%) | 276 (30.5%) |
Occupancy by Age of Householder in Linda
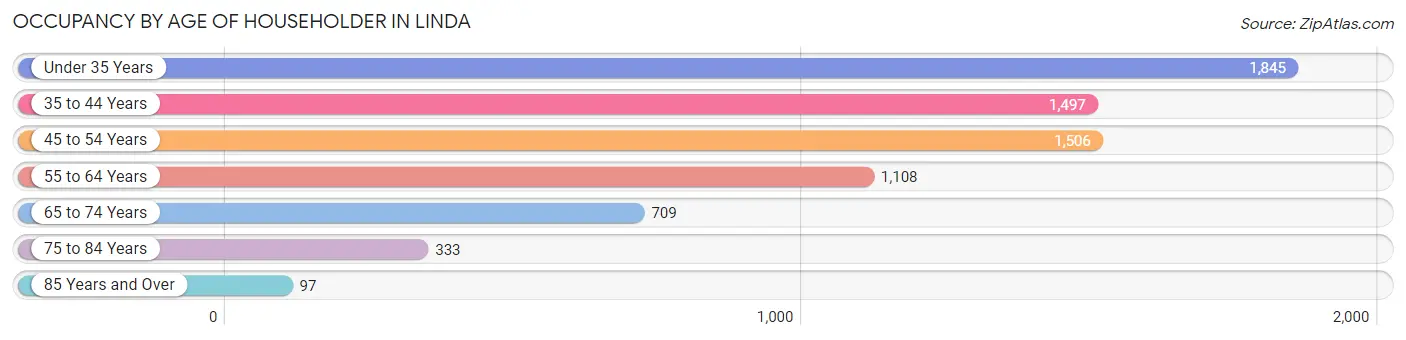
| Age Bracket | # Households | % Households |
| Under 35 Years | 1,845 | 26.0% |
| 35 to 44 Years | 1,497 | 21.1% |
| 45 to 54 Years | 1,506 | 21.2% |
| 55 to 64 Years | 1,108 | 15.6% |
| 65 to 74 Years | 709 | 10.0% |
| 75 to 84 Years | 333 | 4.7% |
| 85 Years and Over | 97 | 1.4% |
| Total | 7,095 | 100.0% |
Housing Finances in Linda
Median Income by Occupancy in Linda
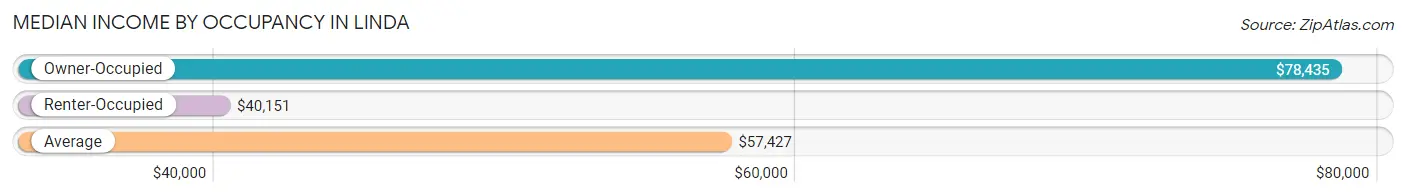
| Occupancy Type | # Households | Median Income |
| Owner-Occupied | 3,722 (52.5%) | $78,435 |
| Renter-Occupied | 3,373 (47.5%) | $40,151 |
| Average | 7,095 (100.0%) | $57,427 |
Occupancy by Householder Income Bracket in Linda
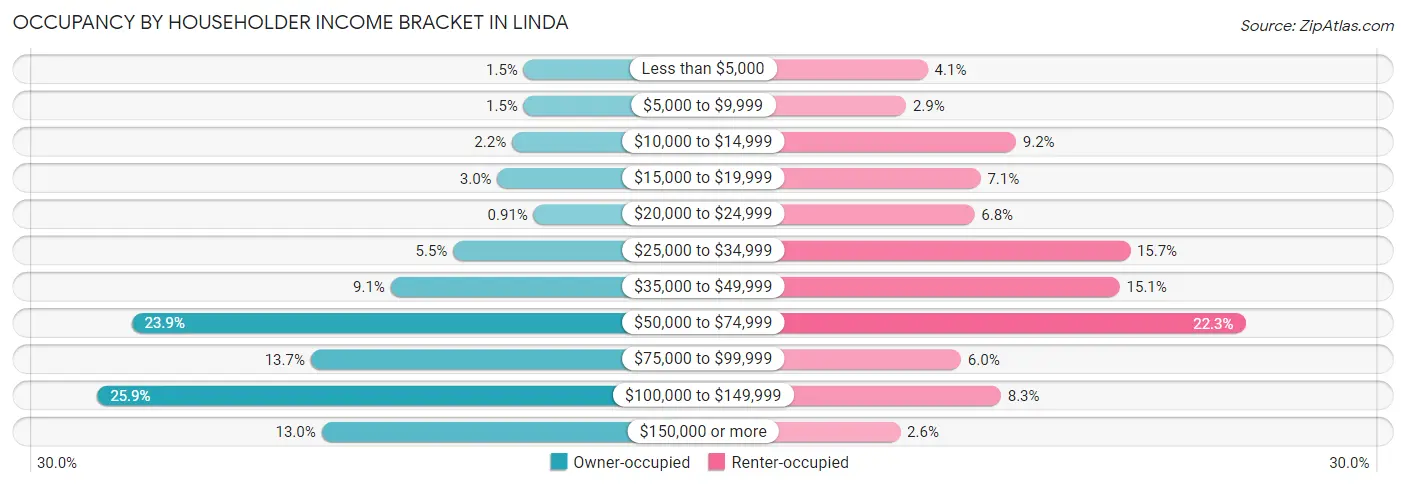
| Income Bracket | Owner-occupied | Renter-occupied |
| Less than $5,000 | 55 (1.5%) | 139 (4.1%) |
| $5,000 to $9,999 | 55 (1.5%) | 97 (2.9%) |
| $10,000 to $14,999 | 80 (2.1%) | 309 (9.2%) |
| $15,000 to $19,999 | 111 (3.0%) | 241 (7.1%) |
| $20,000 to $24,999 | 34 (0.9%) | 229 (6.8%) |
| $25,000 to $34,999 | 205 (5.5%) | 529 (15.7%) |
| $35,000 to $49,999 | 338 (9.1%) | 509 (15.1%) |
| $50,000 to $74,999 | 889 (23.9%) | 751 (22.3%) |
| $75,000 to $99,999 | 508 (13.7%) | 203 (6.0%) |
| $100,000 to $149,999 | 962 (25.9%) | 280 (8.3%) |
| $150,000 or more | 485 (13.0%) | 86 (2.5%) |
| Total | 3,722 (100.0%) | 3,373 (100.0%) |
Monthly Housing Cost Tiers in Linda
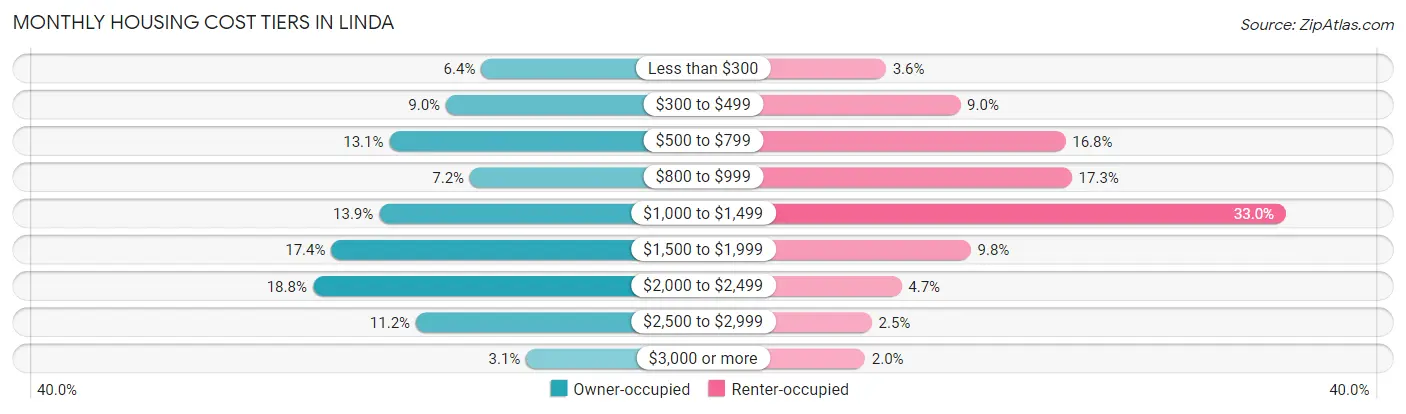
| Monthly Cost | Owner-occupied | Renter-occupied |
| Less than $300 | 237 (6.4%) | 120 (3.6%) |
| $300 to $499 | 334 (9.0%) | 305 (9.0%) |
| $500 to $799 | 489 (13.1%) | 566 (16.8%) |
| $800 to $999 | 268 (7.2%) | 582 (17.2%) |
| $1,000 to $1,499 | 517 (13.9%) | 1,114 (33.0%) |
| $1,500 to $1,999 | 648 (17.4%) | 331 (9.8%) |
| $2,000 to $2,499 | 699 (18.8%) | 159 (4.7%) |
| $2,500 to $2,999 | 416 (11.2%) | 85 (2.5%) |
| $3,000 or more | 114 (3.1%) | 68 (2.0%) |
| Total | 3,722 (100.0%) | 3,373 (100.0%) |
Physical Housing Characteristics in Linda
Housing Structures in Linda
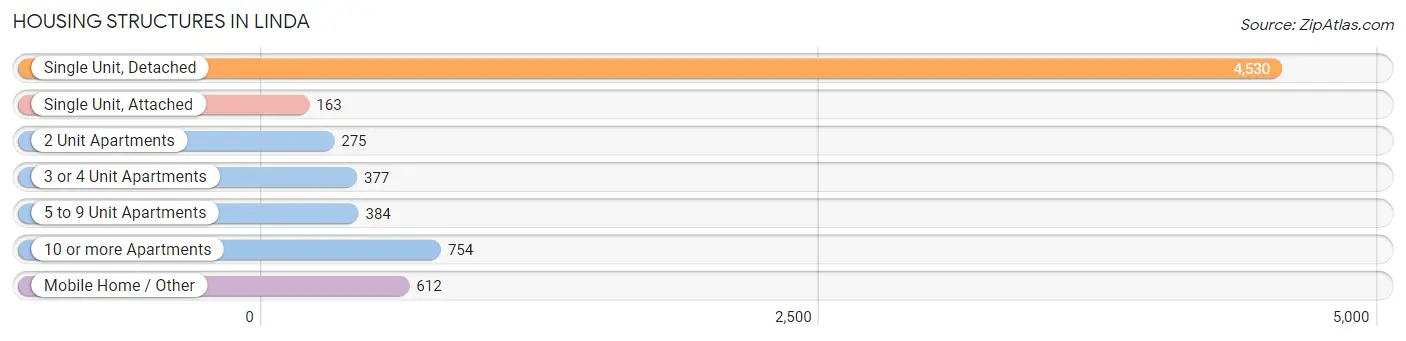
| Structure Type | # Housing Units | % Housing Units |
| Single Unit, Detached | 4,530 | 63.8% |
| Single Unit, Attached | 163 | 2.3% |
| 2 Unit Apartments | 275 | 3.9% |
| 3 or 4 Unit Apartments | 377 | 5.3% |
| 5 to 9 Unit Apartments | 384 | 5.4% |
| 10 or more Apartments | 754 | 10.6% |
| Mobile Home / Other | 612 | 8.6% |
| Total | 7,095 | 100.0% |
Housing Structures by Occupancy in Linda
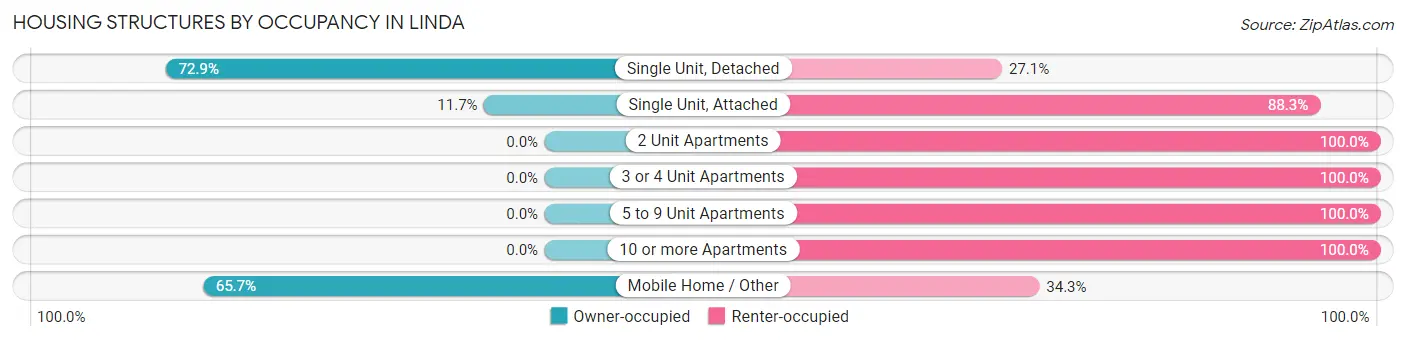
| Structure Type | Owner-occupied | Renter-occupied |
| Single Unit, Detached | 3,301 (72.9%) | 1,229 (27.1%) |
| Single Unit, Attached | 19 (11.7%) | 144 (88.3%) |
| 2 Unit Apartments | 0 (0.0%) | 275 (100.0%) |
| 3 or 4 Unit Apartments | 0 (0.0%) | 377 (100.0%) |
| 5 to 9 Unit Apartments | 0 (0.0%) | 384 (100.0%) |
| 10 or more Apartments | 0 (0.0%) | 754 (100.0%) |
| Mobile Home / Other | 402 (65.7%) | 210 (34.3%) |
| Total | 3,722 (52.5%) | 3,373 (47.5%) |
Housing Structures by Number of Rooms in Linda
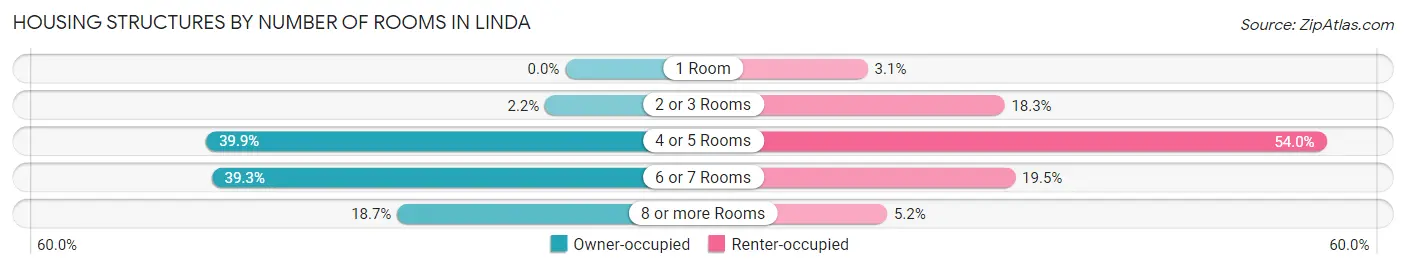
| Number of Rooms | Owner-occupied | Renter-occupied |
| 1 Room | 0 (0.0%) | 104 (3.1%) |
| 2 or 3 Rooms | 83 (2.2%) | 616 (18.3%) |
| 4 or 5 Rooms | 1,484 (39.9%) | 1,821 (54.0%) |
| 6 or 7 Rooms | 1,461 (39.3%) | 656 (19.5%) |
| 8 or more Rooms | 694 (18.6%) | 176 (5.2%) |
| Total | 3,722 (100.0%) | 3,373 (100.0%) |
Housing Structure by Heating Type in Linda
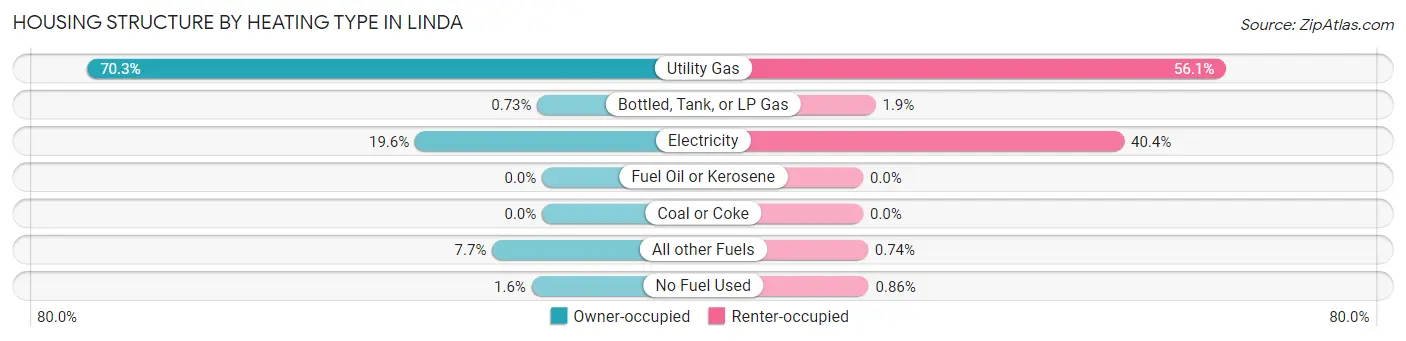
| Heating Type | Owner-occupied | Renter-occupied |
| Utility Gas | 2,617 (70.3%) | 1,893 (56.1%) |
| Bottled, Tank, or LP Gas | 27 (0.7%) | 65 (1.9%) |
| Electricity | 731 (19.6%) | 1,361 (40.4%) |
| Fuel Oil or Kerosene | 0 (0.0%) | 0 (0.0%) |
| Coal or Coke | 0 (0.0%) | 0 (0.0%) |
| All other Fuels | 287 (7.7%) | 25 (0.7%) |
| No Fuel Used | 60 (1.6%) | 29 (0.9%) |
| Total | 3,722 (100.0%) | 3,373 (100.0%) |
Household Vehicle Usage in Linda
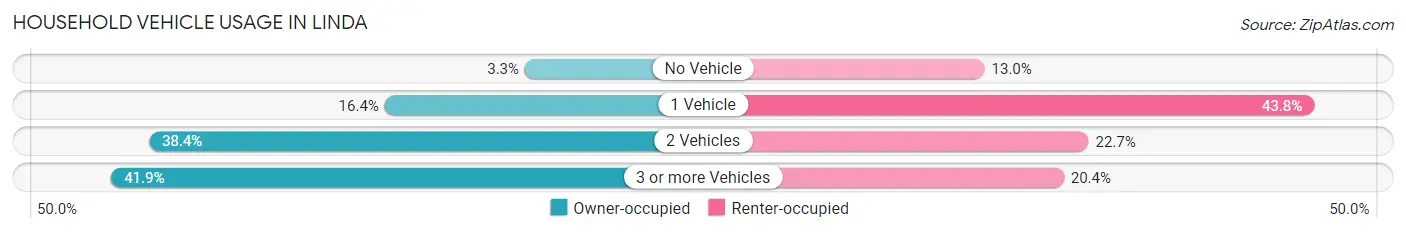
| Vehicles per Household | Owner-occupied | Renter-occupied |
| No Vehicle | 123 (3.3%) | 440 (13.0%) |
| 1 Vehicle | 610 (16.4%) | 1,477 (43.8%) |
| 2 Vehicles | 1,429 (38.4%) | 767 (22.7%) |
| 3 or more Vehicles | 1,560 (41.9%) | 689 (20.4%) |
| Total | 3,722 (100.0%) | 3,373 (100.0%) |
Real Estate & Mortgages in Linda
Real Estate and Mortgage Overview in Linda
| Characteristic | Without Mortgage | With Mortgage |
| Housing Units | 1,164 | 2,558 |
| Median Property Value | $226,000 | $342,000 |
| Median Household Income | $67,967 | $373 |
| Monthly Housing Costs | $514 | $114 |
| Real Estate Taxes | $1,300 | $48 |
Property Value by Mortgage Status in Linda
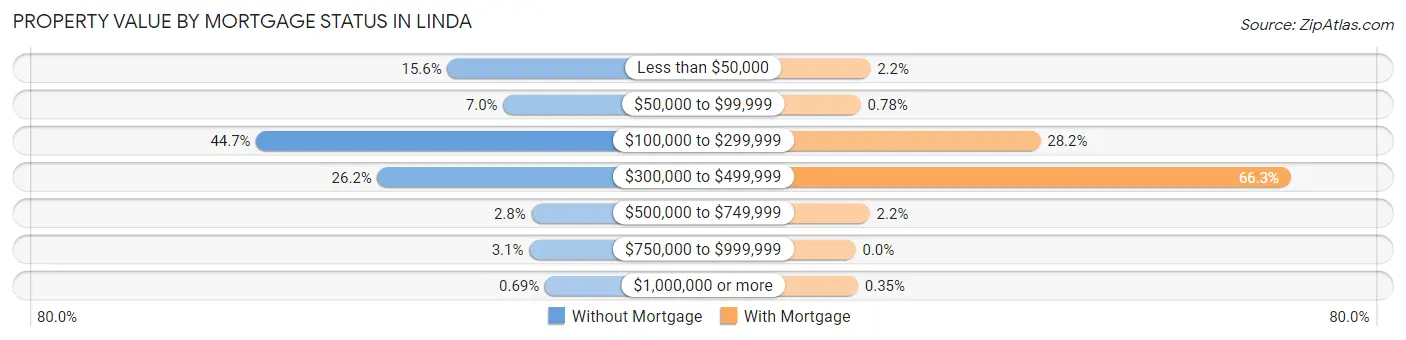
| Property Value | Without Mortgage | With Mortgage |
| Less than $50,000 | 181 (15.5%) | 57 (2.2%) |
| $50,000 to $99,999 | 82 (7.0%) | 20 (0.8%) |
| $100,000 to $299,999 | 520 (44.7%) | 720 (28.1%) |
| $300,000 to $499,999 | 305 (26.2%) | 1,697 (66.3%) |
| $500,000 to $749,999 | 32 (2.8%) | 55 (2.1%) |
| $750,000 to $999,999 | 36 (3.1%) | 0 (0.0%) |
| $1,000,000 or more | 8 (0.7%) | 9 (0.4%) |
| Total | 1,164 (100.0%) | 2,558 (100.0%) |
Household Income by Mortgage Status in Linda
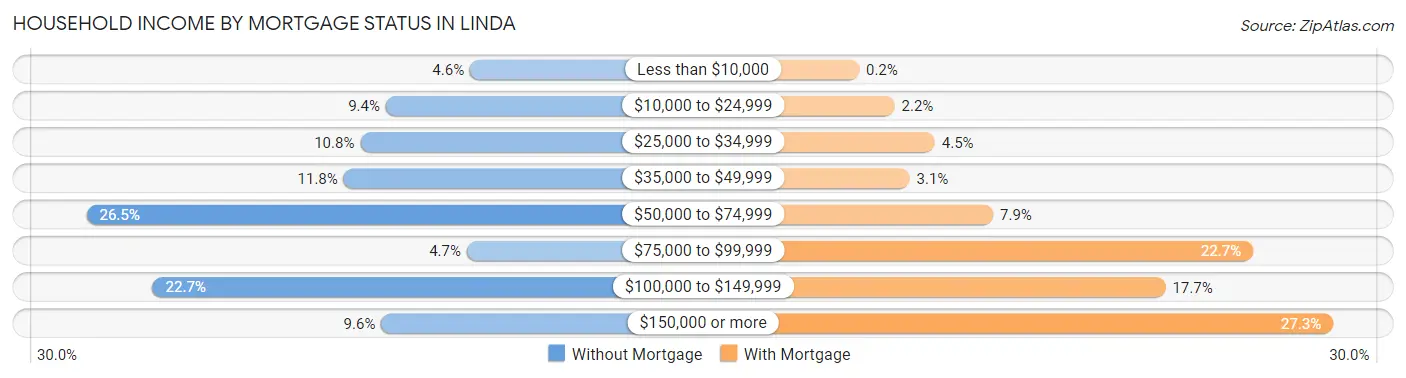
| Household Income | Without Mortgage | With Mortgage |
| Less than $10,000 | 53 (4.5%) | 5 (0.2%) |
| $10,000 to $24,999 | 109 (9.4%) | 57 (2.2%) |
| $25,000 to $34,999 | 126 (10.8%) | 116 (4.5%) |
| $35,000 to $49,999 | 137 (11.8%) | 79 (3.1%) |
| $50,000 to $74,999 | 308 (26.5%) | 201 (7.9%) |
| $75,000 to $99,999 | 55 (4.7%) | 581 (22.7%) |
| $100,000 to $149,999 | 264 (22.7%) | 453 (17.7%) |
| $150,000 or more | 112 (9.6%) | 698 (27.3%) |
| Total | 1,164 (100.0%) | 2,558 (100.0%) |
Property Value to Household Income Ratio in Linda
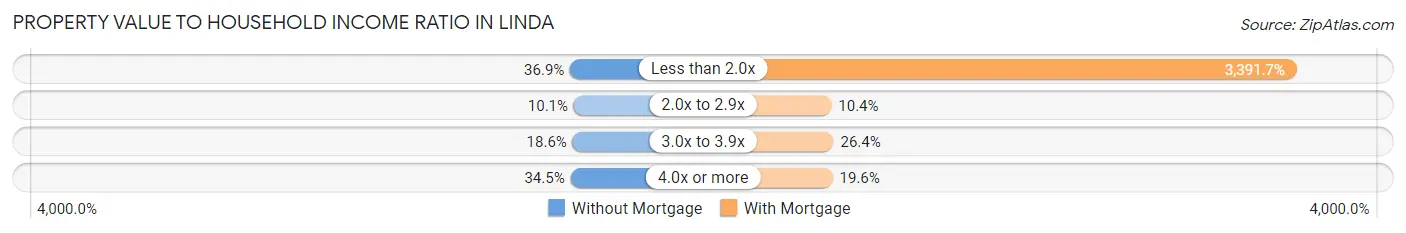
| Value-to-Income Ratio | Without Mortgage | With Mortgage |
| Less than 2.0x | 429 (36.9%) | 86,759 (3,391.7%) |
| 2.0x to 2.9x | 117 (10.1%) | 267 (10.4%) |
| 3.0x to 3.9x | 217 (18.6%) | 674 (26.4%) |
| 4.0x or more | 401 (34.4%) | 501 (19.6%) |
| Total | 1,164 (100.0%) | 2,558 (100.0%) |
Real Estate Taxes by Mortgage Status in Linda
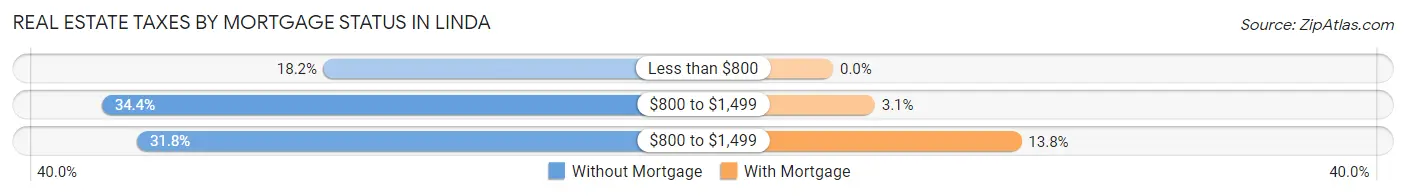
| Property Taxes | Without Mortgage | With Mortgage |
| Less than $800 | 212 (18.2%) | 0 (0.0%) |
| $800 to $1,499 | 400 (34.4%) | 78 (3.0%) |
| $800 to $1,499 | 370 (31.8%) | 352 (13.8%) |
| Total | 1,164 (100.0%) | 2,558 (100.0%) |
Health & Disability in Linda
Health Insurance Coverage by Age in Linda
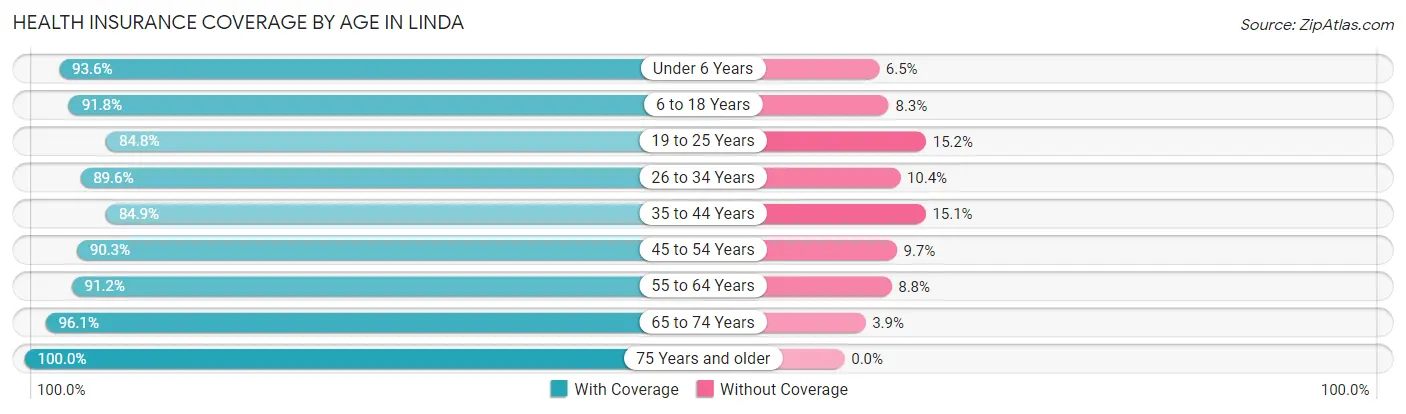
| Age Bracket | With Coverage | Without Coverage |
| Under 6 Years | 2,293 (93.5%) | 158 (6.5%) |
| 6 to 18 Years | 4,760 (91.7%) | 428 (8.3%) |
| 19 to 25 Years | 1,924 (84.8%) | 345 (15.2%) |
| 26 to 34 Years | 2,995 (89.6%) | 347 (10.4%) |
| 35 to 44 Years | 2,541 (84.9%) | 453 (15.1%) |
| 45 to 54 Years | 2,260 (90.3%) | 244 (9.7%) |
| 55 to 64 Years | 1,927 (91.2%) | 185 (8.8%) |
| 65 to 74 Years | 1,357 (96.1%) | 55 (3.9%) |
| 75 Years and older | 624 (100.0%) | 0 (0.0%) |
| Total | 20,681 (90.3%) | 2,215 (9.7%) |
Health Insurance Coverage by Citizenship Status in Linda
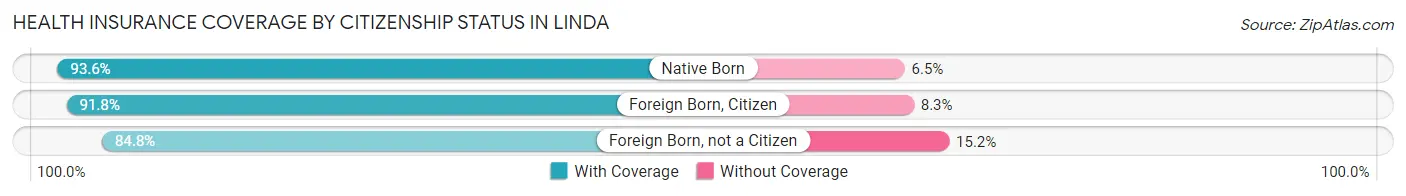
| Citizenship Status | With Coverage | Without Coverage |
| Native Born | 2,293 (93.5%) | 158 (6.5%) |
| Foreign Born, Citizen | 4,760 (91.7%) | 428 (8.3%) |
| Foreign Born, not a Citizen | 1,924 (84.8%) | 345 (15.2%) |
Health Insurance Coverage by Household Income in Linda
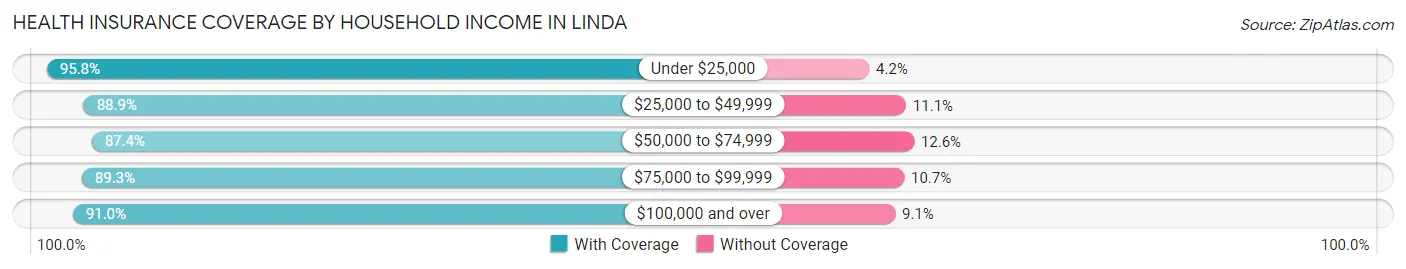
| Household Income | With Coverage | Without Coverage |
| Under $25,000 | 3,321 (95.8%) | 145 (4.2%) |
| $25,000 to $49,999 | 4,028 (88.9%) | 502 (11.1%) |
| $50,000 to $74,999 | 4,550 (87.4%) | 655 (12.6%) |
| $75,000 to $99,999 | 2,079 (89.3%) | 250 (10.7%) |
| $100,000 and over | 6,636 (90.9%) | 660 (9.0%) |
Public vs Private Health Insurance Coverage by Age in Linda
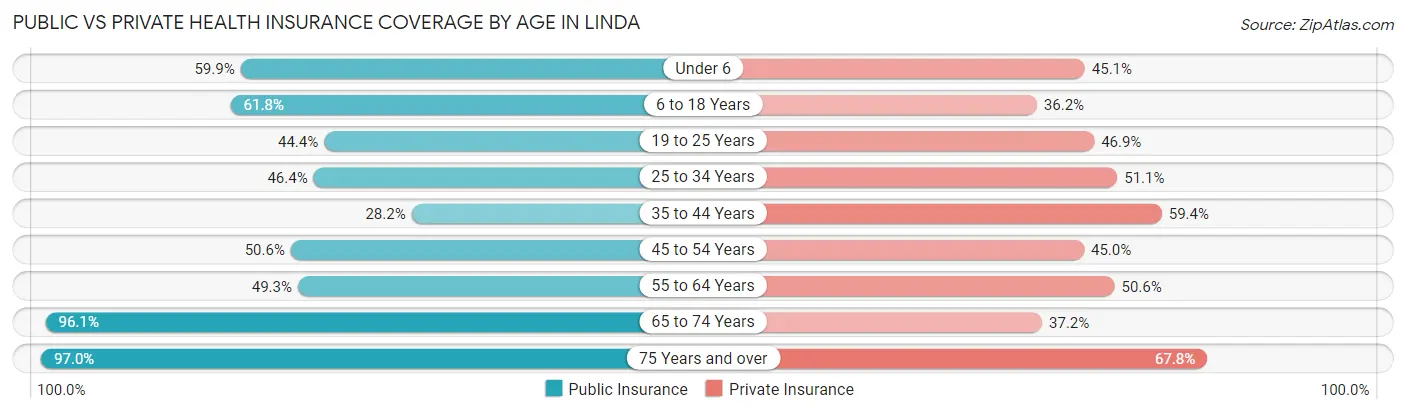
| Age Bracket | Public Insurance | Private Insurance |
| Under 6 | 1,469 (59.9%) | 1,106 (45.1%) |
| 6 to 18 Years | 3,204 (61.8%) | 1,879 (36.2%) |
| 19 to 25 Years | 1,008 (44.4%) | 1,063 (46.9%) |
| 25 to 34 Years | 1,550 (46.4%) | 1,709 (51.1%) |
| 35 to 44 Years | 844 (28.2%) | 1,778 (59.4%) |
| 45 to 54 Years | 1,267 (50.6%) | 1,126 (45.0%) |
| 55 to 64 Years | 1,041 (49.3%) | 1,069 (50.6%) |
| 65 to 74 Years | 1,357 (96.1%) | 525 (37.2%) |
| 75 Years and over | 605 (97.0%) | 423 (67.8%) |
| Total | 12,345 (53.9%) | 10,678 (46.6%) |
Disability Status by Sex by Age in Linda
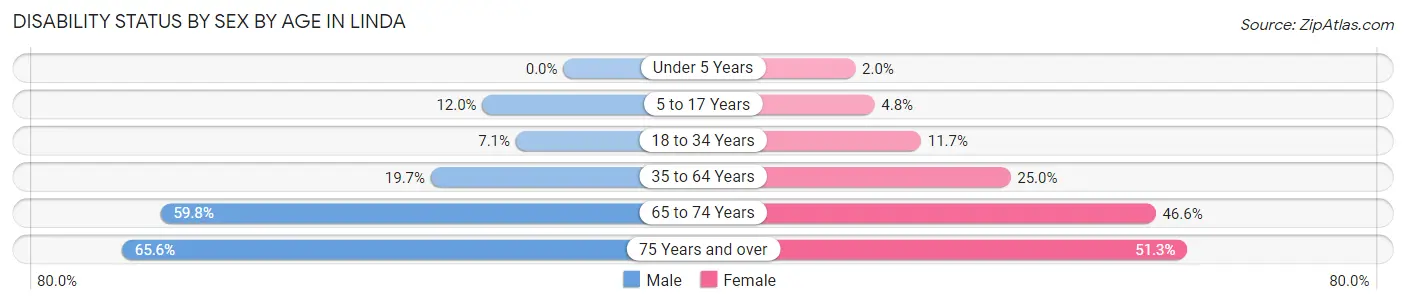
| Age Bracket | Male | Female |
| Under 5 Years | 0 (0.0%) | 20 (2.0%) |
| 5 to 17 Years | 305 (12.0%) | 122 (4.8%) |
| 18 to 34 Years | 227 (7.0%) | 331 (11.7%) |
| 35 to 64 Years | 742 (19.7%) | 960 (25.0%) |
| 65 to 74 Years | 399 (59.8%) | 347 (46.6%) |
| 75 Years and over | 234 (65.5%) | 137 (51.3%) |
Disability Class by Sex by Age in Linda
Disability Class: Hearing Difficulty
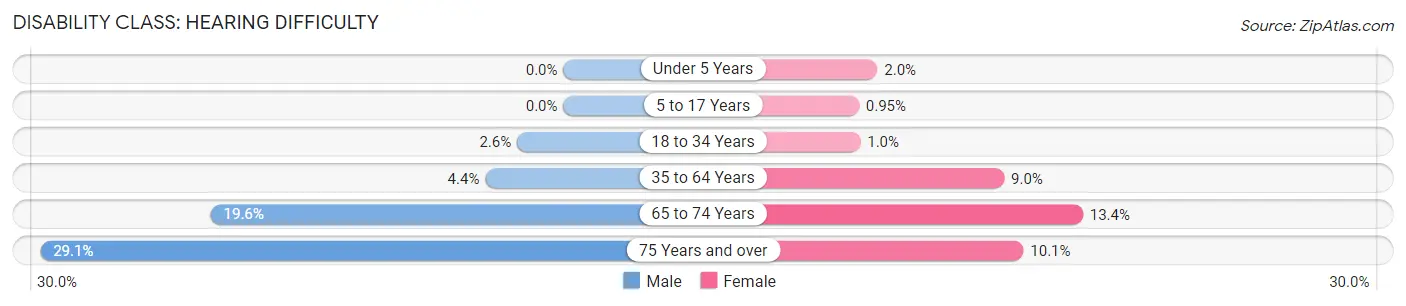
| Age Bracket | Male | Female |
| Under 5 Years | 0 (0.0%) | 20 (2.0%) |
| 5 to 17 Years | 0 (0.0%) | 24 (0.9%) |
| 18 to 34 Years | 83 (2.6%) | 29 (1.0%) |
| 35 to 64 Years | 164 (4.3%) | 347 (9.0%) |
| 65 to 74 Years | 131 (19.6%) | 100 (13.4%) |
| 75 Years and over | 104 (29.1%) | 27 (10.1%) |
Disability Class: Vision Difficulty
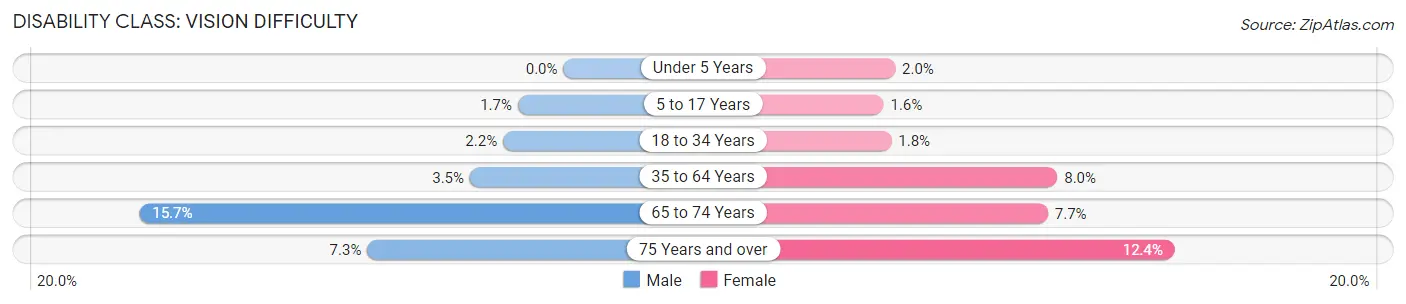
| Age Bracket | Male | Female |
| Under 5 Years | 0 (0.0%) | 20 (2.0%) |
| 5 to 17 Years | 43 (1.7%) | 39 (1.5%) |
| 18 to 34 Years | 72 (2.2%) | 52 (1.8%) |
| 35 to 64 Years | 131 (3.5%) | 307 (8.0%) |
| 65 to 74 Years | 105 (15.7%) | 57 (7.6%) |
| 75 Years and over | 26 (7.3%) | 33 (12.4%) |
Disability Class: Cognitive Difficulty
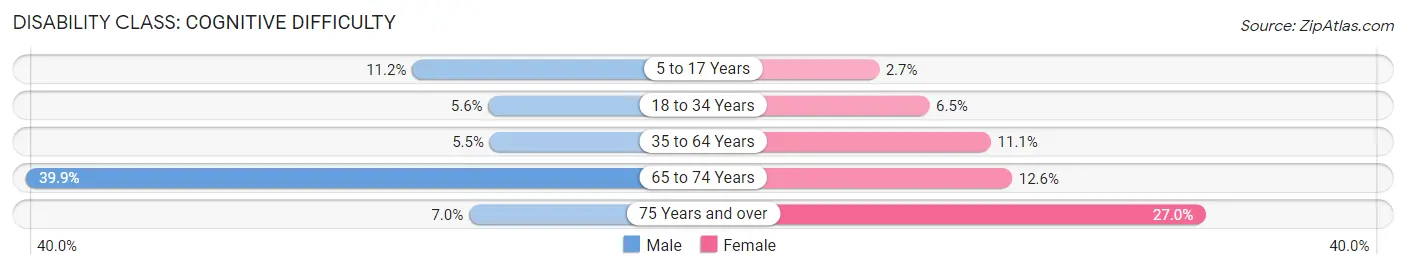
| Age Bracket | Male | Female |
| 5 to 17 Years | 285 (11.2%) | 69 (2.7%) |
| 18 to 34 Years | 179 (5.6%) | 183 (6.5%) |
| 35 to 64 Years | 206 (5.5%) | 424 (11.1%) |
| 65 to 74 Years | 266 (39.9%) | 94 (12.6%) |
| 75 Years and over | 25 (7.0%) | 72 (27.0%) |
Disability Class: Ambulatory Difficulty
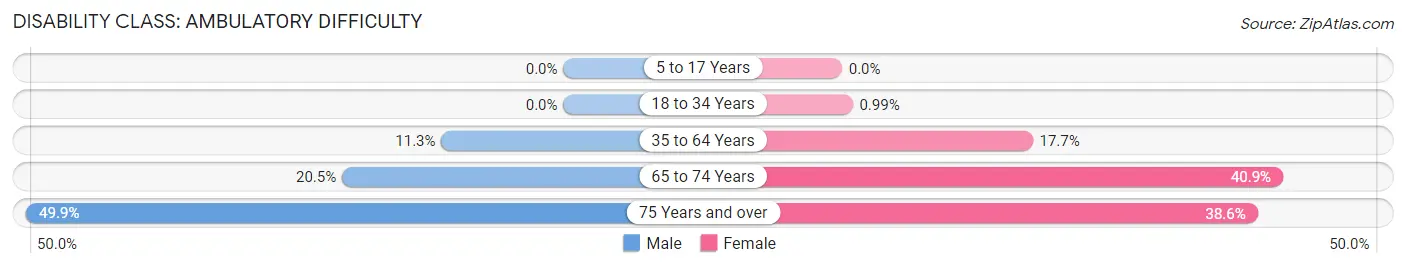
| Age Bracket | Male | Female |
| 5 to 17 Years | 0 (0.0%) | 0 (0.0%) |
| 18 to 34 Years | 0 (0.0%) | 28 (1.0%) |
| 35 to 64 Years | 427 (11.3%) | 679 (17.7%) |
| 65 to 74 Years | 137 (20.5%) | 305 (40.9%) |
| 75 Years and over | 178 (49.9%) | 103 (38.6%) |
Disability Class: Self-Care Difficulty
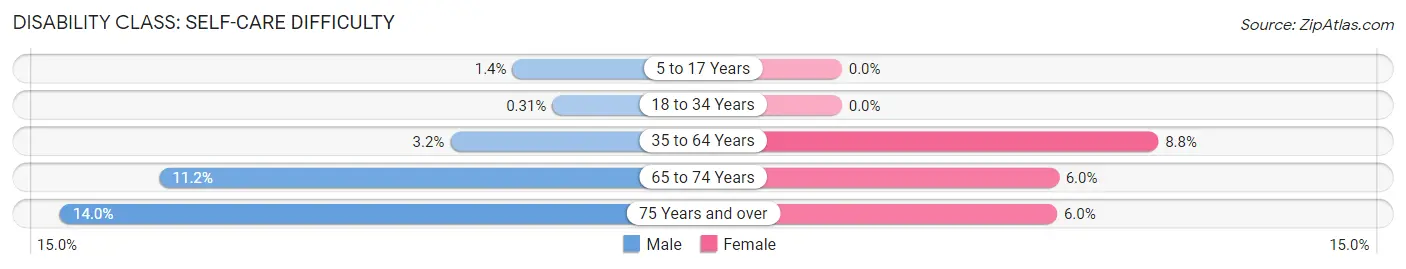
| Age Bracket | Male | Female |
| 5 to 17 Years | 36 (1.4%) | 0 (0.0%) |
| 18 to 34 Years | 10 (0.3%) | 0 (0.0%) |
| 35 to 64 Years | 119 (3.2%) | 338 (8.8%) |
| 65 to 74 Years | 75 (11.2%) | 45 (6.0%) |
| 75 Years and over | 50 (14.0%) | 16 (6.0%) |
Technology Access in Linda
Computing Device Access in Linda
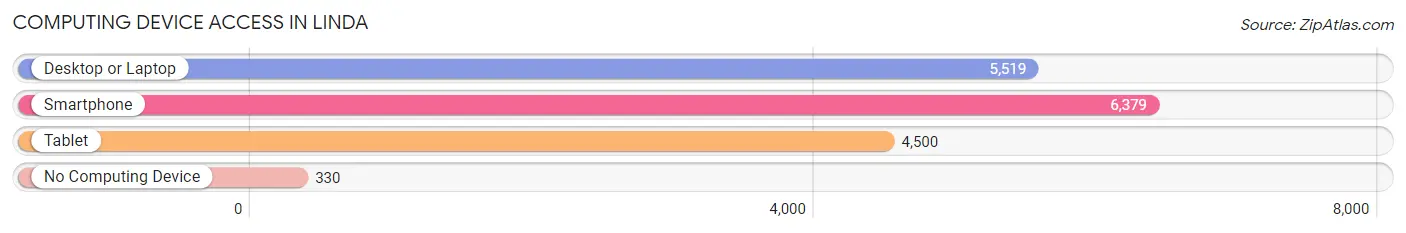
| Device Type | # Households | % Households |
| Desktop or Laptop | 5,519 | 77.8% |
| Smartphone | 6,379 | 89.9% |
| Tablet | 4,500 | 63.4% |
| No Computing Device | 330 | 4.6% |
| Total | 7,095 | 100.0% |
Internet Access in Linda
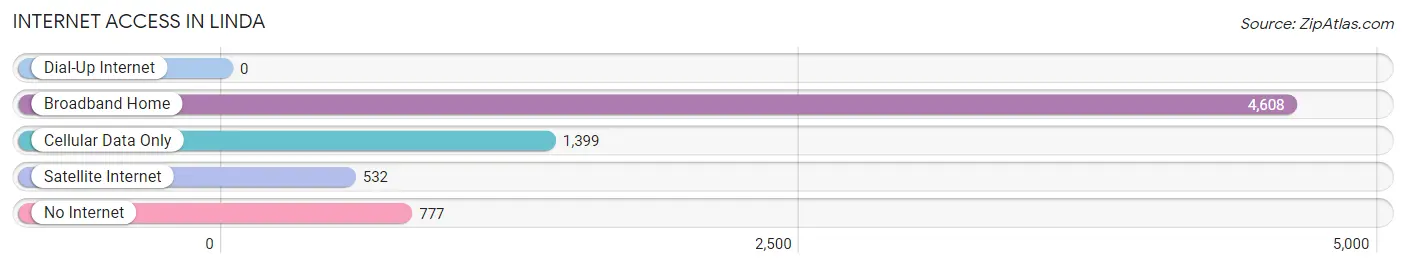
| Internet Type | # Households | % Households |
| Dial-Up Internet | 0 | 0.0% |
| Broadband Home | 4,608 | 64.9% |
| Cellular Data Only | 1,399 | 19.7% |
| Satellite Internet | 532 | 7.5% |
| No Internet | 777 | 11.0% |
| Total | 7,095 | 100.0% |
Linda Summary
California is a state located on the West Coast of the United States. It is the most populous state in the country, with a population of over 39 million people as of 2019. California is bordered by Oregon to the north, Nevada and Arizona to the east, and the Pacific Ocean to the west. It is the third-largest state in the country by area, covering an area of 163,696 square miles.
History
California has a long and varied history, beginning with its first inhabitants, the Native American tribes of the area. These tribes included the Chumash, the Miwok, the Pomo, and the Yurok. The first Europeans to explore the area were Spanish explorers, who arrived in the late 18th century. The Spanish established a number of missions in the area, and eventually claimed the region as part of the Spanish Empire.
In 1821, Mexico gained independence from Spain, and California became part of the newly formed Mexican Republic. The Mexican government granted large tracts of land to settlers, and the area began to develop. In 1846, the United States declared war on Mexico, and by 1848, the Mexican-American War had ended with the signing of the Treaty of Guadalupe Hidalgo. California was ceded to the United States, and in 1850, it became the 31st state in the Union.
Geography
California is located on the West Coast of the United States, and is bordered by Oregon to the north, Nevada and Arizona to the east, and the Pacific Ocean to the west. It is the third-largest state in the country by area, covering an area of 163,696 square miles.
The geography of California is varied, with a number of mountain ranges, deserts, and forests. The Sierra Nevada mountain range runs through the state, and is home to the highest peak in the contiguous United States, Mount Whitney. The Central Valley is a large agricultural region, and the Mojave Desert covers much of the southeastern part of the state.
Economy
California has a large and diverse economy, with a gross state product of over $3 trillion in 2019. It is the largest economy in the United States, and the fifth-largest in the world. The state is home to a number of major industries, including technology, entertainment, tourism, agriculture, and manufacturing.
The state is home to a number of major companies, including Apple, Google, Facebook, Disney, and Intel. California is also a major producer of agricultural products, including grapes, almonds, and strawberries. Tourism is also a major industry in the state, with over 250 million visitors in 2019.
Demographics
As of 2019, California had a population of over 39 million people. The state is one of the most diverse in the country, with a population that is 44.5% White, 38.9% Hispanic or Latino, 13.4% Asian, 5.8% Black or African American, and 0.7% Native American.
California is also home to a large immigrant population, with over 10 million foreign-born residents. The largest immigrant groups are from Mexico, China, the Philippines, India, and Vietnam. The state is also home to a large number of Spanish speakers, with over 10 million people speaking Spanish at home.
Common Questions
What is Per Capita Income in Linda?
Per Capita income in Linda is $22,333.
What is the Median Family Income in Linda?
Median Family Income in Linda is $58,750.
What is the Median Household income in Linda?
Median Household Income in Linda is $57,427.
What is Income or Wage Gap in Linda?
Income or Wage Gap in Linda is 31.7%.
Women in Linda earn 68.3 cents for every dollar earned by a man.
What is Family Income Deficit in Linda?
Family Income Deficit in Linda is $11,637.
Families that are below poverty line in Linda earn $11,637 less on average than the poverty threshold level.
What is Inequality or Gini Index in Linda?
Inequality or Gini Index in Linda is 0.40.
What is the Total Population of Linda?
Total Population of Linda is 23,262.
What is the Total Male Population of Linda?
Total Male Population of Linda is 12,013.
What is the Total Female Population of Linda?
Total Female Population of Linda is 11,249.
What is the Ratio of Males per 100 Females in Linda?
There are 106.79 Males per 100 Females in Linda.
What is the Ratio of Females per 100 Males in Linda?
There are 93.64 Females per 100 Males in Linda.
What is the Median Population Age in Linda?
Median Population Age in Linda is 29.9 Years.
What is the Average Family Size in Linda
Average Family Size in Linda is 3.8 People.
What is the Average Household Size in Linda
Average Household Size in Linda is 3.3 People.
How Large is the Labor Force in Linda?
There are 9,391 People in the Labor Forcein in Linda.
What is the Percentage of People in the Labor Force in Linda?
56.1% of People are in the Labor Force in Linda.
What is the Unemployment Rate in Linda?
Unemployment Rate in Linda is 10.3%.