Menifee, CA Map & Demographics
Menifee Map
Menifee Overview
$35,682
PER CAPITA INCOME
$101,283
AVG FAMILY INCOME
$87,871
AVG HOUSEHOLD INCOME
34.6%
WAGE / INCOME GAP [ % ]
65.4¢/ $1
WAGE / INCOME GAP [ $ ]
$11,234
FAMILY INCOME DEFICIT
0.41
INEQUALITY / GINI INDEX
103,680
TOTAL POPULATION
51,361
MALE POPULATION
52,319
FEMALE POPULATION
98.17
MALES / 100 FEMALES
101.87
FEMALES / 100 MALES
37.3
MEDIAN AGE
3.6
AVG FAMILY SIZE
3.1
AVG HOUSEHOLD SIZE
46,071
LABOR FORCE [ PEOPLE ]
57.6%
PERCENT IN LABOR FORCE
7.1%
UNEMPLOYMENT RATE
Menifee Area Codes
Income in Menifee
Income Overview in Menifee
Per Capita Income in Menifee is $35,682, while median incomes of families and households are $101,283 and $87,871 respectively.
| Characteristic | Number | Measure |
| Per Capita Income | 103,680 | $35,682 |
| Median Family Income | 25,092 | $101,283 |
| Mean Family Income | 25,092 | $118,714 |
| Median Household Income | 33,008 | $87,871 |
| Mean Household Income | 33,008 | $108,360 |
| Income Deficit | 25,092 | $11,234 |
| Wage / Income Gap (%) | 103,680 | 34.57% |
| Wage / Income Gap ($) | 103,680 | 65.43¢ per $1 |
| Gini / Inequality Index | 103,680 | 0.41 |
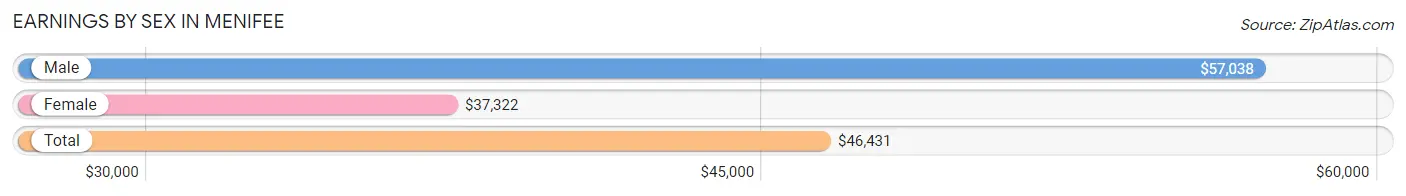
Earnings by Sex in Menifee
Average Earnings in Menifee are $46,431, $57,038 for men and $37,322 for women, a difference of 34.6%.
| Sex | Number | Average Earnings |
| Male | 25,473 (54.7%) | $57,038 |
| Female | 21,049 (45.3%) | $37,322 |
| Total | 46,522 (100.0%) | $46,431 |
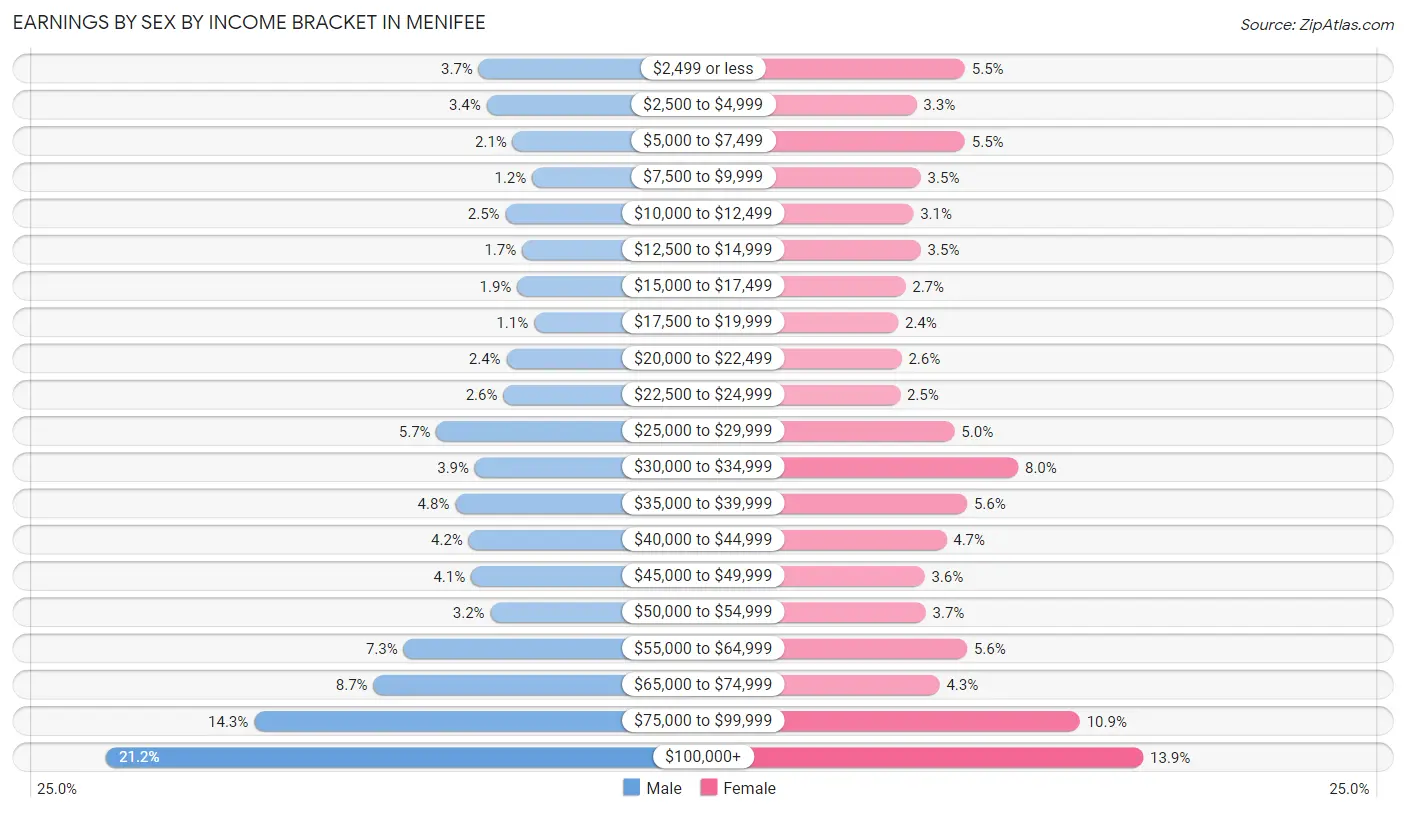
Earnings by Sex by Income Bracket in Menifee
The most common earnings brackets in Menifee are $100,000+ for men (5,394 | 21.2%) and $100,000+ for women (2,921 | 13.9%).
| Income | Male | Female |
| $2,499 or less | 951 (3.7%) | 1,165 (5.5%) |
| $2,500 to $4,999 | 857 (3.4%) | 686 (3.3%) |
| $5,000 to $7,499 | 546 (2.1%) | 1,164 (5.5%) |
| $7,500 to $9,999 | 314 (1.2%) | 729 (3.5%) |
| $10,000 to $12,499 | 631 (2.5%) | 654 (3.1%) |
| $12,500 to $14,999 | 434 (1.7%) | 729 (3.5%) |
| $15,000 to $17,499 | 492 (1.9%) | 577 (2.7%) |
| $17,500 to $19,999 | 291 (1.1%) | 505 (2.4%) |
| $20,000 to $22,499 | 618 (2.4%) | 538 (2.6%) |
| $22,500 to $24,999 | 656 (2.6%) | 524 (2.5%) |
| $25,000 to $29,999 | 1,455 (5.7%) | 1,061 (5.0%) |
| $30,000 to $34,999 | 996 (3.9%) | 1,689 (8.0%) |
| $35,000 to $39,999 | 1,231 (4.8%) | 1,186 (5.6%) |
| $40,000 to $44,999 | 1,071 (4.2%) | 981 (4.7%) |
| $45,000 to $49,999 | 1,042 (4.1%) | 767 (3.6%) |
| $50,000 to $54,999 | 810 (3.2%) | 777 (3.7%) |
| $55,000 to $64,999 | 1,848 (7.2%) | 1,186 (5.6%) |
| $65,000 to $74,999 | 2,207 (8.7%) | 914 (4.3%) |
| $75,000 to $99,999 | 3,629 (14.2%) | 2,296 (10.9%) |
| $100,000+ | 5,394 (21.2%) | 2,921 (13.9%) |
| Total | 25,473 (100.0%) | 21,049 (100.0%) |
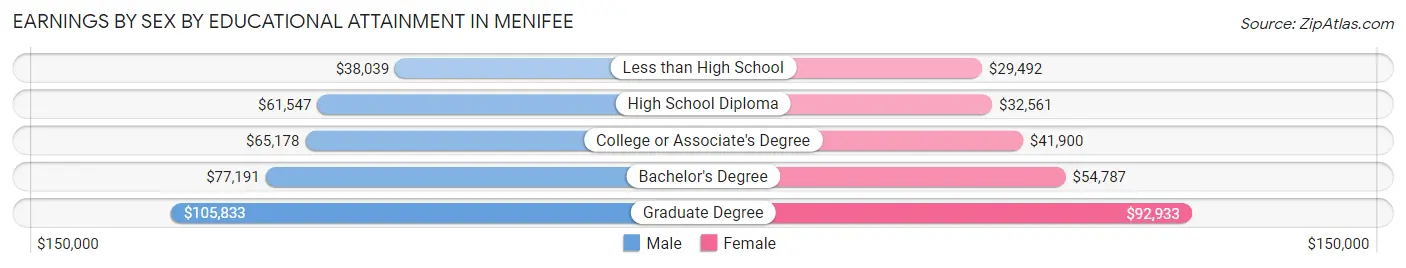
Earnings by Sex by Educational Attainment in Menifee
Average earnings in Menifee are $64,214 for men and $41,238 for women, a difference of 35.8%. Men with an educational attainment of graduate degree enjoy the highest average annual earnings of $105,833, while those with less than high school education earn the least with $38,039. Women with an educational attainment of graduate degree earn the most with the average annual earnings of $92,933, while those with less than high school education have the smallest earnings of $29,492.
| Educational Attainment | Male Income | Female Income |
| Less than High School | $38,039 | $29,492 |
| High School Diploma | $61,547 | $32,561 |
| College or Associate's Degree | $65,178 | $41,900 |
| Bachelor's Degree | $77,191 | $54,787 |
| Graduate Degree | $105,833 | $92,933 |
| Total | $64,214 | $41,238 |
Family Income in Menifee
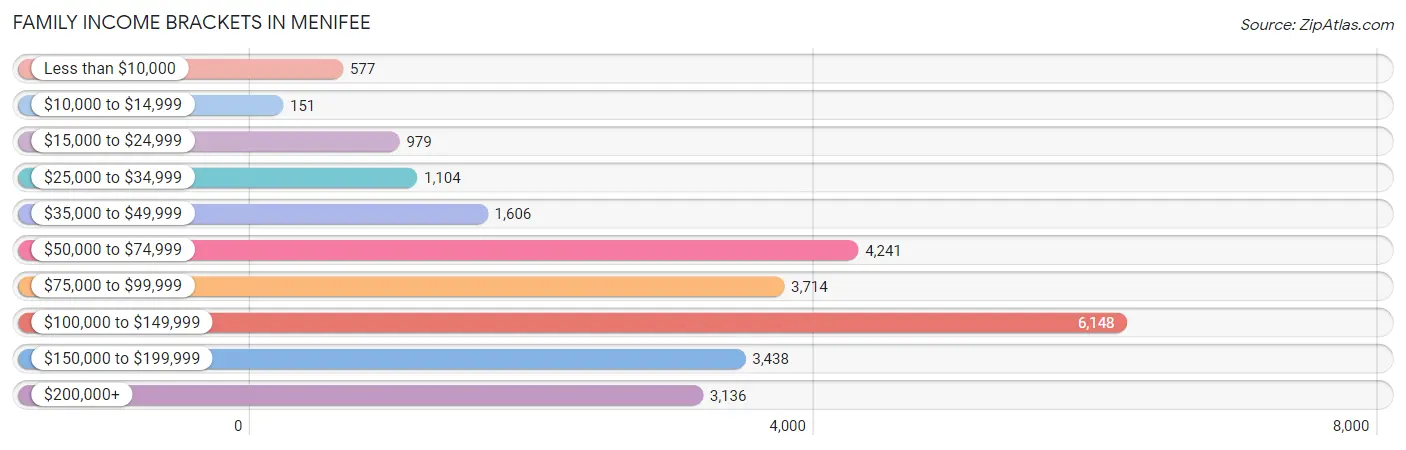
Family Income Brackets in Menifee
According to the Menifee family income data, there are 6,148 families falling into the $100,000 to $149,999 income range, which is the most common income bracket and makes up 24.5% of all families. Conversely, the $10,000 to $14,999 income bracket is the least frequent group with only 151 families (0.6%) belonging to this category.
| Income Bracket | # Families | % Families |
| Less than $10,000 | 577 | 2.3% |
| $10,000 to $14,999 | 151 | 0.6% |
| $15,000 to $24,999 | 979 | 3.9% |
| $25,000 to $34,999 | 1,104 | 4.4% |
| $35,000 to $49,999 | 1,606 | 6.4% |
| $50,000 to $74,999 | 4,241 | 16.9% |
| $75,000 to $99,999 | 3,714 | 14.8% |
| $100,000 to $149,999 | 6,148 | 24.5% |
| $150,000 to $199,999 | 3,438 | 13.7% |
| $200,000+ | 3,136 | 12.5% |
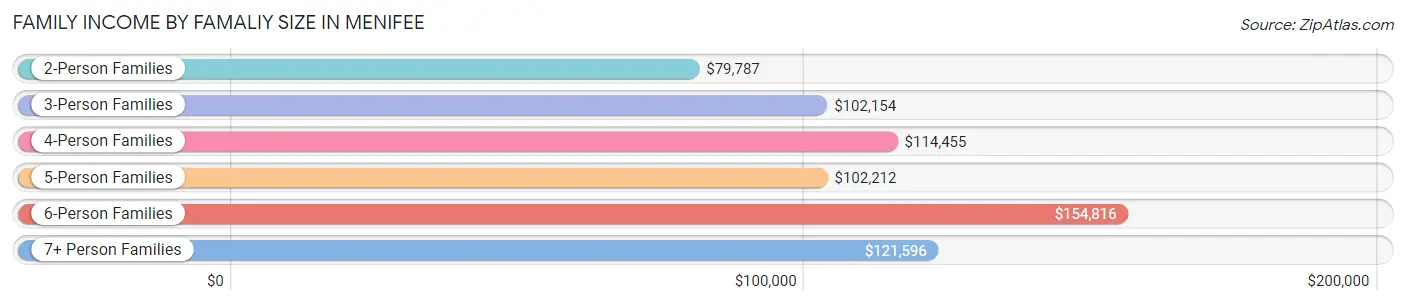
Family Income by Famaliy Size in Menifee
6-person families (1,265 | 5.0%) account for the highest median family income in Menifee with $154,816 per family, while 2-person families (9,432 | 37.6%) have the highest median income of $39,894 per family member.
| Income Bracket | # Families | Median Income |
| 2-Person Families | 9,432 (37.6%) | $79,787 |
| 3-Person Families | 4,719 (18.8%) | $102,154 |
| 4-Person Families | 5,622 (22.4%) | $114,455 |
| 5-Person Families | 3,182 (12.7%) | $102,212 |
| 6-Person Families | 1,265 (5.0%) | $154,816 |
| 7+ Person Families | 872 (3.5%) | $121,596 |
| Total | 25,092 (100.0%) | $101,283 |
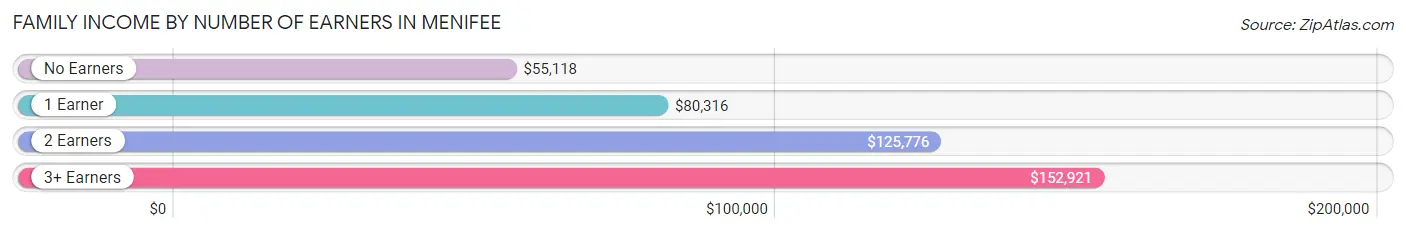
Family Income by Number of Earners in Menifee
The median family income in Menifee is $101,283, with families comprising 3+ earners (3,680) having the highest median family income of $152,921, while families with no earners (4,237) have the lowest median family income of $55,118, accounting for 14.7% and 16.9% of families, respectively.
| Number of Earners | # Families | Median Income |
| No Earners | 4,237 (16.9%) | $55,118 |
| 1 Earner | 8,683 (34.6%) | $80,316 |
| 2 Earners | 8,492 (33.8%) | $125,776 |
| 3+ Earners | 3,680 (14.7%) | $152,921 |
| Total | 25,092 (100.0%) | $101,283 |
Household Income in Menifee
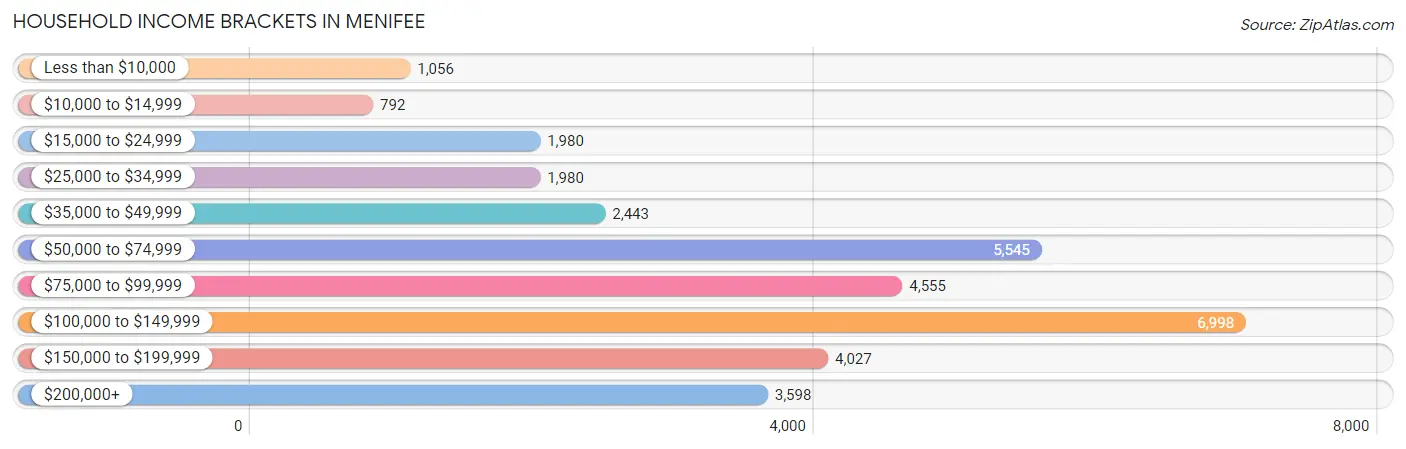
Household Income Brackets in Menifee
With 6,998 households falling in the category, the $100,000 to $149,999 income range is the most frequent in Menifee, accounting for 21.2% of all households. In contrast, only 792 households (2.4%) fall into the $10,000 to $14,999 income bracket, making it the least populous group.
| Income Bracket | # Households | % Households |
| Less than $10,000 | 1,056 | 3.2% |
| $10,000 to $14,999 | 792 | 2.4% |
| $15,000 to $24,999 | 1,980 | 6.0% |
| $25,000 to $34,999 | 1,980 | 6.0% |
| $35,000 to $49,999 | 2,443 | 7.4% |
| $50,000 to $74,999 | 5,545 | 16.8% |
| $75,000 to $99,999 | 4,555 | 13.8% |
| $100,000 to $149,999 | 6,998 | 21.2% |
| $150,000 to $199,999 | 4,027 | 12.2% |
| $200,000+ | 3,598 | 10.9% |
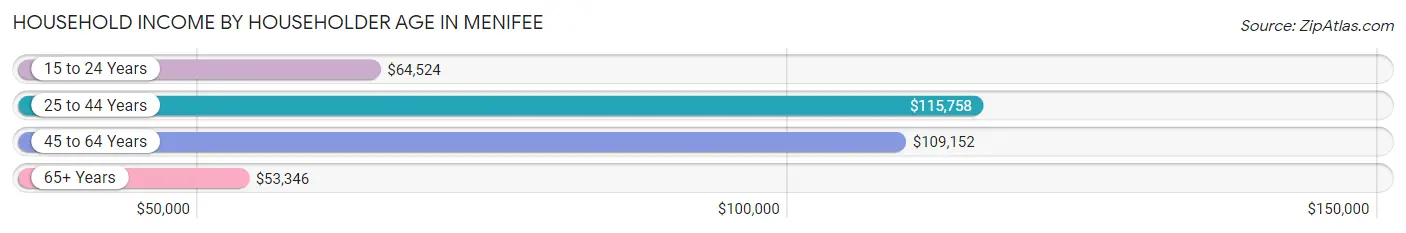
Household Income by Householder Age in Menifee
The median household income in Menifee is $87,871, with the highest median household income of $115,758 found in the 25 to 44 years age bracket for the primary householder. A total of 10,083 households (30.5%) fall into this category. Meanwhile, the 65+ years age bracket for the primary householder has the lowest median household income of $53,346, with 10,677 households (32.4%) in this group.
| Income Bracket | # Households | Median Income |
| 15 to 24 Years | 316 (1.0%) | $64,524 |
| 25 to 44 Years | 10,083 (30.5%) | $115,758 |
| 45 to 64 Years | 11,932 (36.1%) | $109,152 |
| 65+ Years | 10,677 (32.4%) | $53,346 |
| Total | 33,008 (100.0%) | $87,871 |
Poverty in Menifee
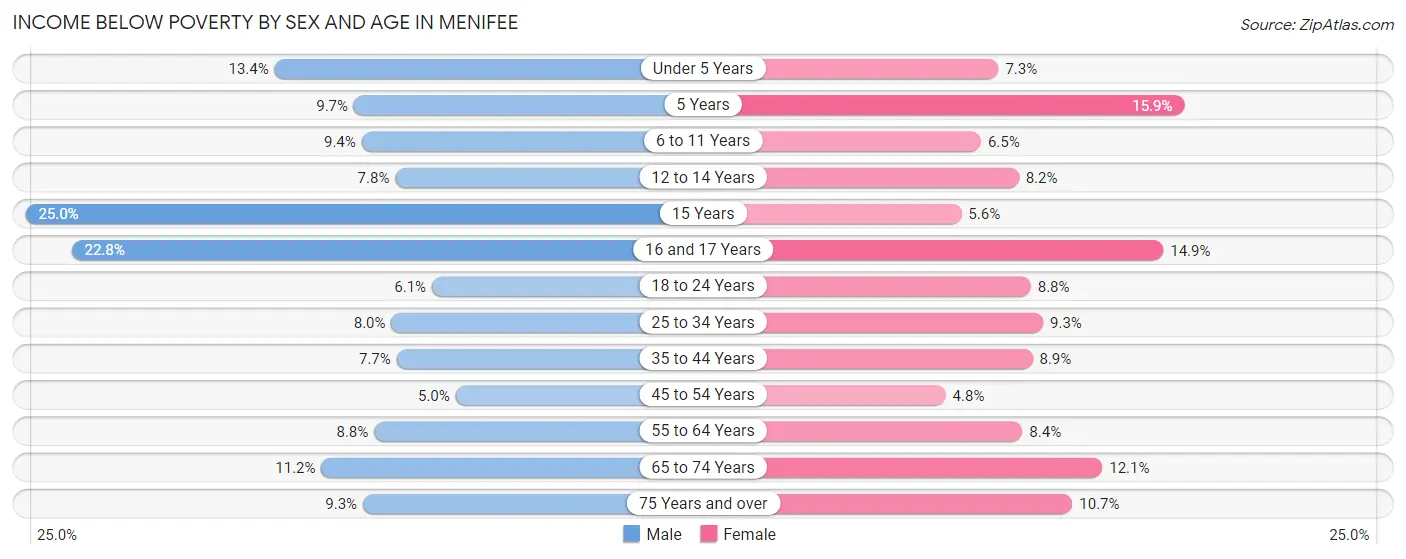
Income Below Poverty by Sex and Age in Menifee
With 9.2% poverty level for males and 8.8% for females among the residents of Menifee, 15 year old males and 5 year old females are the most vulnerable to poverty, with 160 males (25.0%) and 119 females (15.9%) in their respective age groups living below the poverty level.
| Age Bracket | Male | Female |
| Under 5 Years | 504 (13.4%) | 218 (7.3%) |
| 5 Years | 100 (9.7%) | 119 (15.9%) |
| 6 to 11 Years | 411 (9.4%) | 275 (6.5%) |
| 12 to 14 Years | 200 (7.8%) | 179 (8.2%) |
| 15 Years | 160 (25.0%) | 38 (5.6%) |
| 16 and 17 Years | 363 (22.8%) | 208 (14.9%) |
| 18 to 24 Years | 209 (6.1%) | 310 (8.8%) |
| 25 to 34 Years | 654 (8.0%) | 654 (9.3%) |
| 35 to 44 Years | 477 (7.7%) | 626 (8.8%) |
| 45 to 54 Years | 271 (5.0%) | 287 (4.8%) |
| 55 to 64 Years | 505 (8.8%) | 561 (8.4%) |
| 65 to 74 Years | 511 (11.2%) | 586 (12.1%) |
| 75 Years and over | 331 (9.3%) | 508 (10.7%) |
| Total | 4,696 (9.2%) | 4,569 (8.8%) |
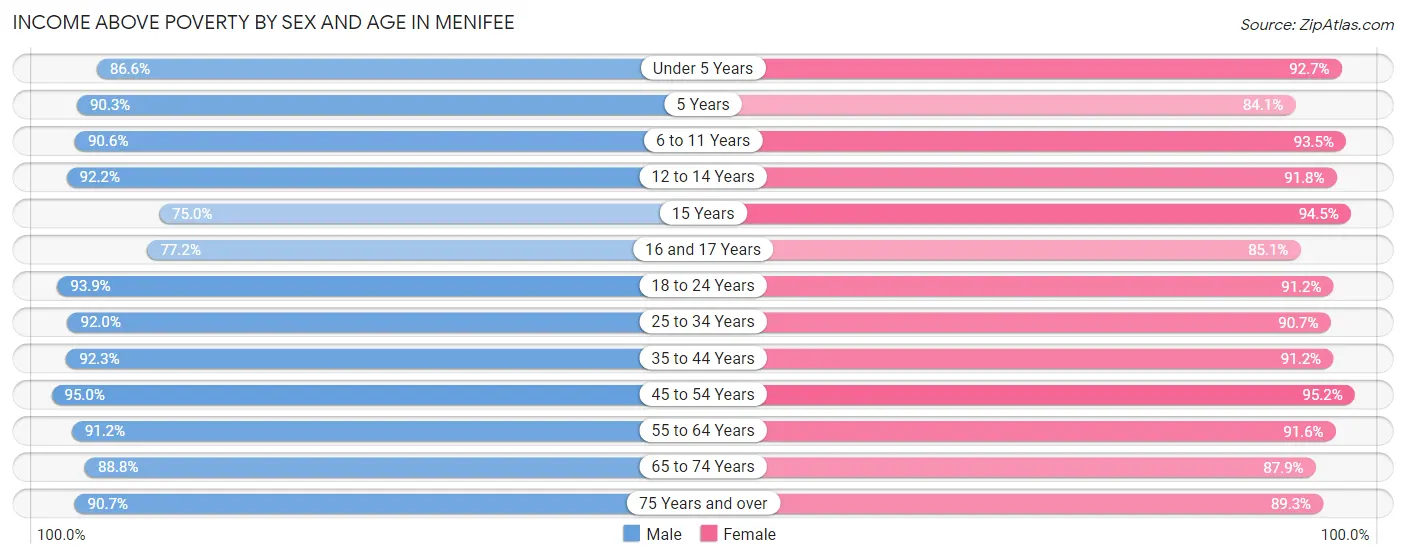
Income Above Poverty by Sex and Age in Menifee
According to the poverty statistics in Menifee, males aged 45 to 54 years and females aged 45 to 54 years are the age groups that are most secure financially, with 95.0% of males and 95.2% of females in these age groups living above the poverty line.
| Age Bracket | Male | Female |
| Under 5 Years | 3,258 (86.6%) | 2,780 (92.7%) |
| 5 Years | 929 (90.3%) | 630 (84.1%) |
| 6 to 11 Years | 3,982 (90.6%) | 3,979 (93.5%) |
| 12 to 14 Years | 2,364 (92.2%) | 2,000 (91.8%) |
| 15 Years | 481 (75.0%) | 647 (94.5%) |
| 16 and 17 Years | 1,228 (77.2%) | 1,186 (85.1%) |
| 18 to 24 Years | 3,219 (93.9%) | 3,224 (91.2%) |
| 25 to 34 Years | 7,537 (92.0%) | 6,350 (90.7%) |
| 35 to 44 Years | 5,683 (92.3%) | 6,451 (91.1%) |
| 45 to 54 Years | 5,154 (95.0%) | 5,671 (95.2%) |
| 55 to 64 Years | 5,249 (91.2%) | 6,136 (91.6%) |
| 65 to 74 Years | 4,041 (88.8%) | 4,261 (87.9%) |
| 75 Years and over | 3,230 (90.7%) | 4,238 (89.3%) |
| Total | 46,355 (90.8%) | 47,553 (91.2%) |
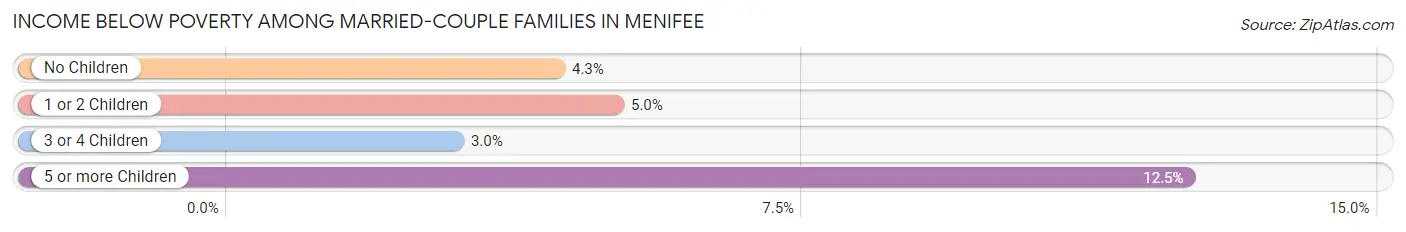
Income Below Poverty Among Married-Couple Families in Menifee
The poverty statistics for married-couple families in Menifee show that 4.5% or 879 of the total 19,702 families live below the poverty line. Families with 5 or more children have the highest poverty rate of 12.5%, comprising of 19 families. On the other hand, families with 3 or 4 children have the lowest poverty rate of 2.9%, which includes 63 families.
| Children | Above Poverty | Below Poverty |
| No Children | 10,028 (95.7%) | 447 (4.3%) |
| 1 or 2 Children | 6,590 (95.0%) | 350 (5.0%) |
| 3 or 4 Children | 2,072 (97.1%) | 63 (2.9%) |
| 5 or more Children | 133 (87.5%) | 19 (12.5%) |
| Total | 18,823 (95.5%) | 879 (4.5%) |
Income Below Poverty Among Single-Parent Households in Menifee
According to the poverty data in Menifee, 15.8% or 262 single-father households and 13.6% or 507 single-mother households are living below the poverty line. Among single-father households, those with 3 or 4 children have the highest poverty rate, with 90 households (24.7%) experiencing poverty. Likewise, among single-mother households, those with 3 or 4 children have the highest poverty rate, with 143 households (42.9%) falling below the poverty line.
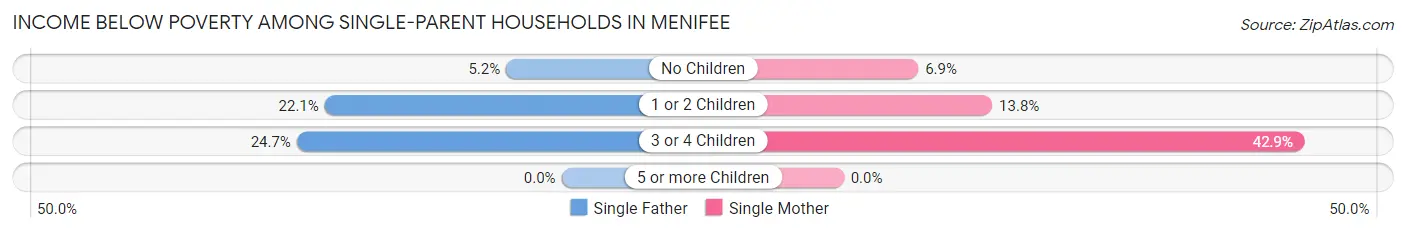
| Children | Single Father | Single Mother |
| No Children | 35 (5.2%) | 105 (6.9%) |
| 1 or 2 Children | 137 (22.1%) | 259 (13.8%) |
| 3 or 4 Children | 90 (24.7%) | 143 (42.9%) |
| 5 or more Children | 0 (0.0%) | 0 (0.0%) |
| Total | 262 (15.8%) | 507 (13.6%) |
Income Below Poverty Among Married-Couple vs Single-Parent Households in Menifee
The poverty data for Menifee shows that 879 of the married-couple family households (4.5%) and 769 of the single-parent households (14.3%) are living below the poverty level. Within the married-couple family households, those with 5 or more children have the highest poverty rate, with 19 households (12.5%) falling below the poverty line. Among the single-parent households, those with 3 or 4 children have the highest poverty rate, with 233 household (33.4%) living below poverty.
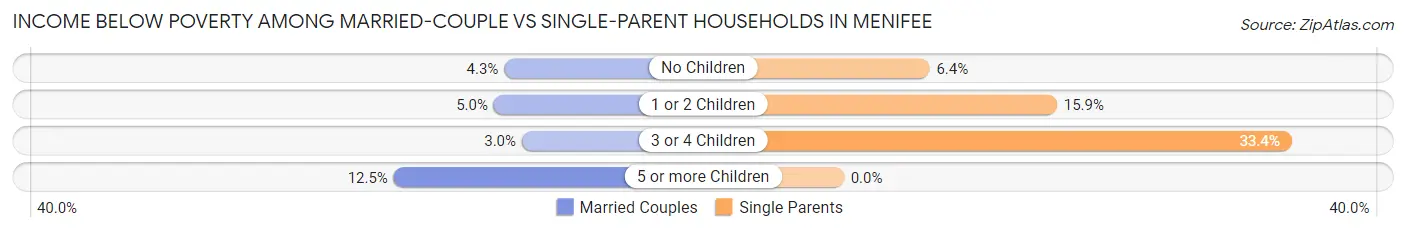
| Children | Married-Couple Families | Single-Parent Households |
| No Children | 447 (4.3%) | 140 (6.4%) |
| 1 or 2 Children | 350 (5.0%) | 396 (15.9%) |
| 3 or 4 Children | 63 (2.9%) | 233 (33.4%) |
| 5 or more Children | 19 (12.5%) | 0 (0.0%) |
| Total | 879 (4.5%) | 769 (14.3%) |
Race in Menifee
The most populous races in Menifee are White / Caucasian (54,250 | 52.3%), Hispanic or Latino (41,777 | 40.3%), and Two or more Races (17,259 | 16.7%).
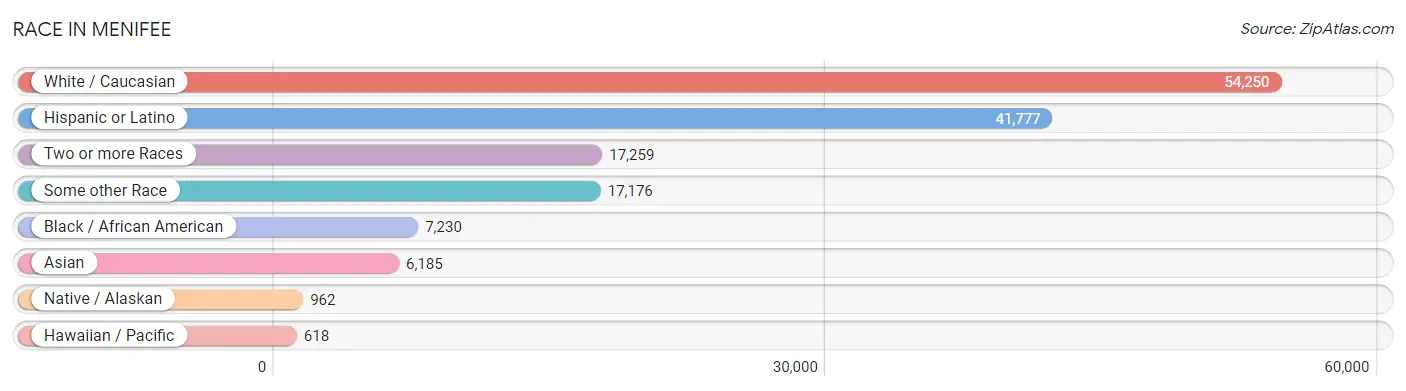
| Race | # Population | % Population |
| Asian | 6,185 | 6.0% |
| Black / African American | 7,230 | 7.0% |
| Hawaiian / Pacific | 618 | 0.6% |
| Hispanic or Latino | 41,777 | 40.3% |
| Native / Alaskan | 962 | 0.9% |
| White / Caucasian | 54,250 | 52.3% |
| Two or more Races | 17,259 | 16.7% |
| Some other Race | 17,176 | 16.6% |
| Total | 103,680 | 100.0% |
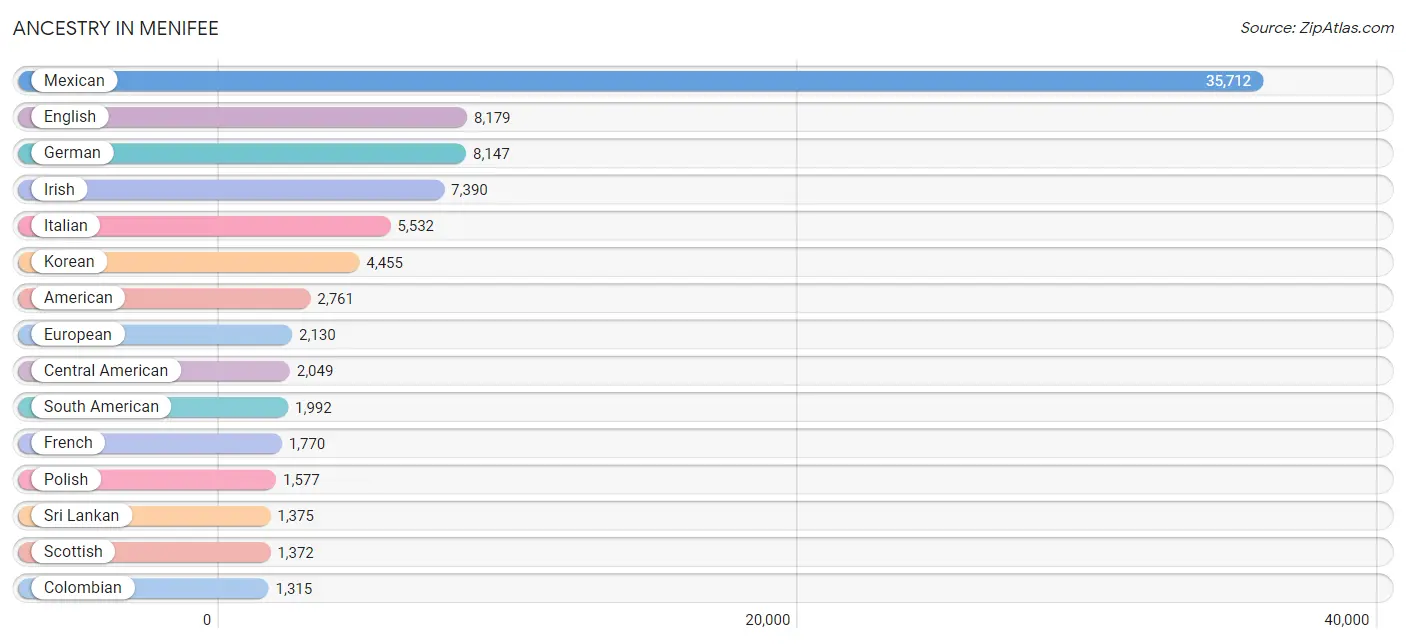
Ancestry in Menifee
The most populous ancestries reported in Menifee are Mexican (35,712 | 34.4%), English (8,179 | 7.9%), German (8,147 | 7.9%), Irish (7,390 | 7.1%), and Italian (5,532 | 5.3%), together accounting for 62.7% of all Menifee residents.
| Ancestry | # Population | % Population |
| African | 273 | 0.3% |
| Alaskan Athabascan | 6 | 0.0% |
| American | 2,761 | 2.7% |
| Apache | 123 | 0.1% |
| Arab | 421 | 0.4% |
| Argentinean | 85 | 0.1% |
| Armenian | 92 | 0.1% |
| Australian | 19 | 0.0% |
| Austrian | 73 | 0.1% |
| Bangladeshi | 42 | 0.0% |
| Barbadian | 36 | 0.0% |
| Basque | 45 | 0.0% |
| Belgian | 82 | 0.1% |
| Bhutanese | 803 | 0.8% |
| Blackfeet | 10 | 0.0% |
| Bolivian | 30 | 0.0% |
| British | 516 | 0.5% |
| British West Indian | 63 | 0.1% |
| Burmese | 392 | 0.4% |
| Cajun | 9 | 0.0% |
| Canadian | 470 | 0.4% |
| Central American | 2,049 | 2.0% |
| Central American Indian | 262 | 0.3% |
| Cherokee | 454 | 0.4% |
| Chilean | 26 | 0.0% |
| Chippewa | 16 | 0.0% |
| Choctaw | 46 | 0.0% |
| Colombian | 1,315 | 1.3% |
| Cree | 49 | 0.1% |
| Croatian | 145 | 0.1% |
| Cuban | 447 | 0.4% |
| Czech | 290 | 0.3% |
| Danish | 372 | 0.4% |
| Dominican | 20 | 0.0% |
| Dutch | 681 | 0.7% |
| Dutch West Indian | 13 | 0.0% |
| Eastern European | 204 | 0.2% |
| Ecuadorian | 84 | 0.1% |
| Egyptian | 36 | 0.0% |
| English | 8,179 | 7.9% |
| European | 2,130 | 2.1% |
| Filipino | 106 | 0.1% |
| Finnish | 45 | 0.0% |
| French | 1,770 | 1.7% |
| French Canadian | 338 | 0.3% |
| German | 8,147 | 7.9% |
| Greek | 198 | 0.2% |
| Guamanian / Chamorro | 26 | 0.0% |
| Guatemalan | 534 | 0.5% |
| Haitian | 269 | 0.3% |
| Honduran | 76 | 0.1% |
| Hopi | 37 | 0.0% |
| Hungarian | 165 | 0.2% |
| Icelander | 22 | 0.0% |
| Indian (Asian) | 865 | 0.8% |
| Indonesian | 16 | 0.0% |
| Iranian | 279 | 0.3% |
| Iraqi | 52 | 0.1% |
| Irish | 7,390 | 7.1% |
| Iroquois | 25 | 0.0% |
| Israeli | 5 | 0.0% |
| Italian | 5,532 | 5.3% |
| Jamaican | 10 | 0.0% |
| Japanese | 477 | 0.5% |
| Jordanian | 107 | 0.1% |
| Korean | 4,455 | 4.3% |
| Laotian | 295 | 0.3% |
| Lebanese | 115 | 0.1% |
| Lithuanian | 137 | 0.1% |
| Malaysian | 114 | 0.1% |
| Mexican | 35,712 | 34.4% |
| Mexican American Indian | 585 | 0.6% |
| Native Hawaiian | 160 | 0.2% |
| Navajo | 306 | 0.3% |
| Nicaraguan | 592 | 0.6% |
| Nigerian | 75 | 0.1% |
| Northern European | 111 | 0.1% |
| Norwegian | 1,011 | 1.0% |
| Osage | 70 | 0.1% |
| Pakistani | 95 | 0.1% |
| Palestinian | 45 | 0.0% |
| Panamanian | 169 | 0.2% |
| Peruvian | 245 | 0.2% |
| Pima | 10 | 0.0% |
| Polish | 1,577 | 1.5% |
| Portuguese | 292 | 0.3% |
| Puerto Rican | 462 | 0.4% |
| Romanian | 73 | 0.1% |
| Russian | 444 | 0.4% |
| Salvadoran | 678 | 0.6% |
| Samoan | 443 | 0.4% |
| Scandinavian | 590 | 0.6% |
| Scotch-Irish | 647 | 0.6% |
| Scottish | 1,372 | 1.3% |
| Serbian | 8 | 0.0% |
| Slavic | 9 | 0.0% |
| Slovak | 183 | 0.2% |
| South African | 38 | 0.0% |
| South American | 1,992 | 1.9% |
| Spaniard | 190 | 0.2% |
| Spanish | 146 | 0.1% |
| Spanish American | 21 | 0.0% |
| Sri Lankan | 1,375 | 1.3% |
| Subsaharan African | 394 | 0.4% |
| Swedish | 1,010 | 1.0% |
| Swiss | 231 | 0.2% |
| Thai | 449 | 0.4% |
| Tongan | 317 | 0.3% |
| Turkish | 89 | 0.1% |
| Ukrainian | 122 | 0.1% |
| Uruguayan | 133 | 0.1% |
| Venezuelan | 45 | 0.0% |
| Welsh | 696 | 0.7% |
| West Indian | 20 | 0.0% |
| Yaqui | 90 | 0.1% |
| Yugoslavian | 40 | 0.0% |
| Yuman | 15 | 0.0% |
| Zimbabwean | 5 | 0.0% | View All 118 Rows |
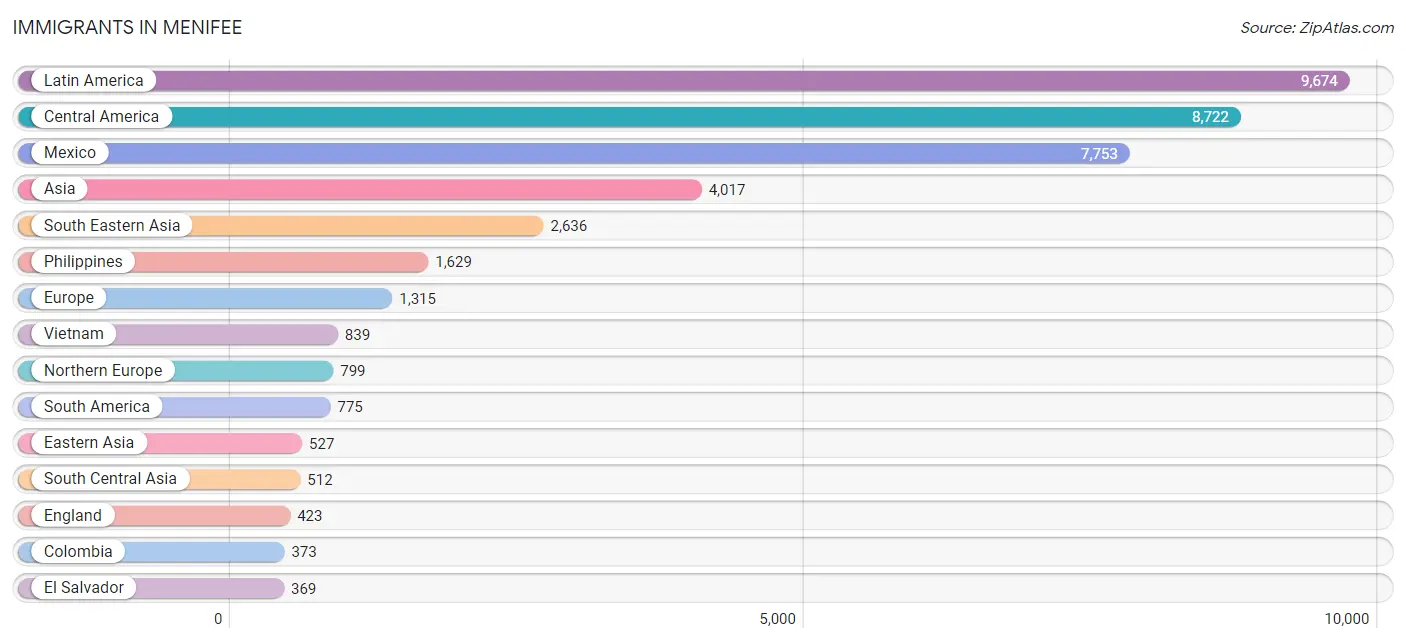
Immigrants in Menifee
The most numerous immigrant groups reported in Menifee came from Latin America (9,674 | 9.3%), Central America (8,722 | 8.4%), Mexico (7,753 | 7.5%), Asia (4,017 | 3.9%), and South Eastern Asia (2,636 | 2.5%), together accounting for 31.6% of all Menifee residents.
| Immigration Origin | # Population | % Population |
| Africa | 204 | 0.2% |
| Argentina | 34 | 0.0% |
| Armenia | 33 | 0.0% |
| Asia | 4,017 | 3.9% |
| Australia | 41 | 0.0% |
| Bahamas | 58 | 0.1% |
| Bangladesh | 19 | 0.0% |
| Barbados | 15 | 0.0% |
| Bolivia | 15 | 0.0% |
| Brazil | 27 | 0.0% |
| Cambodia | 25 | 0.0% |
| Canada | 351 | 0.3% |
| Caribbean | 177 | 0.2% |
| Central America | 8,722 | 8.4% |
| China | 286 | 0.3% |
| Colombia | 373 | 0.4% |
| Cuba | 63 | 0.1% |
| Czechoslovakia | 9 | 0.0% |
| Denmark | 81 | 0.1% |
| Eastern Africa | 35 | 0.0% |
| Eastern Asia | 527 | 0.5% |
| Eastern Europe | 158 | 0.2% |
| Ecuador | 96 | 0.1% |
| Egypt | 12 | 0.0% |
| El Salvador | 369 | 0.4% |
| England | 423 | 0.4% |
| Europe | 1,315 | 1.3% |
| Fiji | 17 | 0.0% |
| France | 100 | 0.1% |
| Germany | 119 | 0.1% |
| Greece | 20 | 0.0% |
| Guatemala | 195 | 0.2% |
| Honduras | 101 | 0.1% |
| Hong Kong | 63 | 0.1% |
| Hungary | 22 | 0.0% |
| India | 146 | 0.1% |
| Iran | 332 | 0.3% |
| Iraq | 66 | 0.1% |
| Ireland | 28 | 0.0% |
| Israel | 62 | 0.1% |
| Italy | 56 | 0.1% |
| Jamaica | 14 | 0.0% |
| Japan | 110 | 0.1% |
| Jordan | 52 | 0.1% |
| Kenya | 27 | 0.0% |
| Korea | 131 | 0.1% |
| Laos | 33 | 0.0% |
| Latin America | 9,674 | 9.3% |
| Lebanon | 106 | 0.1% |
| Mexico | 7,753 | 7.5% |
| Micronesia | 1 | 0.0% |
| Netherlands | 58 | 0.1% |
| Nicaragua | 285 | 0.3% |
| Nigeria | 49 | 0.1% |
| Northern Africa | 12 | 0.0% |
| Northern Europe | 799 | 0.8% |
| Norway | 7 | 0.0% |
| Oceania | 112 | 0.1% |
| Panama | 19 | 0.0% |
| Peru | 202 | 0.2% |
| Philippines | 1,629 | 1.6% |
| Poland | 39 | 0.0% |
| Romania | 38 | 0.0% |
| Scotland | 130 | 0.1% |
| Sierra Leone | 103 | 0.1% |
| South America | 775 | 0.7% |
| South Central Asia | 512 | 0.5% |
| South Eastern Asia | 2,636 | 2.5% |
| Southern Europe | 81 | 0.1% |
| Sweden | 29 | 0.0% |
| Taiwan | 106 | 0.1% |
| Thailand | 94 | 0.1% |
| Trinidad and Tobago | 27 | 0.0% |
| Turkey | 23 | 0.0% |
| Ukraine | 37 | 0.0% |
| Venezuela | 28 | 0.0% |
| Vietnam | 839 | 0.8% |
| Western Africa | 157 | 0.2% |
| Western Asia | 342 | 0.3% |
| Western Europe | 277 | 0.3% | View All 80 Rows |
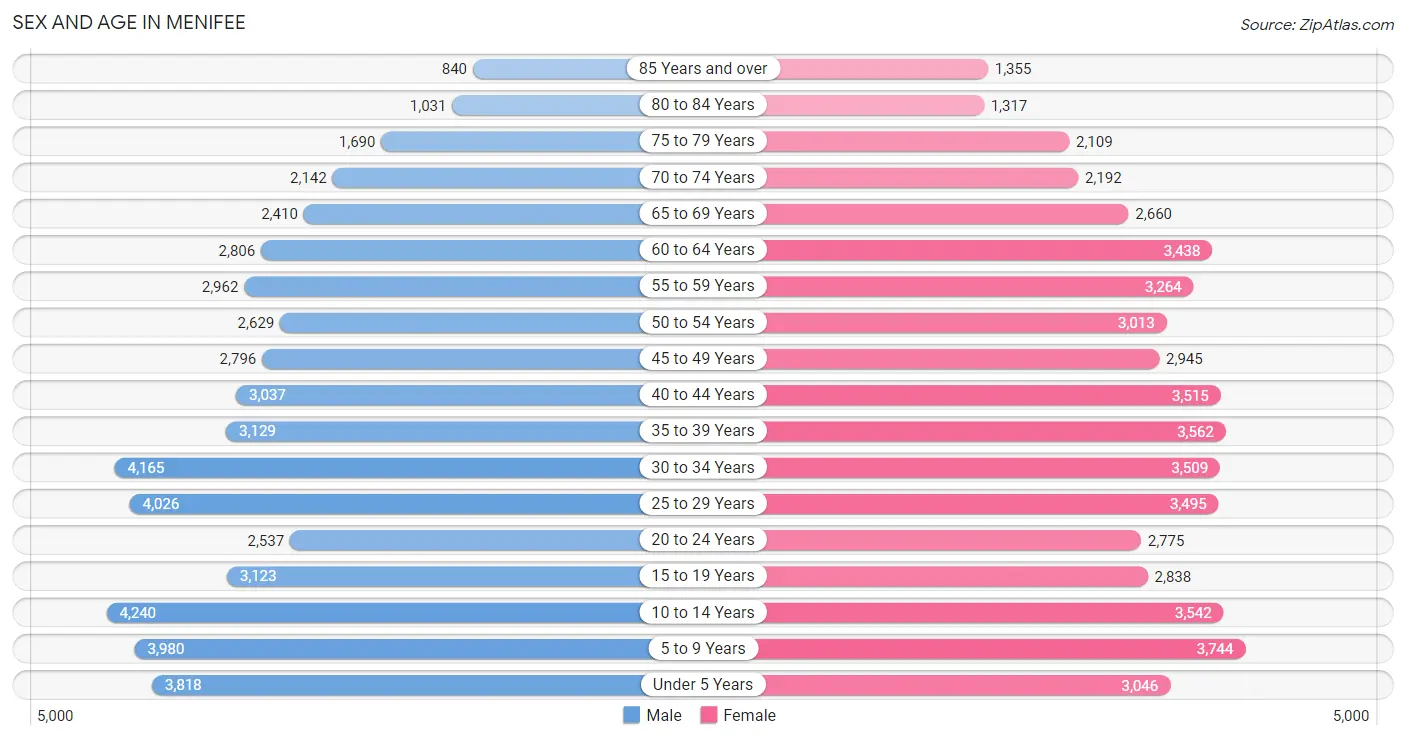
Sex and Age in Menifee
Sex and Age in Menifee
The most populous age groups in Menifee are 10 to 14 Years (4,240 | 8.3%) for men and 5 to 9 Years (3,744 | 7.2%) for women.
| Age Bracket | Male | Female |
| Under 5 Years | 3,818 (7.4%) | 3,046 (5.8%) |
| 5 to 9 Years | 3,980 (7.7%) | 3,744 (7.2%) |
| 10 to 14 Years | 4,240 (8.3%) | 3,542 (6.8%) |
| 15 to 19 Years | 3,123 (6.1%) | 2,838 (5.4%) |
| 20 to 24 Years | 2,537 (4.9%) | 2,775 (5.3%) |
| 25 to 29 Years | 4,026 (7.8%) | 3,495 (6.7%) |
| 30 to 34 Years | 4,165 (8.1%) | 3,509 (6.7%) |
| 35 to 39 Years | 3,129 (6.1%) | 3,562 (6.8%) |
| 40 to 44 Years | 3,037 (5.9%) | 3,515 (6.7%) |
| 45 to 49 Years | 2,796 (5.4%) | 2,945 (5.6%) |
| 50 to 54 Years | 2,629 (5.1%) | 3,013 (5.8%) |
| 55 to 59 Years | 2,962 (5.8%) | 3,264 (6.2%) |
| 60 to 64 Years | 2,806 (5.5%) | 3,438 (6.6%) |
| 65 to 69 Years | 2,410 (4.7%) | 2,660 (5.1%) |
| 70 to 74 Years | 2,142 (4.2%) | 2,192 (4.2%) |
| 75 to 79 Years | 1,690 (3.3%) | 2,109 (4.0%) |
| 80 to 84 Years | 1,031 (2.0%) | 1,317 (2.5%) |
| 85 Years and over | 840 (1.6%) | 1,355 (2.6%) |
| Total | 51,361 (100.0%) | 52,319 (100.0%) |
Families and Households in Menifee
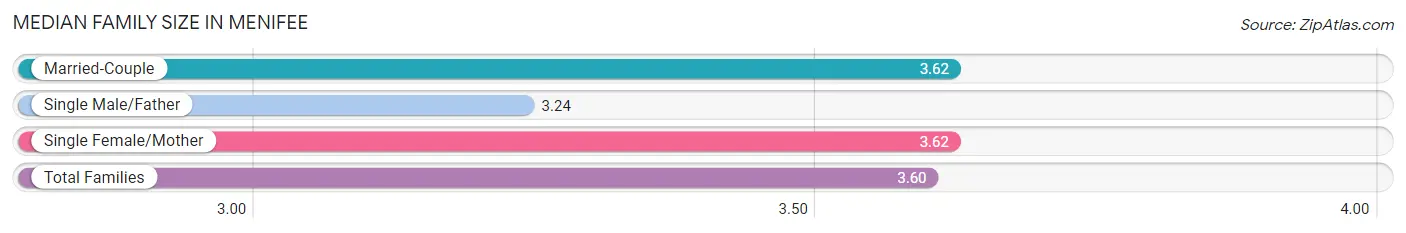
Median Family Size in Menifee
The median family size in Menifee is 3.60 persons per family, with married-couple families (19,702 | 78.5%) accounting for the largest median family size of 3.62 persons per family. On the other hand, single male/father families (1,664 | 6.6%) represent the smallest median family size with 3.24 persons per family.
| Family Type | # Families | Family Size |
| Married-Couple | 19,702 (78.5%) | 3.62 |
| Single Male/Father | 1,664 (6.6%) | 3.24 |
| Single Female/Mother | 3,726 (14.8%) | 3.62 |
| Total Families | 25,092 (100.0%) | 3.60 |
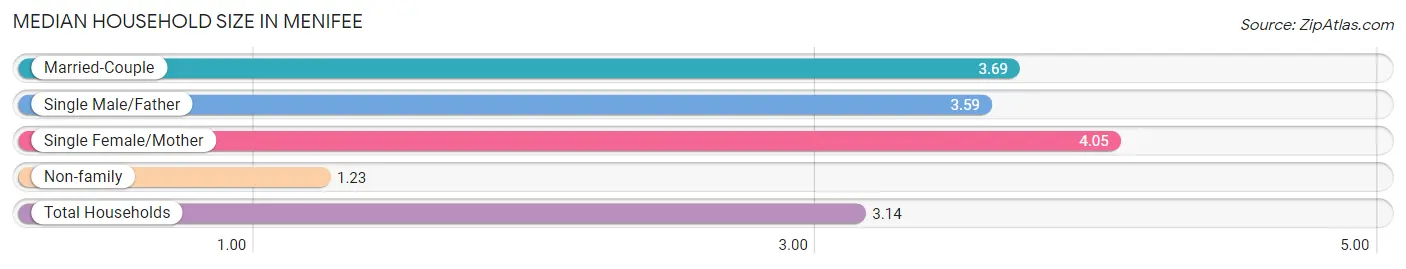
Median Household Size in Menifee
The median household size in Menifee is 3.14 persons per household, with single female/mother households (3,726 | 11.3%) accounting for the largest median household size of 4.05 persons per household. non-family households (7,916 | 24.0%) represent the smallest median household size with 1.23 persons per household.
| Household Type | # Households | Household Size |
| Married-Couple | 19,702 (59.7%) | 3.69 |
| Single Male/Father | 1,664 (5.0%) | 3.59 |
| Single Female/Mother | 3,726 (11.3%) | 4.05 |
| Non-family | 7,916 (24.0%) | 1.23 |
| Total Households | 33,008 (100.0%) | 3.14 |
Household Size by Marriage Status in Menifee
Out of a total of 33,008 households in Menifee, 25,092 (76.0%) are family households, while 7,916 (24.0%) are nonfamily households. The most numerous type of family households are 2-person households, comprising 8,845, and the most common type of nonfamily households are 1-person households, comprising 6,429.
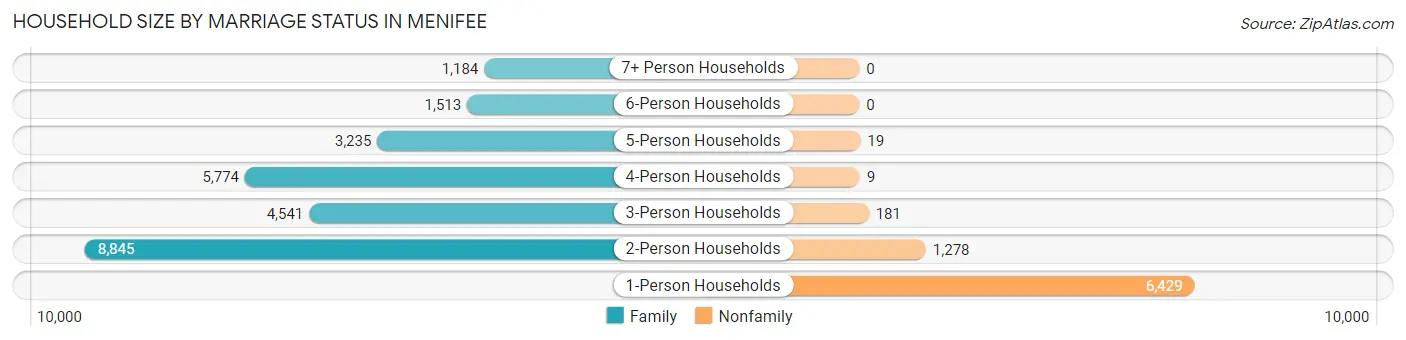
| Household Size | Family Households | Nonfamily Households |
| 1-Person Households | - | 6,429 (19.5%) |
| 2-Person Households | 8,845 (26.8%) | 1,278 (3.9%) |
| 3-Person Households | 4,541 (13.8%) | 181 (0.5%) |
| 4-Person Households | 5,774 (17.5%) | 9 (0.0%) |
| 5-Person Households | 3,235 (9.8%) | 19 (0.1%) |
| 6-Person Households | 1,513 (4.6%) | 0 (0.0%) |
| 7+ Person Households | 1,184 (3.6%) | 0 (0.0%) |
| Total | 25,092 (76.0%) | 7,916 (24.0%) |
Female Fertility in Menifee
Fertility by Age in Menifee
Average fertility rate in Menifee is 45.0 births per 1,000 women. Women in the age bracket of 20 to 34 years have the highest fertility rate with 82.0 births per 1,000 women. Women in the age bracket of 20 to 34 years acount for 77.2% of all women with births.
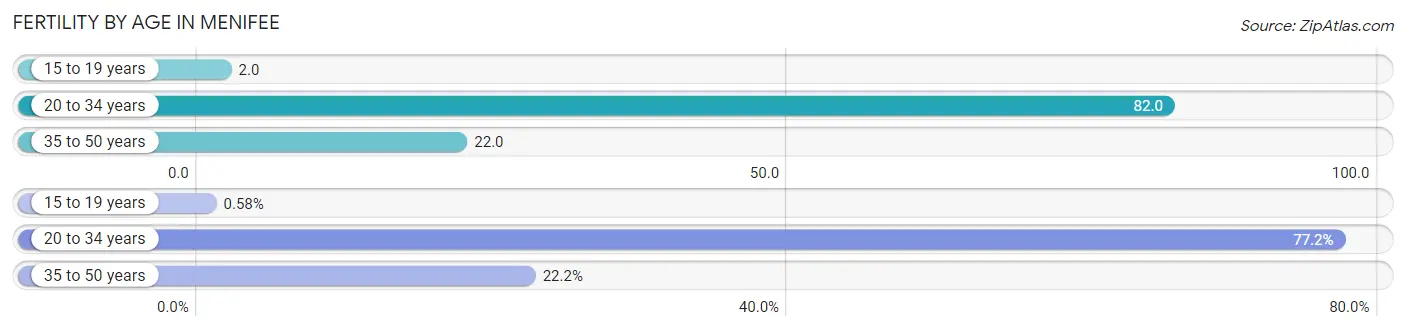
| Age Bracket | Women with Births | Births / 1,000 Women |
| 15 to 19 years | 6 (0.6%) | 2.0 |
| 20 to 34 years | 805 (77.2%) | 82.0 |
| 35 to 50 years | 232 (22.2%) | 22.0 |
| Total | 1,043 (100.0%) | 45.0 |
Fertility by Age by Marriage Status in Menifee
88.2% of women with births (1,043) in Menifee are married. The highest percentage of unmarried women with births falls into 20 to 34 years age bracket with 14.8% of them unmarried at the time of birth, while the lowest percentage of unmarried women with births belong to 15 to 19 years age bracket with 0.0% of them unmarried.
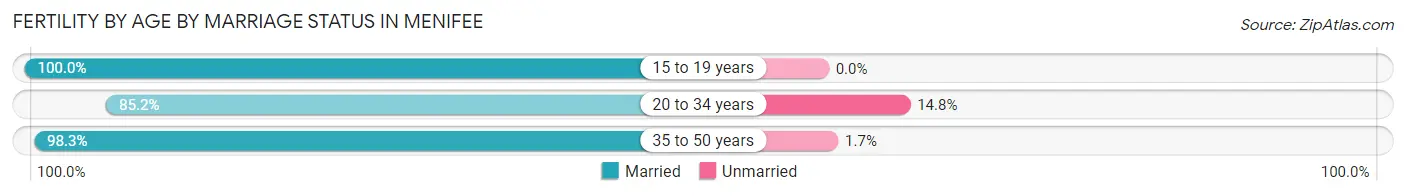
| Age Bracket | Married | Unmarried |
| 15 to 19 years | 6 (100.0%) | 0 (0.0%) |
| 20 to 34 years | 686 (85.2%) | 119 (14.8%) |
| 35 to 50 years | 228 (98.3%) | 4 (1.7%) |
| Total | 920 (88.2%) | 123 (11.8%) |
Fertility by Education in Menifee
Average fertility rate in Menifee is 45.0 births per 1,000 women. Women with the education attainment of bachelor's degree have the highest fertility rate of 79.0 births per 1,000 women, while women with the education attainment of college or associate's degree have the lowest fertility at 32.0 births per 1,000 women. Women with the education attainment of bachelor's degree represent 28.4% of all women with births.
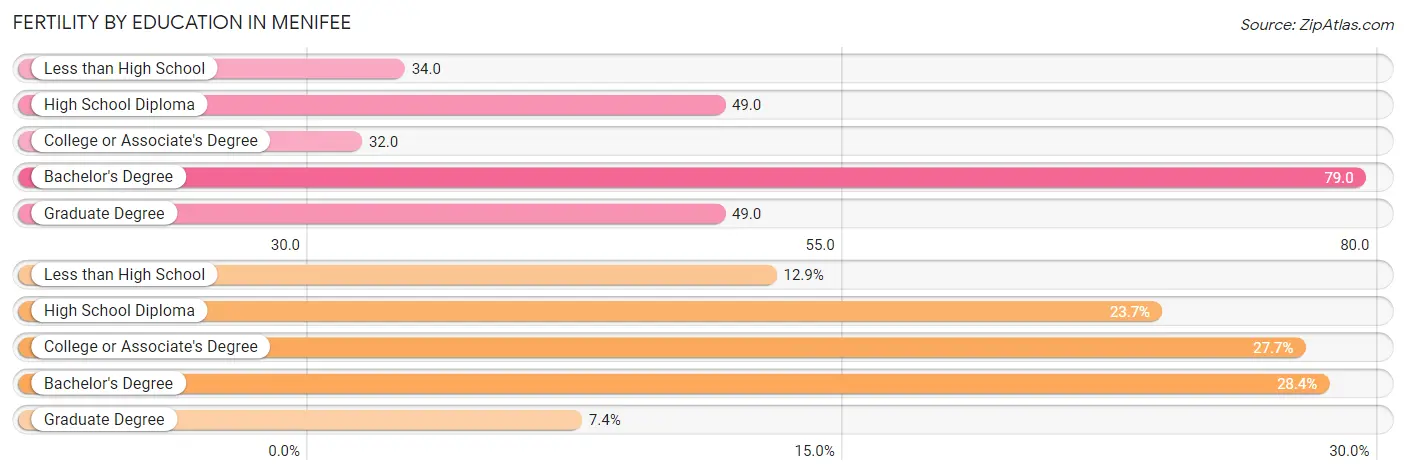
| Educational Attainment | Women with Births | Births / 1,000 Women |
| Less than High School | 134 (12.9%) | 34.0 |
| High School Diploma | 247 (23.7%) | 49.0 |
| College or Associate's Degree | 289 (27.7%) | 32.0 |
| Bachelor's Degree | 296 (28.4%) | 79.0 |
| Graduate Degree | 77 (7.4%) | 49.0 |
| Total | 1,043 (100.0%) | 45.0 |
Fertility by Education by Marriage Status in Menifee
11.8% of women with births in Menifee are unmarried. Women with the educational attainment of graduate degree are most likely to be married with 100.0% of them married at childbirth, while women with the educational attainment of high school diploma are least likely to be married with 28.7% of them unmarried at childbirth.
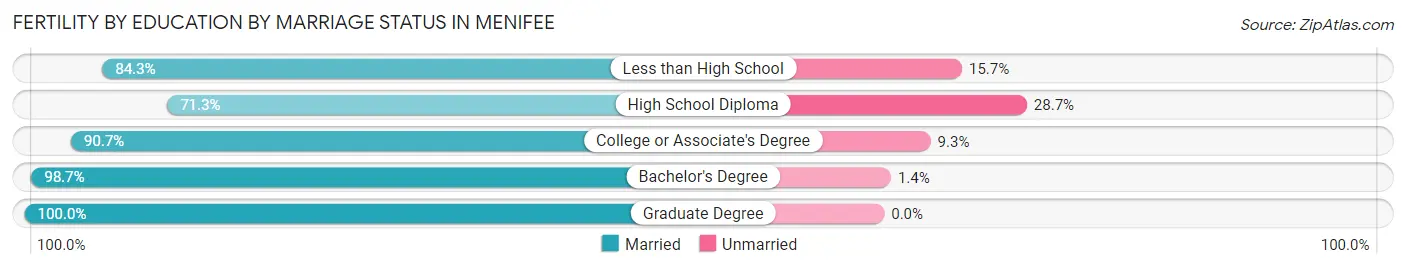
| Educational Attainment | Married | Unmarried |
| Less than High School | 113 (84.3%) | 21 (15.7%) |
| High School Diploma | 176 (71.3%) | 71 (28.7%) |
| College or Associate's Degree | 262 (90.7%) | 27 (9.3%) |
| Bachelor's Degree | 292 (98.7%) | 4 (1.3%) |
| Graduate Degree | 77 (100.0%) | 0 (0.0%) |
| Total | 920 (88.2%) | 123 (11.8%) |
Employment Characteristics in Menifee
Employment by Class of Employer in Menifee
Among the 41,230 employed individuals in Menifee, private company employees (28,183 | 68.4%), local government employees (4,200 | 10.2%), and self-employed (not incorporated) (2,292 | 5.6%) make up the most common classes of employment.
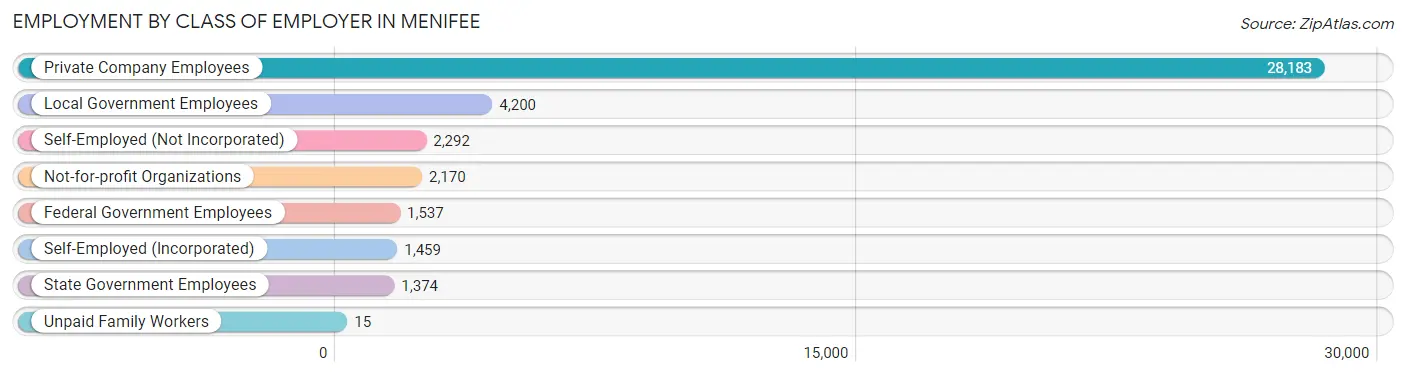
| Employer Class | # Employees | % Employees |
| Private Company Employees | 28,183 | 68.4% |
| Self-Employed (Incorporated) | 1,459 | 3.5% |
| Self-Employed (Not Incorporated) | 2,292 | 5.6% |
| Not-for-profit Organizations | 2,170 | 5.3% |
| Local Government Employees | 4,200 | 10.2% |
| State Government Employees | 1,374 | 3.3% |
| Federal Government Employees | 1,537 | 3.7% |
| Unpaid Family Workers | 15 | 0.0% |
| Total | 41,230 | 100.0% |
Employment Status by Age in Menifee
According to the labor force statistics for Menifee, out of the total population over 16 years of age (79,984), 57.6% or 46,071 individuals are in the labor force, with 7.1% or 3,271 of them unemployed. The age group with the highest labor force participation rate is 30 to 34 years, with 78.0% or 5,986 individuals in the labor force. Within the labor force, the 16 to 19 years age range has the highest percentage of unemployed individuals, with 21.0% or 328 of them being unemployed.
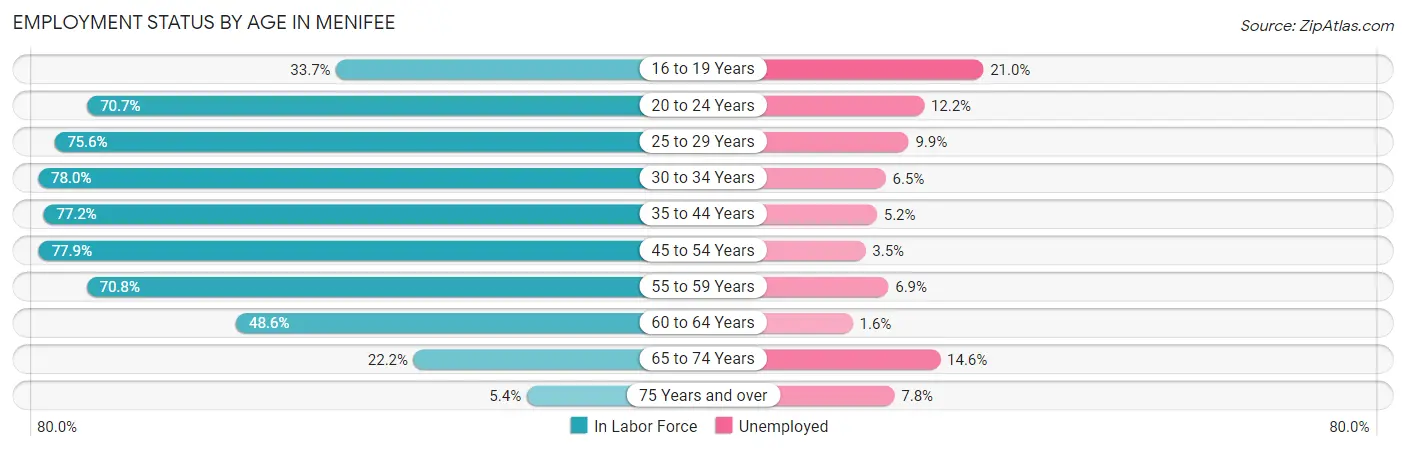
| Age Bracket | In Labor Force | Unemployed |
| 16 to 19 Years | 1,562 (33.7%) | 328 (21.0%) |
| 20 to 24 Years | 3,756 (70.7%) | 458 (12.2%) |
| 25 to 29 Years | 5,686 (75.6%) | 563 (9.9%) |
| 30 to 34 Years | 5,986 (78.0%) | 389 (6.5%) |
| 35 to 44 Years | 10,224 (77.2%) | 532 (5.2%) |
| 45 to 54 Years | 8,867 (77.9%) | 310 (3.5%) |
| 55 to 59 Years | 4,408 (70.8%) | 304 (6.9%) |
| 60 to 64 Years | 3,035 (48.6%) | 49 (1.6%) |
| 65 to 74 Years | 2,088 (22.2%) | 305 (14.6%) |
| 75 Years and over | 450 (5.4%) | 35 (7.8%) |
| Total | 46,071 (57.6%) | 3,271 (7.1%) |
Employment Status by Educational Attainment in Menifee
According to labor force statistics for Menifee, 73.0% of individuals (38,172) out of the total population between 25 and 64 years of age (52,291) are in the labor force, with 5.6% or 2,138 of them being unemployed. The group with the highest labor force participation rate are those with the educational attainment of bachelor's degree or higher, with 83.0% or 9,840 individuals in the labor force. Within the labor force, individuals with less than high school education have the highest percentage of unemployment, with 7.1% or 242 of them being unemployed.
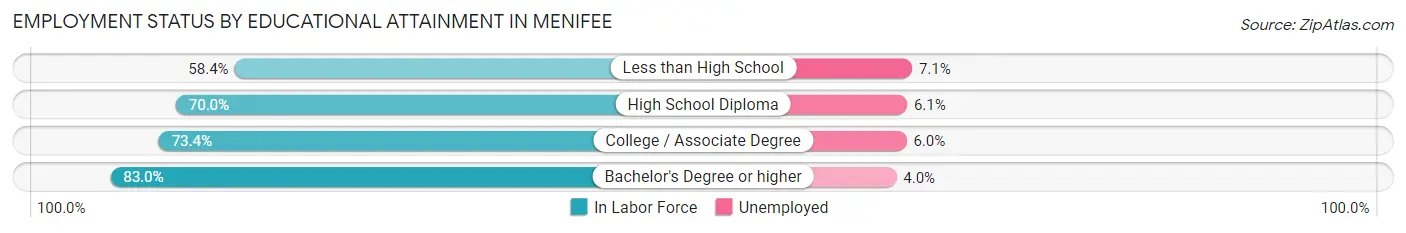
| Educational Attainment | In Labor Force | Unemployed |
| Less than High School | 3,405 (58.4%) | 414 (7.1%) |
| High School Diploma | 9,254 (70.0%) | 806 (6.1%) |
| College / Associate Degree | 15,697 (73.4%) | 1,283 (6.0%) |
| Bachelor's Degree or higher | 9,840 (83.0%) | 474 (4.0%) |
| Total | 38,172 (73.0%) | 2,928 (5.6%) |
Employment Occupations by Sex in Menifee
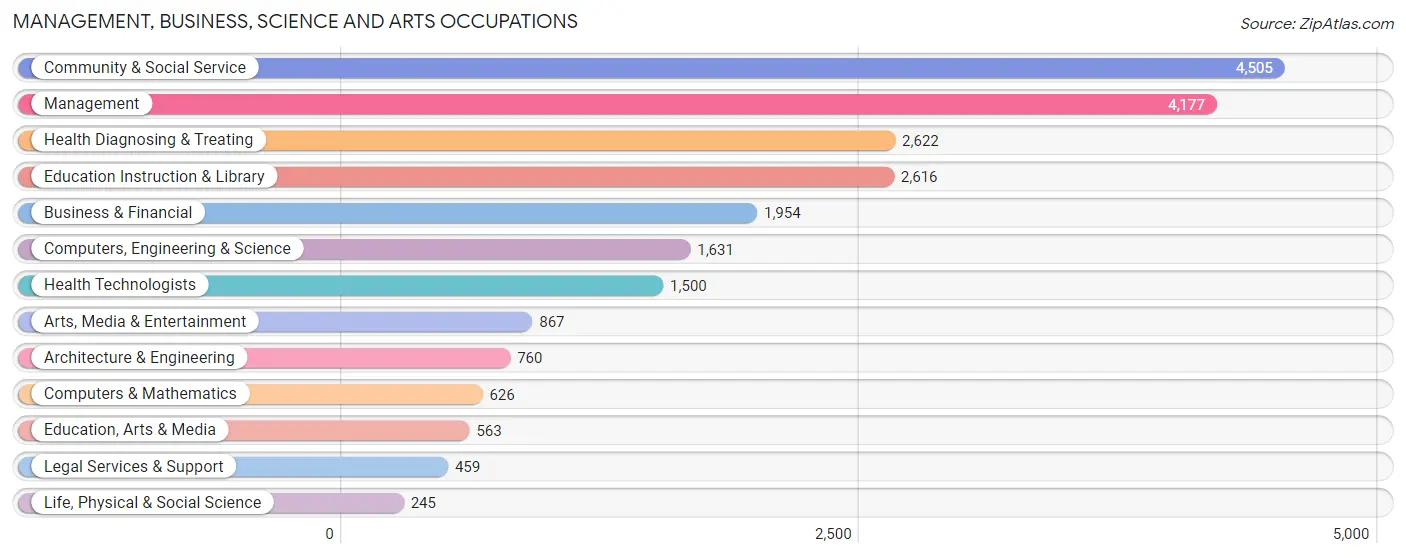
Management, Business, Science and Arts Occupations
The most common Management, Business, Science and Arts occupations in Menifee are Community & Social Service (4,505 | 10.7%), Management (4,177 | 9.9%), Health Diagnosing & Treating (2,622 | 6.2%), Education Instruction & Library (2,616 | 6.2%), and Business & Financial (1,954 | 4.6%).
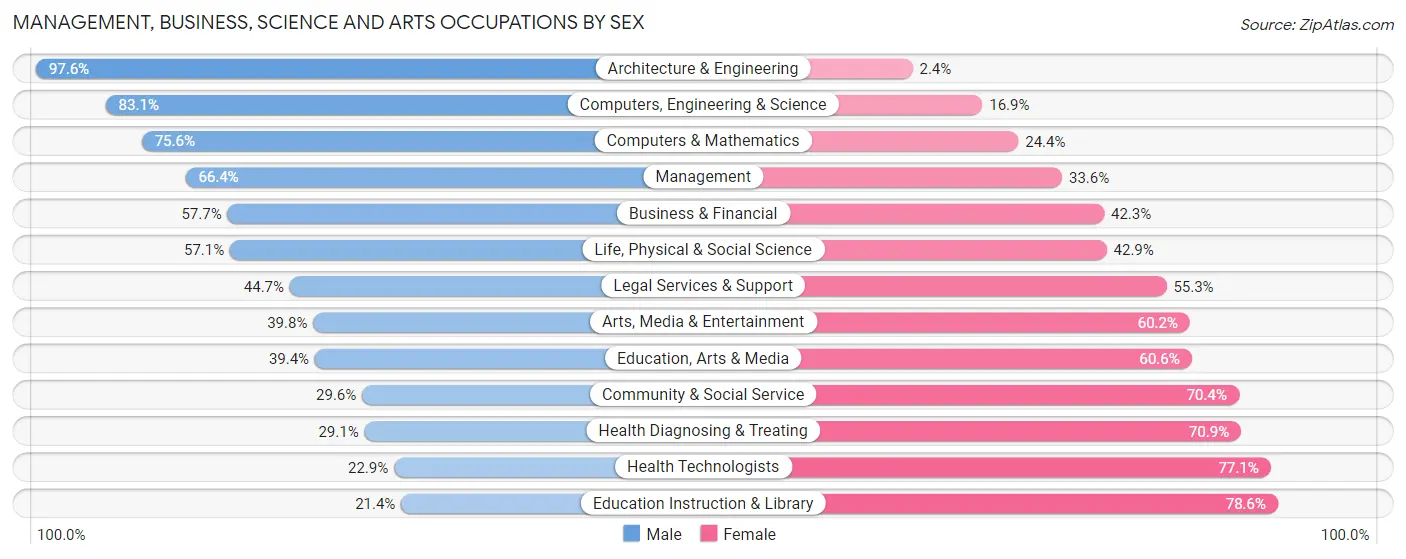
Management, Business, Science and Arts Occupations by Sex
Within the Management, Business, Science and Arts occupations in Menifee, the most male-oriented occupations are Architecture & Engineering (97.6%), Computers, Engineering & Science (83.1%), and Computers & Mathematics (75.6%), while the most female-oriented occupations are Education Instruction & Library (78.6%), Health Technologists (77.1%), and Health Diagnosing & Treating (70.9%).
| Occupation | Male | Female |
| Management | 2,775 (66.4%) | 1,402 (33.6%) |
| Business & Financial | 1,127 (57.7%) | 827 (42.3%) |
| Computers, Engineering & Science | 1,355 (83.1%) | 276 (16.9%) |
| Computers & Mathematics | 473 (75.6%) | 153 (24.4%) |
| Architecture & Engineering | 742 (97.6%) | 18 (2.4%) |
| Life, Physical & Social Science | 140 (57.1%) | 105 (42.9%) |
| Community & Social Service | 1,333 (29.6%) | 3,172 (70.4%) |
| Education, Arts & Media | 222 (39.4%) | 341 (60.6%) |
| Legal Services & Support | 205 (44.7%) | 254 (55.3%) |
| Education Instruction & Library | 561 (21.4%) | 2,055 (78.6%) |
| Arts, Media & Entertainment | 345 (39.8%) | 522 (60.2%) |
| Health Diagnosing & Treating | 763 (29.1%) | 1,859 (70.9%) |
| Health Technologists | 344 (22.9%) | 1,156 (77.1%) |
| Total (Category) | 7,353 (49.4%) | 7,536 (50.6%) |
| Total (Overall) | 23,139 (54.7%) | 19,133 (45.3%) |
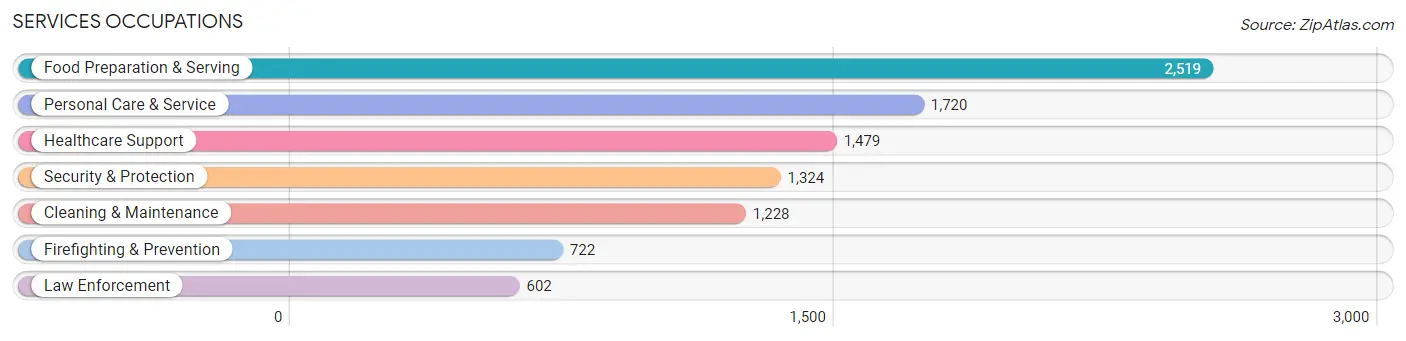
Services Occupations
The most common Services occupations in Menifee are Food Preparation & Serving (2,519 | 6.0%), Personal Care & Service (1,720 | 4.1%), Healthcare Support (1,479 | 3.5%), Security & Protection (1,324 | 3.1%), and Cleaning & Maintenance (1,228 | 2.9%).
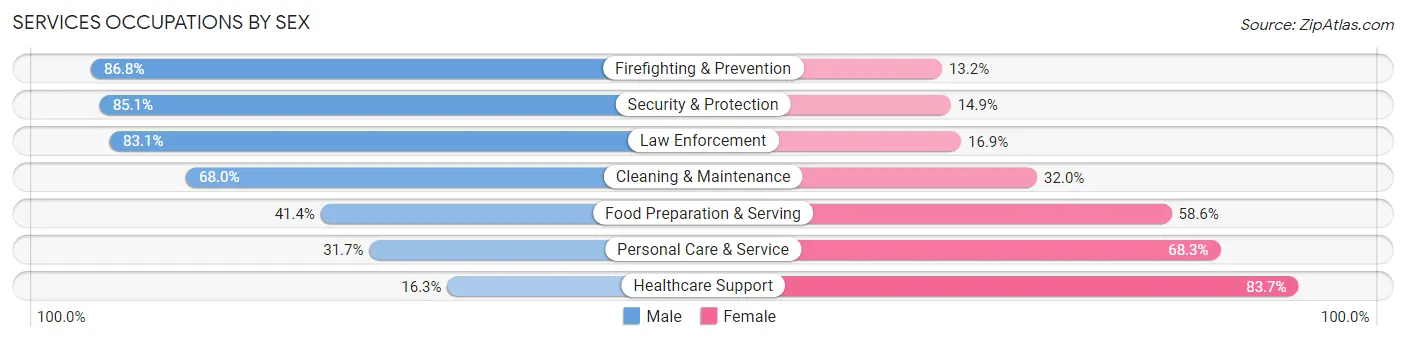
Services Occupations by Sex
Within the Services occupations in Menifee, the most male-oriented occupations are Firefighting & Prevention (86.8%), Security & Protection (85.1%), and Law Enforcement (83.1%), while the most female-oriented occupations are Healthcare Support (83.7%), Personal Care & Service (68.3%), and Food Preparation & Serving (58.6%).
| Occupation | Male | Female |
| Healthcare Support | 241 (16.3%) | 1,238 (83.7%) |
| Security & Protection | 1,127 (85.1%) | 197 (14.9%) |
| Firefighting & Prevention | 627 (86.8%) | 95 (13.2%) |
| Law Enforcement | 500 (83.1%) | 102 (16.9%) |
| Food Preparation & Serving | 1,042 (41.4%) | 1,477 (58.6%) |
| Cleaning & Maintenance | 835 (68.0%) | 393 (32.0%) |
| Personal Care & Service | 546 (31.7%) | 1,174 (68.3%) |
| Total (Category) | 3,791 (45.8%) | 4,479 (54.2%) |
| Total (Overall) | 23,139 (54.7%) | 19,133 (45.3%) |
Sales and Office Occupations
The most common Sales and Office occupations in Menifee are Sales & Related (4,685 | 11.1%), and Office & Administration (4,532 | 10.7%).

Sales and Office Occupations by Sex
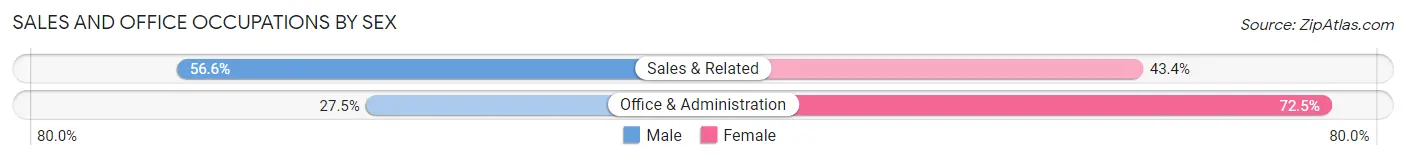
| Occupation | Male | Female |
| Sales & Related | 2,651 (56.6%) | 2,034 (43.4%) |
| Office & Administration | 1,248 (27.5%) | 3,284 (72.5%) |
| Total (Category) | 3,899 (42.3%) | 5,318 (57.7%) |
| Total (Overall) | 23,139 (54.7%) | 19,133 (45.3%) |
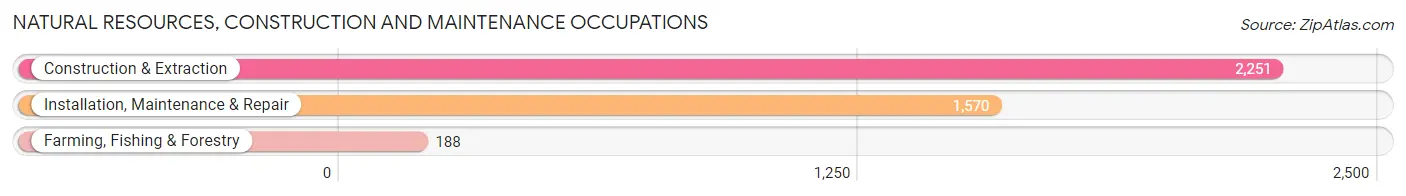
Natural Resources, Construction and Maintenance Occupations
The most common Natural Resources, Construction and Maintenance occupations in Menifee are Construction & Extraction (2,251 | 5.3%), Installation, Maintenance & Repair (1,570 | 3.7%), and Farming, Fishing & Forestry (188 | 0.4%).
Natural Resources, Construction and Maintenance Occupations by Sex
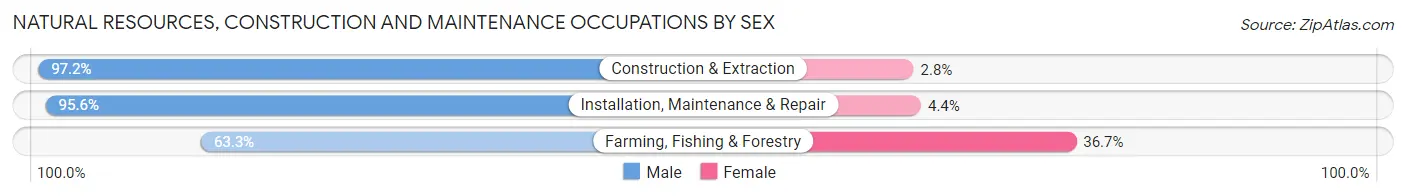
| Occupation | Male | Female |
| Farming, Fishing & Forestry | 119 (63.3%) | 69 (36.7%) |
| Construction & Extraction | 2,187 (97.2%) | 64 (2.8%) |
| Installation, Maintenance & Repair | 1,501 (95.6%) | 69 (4.4%) |
| Total (Category) | 3,807 (95.0%) | 202 (5.0%) |
| Total (Overall) | 23,139 (54.7%) | 19,133 (45.3%) |
Production, Transportation and Moving Occupations
The most common Production, Transportation and Moving occupations in Menifee are Transportation (2,087 | 4.9%), Material Moving (1,945 | 4.6%), and Production (1,855 | 4.4%).
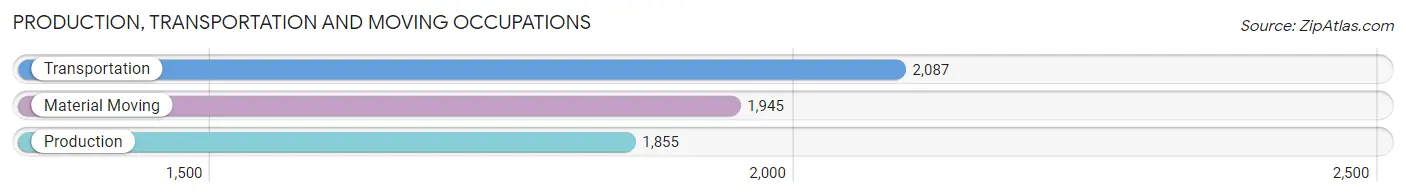
Production, Transportation and Moving Occupations by Sex
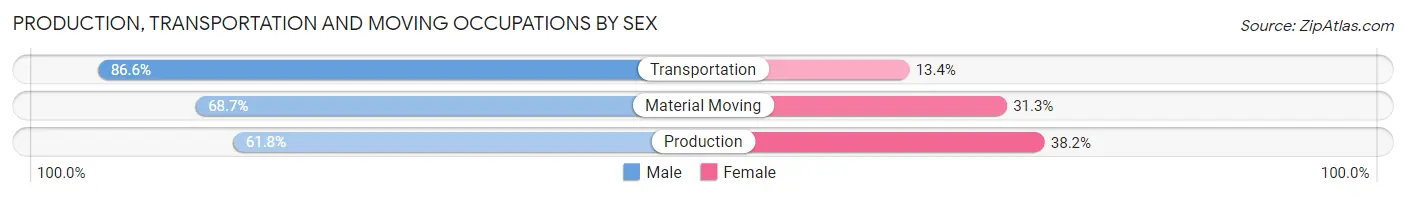
| Occupation | Male | Female |
| Production | 1,146 (61.8%) | 709 (38.2%) |
| Transportation | 1,807 (86.6%) | 280 (13.4%) |
| Material Moving | 1,336 (68.7%) | 609 (31.3%) |
| Total (Category) | 4,289 (72.9%) | 1,598 (27.1%) |
| Total (Overall) | 23,139 (54.7%) | 19,133 (45.3%) |
Employment Industries by Sex in Menifee
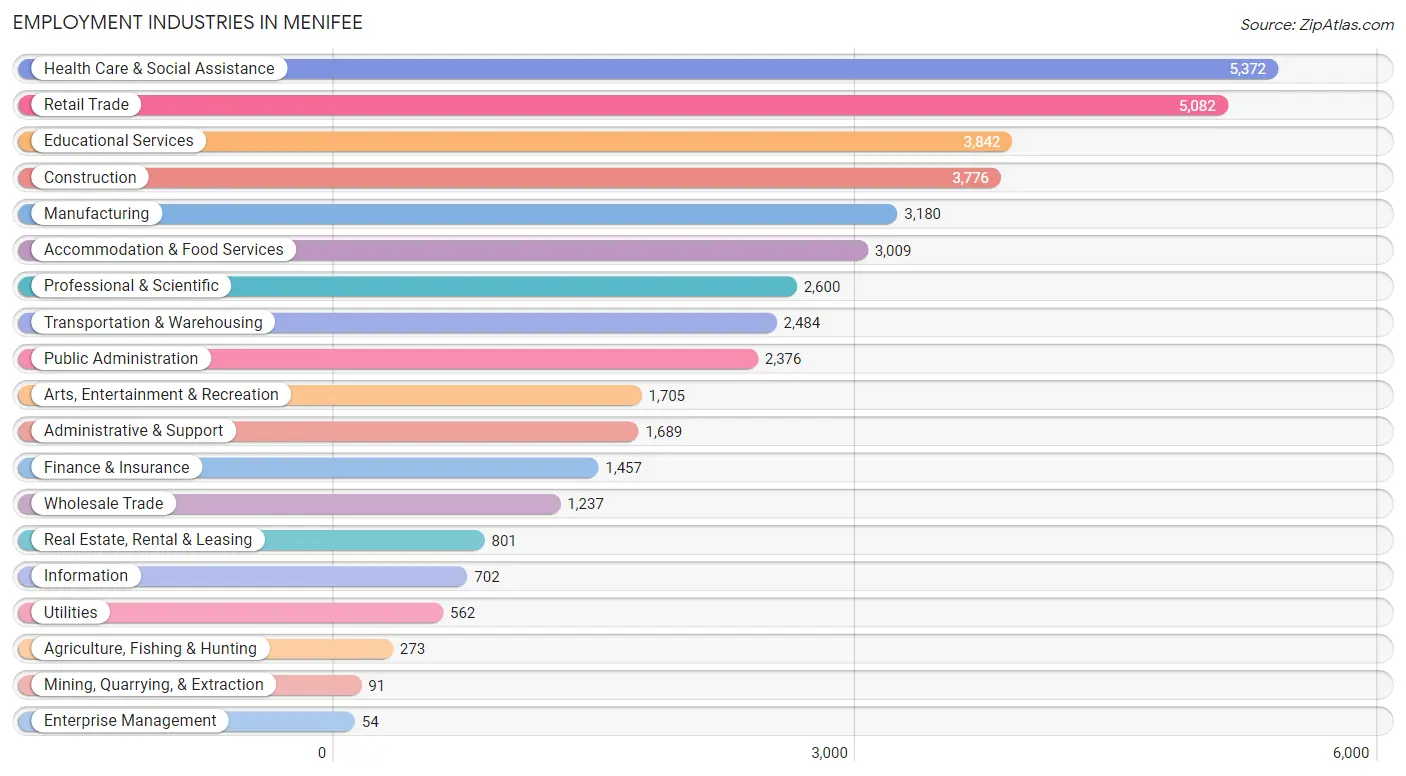
Employment Industries in Menifee
The major employment industries in Menifee include Health Care & Social Assistance (5,372 | 12.7%), Retail Trade (5,082 | 12.0%), Educational Services (3,842 | 9.1%), Construction (3,776 | 8.9%), and Manufacturing (3,180 | 7.5%).
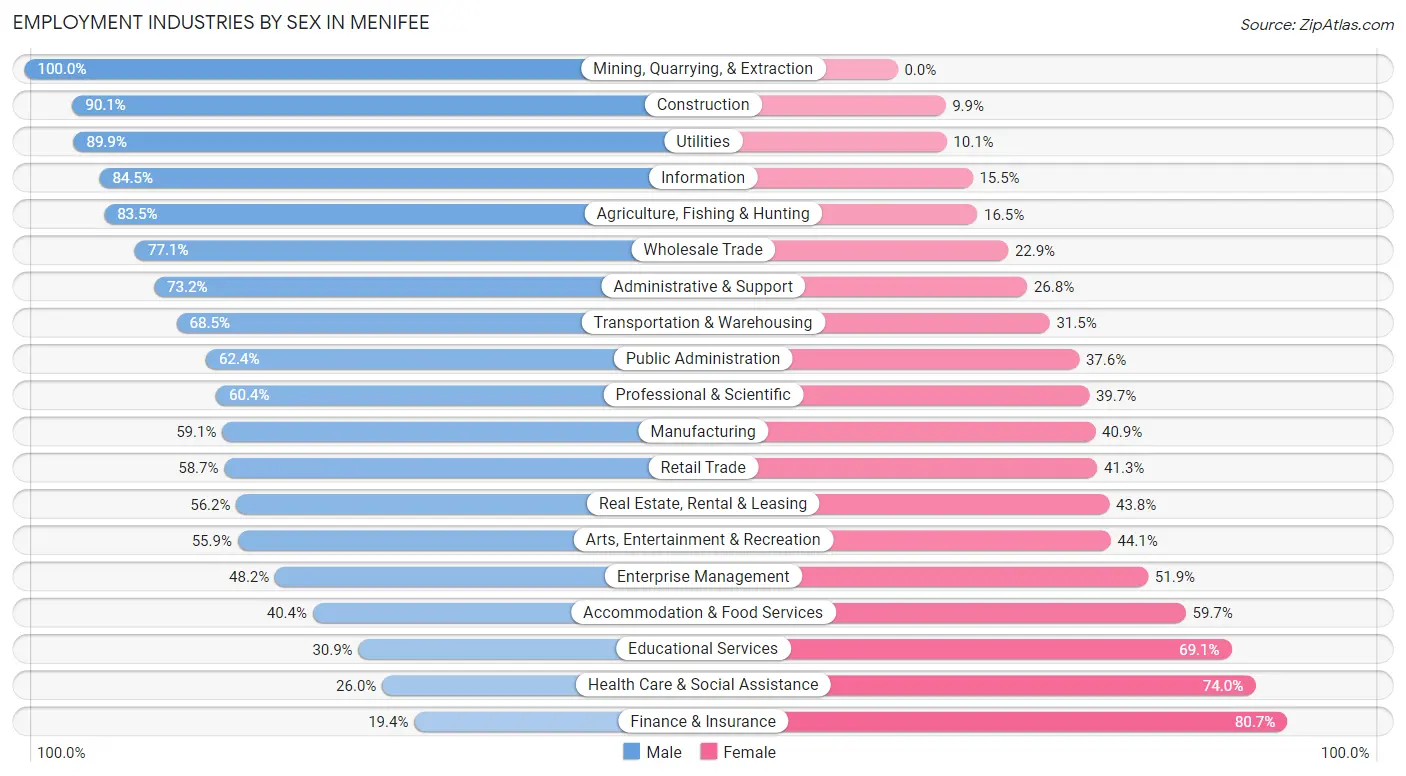
Employment Industries by Sex in Menifee
The Menifee industries that see more men than women are Mining, Quarrying, & Extraction (100.0%), Construction (90.1%), and Utilities (89.9%), whereas the industries that tend to have a higher number of women are Finance & Insurance (80.6%), Health Care & Social Assistance (74.0%), and Educational Services (69.1%).
| Industry | Male | Female |
| Agriculture, Fishing & Hunting | 228 (83.5%) | 45 (16.5%) |
| Mining, Quarrying, & Extraction | 91 (100.0%) | 0 (0.0%) |
| Construction | 3,402 (90.1%) | 374 (9.9%) |
| Manufacturing | 1,879 (59.1%) | 1,301 (40.9%) |
| Wholesale Trade | 954 (77.1%) | 283 (22.9%) |
| Retail Trade | 2,981 (58.7%) | 2,101 (41.3%) |
| Transportation & Warehousing | 1,702 (68.5%) | 782 (31.5%) |
| Utilities | 505 (89.9%) | 57 (10.1%) |
| Information | 593 (84.5%) | 109 (15.5%) |
| Finance & Insurance | 282 (19.4%) | 1,175 (80.6%) |
| Real Estate, Rental & Leasing | 450 (56.2%) | 351 (43.8%) |
| Professional & Scientific | 1,569 (60.4%) | 1,031 (39.7%) |
| Enterprise Management | 26 (48.1%) | 28 (51.8%) |
| Administrative & Support | 1,236 (73.2%) | 453 (26.8%) |
| Educational Services | 1,187 (30.9%) | 2,655 (69.1%) |
| Health Care & Social Assistance | 1,396 (26.0%) | 3,976 (74.0%) |
| Arts, Entertainment & Recreation | 953 (55.9%) | 752 (44.1%) |
| Accommodation & Food Services | 1,214 (40.4%) | 1,795 (59.7%) |
| Public Administration | 1,483 (62.4%) | 893 (37.6%) |
| Total | 23,139 (54.7%) | 19,133 (45.3%) |
Education in Menifee
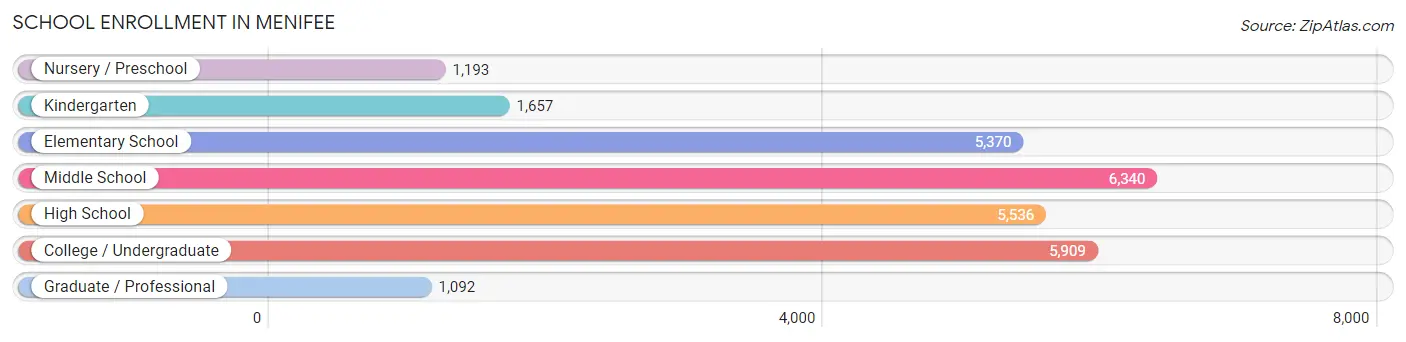
School Enrollment in Menifee
The most common levels of schooling among the 27,097 students in Menifee are middle school (6,340 | 23.4%), college / undergraduate (5,909 | 21.8%), and high school (5,536 | 20.4%).
| School Level | # Students | % Students |
| Nursery / Preschool | 1,193 | 4.4% |
| Kindergarten | 1,657 | 6.1% |
| Elementary School | 5,370 | 19.8% |
| Middle School | 6,340 | 23.4% |
| High School | 5,536 | 20.4% |
| College / Undergraduate | 5,909 | 21.8% |
| Graduate / Professional | 1,092 | 4.0% |
| Total | 27,097 | 100.0% |
School Enrollment by Age by Funding Source in Menifee
Out of a total of 27,097 students who are enrolled in schools in Menifee, 3,577 (13.2%) attend a private institution, while the remaining 23,520 (86.8%) are enrolled in public schools. The age group of 3 to 4 year olds has the highest likelihood of being enrolled in private schools, with 274 (46.3% in the age bracket) enrolled. Conversely, the age group of 15 to 17 year olds has the lowest likelihood of being enrolled in a private school, with 4,016 (94.6% in the age bracket) attending a public institution.
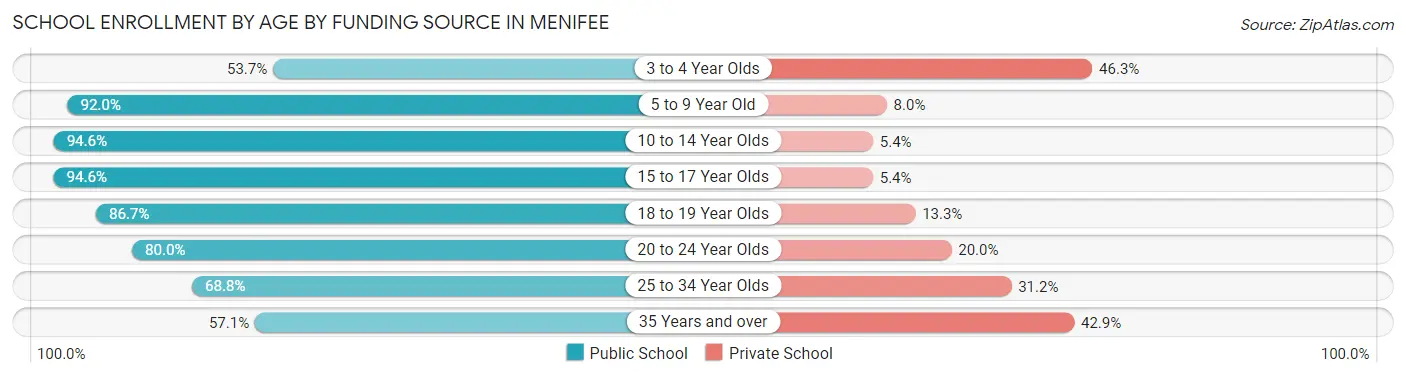
| Age Bracket | Public School | Private School |
| 3 to 4 Year Olds | 318 (53.7%) | 274 (46.3%) |
| 5 to 9 Year Old | 6,594 (92.0%) | 574 (8.0%) |
| 10 to 14 Year Olds | 7,261 (94.6%) | 417 (5.4%) |
| 15 to 17 Year Olds | 4,016 (94.6%) | 230 (5.4%) |
| 18 to 19 Year Olds | 898 (86.7%) | 138 (13.3%) |
| 20 to 24 Year Olds | 1,823 (80.0%) | 457 (20.0%) |
| 25 to 34 Year Olds | 1,640 (68.8%) | 744 (31.2%) |
| 35 Years and over | 978 (57.1%) | 735 (42.9%) |
| Total | 23,520 (86.8%) | 3,577 (13.2%) |
Educational Attainment by Field of Study in Menifee
Business (3,289 | 21.2%), science & technology (1,697 | 11.0%), education (1,376 | 8.9%), arts & humanities (1,244 | 8.0%), and liberal arts & history (1,223 | 7.9%) are the most common fields of study among 15,478 individuals in Menifee who have obtained a bachelor's degree or higher.
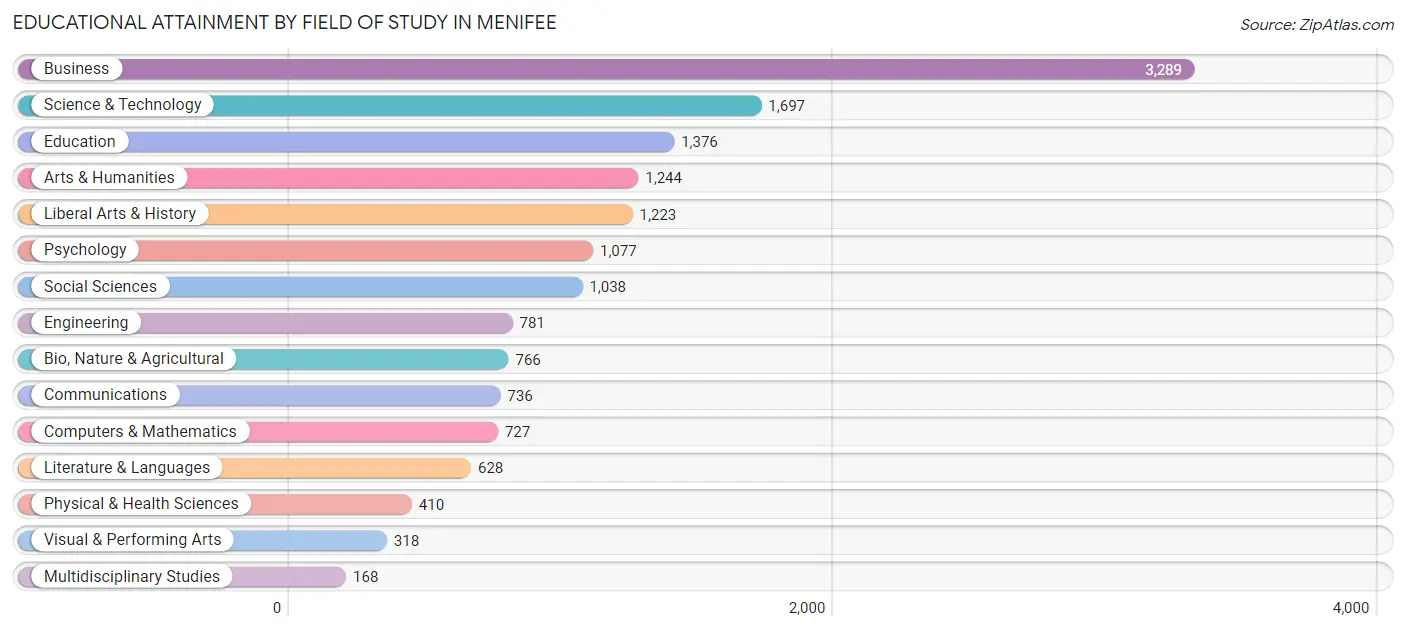
| Field of Study | # Graduates | % Graduates |
| Computers & Mathematics | 727 | 4.7% |
| Bio, Nature & Agricultural | 766 | 5.0% |
| Physical & Health Sciences | 410 | 2.6% |
| Psychology | 1,077 | 7.0% |
| Social Sciences | 1,038 | 6.7% |
| Engineering | 781 | 5.1% |
| Multidisciplinary Studies | 168 | 1.1% |
| Science & Technology | 1,697 | 11.0% |
| Business | 3,289 | 21.2% |
| Education | 1,376 | 8.9% |
| Literature & Languages | 628 | 4.1% |
| Liberal Arts & History | 1,223 | 7.9% |
| Visual & Performing Arts | 318 | 2.1% |
| Communications | 736 | 4.8% |
| Arts & Humanities | 1,244 | 8.0% |
| Total | 15,478 | 100.0% |
Transportation & Commute in Menifee
Vehicle Availability by Sex in Menifee
The most prevalent vehicle ownership categories in Menifee are males with 2 vehicles (8,528, accounting for 37.7%) and females with 2 vehicles (6,971, making up 46.0%).
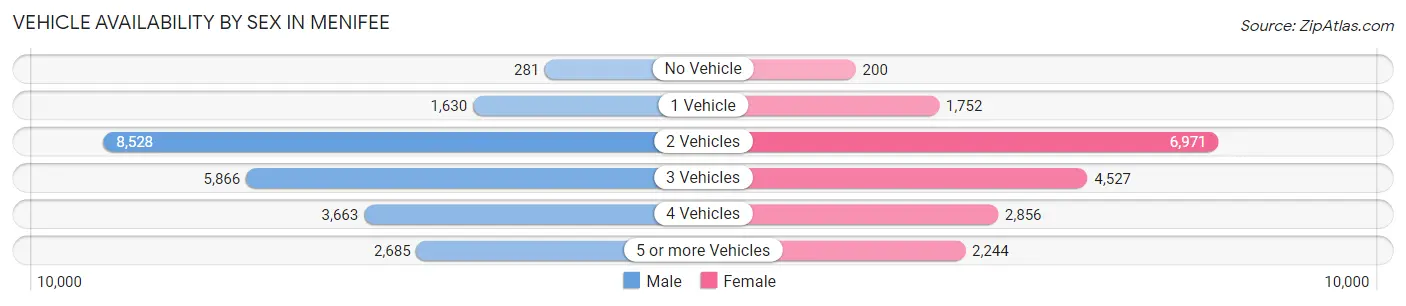
| Vehicles Available | Male | Female |
| No Vehicle | 281 (1.2%) | 200 (1.1%) |
| 1 Vehicle | 1,630 (7.2%) | 1,752 (9.4%) |
| 2 Vehicles | 8,528 (37.7%) | 6,971 (37.6%) |
| 3 Vehicles | 5,866 (25.9%) | 4,527 (24.4%) |
| 4 Vehicles | 3,663 (16.2%) | 2,856 (15.4%) |
| 5 or more Vehicles | 2,685 (11.8%) | 2,244 (12.1%) |
| Total | 22,653 (100.0%) | 18,550 (100.0%) |
Commute Time in Menifee
The most frequently occuring commute durations in Menifee are 30 to 34 minutes (5,320 commuters, 14.5%), 60 to 89 minutes (5,053 commuters, 13.8%), and 20 to 24 minutes (4,898 commuters, 13.3%).
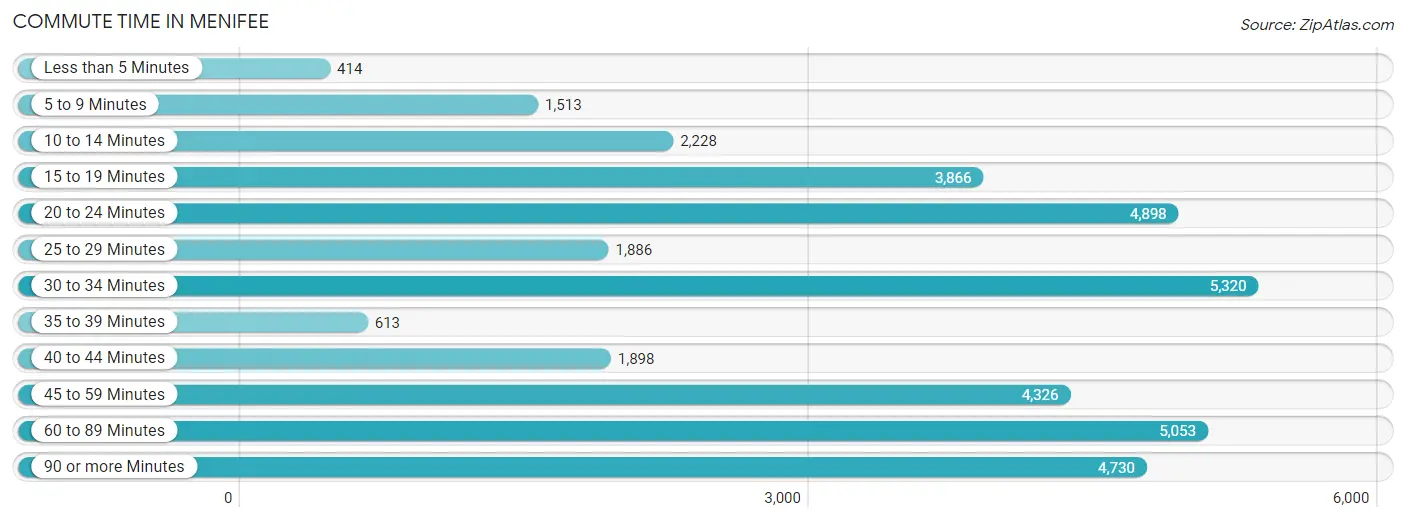
| Commute Time | # Commuters | % Commuters |
| Less than 5 Minutes | 414 | 1.1% |
| 5 to 9 Minutes | 1,513 | 4.1% |
| 10 to 14 Minutes | 2,228 | 6.1% |
| 15 to 19 Minutes | 3,866 | 10.5% |
| 20 to 24 Minutes | 4,898 | 13.3% |
| 25 to 29 Minutes | 1,886 | 5.1% |
| 30 to 34 Minutes | 5,320 | 14.5% |
| 35 to 39 Minutes | 613 | 1.7% |
| 40 to 44 Minutes | 1,898 | 5.2% |
| 45 to 59 Minutes | 4,326 | 11.8% |
| 60 to 89 Minutes | 5,053 | 13.8% |
| 90 or more Minutes | 4,730 | 12.9% |
Commute Time by Sex in Menifee
The most common commute times in Menifee are 90 or more minutes (3,605 commuters, 17.3%) for males and 30 to 34 minutes (2,536 commuters, 15.9%) for females.
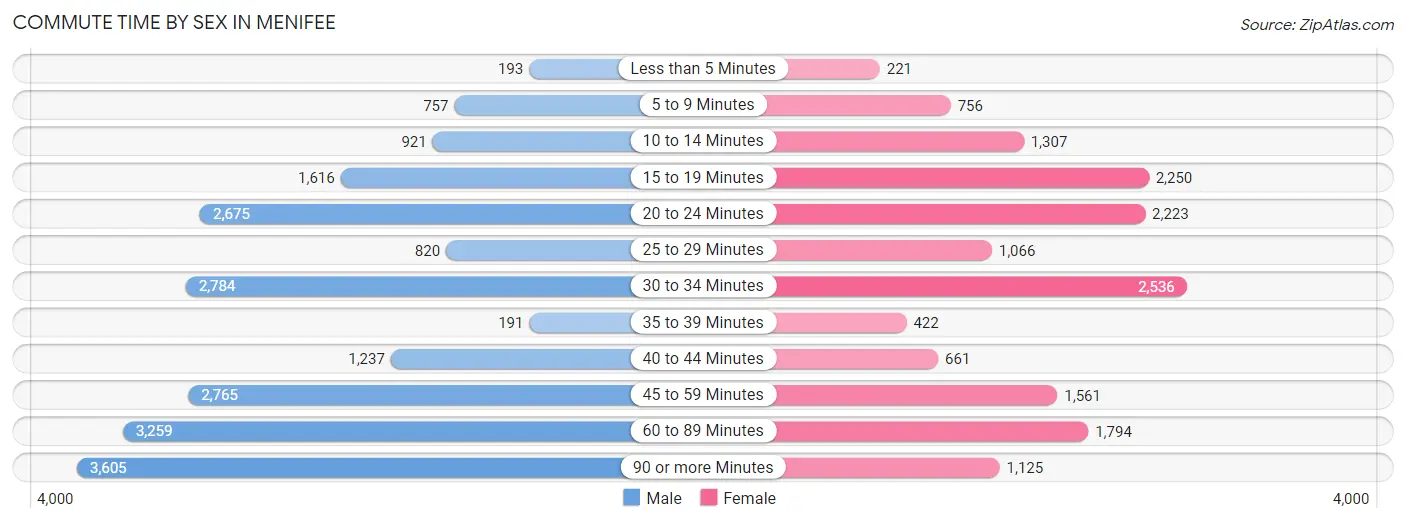
| Commute Time | Male | Female |
| Less than 5 Minutes | 193 (0.9%) | 221 (1.4%) |
| 5 to 9 Minutes | 757 (3.6%) | 756 (4.8%) |
| 10 to 14 Minutes | 921 (4.4%) | 1,307 (8.2%) |
| 15 to 19 Minutes | 1,616 (7.8%) | 2,250 (14.1%) |
| 20 to 24 Minutes | 2,675 (12.9%) | 2,223 (14.0%) |
| 25 to 29 Minutes | 820 (3.9%) | 1,066 (6.7%) |
| 30 to 34 Minutes | 2,784 (13.4%) | 2,536 (15.9%) |
| 35 to 39 Minutes | 191 (0.9%) | 422 (2.6%) |
| 40 to 44 Minutes | 1,237 (5.9%) | 661 (4.2%) |
| 45 to 59 Minutes | 2,765 (13.3%) | 1,561 (9.8%) |
| 60 to 89 Minutes | 3,259 (15.7%) | 1,794 (11.3%) |
| 90 or more Minutes | 3,605 (17.3%) | 1,125 (7.1%) |
Time of Departure to Work by Sex in Menifee
The most frequent times of departure to work in Menifee are 12:00 AM to 4:59 AM (3,939, 18.9%) for males and 7:00 AM to 7:29 AM (2,544, 16.0%) for females.
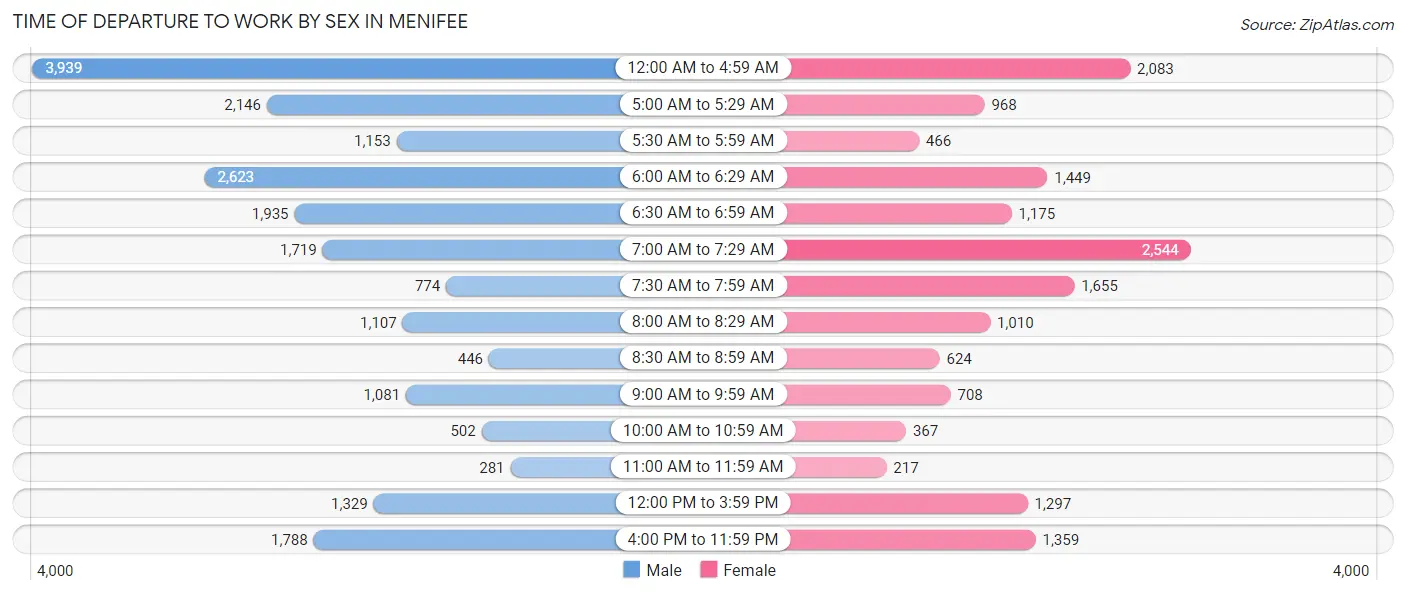
| Time of Departure | Male | Female |
| 12:00 AM to 4:59 AM | 3,939 (18.9%) | 2,083 (13.1%) |
| 5:00 AM to 5:29 AM | 2,146 (10.3%) | 968 (6.1%) |
| 5:30 AM to 5:59 AM | 1,153 (5.5%) | 466 (2.9%) |
| 6:00 AM to 6:29 AM | 2,623 (12.6%) | 1,449 (9.1%) |
| 6:30 AM to 6:59 AM | 1,935 (9.3%) | 1,175 (7.4%) |
| 7:00 AM to 7:29 AM | 1,719 (8.3%) | 2,544 (16.0%) |
| 7:30 AM to 7:59 AM | 774 (3.7%) | 1,655 (10.4%) |
| 8:00 AM to 8:29 AM | 1,107 (5.3%) | 1,010 (6.3%) |
| 8:30 AM to 8:59 AM | 446 (2.1%) | 624 (3.9%) |
| 9:00 AM to 9:59 AM | 1,081 (5.2%) | 708 (4.4%) |
| 10:00 AM to 10:59 AM | 502 (2.4%) | 367 (2.3%) |
| 11:00 AM to 11:59 AM | 281 (1.3%) | 217 (1.4%) |
| 12:00 PM to 3:59 PM | 1,329 (6.4%) | 1,297 (8.2%) |
| 4:00 PM to 11:59 PM | 1,788 (8.6%) | 1,359 (8.5%) |
| Total | 20,823 (100.0%) | 15,922 (100.0%) |
Housing Occupancy in Menifee
Occupancy by Ownership in Menifee
Of the total 33,008 dwellings in Menifee, owner-occupied units account for 26,575 (80.5%), while renter-occupied units make up 6,433 (19.5%).
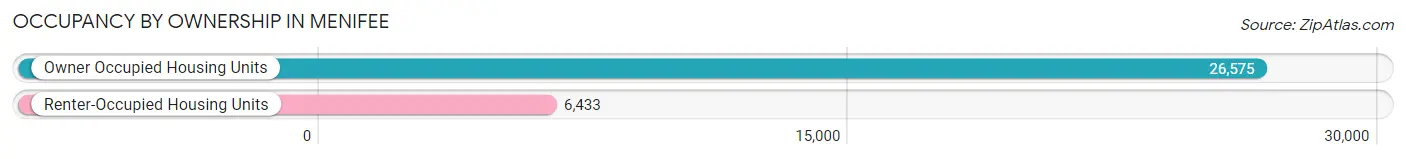
| Occupancy | # Housing Units | % Housing Units |
| Owner Occupied Housing Units | 26,575 | 80.5% |
| Renter-Occupied Housing Units | 6,433 | 19.5% |
| Total Occupied Housing Units | 33,008 | 100.0% |
Occupancy by Household Size in Menifee
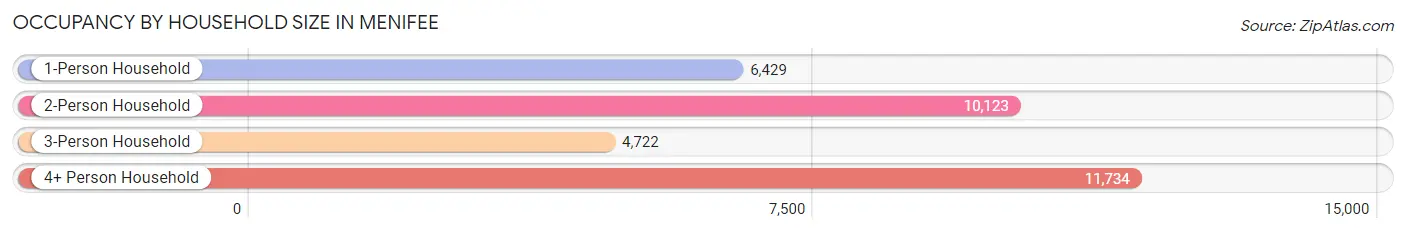
| Household Size | # Housing Units | % Housing Units |
| 1-Person Household | 6,429 | 19.5% |
| 2-Person Household | 10,123 | 30.7% |
| 3-Person Household | 4,722 | 14.3% |
| 4+ Person Household | 11,734 | 35.5% |
| Total Housing Units | 33,008 | 100.0% |
Occupancy by Ownership by Household Size in Menifee

| Household Size | Owner-occupied | Renter-occupied |
| 1-Person Household | 4,828 (75.1%) | 1,601 (24.9%) |
| 2-Person Household | 8,687 (85.8%) | 1,436 (14.2%) |
| 3-Person Household | 3,635 (77.0%) | 1,087 (23.0%) |
| 4+ Person Household | 9,425 (80.3%) | 2,309 (19.7%) |
| Total Housing Units | 26,575 (80.5%) | 6,433 (19.5%) |
Occupancy by Educational Attainment in Menifee
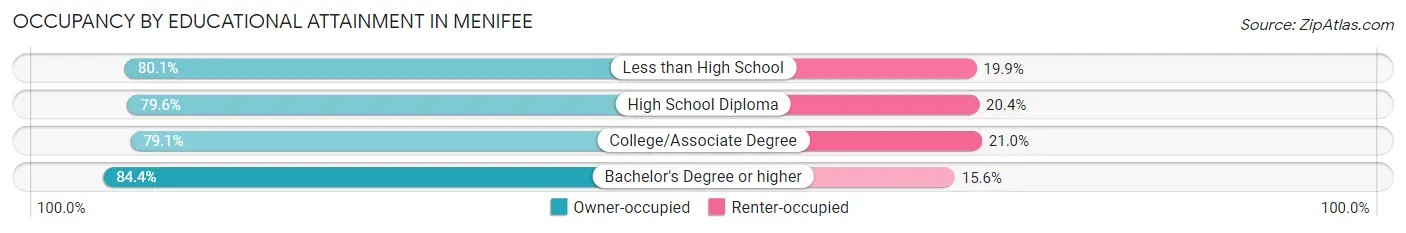
| Household Size | Owner-occupied | Renter-occupied |
| Less than High School | 2,637 (80.1%) | 655 (19.9%) |
| High School Diploma | 6,231 (79.6%) | 1,599 (20.4%) |
| College/Associate Degree | 11,308 (79.0%) | 2,997 (20.9%) |
| Bachelor's Degree or higher | 6,399 (84.4%) | 1,182 (15.6%) |
Occupancy by Age of Householder in Menifee
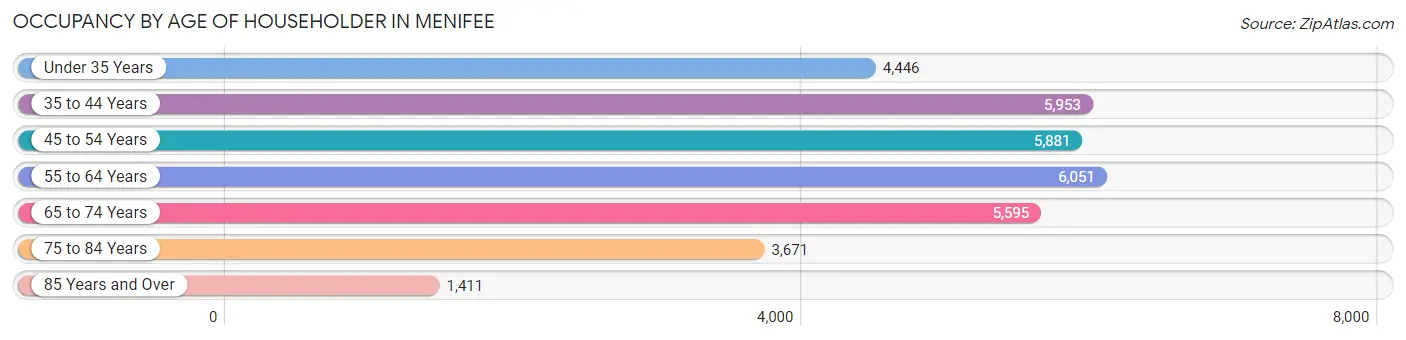
| Age Bracket | # Households | % Households |
| Under 35 Years | 4,446 | 13.5% |
| 35 to 44 Years | 5,953 | 18.0% |
| 45 to 54 Years | 5,881 | 17.8% |
| 55 to 64 Years | 6,051 | 18.3% |
| 65 to 74 Years | 5,595 | 17.0% |
| 75 to 84 Years | 3,671 | 11.1% |
| 85 Years and Over | 1,411 | 4.3% |
| Total | 33,008 | 100.0% |
Housing Finances in Menifee
Median Income by Occupancy in Menifee
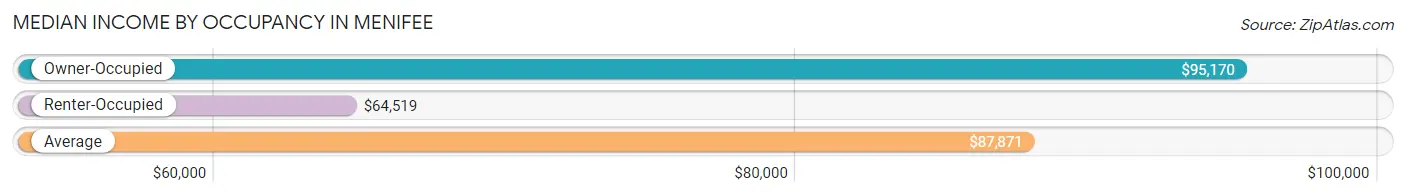
| Occupancy Type | # Households | Median Income |
| Owner-Occupied | 26,575 (80.5%) | $95,170 |
| Renter-Occupied | 6,433 (19.5%) | $64,519 |
| Average | 33,008 (100.0%) | $87,871 |
Occupancy by Householder Income Bracket in Menifee
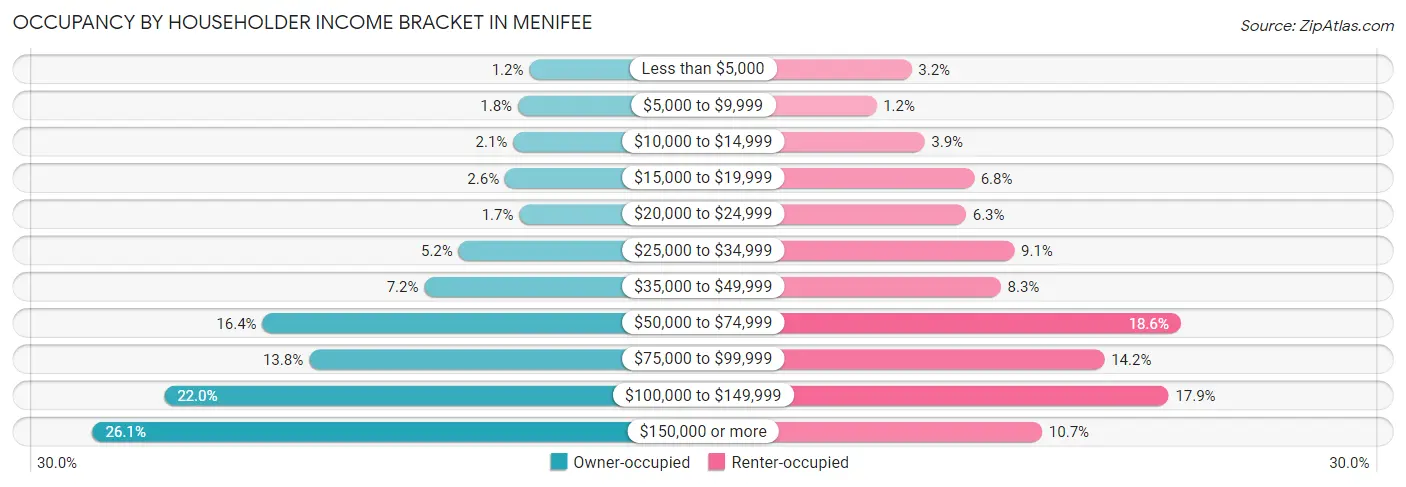
| Income Bracket | Owner-occupied | Renter-occupied |
| Less than $5,000 | 308 (1.2%) | 205 (3.2%) |
| $5,000 to $9,999 | 481 (1.8%) | 76 (1.2%) |
| $10,000 to $14,999 | 553 (2.1%) | 253 (3.9%) |
| $15,000 to $19,999 | 677 (2.5%) | 434 (6.8%) |
| $20,000 to $24,999 | 460 (1.7%) | 405 (6.3%) |
| $25,000 to $34,999 | 1,382 (5.2%) | 583 (9.1%) |
| $35,000 to $49,999 | 1,904 (7.2%) | 533 (8.3%) |
| $50,000 to $74,999 | 4,362 (16.4%) | 1,195 (18.6%) |
| $75,000 to $99,999 | 3,655 (13.8%) | 914 (14.2%) |
| $100,000 to $149,999 | 5,851 (22.0%) | 1,150 (17.9%) |
| $150,000 or more | 6,942 (26.1%) | 685 (10.6%) |
| Total | 26,575 (100.0%) | 6,433 (100.0%) |
Monthly Housing Cost Tiers in Menifee
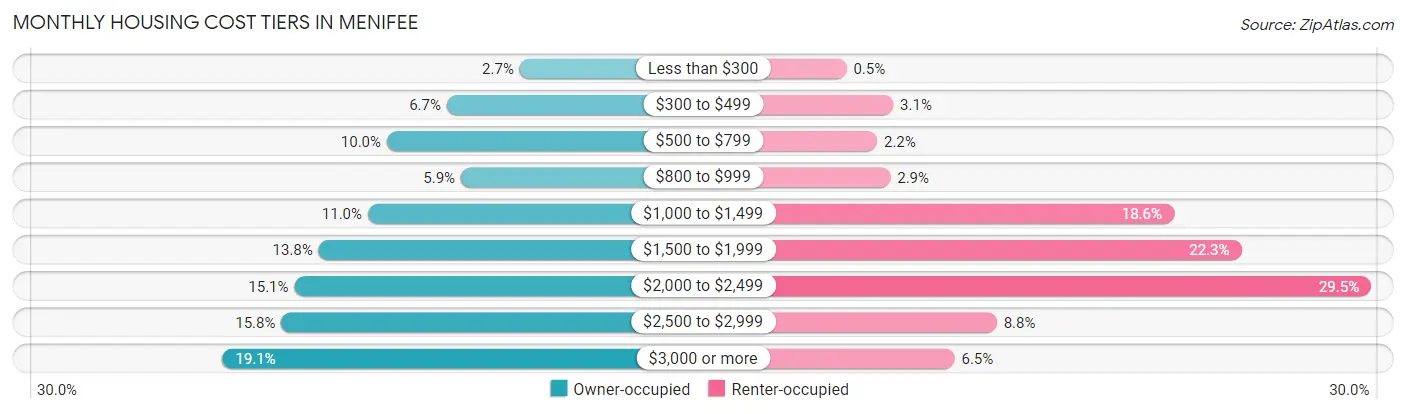
| Monthly Cost | Owner-occupied | Renter-occupied |
| Less than $300 | 704 (2.6%) | 32 (0.5%) |
| $300 to $499 | 1,774 (6.7%) | 198 (3.1%) |
| $500 to $799 | 2,655 (10.0%) | 141 (2.2%) |
| $800 to $999 | 1,567 (5.9%) | 188 (2.9%) |
| $1,000 to $1,499 | 2,934 (11.0%) | 1,195 (18.6%) |
| $1,500 to $1,999 | 3,656 (13.8%) | 1,435 (22.3%) |
| $2,000 to $2,499 | 4,014 (15.1%) | 1,896 (29.5%) |
| $2,500 to $2,999 | 4,204 (15.8%) | 566 (8.8%) |
| $3,000 or more | 5,067 (19.1%) | 416 (6.5%) |
| Total | 26,575 (100.0%) | 6,433 (100.0%) |
Physical Housing Characteristics in Menifee
Housing Structures in Menifee
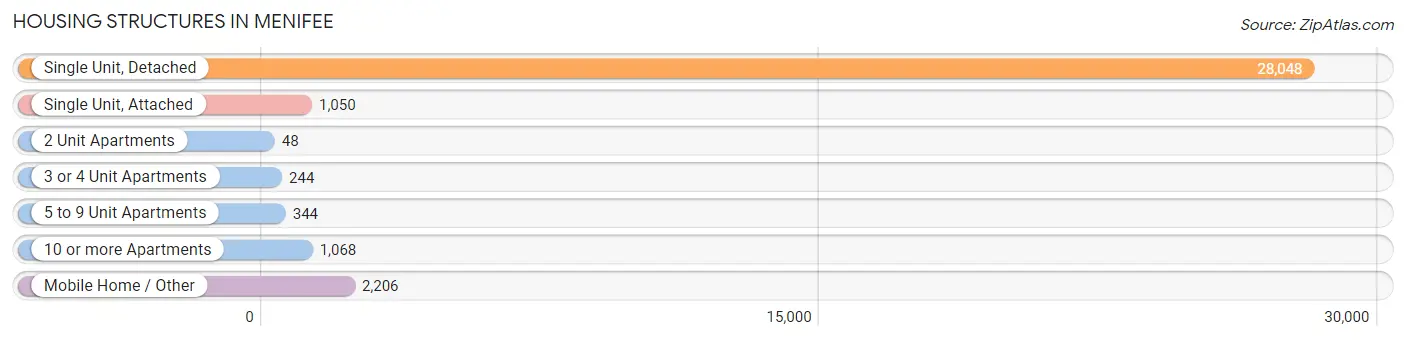
| Structure Type | # Housing Units | % Housing Units |
| Single Unit, Detached | 28,048 | 85.0% |
| Single Unit, Attached | 1,050 | 3.2% |
| 2 Unit Apartments | 48 | 0.2% |
| 3 or 4 Unit Apartments | 244 | 0.7% |
| 5 to 9 Unit Apartments | 344 | 1.0% |
| 10 or more Apartments | 1,068 | 3.2% |
| Mobile Home / Other | 2,206 | 6.7% |
| Total | 33,008 | 100.0% |
Housing Structures by Occupancy in Menifee
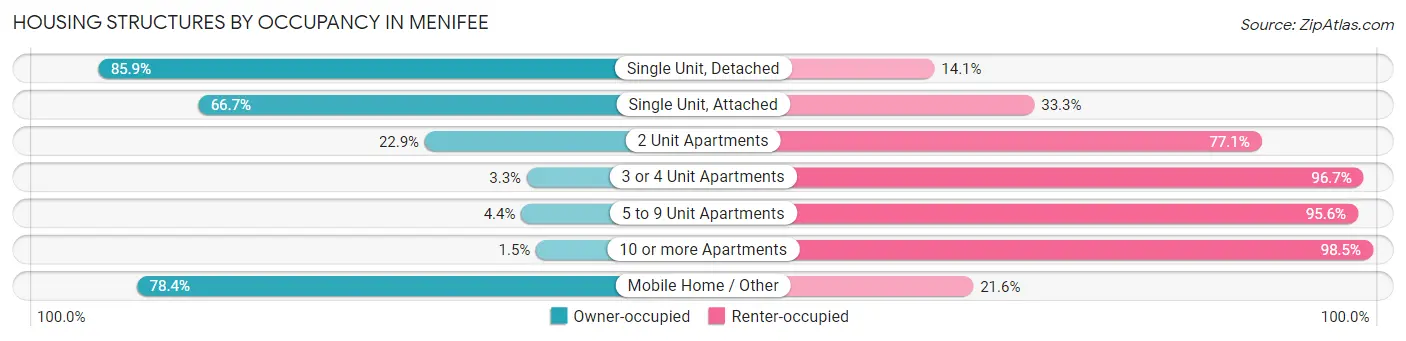
| Structure Type | Owner-occupied | Renter-occupied |
| Single Unit, Detached | 24,095 (85.9%) | 3,953 (14.1%) |
| Single Unit, Attached | 700 (66.7%) | 350 (33.3%) |
| 2 Unit Apartments | 11 (22.9%) | 37 (77.1%) |
| 3 or 4 Unit Apartments | 8 (3.3%) | 236 (96.7%) |
| 5 to 9 Unit Apartments | 15 (4.4%) | 329 (95.6%) |
| 10 or more Apartments | 16 (1.5%) | 1,052 (98.5%) |
| Mobile Home / Other | 1,730 (78.4%) | 476 (21.6%) |
| Total | 26,575 (80.5%) | 6,433 (19.5%) |
Housing Structures by Number of Rooms in Menifee
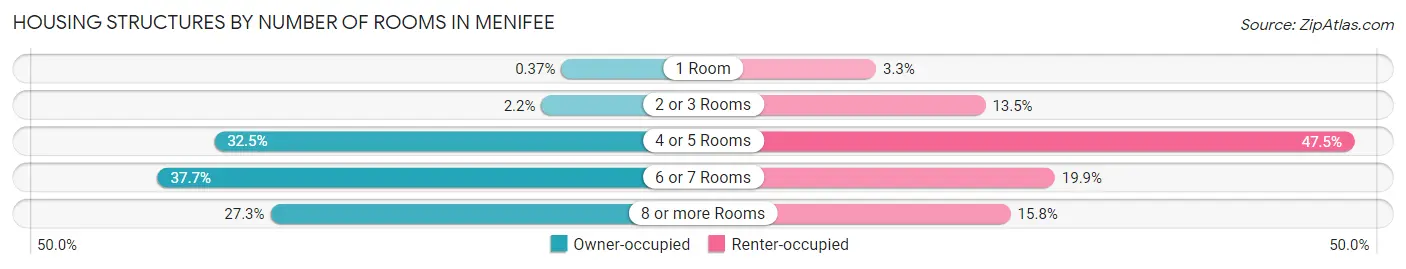
| Number of Rooms | Owner-occupied | Renter-occupied |
| 1 Room | 99 (0.4%) | 215 (3.3%) |
| 2 or 3 Rooms | 588 (2.2%) | 866 (13.5%) |
| 4 or 5 Rooms | 8,627 (32.5%) | 3,057 (47.5%) |
| 6 or 7 Rooms | 10,015 (37.7%) | 1,279 (19.9%) |
| 8 or more Rooms | 7,246 (27.3%) | 1,016 (15.8%) |
| Total | 26,575 (100.0%) | 6,433 (100.0%) |
Housing Structure by Heating Type in Menifee
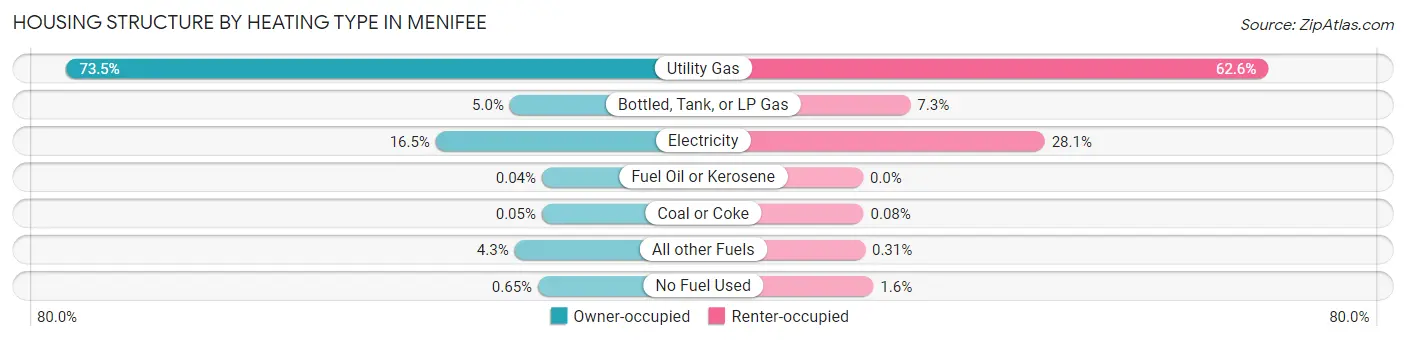
| Heating Type | Owner-occupied | Renter-occupied |
| Utility Gas | 19,543 (73.5%) | 4,027 (62.6%) |
| Bottled, Tank, or LP Gas | 1,330 (5.0%) | 471 (7.3%) |
| Electricity | 4,372 (16.5%) | 1,807 (28.1%) |
| Fuel Oil or Kerosene | 10 (0.0%) | 0 (0.0%) |
| Coal or Coke | 12 (0.1%) | 5 (0.1%) |
| All other Fuels | 1,136 (4.3%) | 20 (0.3%) |
| No Fuel Used | 172 (0.6%) | 103 (1.6%) |
| Total | 26,575 (100.0%) | 6,433 (100.0%) |
Household Vehicle Usage in Menifee
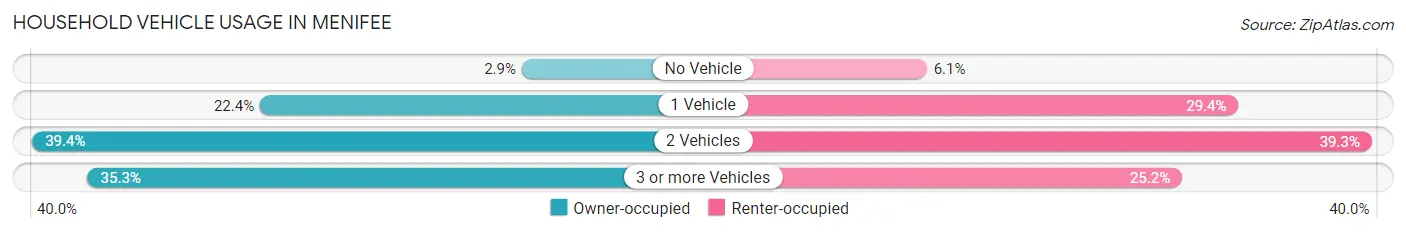
| Vehicles per Household | Owner-occupied | Renter-occupied |
| No Vehicle | 763 (2.9%) | 393 (6.1%) |
| 1 Vehicle | 5,957 (22.4%) | 1,890 (29.4%) |
| 2 Vehicles | 10,478 (39.4%) | 2,531 (39.3%) |
| 3 or more Vehicles | 9,377 (35.3%) | 1,619 (25.2%) |
| Total | 26,575 (100.0%) | 6,433 (100.0%) |
Real Estate & Mortgages in Menifee
Real Estate and Mortgage Overview in Menifee
| Characteristic | Without Mortgage | With Mortgage |
| Housing Units | 6,455 | 20,120 |
| Median Property Value | $378,500 | $455,900 |
| Median Household Income | $59,196 | $5,782 |
| Monthly Housing Costs | $588 | $5,067 |
| Real Estate Taxes | $2,755 | $296 |
Property Value by Mortgage Status in Menifee
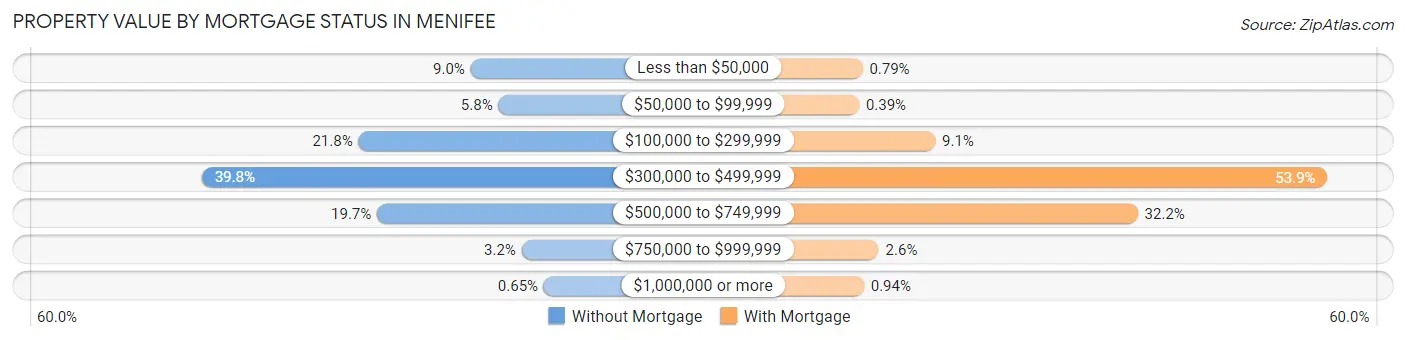
| Property Value | Without Mortgage | With Mortgage |
| Less than $50,000 | 582 (9.0%) | 158 (0.8%) |
| $50,000 to $99,999 | 377 (5.8%) | 78 (0.4%) |
| $100,000 to $299,999 | 1,410 (21.8%) | 1,828 (9.1%) |
| $300,000 to $499,999 | 2,566 (39.8%) | 10,849 (53.9%) |
| $500,000 to $749,999 | 1,272 (19.7%) | 6,486 (32.2%) |
| $750,000 to $999,999 | 206 (3.2%) | 532 (2.6%) |
| $1,000,000 or more | 42 (0.6%) | 189 (0.9%) |
| Total | 6,455 (100.0%) | 20,120 (100.0%) |
Household Income by Mortgage Status in Menifee
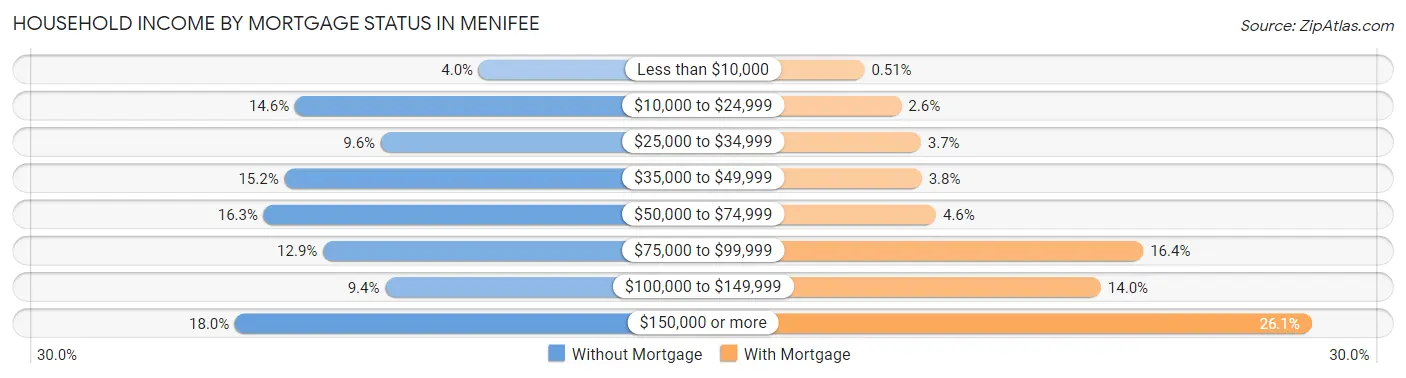
| Household Income | Without Mortgage | With Mortgage |
| Less than $10,000 | 261 (4.0%) | 103 (0.5%) |
| $10,000 to $24,999 | 939 (14.5%) | 528 (2.6%) |
| $25,000 to $34,999 | 622 (9.6%) | 751 (3.7%) |
| $35,000 to $49,999 | 978 (15.1%) | 760 (3.8%) |
| $50,000 to $74,999 | 1,054 (16.3%) | 926 (4.6%) |
| $75,000 to $99,999 | 835 (12.9%) | 3,308 (16.4%) |
| $100,000 to $149,999 | 606 (9.4%) | 2,820 (14.0%) |
| $150,000 or more | 1,160 (18.0%) | 5,245 (26.1%) |
| Total | 6,455 (100.0%) | 20,120 (100.0%) |
Property Value to Household Income Ratio in Menifee
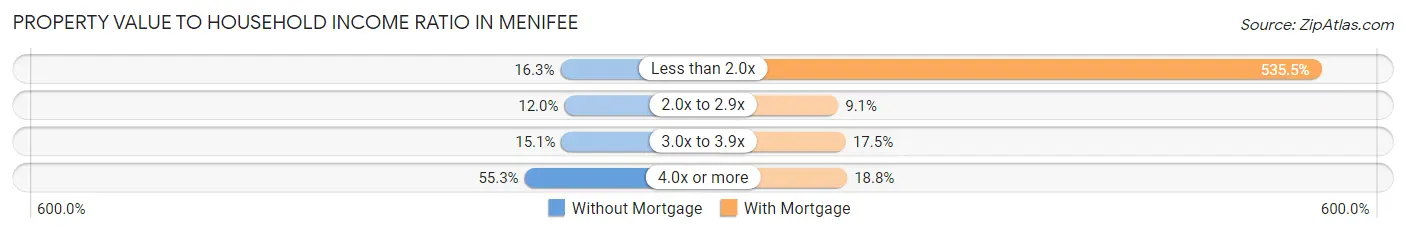
| Value-to-Income Ratio | Without Mortgage | With Mortgage |
| Less than 2.0x | 1,055 (16.3%) | 107,750 (535.5%) |
| 2.0x to 2.9x | 772 (12.0%) | 1,835 (9.1%) |
| 3.0x to 3.9x | 977 (15.1%) | 3,521 (17.5%) |
| 4.0x or more | 3,572 (55.3%) | 3,787 (18.8%) |
| Total | 6,455 (100.0%) | 20,120 (100.0%) |
Real Estate Taxes by Mortgage Status in Menifee
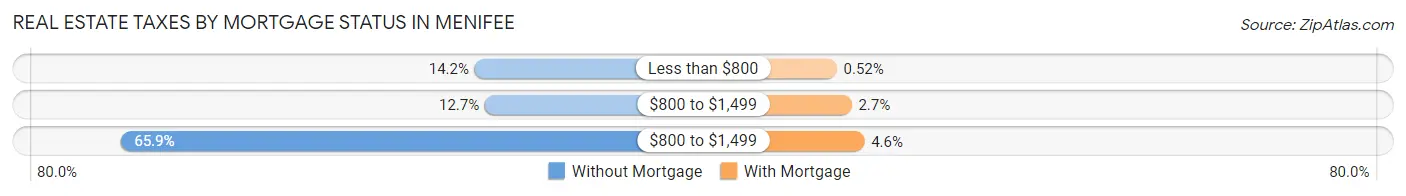
| Property Taxes | Without Mortgage | With Mortgage |
| Less than $800 | 918 (14.2%) | 105 (0.5%) |
| $800 to $1,499 | 821 (12.7%) | 542 (2.7%) |
| $800 to $1,499 | 4,251 (65.9%) | 915 (4.5%) |
| Total | 6,455 (100.0%) | 20,120 (100.0%) |
Health & Disability in Menifee
Health Insurance Coverage by Age in Menifee
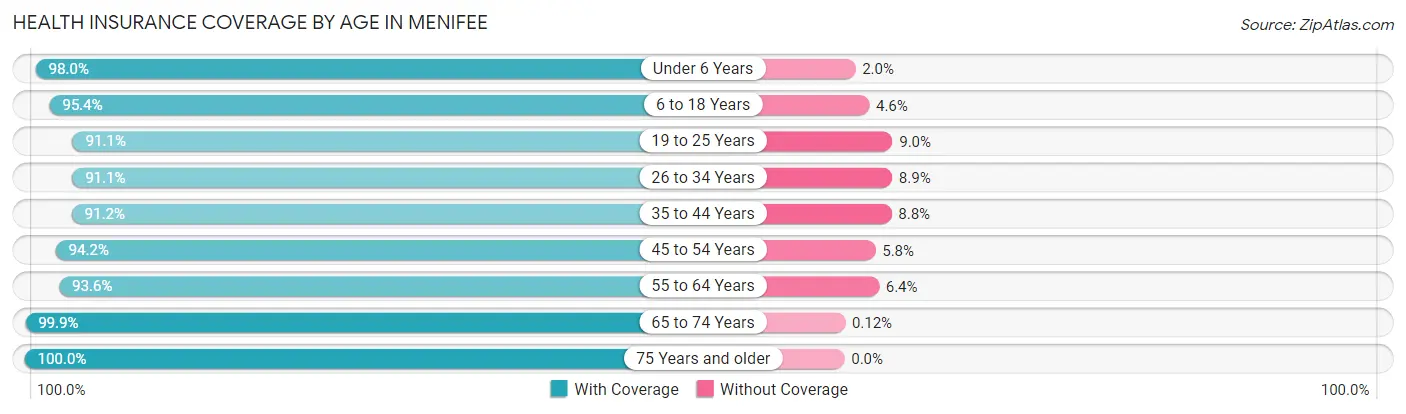
| Age Bracket | With Coverage | Without Coverage |
| Under 6 Years | 8,492 (98.0%) | 177 (2.0%) |
| 6 to 18 Years | 17,965 (95.4%) | 869 (4.6%) |
| 19 to 25 Years | 6,947 (91.0%) | 683 (8.9%) |
| 26 to 34 Years | 12,198 (91.1%) | 1,189 (8.9%) |
| 35 to 44 Years | 11,903 (91.2%) | 1,146 (8.8%) |
| 45 to 54 Years | 10,695 (94.2%) | 656 (5.8%) |
| 55 to 64 Years | 11,650 (93.6%) | 801 (6.4%) |
| 65 to 74 Years | 9,388 (99.9%) | 11 (0.1%) |
| 75 Years and older | 8,307 (100.0%) | 0 (0.0%) |
| Total | 97,545 (94.6%) | 5,532 (5.4%) |
Health Insurance Coverage by Citizenship Status in Menifee
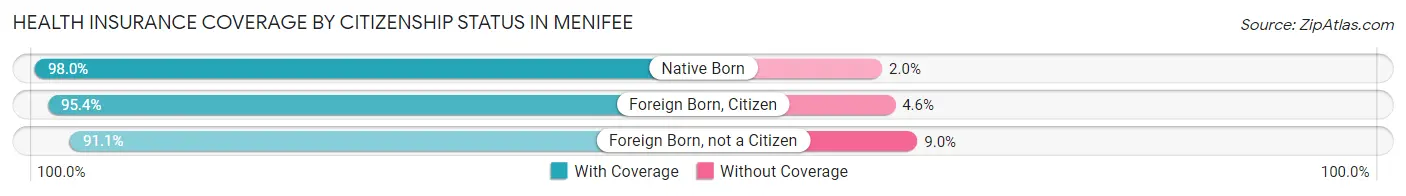
| Citizenship Status | With Coverage | Without Coverage |
| Native Born | 8,492 (98.0%) | 177 (2.0%) |
| Foreign Born, Citizen | 17,965 (95.4%) | 869 (4.6%) |
| Foreign Born, not a Citizen | 6,947 (91.0%) | 683 (8.9%) |
Health Insurance Coverage by Household Income in Menifee
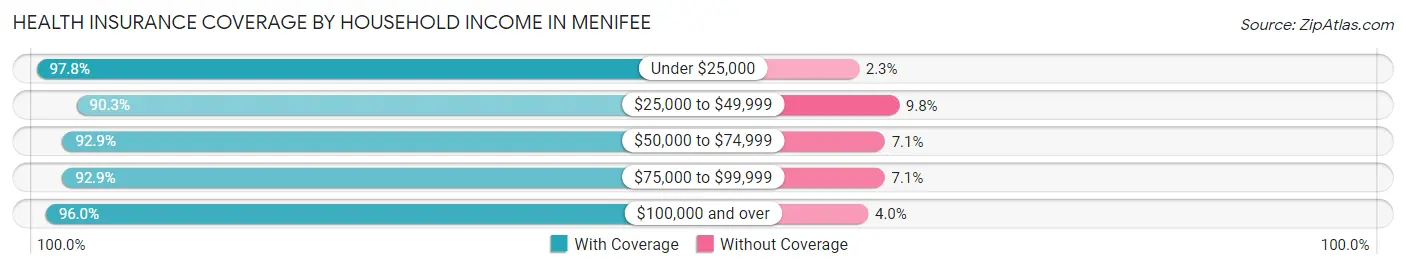
| Household Income | With Coverage | Without Coverage |
| Under $25,000 | 6,697 (97.8%) | 154 (2.2%) |
| $25,000 to $49,999 | 8,730 (90.2%) | 943 (9.8%) |
| $50,000 to $74,999 | 16,272 (92.9%) | 1,246 (7.1%) |
| $75,000 to $99,999 | 13,102 (92.9%) | 997 (7.1%) |
| $100,000 and over | 52,626 (96.0%) | 2,180 (4.0%) |
Public vs Private Health Insurance Coverage by Age in Menifee
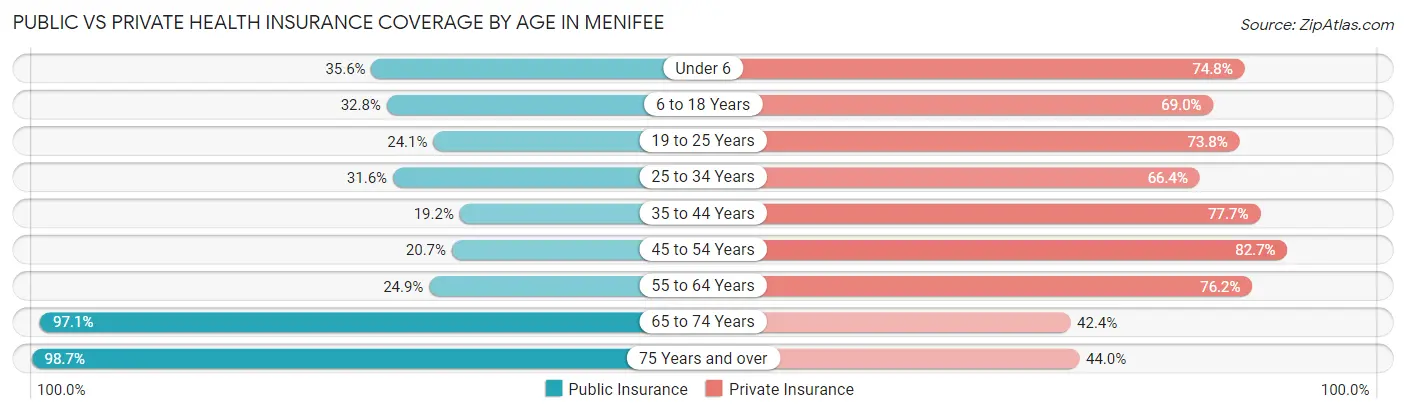
| Age Bracket | Public Insurance | Private Insurance |
| Under 6 | 3,088 (35.6%) | 6,481 (74.8%) |
| 6 to 18 Years | 6,176 (32.8%) | 12,990 (69.0%) |
| 19 to 25 Years | 1,842 (24.1%) | 5,633 (73.8%) |
| 25 to 34 Years | 4,236 (31.6%) | 8,893 (66.4%) |
| 35 to 44 Years | 2,509 (19.2%) | 10,134 (77.7%) |
| 45 to 54 Years | 2,349 (20.7%) | 9,388 (82.7%) |
| 55 to 64 Years | 3,100 (24.9%) | 9,487 (76.2%) |
| 65 to 74 Years | 9,128 (97.1%) | 3,983 (42.4%) |
| 75 Years and over | 8,200 (98.7%) | 3,658 (44.0%) |
| Total | 40,628 (39.4%) | 70,647 (68.5%) |
Disability Status by Sex by Age in Menifee
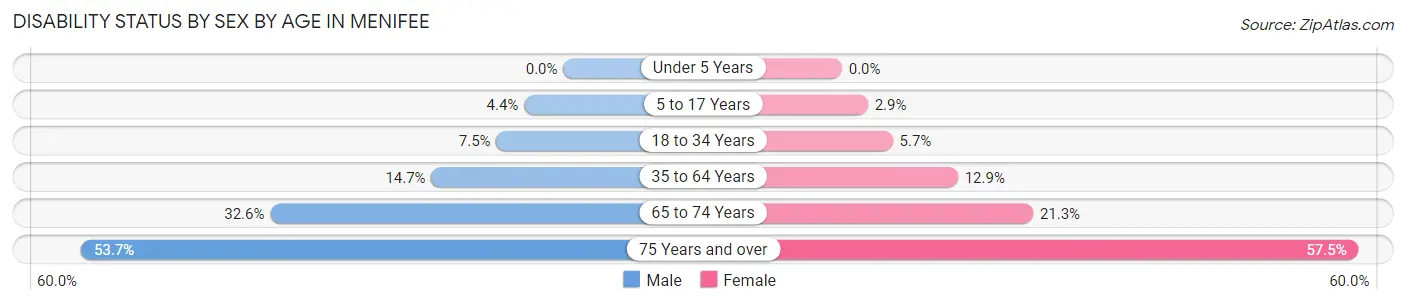
| Age Bracket | Male | Female |
| Under 5 Years | 0 (0.0%) | 0 (0.0%) |
| 5 to 17 Years | 456 (4.4%) | 271 (2.9%) |
| 18 to 34 Years | 853 (7.4%) | 588 (5.7%) |
| 35 to 64 Years | 2,515 (14.7%) | 2,548 (12.9%) |
| 65 to 74 Years | 1,486 (32.6%) | 1,032 (21.3%) |
| 75 Years and over | 1,913 (53.7%) | 2,731 (57.5%) |
Disability Class by Sex by Age in Menifee
Disability Class: Hearing Difficulty
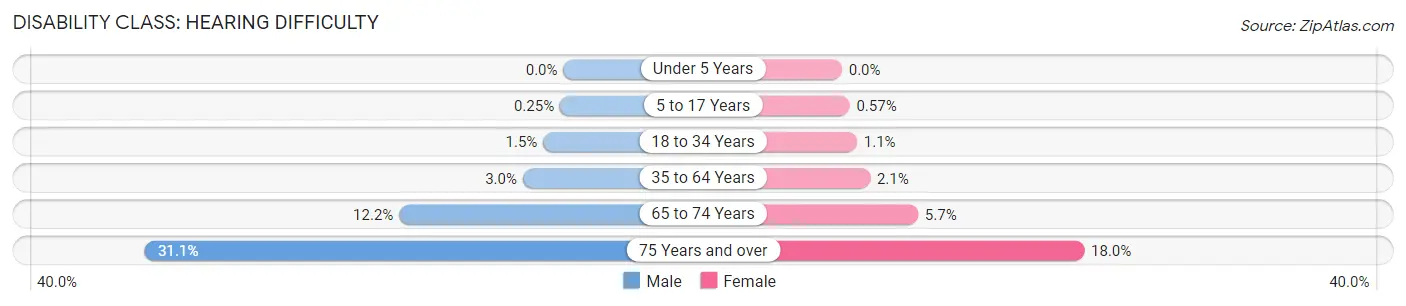
| Age Bracket | Male | Female |
| Under 5 Years | 0 (0.0%) | 0 (0.0%) |
| 5 to 17 Years | 26 (0.3%) | 53 (0.6%) |
| 18 to 34 Years | 172 (1.5%) | 116 (1.1%) |
| 35 to 64 Years | 515 (3.0%) | 413 (2.1%) |
| 65 to 74 Years | 555 (12.2%) | 274 (5.7%) |
| 75 Years and over | 1,106 (31.1%) | 854 (18.0%) |
Disability Class: Vision Difficulty
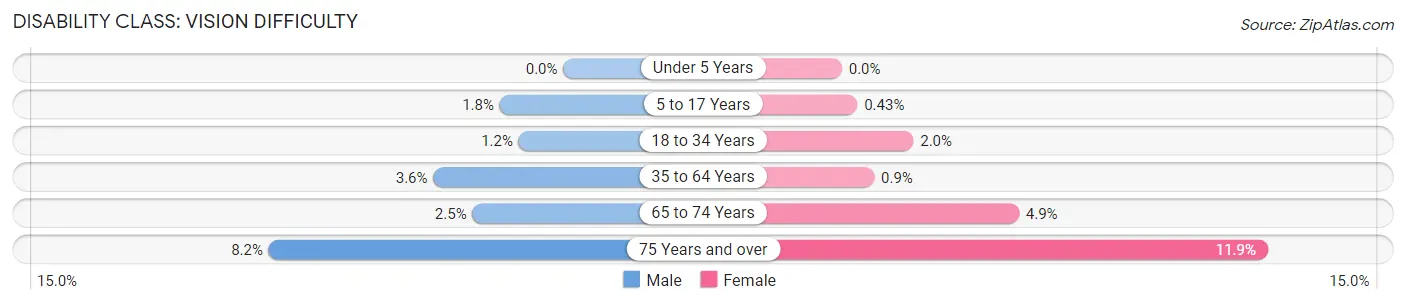
| Age Bracket | Male | Female |
| Under 5 Years | 0 (0.0%) | 0 (0.0%) |
| 5 to 17 Years | 185 (1.8%) | 40 (0.4%) |
| 18 to 34 Years | 142 (1.2%) | 207 (2.0%) |
| 35 to 64 Years | 619 (3.6%) | 177 (0.9%) |
| 65 to 74 Years | 115 (2.5%) | 239 (4.9%) |
| 75 Years and over | 292 (8.2%) | 563 (11.9%) |
Disability Class: Cognitive Difficulty
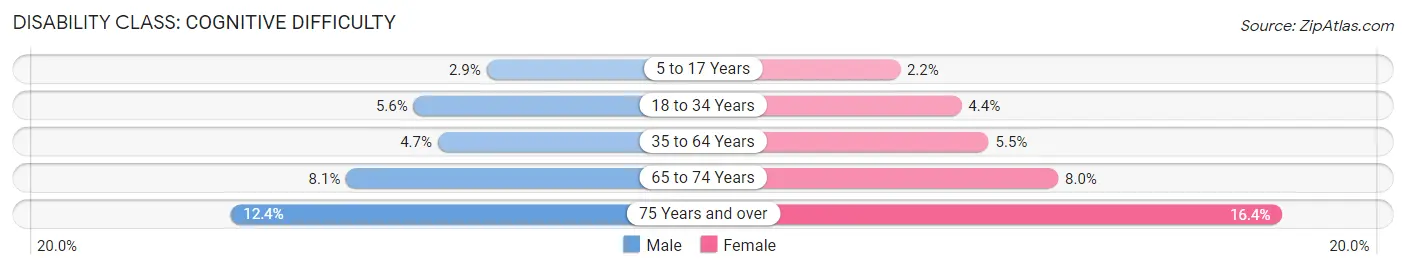
| Age Bracket | Male | Female |
| 5 to 17 Years | 298 (2.9%) | 202 (2.2%) |
| 18 to 34 Years | 637 (5.6%) | 461 (4.4%) |
| 35 to 64 Years | 798 (4.7%) | 1,075 (5.4%) |
| 65 to 74 Years | 367 (8.1%) | 389 (8.0%) |
| 75 Years and over | 440 (12.4%) | 776 (16.4%) |
Disability Class: Ambulatory Difficulty
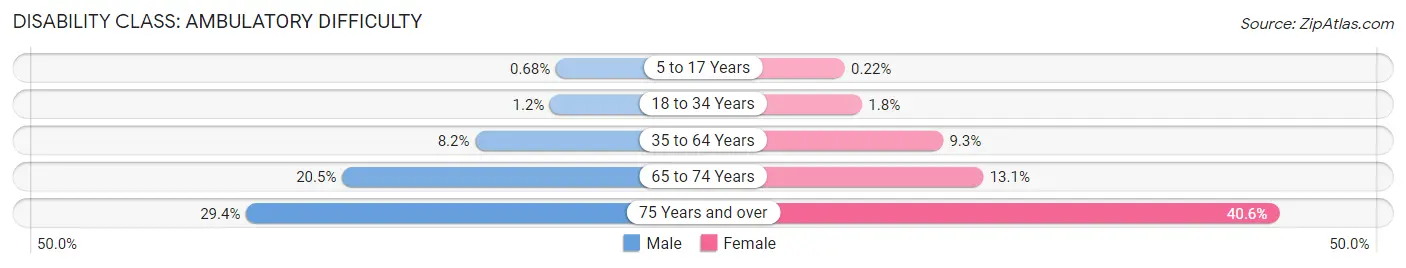
| Age Bracket | Male | Female |
| 5 to 17 Years | 71 (0.7%) | 21 (0.2%) |
| 18 to 34 Years | 140 (1.2%) | 189 (1.8%) |
| 35 to 64 Years | 1,398 (8.2%) | 1,842 (9.3%) |
| 65 to 74 Years | 934 (20.5%) | 634 (13.1%) |
| 75 Years and over | 1,048 (29.4%) | 1,926 (40.6%) |
Disability Class: Self-Care Difficulty
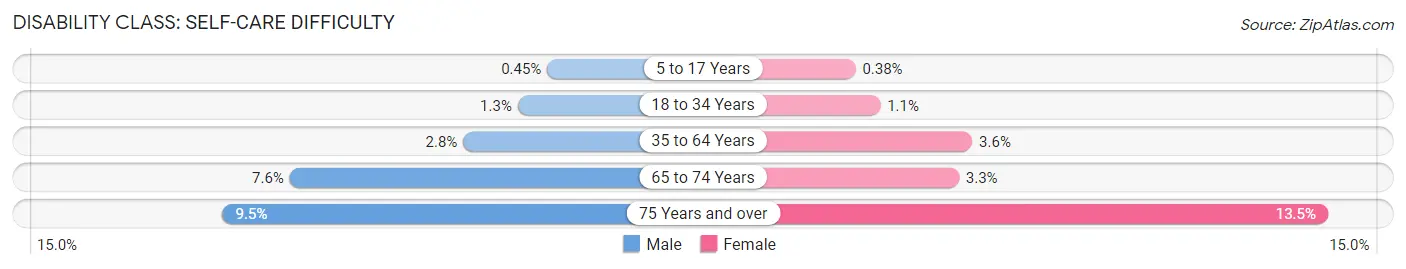
| Age Bracket | Male | Female |
| 5 to 17 Years | 47 (0.4%) | 36 (0.4%) |
| 18 to 34 Years | 145 (1.3%) | 111 (1.1%) |
| 35 to 64 Years | 477 (2.8%) | 717 (3.6%) |
| 65 to 74 Years | 347 (7.6%) | 158 (3.3%) |
| 75 Years and over | 338 (9.5%) | 642 (13.5%) |
Technology Access in Menifee
Computing Device Access in Menifee
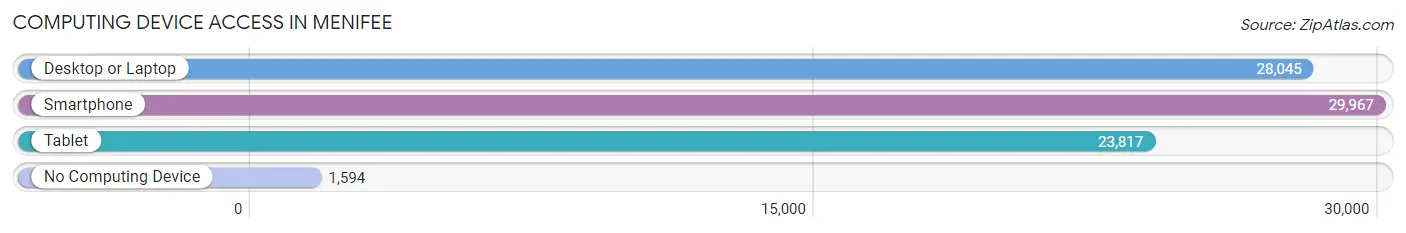
| Device Type | # Households | % Households |
| Desktop or Laptop | 28,045 | 85.0% |
| Smartphone | 29,967 | 90.8% |
| Tablet | 23,817 | 72.2% |
| No Computing Device | 1,594 | 4.8% |
| Total | 33,008 | 100.0% |
Internet Access in Menifee
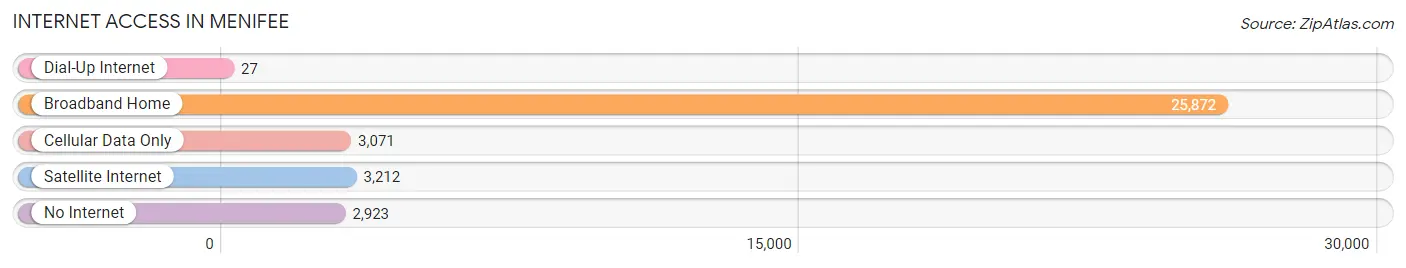
| Internet Type | # Households | % Households |
| Dial-Up Internet | 27 | 0.1% |
| Broadband Home | 25,872 | 78.4% |
| Cellular Data Only | 3,071 | 9.3% |
| Satellite Internet | 3,212 | 9.7% |
| No Internet | 2,923 | 8.9% |
| Total | 33,008 | 100.0% |
Menifee Summary
Menifee, California is a city located in Riverside County, California, United States. The city is situated in the foothills of the Santa Rosa Mountains, and is part of the Inland Empire metropolitan area. As of the 2010 census, the city had a population of 77,519, up from 58,777 at the 2000 census.
History
The area that is now Menifee was originally inhabited by the Luiseño people, who were part of the larger Takic group of the Uto-Aztecan language family. The area was part of the Rancho San Jacinto y San Gorgonio land grant, which was granted to Juan Jose and Ysidro Machado in 1842. The area was later settled by farmers and ranchers in the late 19th century.
In the 1960s, the area began to experience rapid growth due to the development of the nearby cities of Murrieta and Temecula. In 1989, the community of Menifee was incorporated as a city. The city was named after the Menifee Valley, which was named after the daughter of an early settler, Manifee.
Geography
Menifee is located in southwestern Riverside County, in the foothills of the Santa Rosa Mountains. It is bordered to the north by the city of Murrieta, to the east by the city of Temecula, to the south by the city of Perris, and to the west by the city of Lake Elsinore.
The city has a total area of 33.3 square miles, of which 33.2 square miles is land and 0.1 square miles (0.3%) is water.
Economy
Menifee is home to a variety of businesses, including retail stores, restaurants, and professional services. The city is also home to several industrial parks, which provide employment opportunities for local residents.
The city is served by two major highways, Interstate 215 and State Route 74. The city is also served by the Menifee Valley Airport, which is located in the city limits.
Demographics
As of the 2010 census, there were 77,519 people, 25,845 households, and 19,945 families residing in the city. The population density was 2,326.2 people per square mile. The racial makeup of the city was 68.2% White, 5.3% African American, 0.7% Native American, 1.7% Asian, 0.2% Pacific Islander, 19.2% from other races, and 4.7% from two or more races. Hispanic or Latino of any race were 33.2% of the population.
The median income for a household in the city was $60,945, and the median income for a family was $68,945. The per capita income for the city was $25,945. About 8.2% of families and 10.3% of the population were below the poverty line, including 14.2% of those under age 18 and 6.2% of those age 65 or over.
Common Questions
What is Per Capita Income in Menifee?
Per Capita income in Menifee is $35,682.
What is the Median Family Income in Menifee?
Median Family Income in Menifee is $101,283.
What is the Median Household income in Menifee?
Median Household Income in Menifee is $87,871.
What is Income or Wage Gap in Menifee?
Income or Wage Gap in Menifee is 34.6%.
Women in Menifee earn 65.4 cents for every dollar earned by a man.
What is Family Income Deficit in Menifee?
Family Income Deficit in Menifee is $11,234.
Families that are below poverty line in Menifee earn $11,234 less on average than the poverty threshold level.
What is Inequality or Gini Index in Menifee?
Inequality or Gini Index in Menifee is 0.41.
What is the Total Population of Menifee?
Total Population of Menifee is 103,680.
What is the Total Male Population of Menifee?
Total Male Population of Menifee is 51,361.
What is the Total Female Population of Menifee?
Total Female Population of Menifee is 52,319.
What is the Ratio of Males per 100 Females in Menifee?
There are 98.17 Males per 100 Females in Menifee.
What is the Ratio of Females per 100 Males in Menifee?
There are 101.87 Females per 100 Males in Menifee.
What is the Median Population Age in Menifee?
Median Population Age in Menifee is 37.3 Years.
What is the Average Family Size in Menifee
Average Family Size in Menifee is 3.6 People.
What is the Average Household Size in Menifee
Average Household Size in Menifee is 3.1 People.
How Large is the Labor Force in Menifee?
There are 46,071 People in the Labor Forcein in Menifee.
What is the Percentage of People in the Labor Force in Menifee?
57.6% of People are in the Labor Force in Menifee.
What is the Unemployment Rate in Menifee?
Unemployment Rate in Menifee is 7.1%.