Brentwood, CA Map & Demographics
Brentwood Map
Brentwood Overview
$53,655
PER CAPITA INCOME
$146,386
AVG FAMILY INCOME
$134,689
AVG HOUSEHOLD INCOME
39.5%
WAGE / INCOME GAP [ % ]
60.5¢/ $1
WAGE / INCOME GAP [ $ ]
0.41
INEQUALITY / GINI INDEX
64,443
TOTAL POPULATION
31,028
MALE POPULATION
33,415
FEMALE POPULATION
92.86
MALES / 100 FEMALES
107.69
FEMALES / 100 MALES
40.7
MEDIAN AGE
3.4
AVG FAMILY SIZE
3.1
AVG HOUSEHOLD SIZE
31,743
LABOR FORCE [ PEOPLE ]
63.0%
PERCENT IN LABOR FORCE
6.0%
UNEMPLOYMENT RATE
Brentwood Zip Codes
Brentwood Area Codes
Income in Brentwood
Income Overview in Brentwood
Per Capita Income in Brentwood is $53,655, while median incomes of families and households are $146,386 and $134,689 respectively.
| Characteristic | Number | Measure |
| Per Capita Income | 64,443 | $53,655 |
| Median Family Income | 16,873 | $146,386 |
| Mean Family Income | 16,873 | $174,071 |
| Median Household Income | 20,840 | $134,689 |
| Mean Household Income | 20,840 | $163,304 |
| Income Deficit | 16,873 | $0 |
| Wage / Income Gap (%) | 64,443 | 39.53% |
| Wage / Income Gap ($) | 64,443 | 60.47¢ per $1 |
| Gini / Inequality Index | 64,443 | 0.41 |
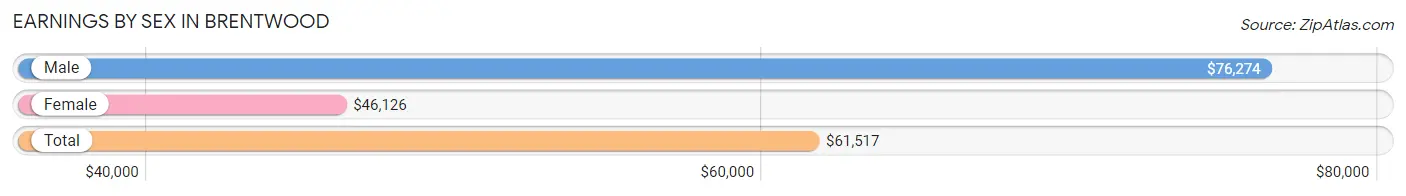
Earnings by Sex in Brentwood
Average Earnings in Brentwood are $61,517, $76,274 for men and $46,126 for women, a difference of 39.5%.
| Sex | Number | Average Earnings |
| Male | 17,423 (52.9%) | $76,274 |
| Female | 15,523 (47.1%) | $46,126 |
| Total | 32,946 (100.0%) | $61,517 |
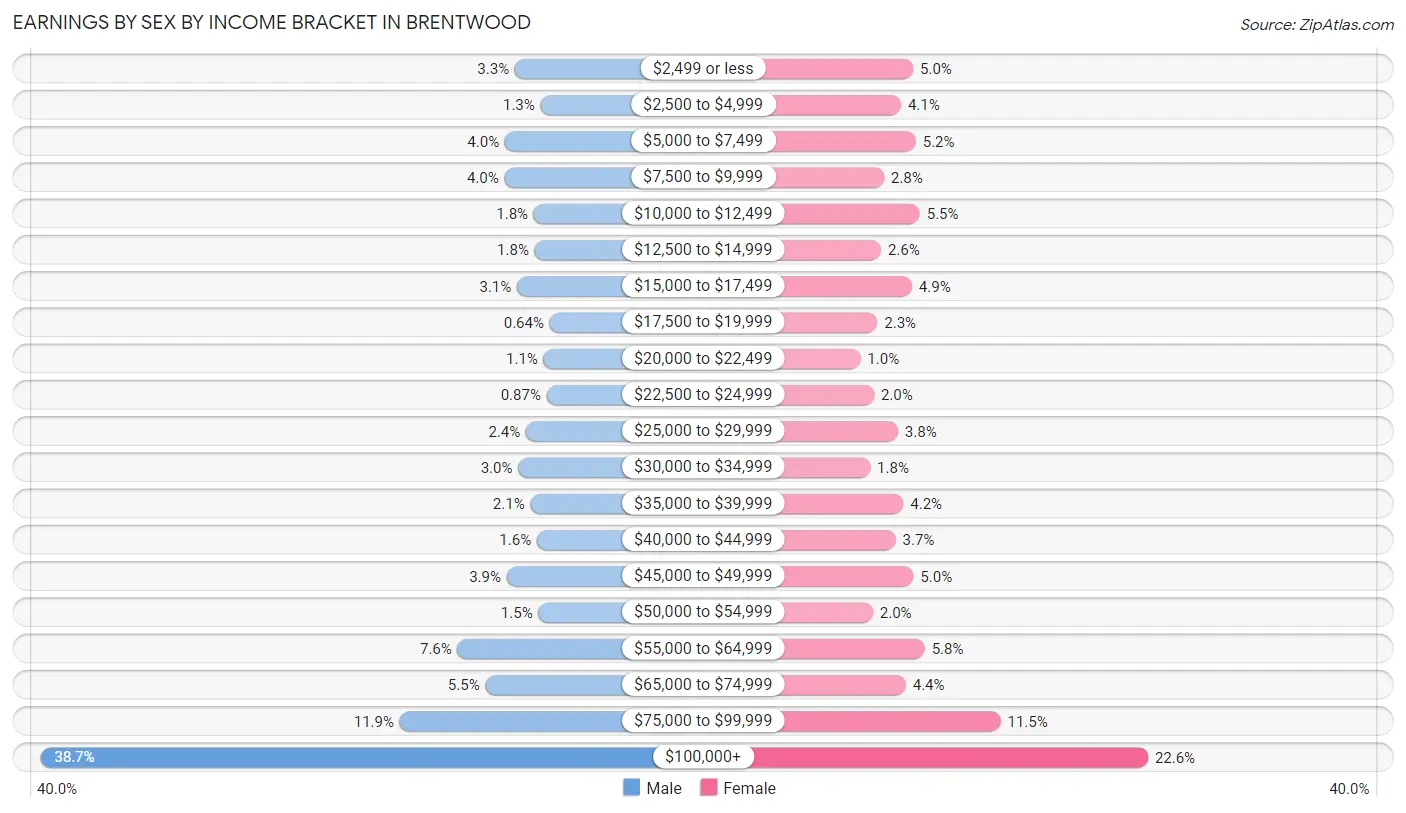
Earnings by Sex by Income Bracket in Brentwood
The most common earnings brackets in Brentwood are $100,000+ for men (6,750 | 38.7%) and $100,000+ for women (3,504 | 22.6%).
| Income | Male | Female |
| $2,499 or less | 566 (3.3%) | 771 (5.0%) |
| $2,500 to $4,999 | 231 (1.3%) | 631 (4.1%) |
| $5,000 to $7,499 | 697 (4.0%) | 803 (5.2%) |
| $7,500 to $9,999 | 702 (4.0%) | 432 (2.8%) |
| $10,000 to $12,499 | 319 (1.8%) | 849 (5.5%) |
| $12,500 to $14,999 | 309 (1.8%) | 397 (2.6%) |
| $15,000 to $17,499 | 539 (3.1%) | 757 (4.9%) |
| $17,500 to $19,999 | 111 (0.6%) | 355 (2.3%) |
| $20,000 to $22,499 | 191 (1.1%) | 158 (1.0%) |
| $22,500 to $24,999 | 151 (0.9%) | 316 (2.0%) |
| $25,000 to $29,999 | 422 (2.4%) | 594 (3.8%) |
| $30,000 to $34,999 | 522 (3.0%) | 272 (1.8%) |
| $35,000 to $39,999 | 365 (2.1%) | 658 (4.2%) |
| $40,000 to $44,999 | 278 (1.6%) | 568 (3.7%) |
| $45,000 to $49,999 | 673 (3.9%) | 775 (5.0%) |
| $50,000 to $54,999 | 260 (1.5%) | 302 (1.9%) |
| $55,000 to $64,999 | 1,316 (7.5%) | 906 (5.8%) |
| $65,000 to $74,999 | 952 (5.5%) | 686 (4.4%) |
| $75,000 to $99,999 | 2,069 (11.9%) | 1,789 (11.5%) |
| $100,000+ | 6,750 (38.7%) | 3,504 (22.6%) |
| Total | 17,423 (100.0%) | 15,523 (100.0%) |
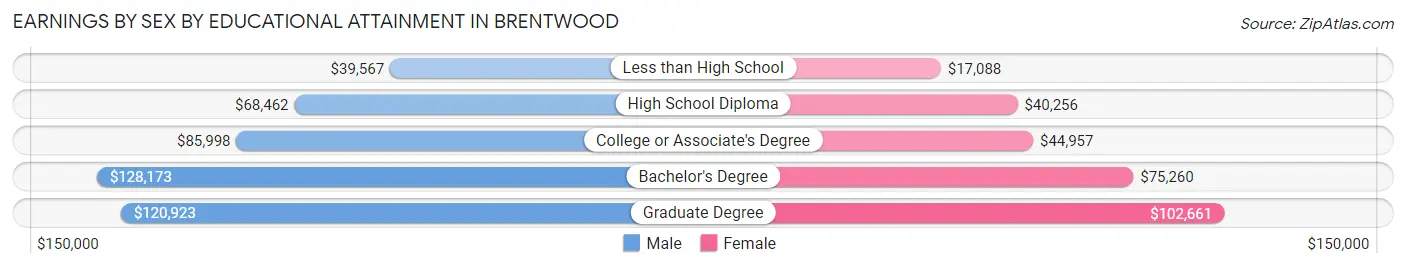
Earnings by Sex by Educational Attainment in Brentwood
Average earnings in Brentwood are $90,800 for men and $55,889 for women, a difference of 38.5%. Men with an educational attainment of bachelor's degree enjoy the highest average annual earnings of $128,173, while those with less than high school education earn the least with $39,567. Women with an educational attainment of graduate degree earn the most with the average annual earnings of $102,661, while those with less than high school education have the smallest earnings of $17,088.
| Educational Attainment | Male Income | Female Income |
| Less than High School | $39,567 | $17,088 |
| High School Diploma | $68,462 | $40,256 |
| College or Associate's Degree | $85,998 | $44,957 |
| Bachelor's Degree | $128,173 | $75,260 |
| Graduate Degree | $120,923 | $102,661 |
| Total | $90,800 | $55,889 |
Family Income in Brentwood
Family Income Brackets in Brentwood
According to the Brentwood family income data, there are 5,382 families falling into the $200,000+ income range, which is the most common income bracket and makes up 31.9% of all families. Conversely, the $10,000 to $14,999 income bracket is the least frequent group with only 135 families (0.8%) belonging to this category.
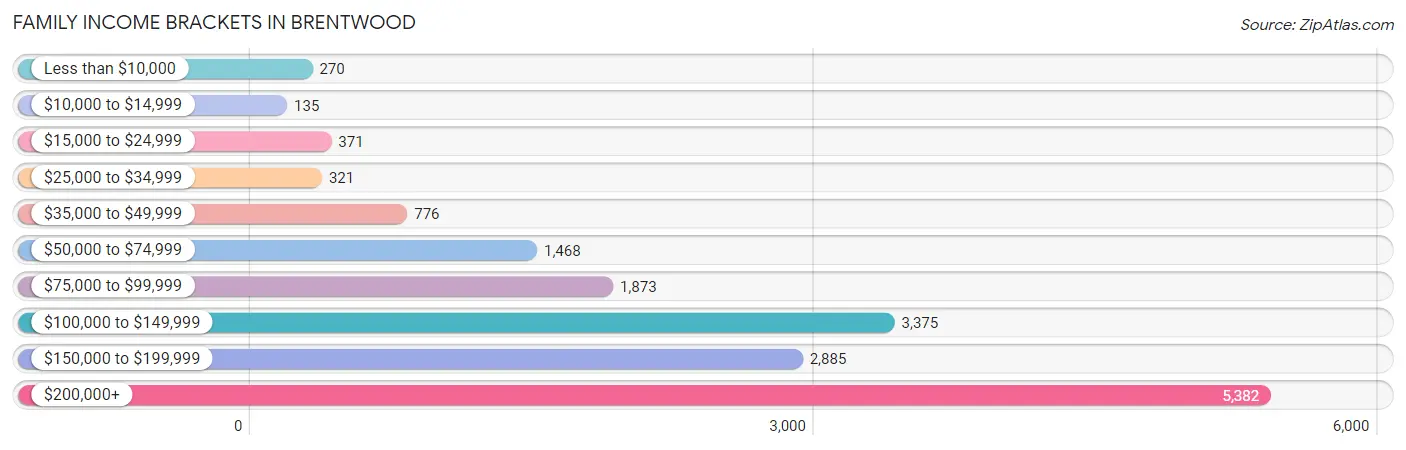
| Income Bracket | # Families | % Families |
| Less than $10,000 | 270 | 1.6% |
| $10,000 to $14,999 | 135 | 0.8% |
| $15,000 to $24,999 | 371 | 2.2% |
| $25,000 to $34,999 | 321 | 1.9% |
| $35,000 to $49,999 | 776 | 4.6% |
| $50,000 to $74,999 | 1,468 | 8.7% |
| $75,000 to $99,999 | 1,873 | 11.1% |
| $100,000 to $149,999 | 3,375 | 20.0% |
| $150,000 to $199,999 | 2,885 | 17.1% |
| $200,000+ | 5,382 | 31.9% |
Family Income by Famaliy Size in Brentwood
7+ person families (243 | 1.4%) account for the highest median family income in Brentwood with $250,001 per family, while 2-person families (5,857 | 34.7%) have the highest median income of $58,976 per family member.
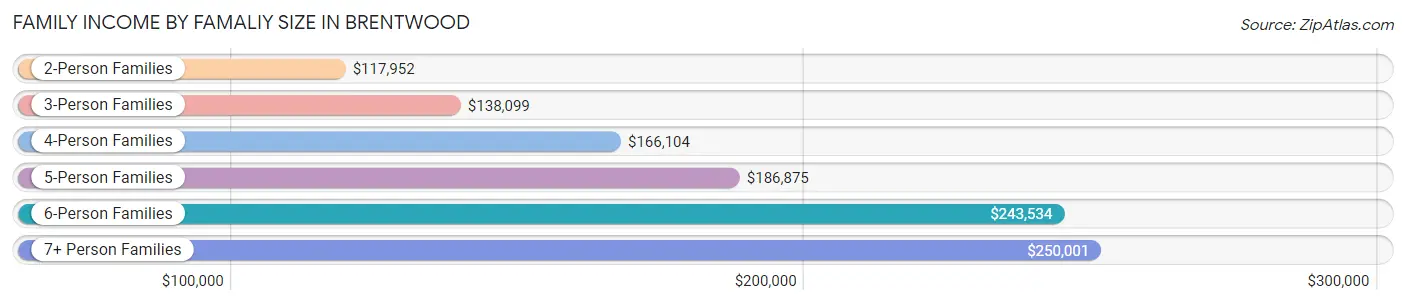
| Income Bracket | # Families | Median Income |
| 2-Person Families | 5,857 (34.7%) | $117,952 |
| 3-Person Families | 4,055 (24.0%) | $138,099 |
| 4-Person Families | 4,049 (24.0%) | $166,104 |
| 5-Person Families | 1,832 (10.9%) | $186,875 |
| 6-Person Families | 837 (5.0%) | $243,534 |
| 7+ Person Families | 243 (1.4%) | $250,001 |
| Total | 16,873 (100.0%) | $146,386 |
Family Income by Number of Earners in Brentwood
The median family income in Brentwood is $146,386, with families comprising 3+ earners (3,053) having the highest median family income of $218,917, while families with no earners (2,268) have the lowest median family income of $87,423, accounting for 18.1% and 13.4% of families, respectively.
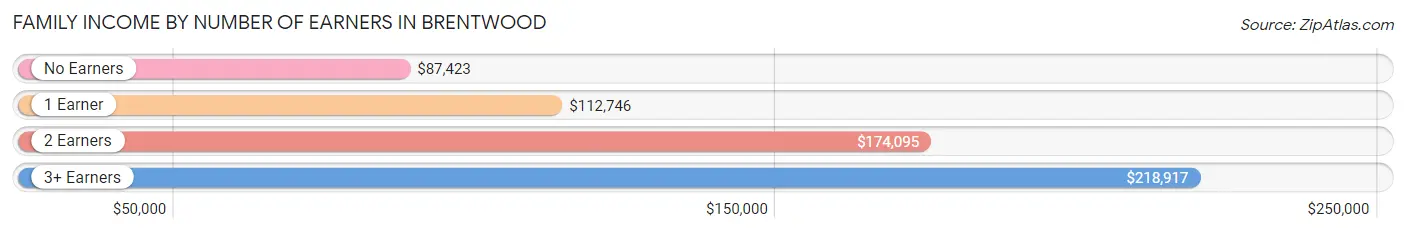
| Number of Earners | # Families | Median Income |
| No Earners | 2,268 (13.4%) | $87,423 |
| 1 Earner | 5,245 (31.1%) | $112,746 |
| 2 Earners | 6,307 (37.4%) | $174,095 |
| 3+ Earners | 3,053 (18.1%) | $218,917 |
| Total | 16,873 (100.0%) | $146,386 |
Household Income in Brentwood
Household Income Brackets in Brentwood
With 6,044 households falling in the category, the $200,000+ income range is the most frequent in Brentwood, accounting for 29.0% of all households. In contrast, only 333 households (1.6%) fall into the $10,000 to $14,999 income bracket, making it the least populous group.
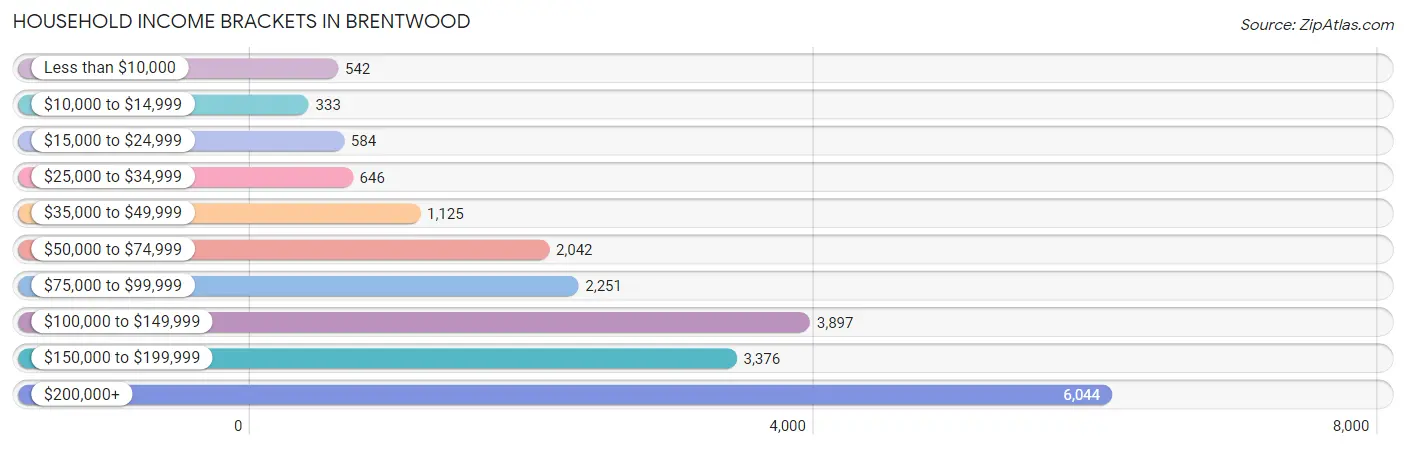
| Income Bracket | # Households | % Households |
| Less than $10,000 | 542 | 2.6% |
| $10,000 to $14,999 | 333 | 1.6% |
| $15,000 to $24,999 | 584 | 2.8% |
| $25,000 to $34,999 | 646 | 3.1% |
| $35,000 to $49,999 | 1,125 | 5.4% |
| $50,000 to $74,999 | 2,042 | 9.8% |
| $75,000 to $99,999 | 2,251 | 10.8% |
| $100,000 to $149,999 | 3,897 | 18.7% |
| $150,000 to $199,999 | 3,376 | 16.2% |
| $200,000+ | 6,044 | 29.0% |
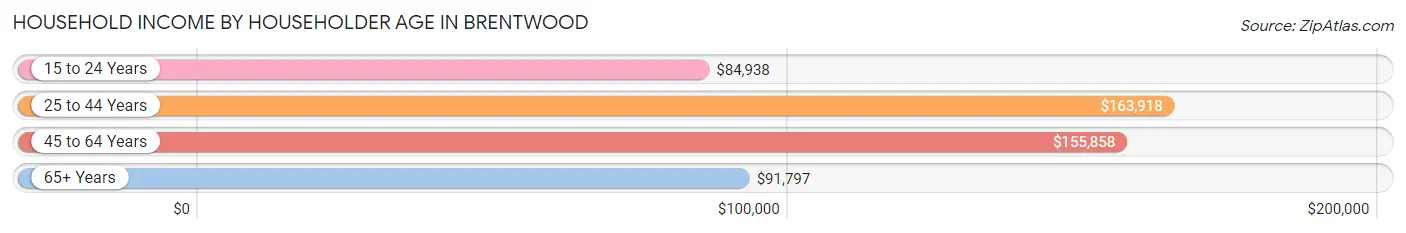
Household Income by Householder Age in Brentwood
The median household income in Brentwood is $134,689, with the highest median household income of $163,918 found in the 25 to 44 years age bracket for the primary householder. A total of 6,025 households (28.9%) fall into this category. Meanwhile, the 15 to 24 years age bracket for the primary householder has the lowest median household income of $84,938, with 173 households (0.8%) in this group.
| Income Bracket | # Households | Median Income |
| 15 to 24 Years | 173 (0.8%) | $84,938 |
| 25 to 44 Years | 6,025 (28.9%) | $163,918 |
| 45 to 64 Years | 9,344 (44.8%) | $155,858 |
| 65+ Years | 5,298 (25.4%) | $91,797 |
| Total | 20,840 (100.0%) | $134,689 |
Poverty in Brentwood
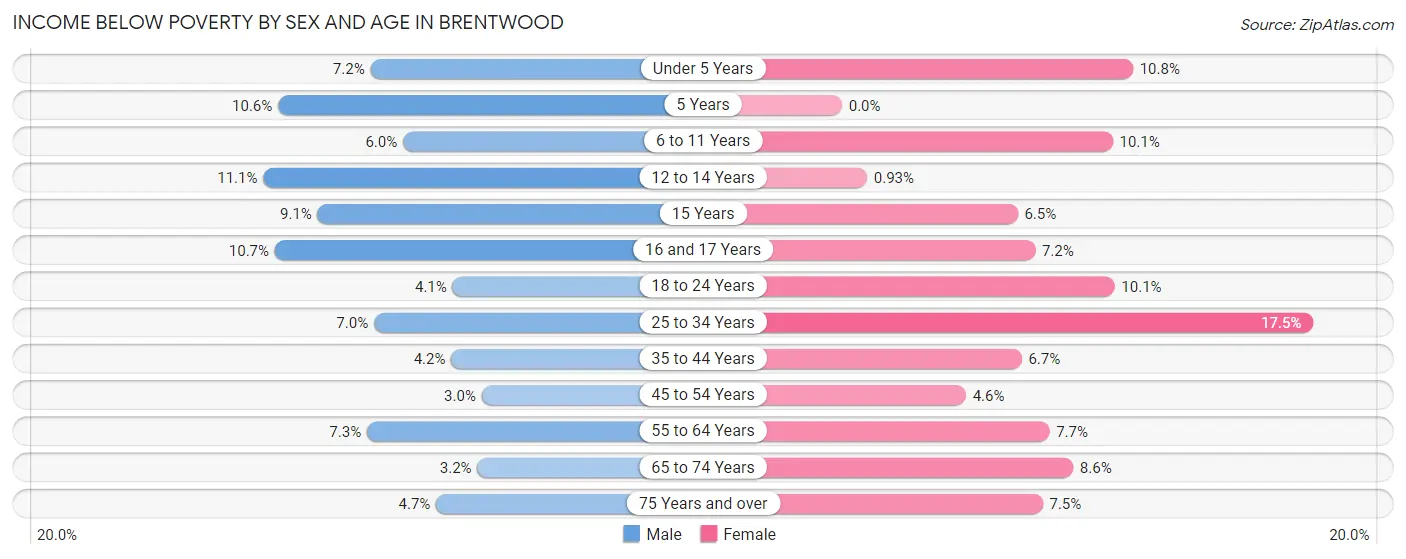
Income Below Poverty by Sex and Age in Brentwood
With 5.7% poverty level for males and 8.0% for females among the residents of Brentwood, 12 to 14 year old males and 25 to 34 year old females are the most vulnerable to poverty, with 198 males (11.1%) and 573 females (17.5%) in their respective age groups living below the poverty level.
| Age Bracket | Male | Female |
| Under 5 Years | 77 (7.2%) | 113 (10.8%) |
| 5 Years | 56 (10.6%) | 0 (0.0%) |
| 6 to 11 Years | 161 (5.9%) | 302 (10.1%) |
| 12 to 14 Years | 198 (11.1%) | 18 (0.9%) |
| 15 Years | 59 (9.1%) | 45 (6.5%) |
| 16 and 17 Years | 129 (10.7%) | 92 (7.2%) |
| 18 to 24 Years | 141 (4.1%) | 262 (10.1%) |
| 25 to 34 Years | 155 (7.0%) | 573 (17.5%) |
| 35 to 44 Years | 175 (4.2%) | 298 (6.7%) |
| 45 to 54 Years | 152 (3.0%) | 238 (4.6%) |
| 55 to 64 Years | 285 (7.3%) | 293 (7.7%) |
| 65 to 74 Years | 73 (3.2%) | 253 (8.6%) |
| 75 Years and over | 94 (4.7%) | 191 (7.4%) |
| Total | 1,755 (5.7%) | 2,678 (8.0%) |
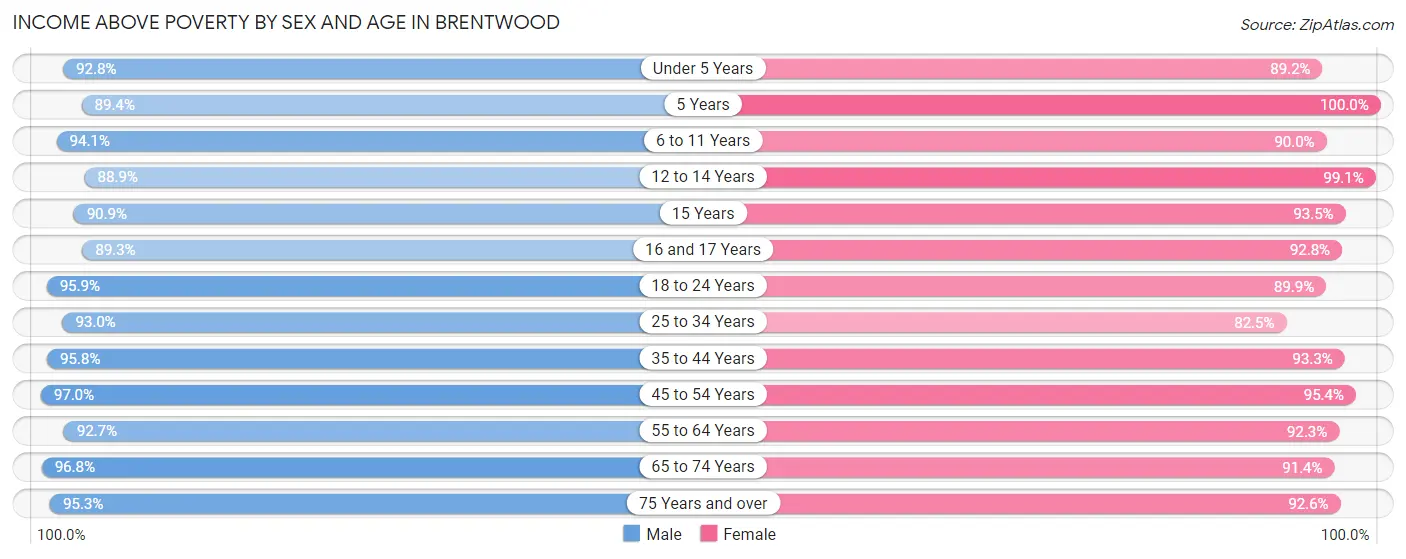
Income Above Poverty by Sex and Age in Brentwood
According to the poverty statistics in Brentwood, males aged 45 to 54 years and females aged 5 years are the age groups that are most secure financially, with 97.0% of males and 100.0% of females in these age groups living above the poverty line.
| Age Bracket | Male | Female |
| Under 5 Years | 998 (92.8%) | 933 (89.2%) |
| 5 Years | 473 (89.4%) | 594 (100.0%) |
| 6 to 11 Years | 2,543 (94.1%) | 2,704 (89.9%) |
| 12 to 14 Years | 1,579 (88.9%) | 1,915 (99.1%) |
| 15 Years | 588 (90.9%) | 645 (93.5%) |
| 16 and 17 Years | 1,075 (89.3%) | 1,192 (92.8%) |
| 18 to 24 Years | 3,291 (95.9%) | 2,327 (89.9%) |
| 25 to 34 Years | 2,050 (93.0%) | 2,701 (82.5%) |
| 35 to 44 Years | 4,036 (95.8%) | 4,173 (93.3%) |
| 45 to 54 Years | 4,868 (97.0%) | 4,934 (95.4%) |
| 55 to 64 Years | 3,627 (92.7%) | 3,511 (92.3%) |
| 65 to 74 Years | 2,218 (96.8%) | 2,695 (91.4%) |
| 75 Years and over | 1,899 (95.3%) | 2,374 (92.5%) |
| Total | 29,245 (94.3%) | 30,698 (92.0%) |
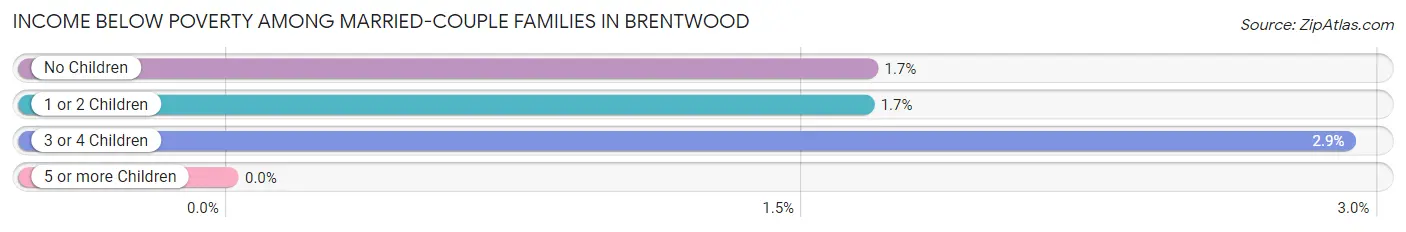
Income Below Poverty Among Married-Couple Families in Brentwood
The poverty statistics for married-couple families in Brentwood show that 1.8% or 238 of the total 13,435 families live below the poverty line. Families with 3 or 4 children have the highest poverty rate of 2.9%, comprising of 33 families. On the other hand, families with 5 or more children have the lowest poverty rate of 0.0%, which includes 0 families.
| Children | Above Poverty | Below Poverty |
| No Children | 6,106 (98.3%) | 104 (1.7%) |
| 1 or 2 Children | 5,966 (98.3%) | 101 (1.7%) |
| 3 or 4 Children | 1,099 (97.1%) | 33 (2.9%) |
| 5 or more Children | 26 (100.0%) | 0 (0.0%) |
| Total | 13,197 (98.2%) | 238 (1.8%) |
Income Below Poverty Among Single-Parent Households in Brentwood
According to the poverty data in Brentwood, 9.7% or 74 single-father households and 18.3% or 489 single-mother households are living below the poverty line. Among single-father households, those with 1 or 2 children have the highest poverty rate, with 74 households (16.9%) experiencing poverty. Likewise, among single-mother households, those with 1 or 2 children have the highest poverty rate, with 387 households (24.0%) falling below the poverty line.
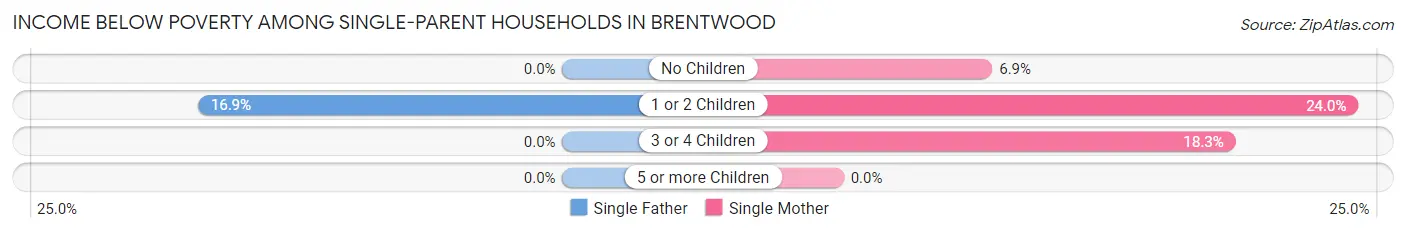
| Children | Single Father | Single Mother |
| No Children | 0 (0.0%) | 56 (6.9%) |
| 1 or 2 Children | 74 (16.9%) | 387 (24.0%) |
| 3 or 4 Children | 0 (0.0%) | 46 (18.2%) |
| 5 or more Children | 0 (0.0%) | 0 (0.0%) |
| Total | 74 (9.7%) | 489 (18.3%) |
Income Below Poverty Among Married-Couple vs Single-Parent Households in Brentwood
The poverty data for Brentwood shows that 238 of the married-couple family households (1.8%) and 563 of the single-parent households (16.4%) are living below the poverty level. Within the married-couple family households, those with 3 or 4 children have the highest poverty rate, with 33 households (2.9%) falling below the poverty line. Among the single-parent households, those with 1 or 2 children have the highest poverty rate, with 461 household (22.5%) living below poverty.
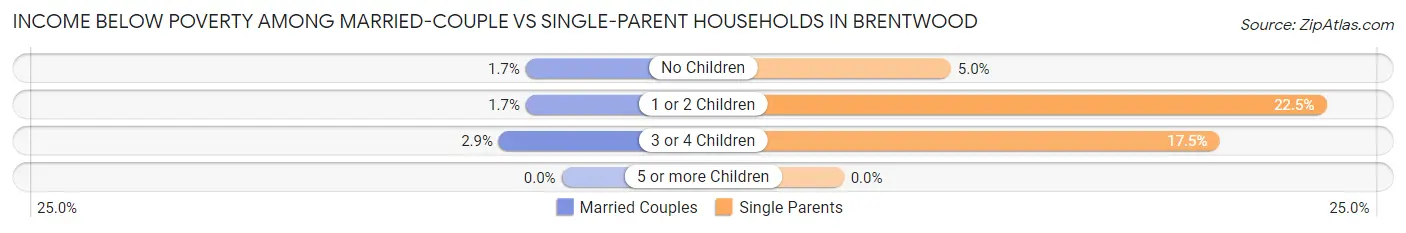
| Children | Married-Couple Families | Single-Parent Households |
| No Children | 104 (1.7%) | 56 (5.0%) |
| 1 or 2 Children | 101 (1.7%) | 461 (22.5%) |
| 3 or 4 Children | 33 (2.9%) | 46 (17.5%) |
| 5 or more Children | 0 (0.0%) | 0 (0.0%) |
| Total | 238 (1.8%) | 563 (16.4%) |
Race in Brentwood
The most populous races in Brentwood are White / Caucasian (34,017 | 52.8%), Hispanic or Latino (16,420 | 25.5%), and Asian (9,829 | 15.2%).
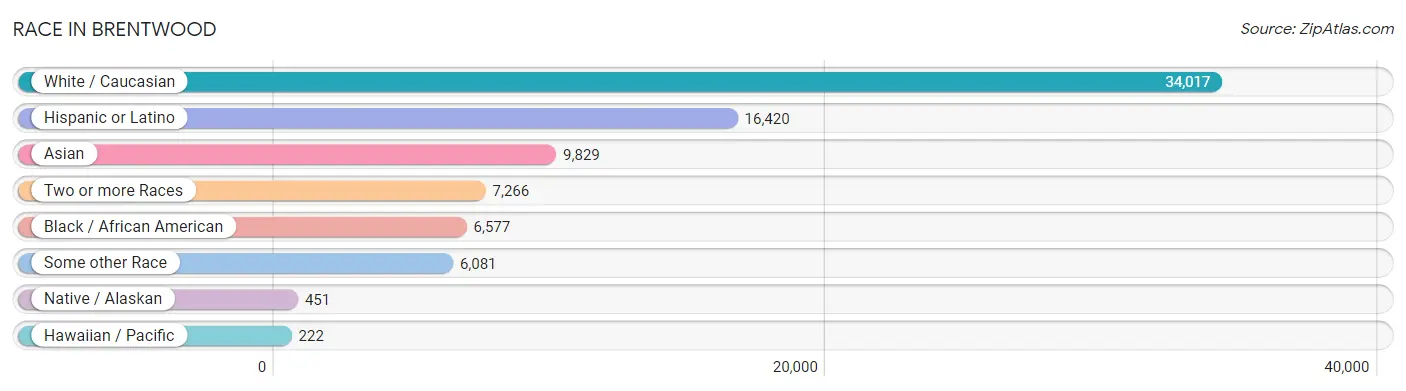
| Race | # Population | % Population |
| Asian | 9,829 | 15.2% |
| Black / African American | 6,577 | 10.2% |
| Hawaiian / Pacific | 222 | 0.3% |
| Hispanic or Latino | 16,420 | 25.5% |
| Native / Alaskan | 451 | 0.7% |
| White / Caucasian | 34,017 | 52.8% |
| Two or more Races | 7,266 | 11.3% |
| Some other Race | 6,081 | 9.4% |
| Total | 64,443 | 100.0% |
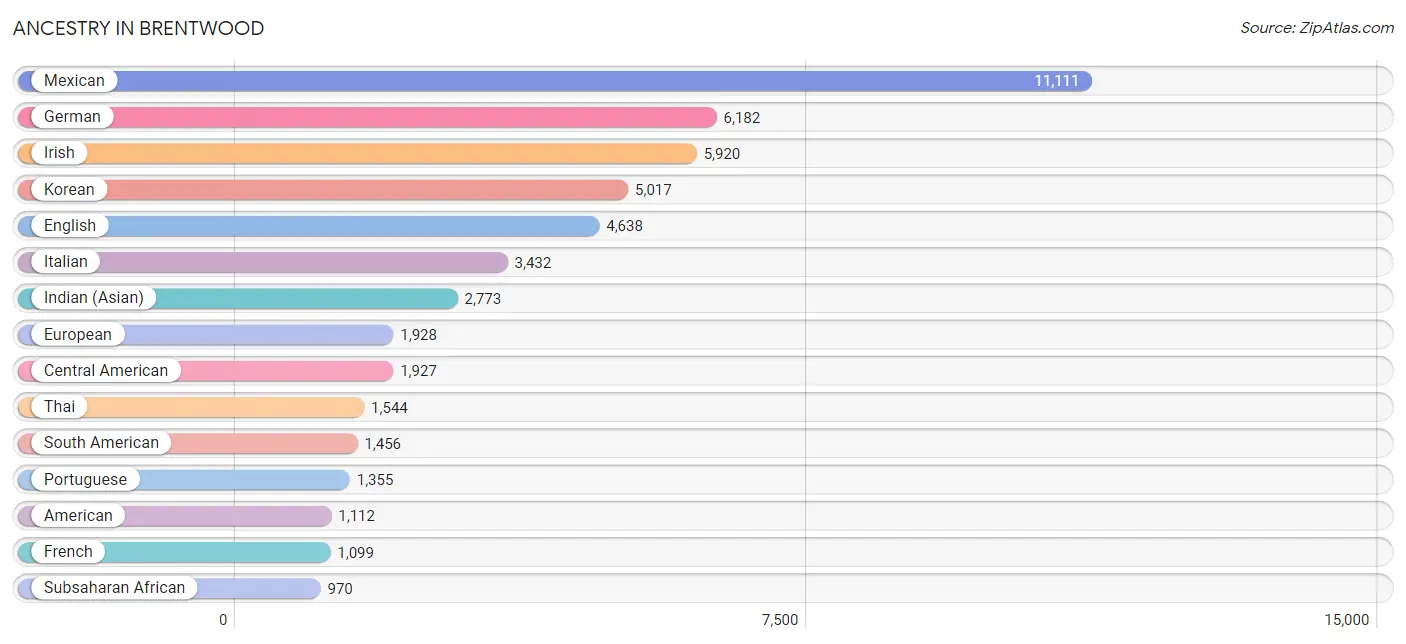
Ancestry in Brentwood
The most populous ancestries reported in Brentwood are Mexican (11,111 | 17.2%), German (6,182 | 9.6%), Irish (5,920 | 9.2%), Korean (5,017 | 7.8%), and English (4,638 | 7.2%), together accounting for 51.0% of all Brentwood residents.
| Ancestry | # Population | % Population |
| Afghan | 443 | 0.7% |
| African | 643 | 1.0% |
| Aleut | 9 | 0.0% |
| American | 1,112 | 1.7% |
| Apache | 97 | 0.2% |
| Arab | 450 | 0.7% |
| Argentinean | 169 | 0.3% |
| Armenian | 165 | 0.3% |
| Assyrian / Chaldean / Syriac | 29 | 0.1% |
| Australian | 35 | 0.1% |
| Austrian | 105 | 0.2% |
| Basque | 16 | 0.0% |
| Belgian | 44 | 0.1% |
| Bhutanese | 639 | 1.0% |
| Brazilian | 210 | 0.3% |
| British | 582 | 0.9% |
| Burmese | 407 | 0.6% |
| Cajun | 29 | 0.1% |
| Cambodian | 31 | 0.1% |
| Canadian | 235 | 0.4% |
| Central American | 1,927 | 3.0% |
| Central American Indian | 53 | 0.1% |
| Cherokee | 40 | 0.1% |
| Chilean | 64 | 0.1% |
| Chippewa | 5 | 0.0% |
| Choctaw | 15 | 0.0% |
| Colombian | 391 | 0.6% |
| Creek | 201 | 0.3% |
| Croatian | 50 | 0.1% |
| Czech | 139 | 0.2% |
| Czechoslovakian | 17 | 0.0% |
| Danish | 327 | 0.5% |
| Dutch | 571 | 0.9% |
| Eastern European | 207 | 0.3% |
| Ecuadorian | 10 | 0.0% |
| Egyptian | 118 | 0.2% |
| English | 4,638 | 7.2% |
| Ethiopian | 52 | 0.1% |
| European | 1,928 | 3.0% |
| Filipino | 160 | 0.3% |
| Finnish | 258 | 0.4% |
| French | 1,099 | 1.7% |
| French Canadian | 124 | 0.2% |
| German | 6,182 | 9.6% |
| Ghanaian | 103 | 0.2% |
| Greek | 283 | 0.4% |
| Guamanian / Chamorro | 183 | 0.3% |
| Guatemalan | 256 | 0.4% |
| Haitian | 274 | 0.4% |
| Honduran | 182 | 0.3% |
| Hungarian | 126 | 0.2% |
| Icelander | 10 | 0.0% |
| Indian (Asian) | 2,773 | 4.3% |
| Indonesian | 45 | 0.1% |
| Iranian | 235 | 0.4% |
| Irish | 5,920 | 9.2% |
| Israeli | 12 | 0.0% |
| Italian | 3,432 | 5.3% |
| Jamaican | 59 | 0.1% |
| Japanese | 80 | 0.1% |
| Korean | 5,017 | 7.8% |
| Laotian | 25 | 0.0% |
| Lithuanian | 96 | 0.2% |
| Luxembourger | 7 | 0.0% |
| Malaysian | 16 | 0.0% |
| Maltese | 7 | 0.0% |
| Mexican | 11,111 | 17.2% |
| Mexican American Indian | 155 | 0.2% |
| Moroccan | 16 | 0.0% |
| Native Hawaiian | 148 | 0.2% |
| Navajo | 25 | 0.0% |
| Nicaraguan | 420 | 0.6% |
| Nigerian | 152 | 0.2% |
| Northern European | 32 | 0.1% |
| Norwegian | 762 | 1.2% |
| Paiute | 11 | 0.0% |
| Pakistani | 21 | 0.0% |
| Palestinian | 57 | 0.1% |
| Panamanian | 139 | 0.2% |
| Peruvian | 797 | 1.2% |
| Pima | 54 | 0.1% |
| Polish | 733 | 1.1% |
| Portuguese | 1,355 | 2.1% |
| Puerto Rican | 685 | 1.1% |
| Romanian | 83 | 0.1% |
| Russian | 390 | 0.6% |
| Salvadoran | 930 | 1.4% |
| Samoan | 274 | 0.4% |
| Scandinavian | 100 | 0.2% |
| Scotch-Irish | 702 | 1.1% |
| Scottish | 895 | 1.4% |
| Serbian | 11 | 0.0% |
| Slovak | 36 | 0.1% |
| Slovene | 33 | 0.1% |
| South American | 1,456 | 2.3% |
| Spaniard | 556 | 0.9% |
| Spanish | 405 | 0.6% |
| Spanish American | 100 | 0.2% |
| Spanish American Indian | 143 | 0.2% |
| Sri Lankan | 353 | 0.5% |
| Subsaharan African | 970 | 1.5% |
| Swedish | 646 | 1.0% |
| Swiss | 299 | 0.5% |
| Syrian | 42 | 0.1% |
| Thai | 1,544 | 2.4% |
| Tongan | 69 | 0.1% |
| Trinidadian and Tobagonian | 6 | 0.0% |
| Turkish | 140 | 0.2% |
| Ukrainian | 23 | 0.0% |
| Venezuelan | 25 | 0.0% |
| Vietnamese | 180 | 0.3% |
| Welsh | 674 | 1.1% |
| Yugoslavian | 49 | 0.1% | View All 113 Rows |
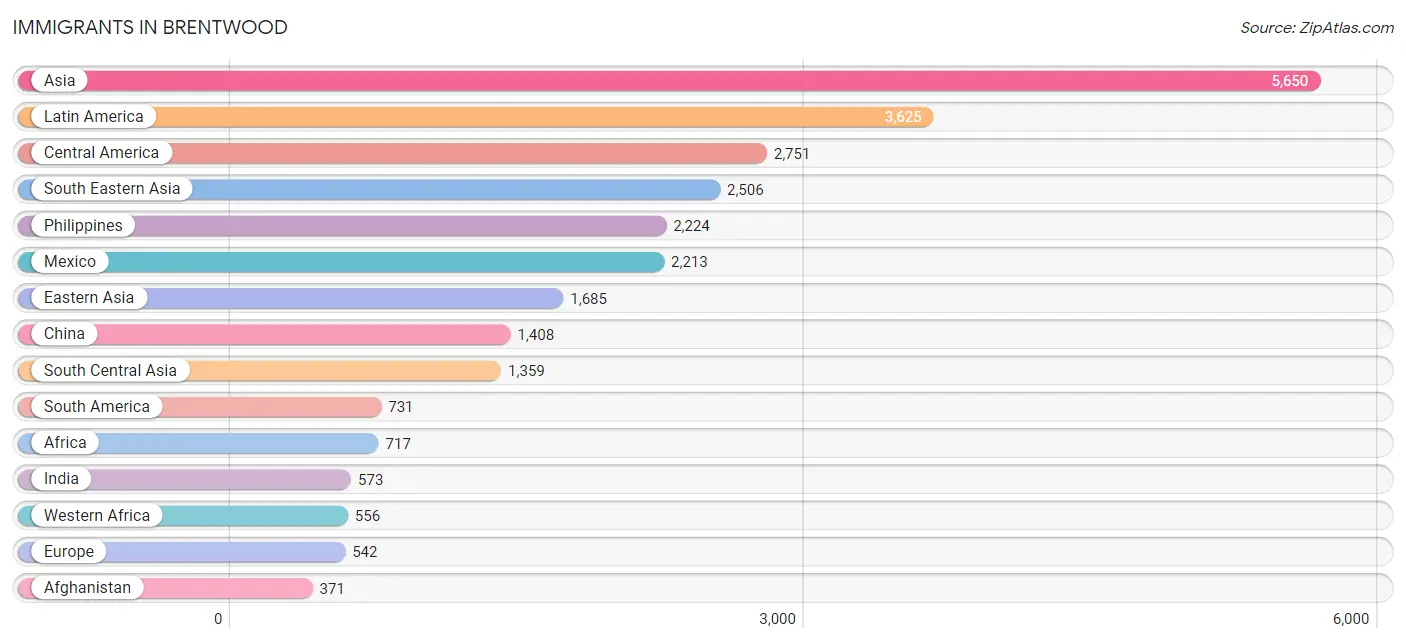
Immigrants in Brentwood
The most numerous immigrant groups reported in Brentwood came from Asia (5,650 | 8.8%), Latin America (3,625 | 5.6%), Central America (2,751 | 4.3%), South Eastern Asia (2,506 | 3.9%), and Philippines (2,224 | 3.5%), together accounting for 26.0% of all Brentwood residents.
| Immigration Origin | # Population | % Population |
| Afghanistan | 371 | 0.6% |
| Africa | 717 | 1.1% |
| Argentina | 127 | 0.2% |
| Armenia | 17 | 0.0% |
| Asia | 5,650 | 8.8% |
| Azores | 42 | 0.1% |
| Bangladesh | 73 | 0.1% |
| Bosnia and Herzegovina | 29 | 0.1% |
| Brazil | 207 | 0.3% |
| Cameroon | 28 | 0.0% |
| Canada | 198 | 0.3% |
| Caribbean | 143 | 0.2% |
| Central America | 2,751 | 4.3% |
| Chile | 40 | 0.1% |
| China | 1,408 | 2.2% |
| Colombia | 31 | 0.1% |
| Czechoslovakia | 6 | 0.0% |
| Eastern Africa | 52 | 0.1% |
| Eastern Asia | 1,685 | 2.6% |
| Eastern Europe | 108 | 0.2% |
| Ecuador | 10 | 0.0% |
| Egypt | 16 | 0.0% |
| El Salvador | 242 | 0.4% |
| England | 55 | 0.1% |
| Ethiopia | 52 | 0.1% |
| Europe | 542 | 0.8% |
| Fiji | 55 | 0.1% |
| Germany | 69 | 0.1% |
| Ghana | 361 | 0.6% |
| Guatemala | 15 | 0.0% |
| Haiti | 115 | 0.2% |
| Honduras | 9 | 0.0% |
| Hong Kong | 95 | 0.2% |
| Hungary | 13 | 0.0% |
| India | 573 | 0.9% |
| Iran | 225 | 0.4% |
| Israel | 12 | 0.0% |
| Italy | 8 | 0.0% |
| Jamaica | 22 | 0.0% |
| Japan | 47 | 0.1% |
| Korea | 210 | 0.3% |
| Laos | 16 | 0.0% |
| Latin America | 3,625 | 5.6% |
| Lebanon | 52 | 0.1% |
| Malaysia | 41 | 0.1% |
| Mexico | 2,213 | 3.4% |
| Middle Africa | 28 | 0.0% |
| Moldova | 10 | 0.0% |
| Netherlands | 16 | 0.0% |
| Nicaragua | 214 | 0.3% |
| Nigeria | 134 | 0.2% |
| Northern Africa | 66 | 0.1% |
| Northern Europe | 252 | 0.4% |
| Oceania | 117 | 0.2% |
| Pakistan | 117 | 0.2% |
| Panama | 58 | 0.1% |
| Peru | 305 | 0.5% |
| Philippines | 2,224 | 3.5% |
| Poland | 20 | 0.0% |
| Portugal | 81 | 0.1% |
| Russia | 30 | 0.1% |
| South America | 731 | 1.1% |
| South Central Asia | 1,359 | 2.1% |
| South Eastern Asia | 2,506 | 3.9% |
| Southern Europe | 97 | 0.2% |
| Spain | 8 | 0.0% |
| Sudan | 50 | 0.1% |
| Sweden | 23 | 0.0% |
| Taiwan | 219 | 0.3% |
| Thailand | 23 | 0.0% |
| Trinidad and Tobago | 6 | 0.0% |
| Turkey | 10 | 0.0% |
| Venezuela | 11 | 0.0% |
| Vietnam | 178 | 0.3% |
| Western Africa | 556 | 0.9% |
| Western Asia | 100 | 0.2% |
| Western Europe | 85 | 0.1% | View All 77 Rows |
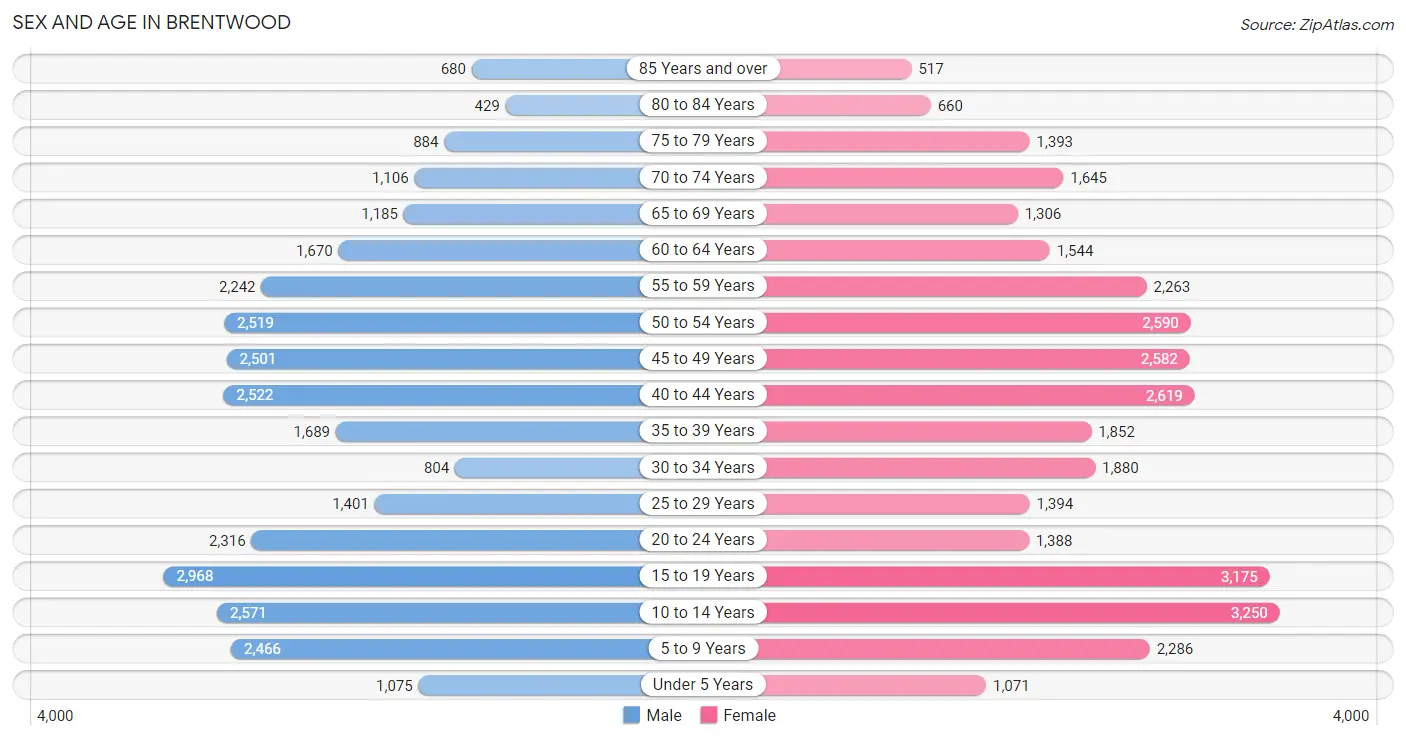
Sex and Age in Brentwood
Sex and Age in Brentwood
The most populous age groups in Brentwood are 15 to 19 Years (2,968 | 9.6%) for men and 10 to 14 Years (3,250 | 9.7%) for women.
| Age Bracket | Male | Female |
| Under 5 Years | 1,075 (3.5%) | 1,071 (3.2%) |
| 5 to 9 Years | 2,466 (8.0%) | 2,286 (6.8%) |
| 10 to 14 Years | 2,571 (8.3%) | 3,250 (9.7%) |
| 15 to 19 Years | 2,968 (9.6%) | 3,175 (9.5%) |
| 20 to 24 Years | 2,316 (7.5%) | 1,388 (4.2%) |
| 25 to 29 Years | 1,401 (4.5%) | 1,394 (4.2%) |
| 30 to 34 Years | 804 (2.6%) | 1,880 (5.6%) |
| 35 to 39 Years | 1,689 (5.4%) | 1,852 (5.5%) |
| 40 to 44 Years | 2,522 (8.1%) | 2,619 (7.8%) |
| 45 to 49 Years | 2,501 (8.1%) | 2,582 (7.7%) |
| 50 to 54 Years | 2,519 (8.1%) | 2,590 (7.7%) |
| 55 to 59 Years | 2,242 (7.2%) | 2,263 (6.8%) |
| 60 to 64 Years | 1,670 (5.4%) | 1,544 (4.6%) |
| 65 to 69 Years | 1,185 (3.8%) | 1,306 (3.9%) |
| 70 to 74 Years | 1,106 (3.6%) | 1,645 (4.9%) |
| 75 to 79 Years | 884 (2.9%) | 1,393 (4.2%) |
| 80 to 84 Years | 429 (1.4%) | 660 (2.0%) |
| 85 Years and over | 680 (2.2%) | 517 (1.5%) |
| Total | 31,028 (100.0%) | 33,415 (100.0%) |
Families and Households in Brentwood
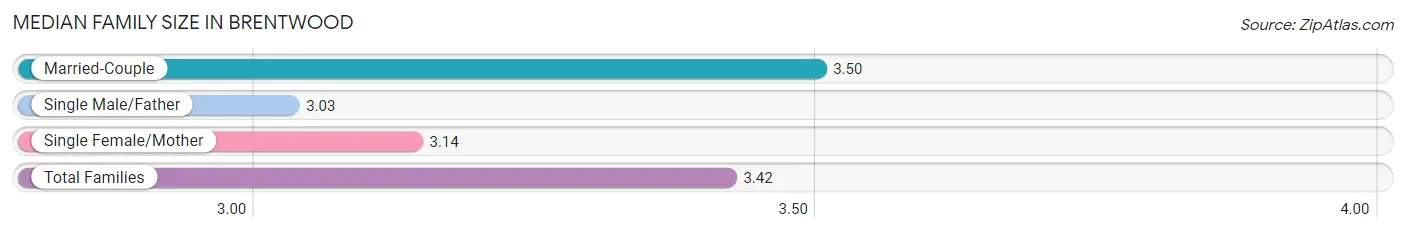
Median Family Size in Brentwood
The median family size in Brentwood is 3.42 persons per family, with married-couple families (13,435 | 79.6%) accounting for the largest median family size of 3.5 persons per family. On the other hand, single male/father families (762 | 4.5%) represent the smallest median family size with 3.03 persons per family.
| Family Type | # Families | Family Size |
| Married-Couple | 13,435 (79.6%) | 3.50 |
| Single Male/Father | 762 (4.5%) | 3.03 |
| Single Female/Mother | 2,676 (15.9%) | 3.14 |
| Total Families | 16,873 (100.0%) | 3.42 |
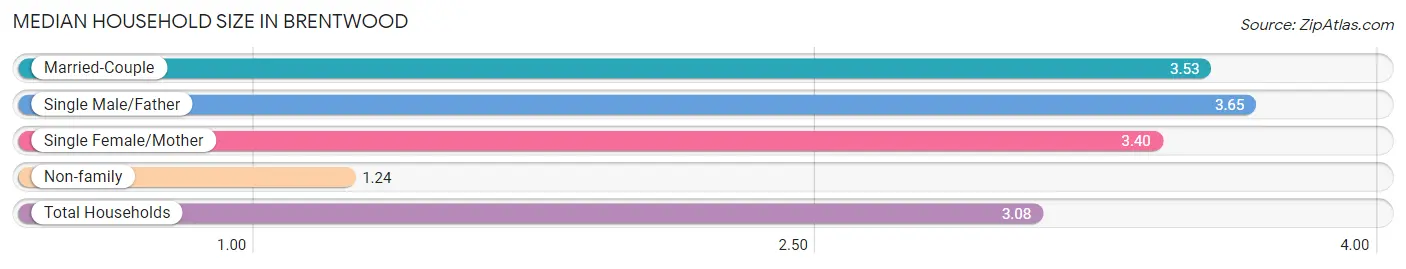
Median Household Size in Brentwood
The median household size in Brentwood is 3.08 persons per household, with single male/father households (762 | 3.7%) accounting for the largest median household size of 3.65 persons per household. non-family households (3,967 | 19.0%) represent the smallest median household size with 1.24 persons per household.
| Household Type | # Households | Household Size |
| Married-Couple | 13,435 (64.5%) | 3.53 |
| Single Male/Father | 762 (3.7%) | 3.65 |
| Single Female/Mother | 2,676 (12.8%) | 3.40 |
| Non-family | 3,967 (19.0%) | 1.24 |
| Total Households | 20,840 (100.0%) | 3.08 |
Household Size by Marriage Status in Brentwood
Out of a total of 20,840 households in Brentwood, 16,873 (81.0%) are family households, while 3,967 (19.0%) are nonfamily households. The most numerous type of family households are 2-person households, comprising 5,522, and the most common type of nonfamily households are 1-person households, comprising 3,181.
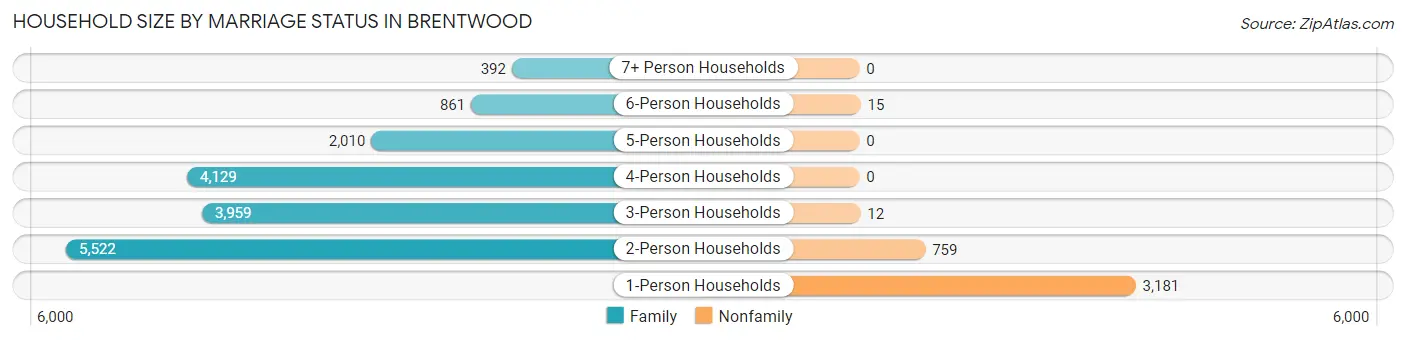
| Household Size | Family Households | Nonfamily Households |
| 1-Person Households | - | 3,181 (15.3%) |
| 2-Person Households | 5,522 (26.5%) | 759 (3.6%) |
| 3-Person Households | 3,959 (19.0%) | 12 (0.1%) |
| 4-Person Households | 4,129 (19.8%) | 0 (0.0%) |
| 5-Person Households | 2,010 (9.6%) | 0 (0.0%) |
| 6-Person Households | 861 (4.1%) | 15 (0.1%) |
| 7+ Person Households | 392 (1.9%) | 0 (0.0%) |
| Total | 16,873 (81.0%) | 3,967 (19.0%) |
Female Fertility in Brentwood
Fertility by Age in Brentwood
Average fertility rate in Brentwood is 39.0 births per 1,000 women. Women in the age bracket of 20 to 34 years have the highest fertility rate with 93.0 births per 1,000 women. Women in the age bracket of 20 to 34 years acount for 73.8% of all women with births.
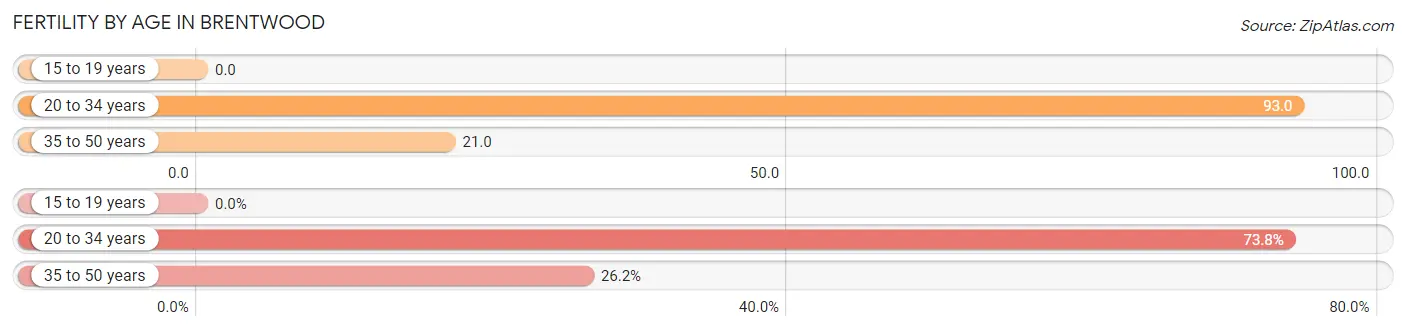
| Age Bracket | Women with Births | Births / 1,000 Women |
| 15 to 19 years | 0 (0.0%) | 0.0 |
| 20 to 34 years | 434 (73.8%) | 93.0 |
| 35 to 50 years | 154 (26.2%) | 21.0 |
| Total | 588 (100.0%) | 39.0 |
Fertility by Age by Marriage Status in Brentwood
60.0% of women with births (588) in Brentwood are married. The highest percentage of unmarried women with births falls into 20 to 34 years age bracket with 49.5% of them unmarried at the time of birth, while the lowest percentage of unmarried women with births belong to 35 to 50 years age bracket with 13.0% of them unmarried.
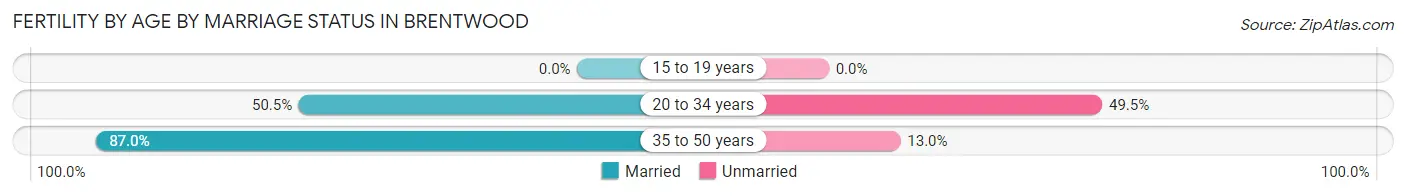
| Age Bracket | Married | Unmarried |
| 15 to 19 years | 0 (0.0%) | 0 (0.0%) |
| 20 to 34 years | 219 (50.5%) | 215 (49.5%) |
| 35 to 50 years | 134 (87.0%) | 20 (13.0%) |
| Total | 353 (60.0%) | 235 (40.0%) |
Fertility by Education in Brentwood
Average fertility rate in Brentwood is 39.0 births per 1,000 women. Women with the education attainment of bachelor's degree have the highest fertility rate of 57.0 births per 1,000 women, while women with the education attainment of college or associate's degree have the lowest fertility at 25.0 births per 1,000 women. Women with the education attainment of bachelor's degree represent 35.5% of all women with births.
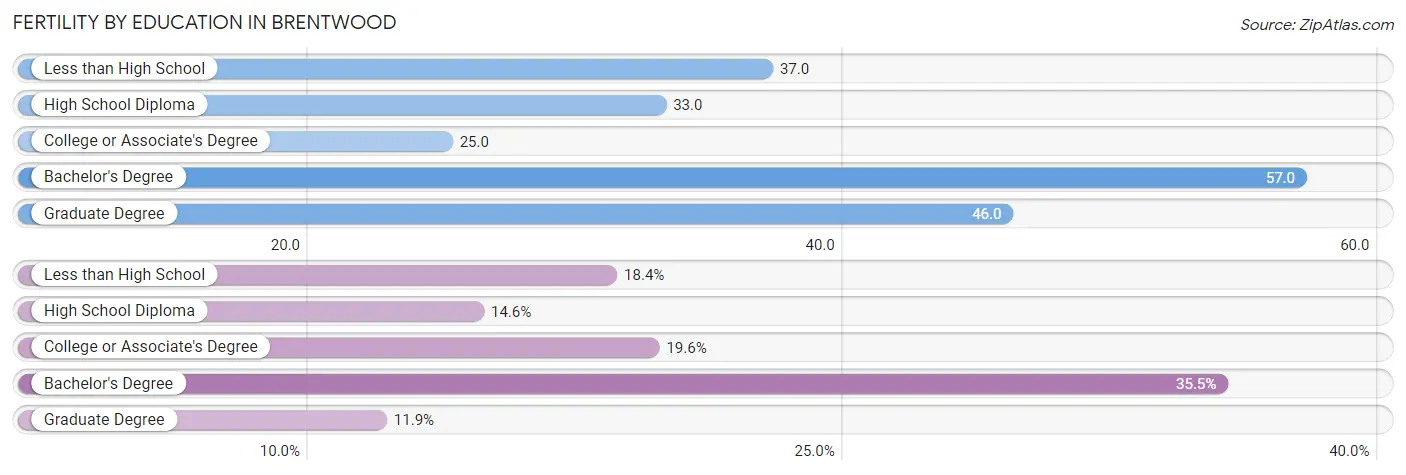
| Educational Attainment | Women with Births | Births / 1,000 Women |
| Less than High School | 108 (18.4%) | 37.0 |
| High School Diploma | 86 (14.6%) | 33.0 |
| College or Associate's Degree | 115 (19.6%) | 25.0 |
| Bachelor's Degree | 209 (35.5%) | 57.0 |
| Graduate Degree | 70 (11.9%) | 46.0 |
| Total | 588 (100.0%) | 39.0 |
Fertility by Education by Marriage Status in Brentwood
40.0% of women with births in Brentwood are unmarried. Women with the educational attainment of bachelor's degree are most likely to be married with 100.0% of them married at childbirth, while women with the educational attainment of less than high school are least likely to be married with 100.0% of them unmarried at childbirth.
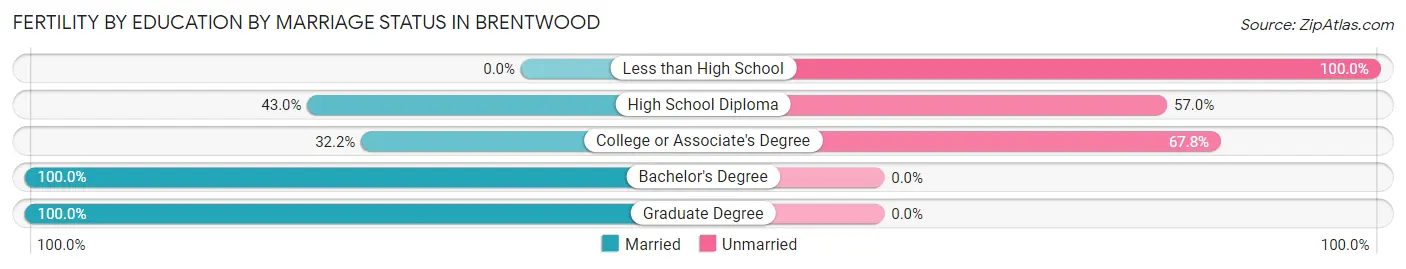
| Educational Attainment | Married | Unmarried |
| Less than High School | 0 (0.0%) | 108 (100.0%) |
| High School Diploma | 37 (43.0%) | 49 (57.0%) |
| College or Associate's Degree | 37 (32.2%) | 78 (67.8%) |
| Bachelor's Degree | 209 (100.0%) | 0 (0.0%) |
| Graduate Degree | 70 (100.0%) | 0 (0.0%) |
| Total | 353 (60.0%) | 235 (40.0%) |
Employment Characteristics in Brentwood
Employment by Class of Employer in Brentwood
Among the 29,105 employed individuals in Brentwood, private company employees (17,958 | 61.7%), local government employees (4,899 | 16.8%), and not-for-profit organizations (2,180 | 7.5%) make up the most common classes of employment.
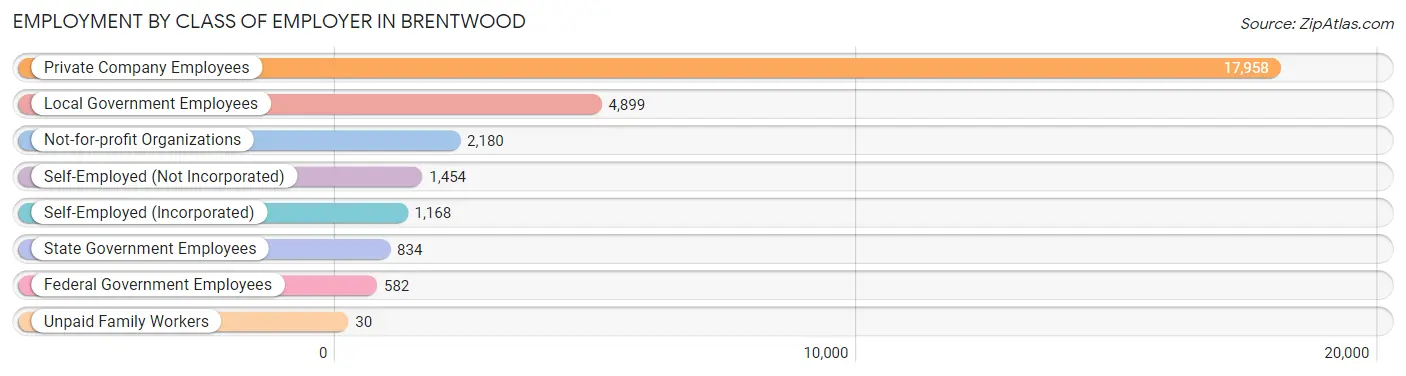
| Employer Class | # Employees | % Employees |
| Private Company Employees | 17,958 | 61.7% |
| Self-Employed (Incorporated) | 1,168 | 4.0% |
| Self-Employed (Not Incorporated) | 1,454 | 5.0% |
| Not-for-profit Organizations | 2,180 | 7.5% |
| Local Government Employees | 4,899 | 16.8% |
| State Government Employees | 834 | 2.9% |
| Federal Government Employees | 582 | 2.0% |
| Unpaid Family Workers | 30 | 0.1% |
| Total | 29,105 | 100.0% |
Employment Status by Age in Brentwood
According to the labor force statistics for Brentwood, out of the total population over 16 years of age (50,386), 63.0% or 31,743 individuals are in the labor force, with 6.0% or 1,905 of them unemployed. The age group with the highest labor force participation rate is 35 to 44 years, with 87.3% or 7,579 individuals in the labor force. Within the labor force, the 25 to 29 years age range has the highest percentage of unemployed individuals, with 10.0% or 222 of them being unemployed.
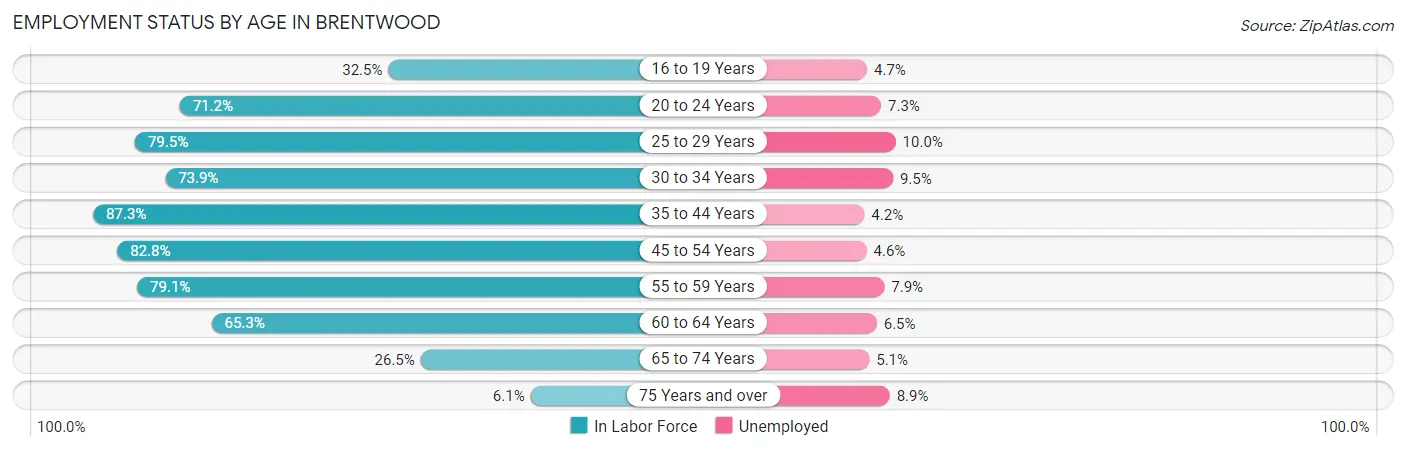
| Age Bracket | In Labor Force | Unemployed |
| 16 to 19 Years | 1,562 (32.5%) | 73 (4.7%) |
| 20 to 24 Years | 2,637 (71.2%) | 193 (7.3%) |
| 25 to 29 Years | 2,222 (79.5%) | 222 (10.0%) |
| 30 to 34 Years | 1,983 (73.9%) | 188 (9.5%) |
| 35 to 44 Years | 7,579 (87.3%) | 318 (4.2%) |
| 45 to 54 Years | 8,439 (82.8%) | 388 (4.6%) |
| 55 to 59 Years | 3,563 (79.1%) | 281 (7.9%) |
| 60 to 64 Years | 2,099 (65.3%) | 136 (6.5%) |
| 65 to 74 Years | 1,389 (26.5%) | 71 (5.1%) |
| 75 Years and over | 278 (6.1%) | 25 (8.9%) |
| Total | 31,743 (63.0%) | 1,905 (6.0%) |
Employment Status by Educational Attainment in Brentwood
According to labor force statistics for Brentwood, 80.7% of individuals (25,882) out of the total population between 25 and 64 years of age (32,072) are in the labor force, with 5.9% or 1,527 of them being unemployed. The group with the highest labor force participation rate are those with the educational attainment of bachelor's degree or higher, with 85.7% or 10,748 individuals in the labor force. Within the labor force, individuals with high school diploma education have the highest percentage of unemployment, with 10.3% or 486 of them being unemployed.
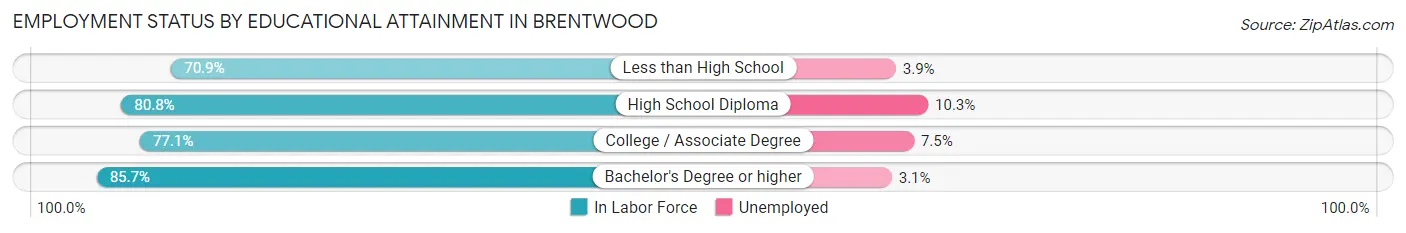
| Educational Attainment | In Labor Force | Unemployed |
| Less than High School | 1,541 (70.9%) | 85 (3.9%) |
| High School Diploma | 4,718 (80.8%) | 601 (10.3%) |
| College / Associate Degree | 8,880 (77.1%) | 864 (7.5%) |
| Bachelor's Degree or higher | 10,748 (85.7%) | 389 (3.1%) |
| Total | 25,882 (80.7%) | 1,892 (5.9%) |
Employment Occupations by Sex in Brentwood
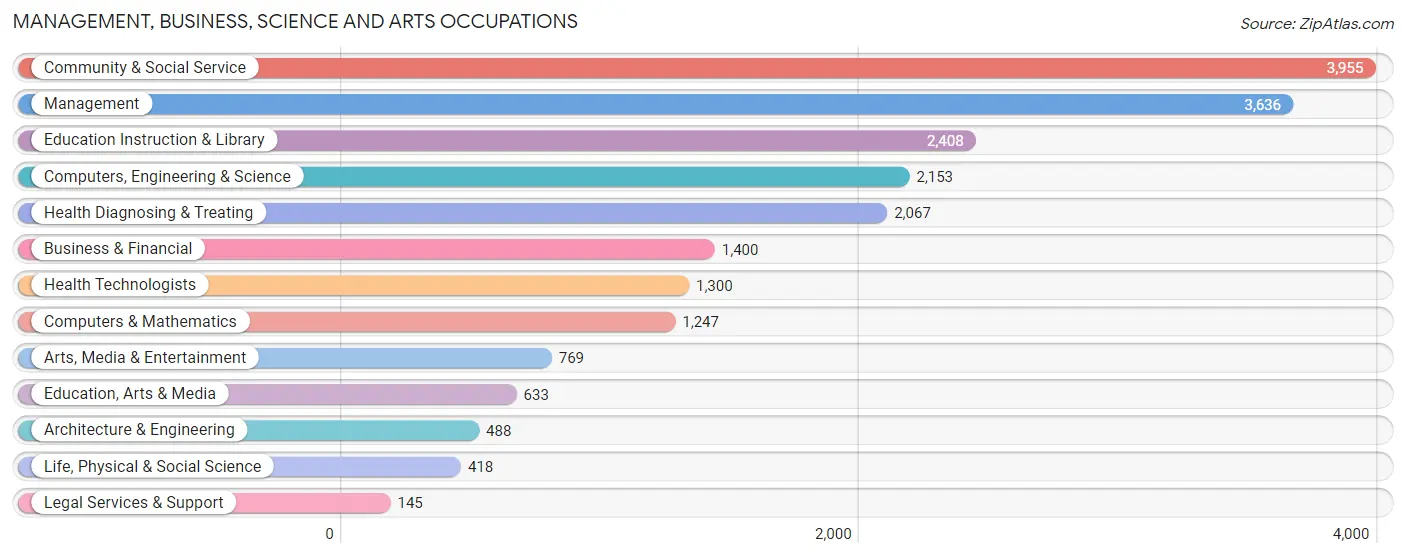
Management, Business, Science and Arts Occupations
The most common Management, Business, Science and Arts occupations in Brentwood are Community & Social Service (3,955 | 13.3%), Management (3,636 | 12.2%), Education Instruction & Library (2,408 | 8.1%), Computers, Engineering & Science (2,153 | 7.2%), and Health Diagnosing & Treating (2,067 | 6.9%).
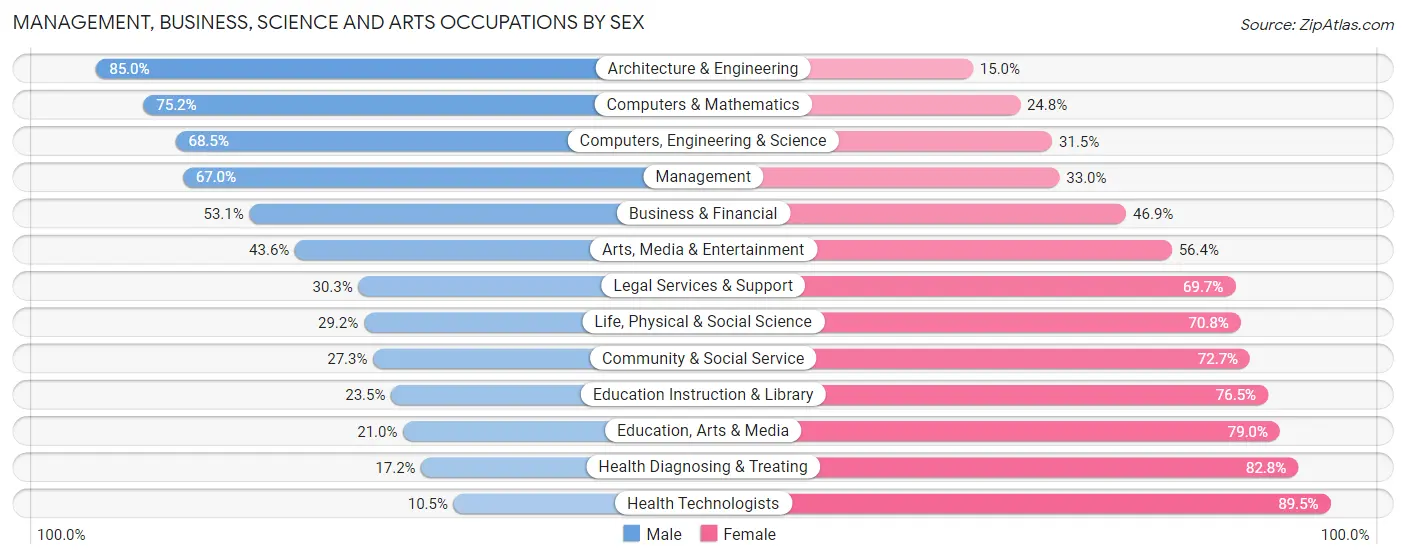
Management, Business, Science and Arts Occupations by Sex
Within the Management, Business, Science and Arts occupations in Brentwood, the most male-oriented occupations are Architecture & Engineering (85.0%), Computers & Mathematics (75.2%), and Computers, Engineering & Science (68.5%), while the most female-oriented occupations are Health Technologists (89.5%), Health Diagnosing & Treating (82.8%), and Education, Arts & Media (79.0%).
| Occupation | Male | Female |
| Management | 2,436 (67.0%) | 1,200 (33.0%) |
| Business & Financial | 743 (53.1%) | 657 (46.9%) |
| Computers, Engineering & Science | 1,475 (68.5%) | 678 (31.5%) |
| Computers & Mathematics | 938 (75.2%) | 309 (24.8%) |
| Architecture & Engineering | 415 (85.0%) | 73 (15.0%) |
| Life, Physical & Social Science | 122 (29.2%) | 296 (70.8%) |
| Community & Social Service | 1,078 (27.3%) | 2,877 (72.7%) |
| Education, Arts & Media | 133 (21.0%) | 500 (79.0%) |
| Legal Services & Support | 44 (30.3%) | 101 (69.7%) |
| Education Instruction & Library | 566 (23.5%) | 1,842 (76.5%) |
| Arts, Media & Entertainment | 335 (43.6%) | 434 (56.4%) |
| Health Diagnosing & Treating | 356 (17.2%) | 1,711 (82.8%) |
| Health Technologists | 136 (10.5%) | 1,164 (89.5%) |
| Total (Category) | 6,088 (46.1%) | 7,123 (53.9%) |
| Total (Overall) | 16,006 (53.6%) | 13,828 (46.4%) |
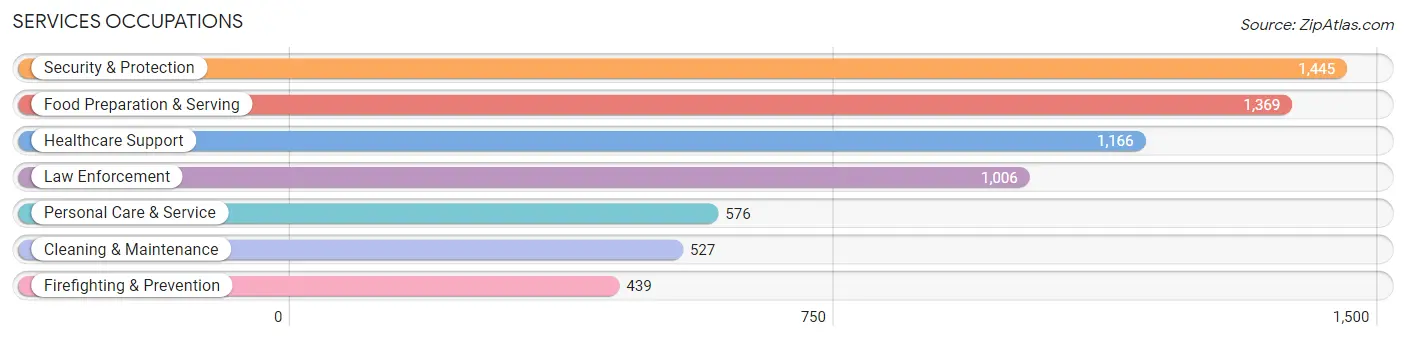
Services Occupations
The most common Services occupations in Brentwood are Security & Protection (1,445 | 4.8%), Food Preparation & Serving (1,369 | 4.6%), Healthcare Support (1,166 | 3.9%), Law Enforcement (1,006 | 3.4%), and Personal Care & Service (576 | 1.9%).
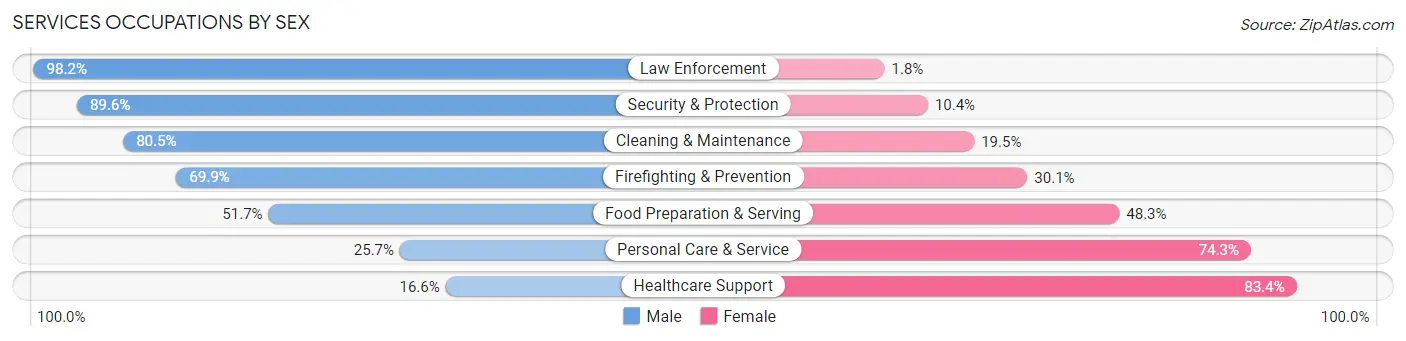
Services Occupations by Sex
Within the Services occupations in Brentwood, the most male-oriented occupations are Law Enforcement (98.2%), Security & Protection (89.6%), and Cleaning & Maintenance (80.5%), while the most female-oriented occupations are Healthcare Support (83.4%), Personal Care & Service (74.3%), and Food Preparation & Serving (48.3%).
| Occupation | Male | Female |
| Healthcare Support | 194 (16.6%) | 972 (83.4%) |
| Security & Protection | 1,295 (89.6%) | 150 (10.4%) |
| Firefighting & Prevention | 307 (69.9%) | 132 (30.1%) |
| Law Enforcement | 988 (98.2%) | 18 (1.8%) |
| Food Preparation & Serving | 708 (51.7%) | 661 (48.3%) |
| Cleaning & Maintenance | 424 (80.5%) | 103 (19.5%) |
| Personal Care & Service | 148 (25.7%) | 428 (74.3%) |
| Total (Category) | 2,769 (54.5%) | 2,314 (45.5%) |
| Total (Overall) | 16,006 (53.6%) | 13,828 (46.4%) |
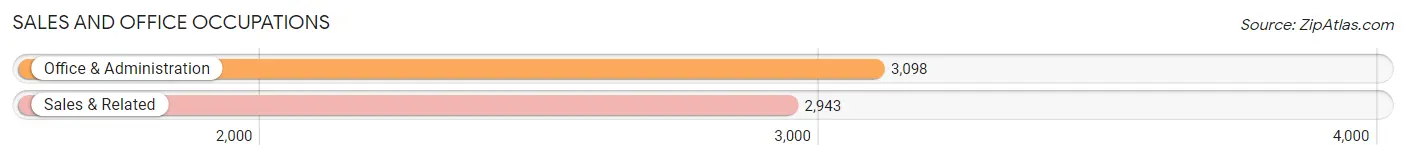
Sales and Office Occupations
The most common Sales and Office occupations in Brentwood are Office & Administration (3,098 | 10.4%), and Sales & Related (2,943 | 9.9%).
Sales and Office Occupations by Sex
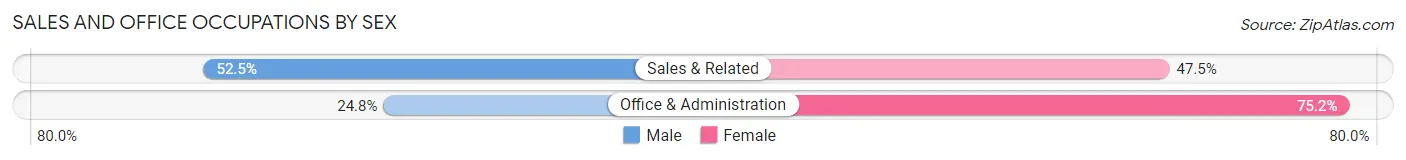
| Occupation | Male | Female |
| Sales & Related | 1,544 (52.5%) | 1,399 (47.5%) |
| Office & Administration | 769 (24.8%) | 2,329 (75.2%) |
| Total (Category) | 2,313 (38.3%) | 3,728 (61.7%) |
| Total (Overall) | 16,006 (53.6%) | 13,828 (46.4%) |
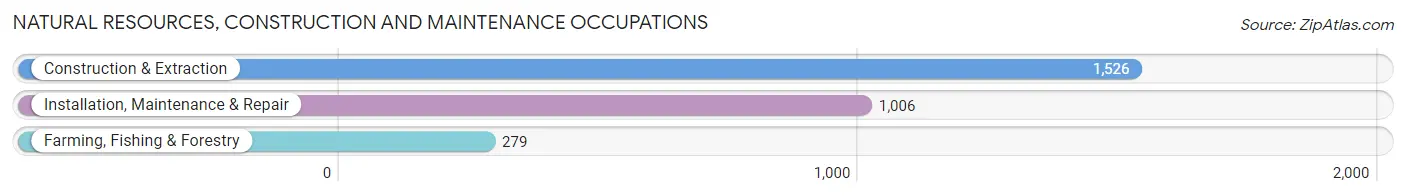
Natural Resources, Construction and Maintenance Occupations
The most common Natural Resources, Construction and Maintenance occupations in Brentwood are Construction & Extraction (1,526 | 5.1%), Installation, Maintenance & Repair (1,006 | 3.4%), and Farming, Fishing & Forestry (279 | 0.9%).
Natural Resources, Construction and Maintenance Occupations by Sex
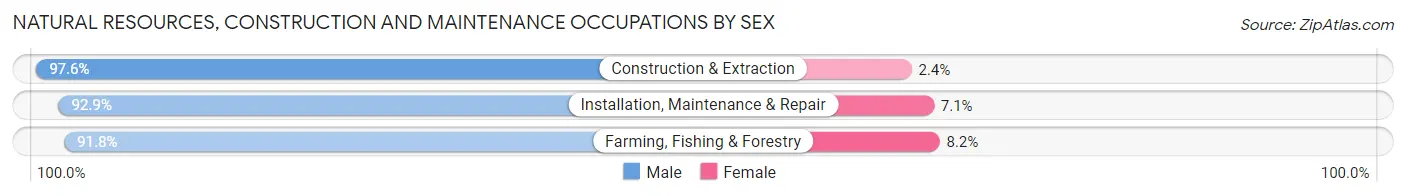
| Occupation | Male | Female |
| Farming, Fishing & Forestry | 256 (91.8%) | 23 (8.2%) |
| Construction & Extraction | 1,489 (97.6%) | 37 (2.4%) |
| Installation, Maintenance & Repair | 935 (92.9%) | 71 (7.1%) |
| Total (Category) | 2,680 (95.3%) | 131 (4.7%) |
| Total (Overall) | 16,006 (53.6%) | 13,828 (46.4%) |
Production, Transportation and Moving Occupations
The most common Production, Transportation and Moving occupations in Brentwood are Transportation (1,182 | 4.0%), Material Moving (957 | 3.2%), and Production (549 | 1.8%).
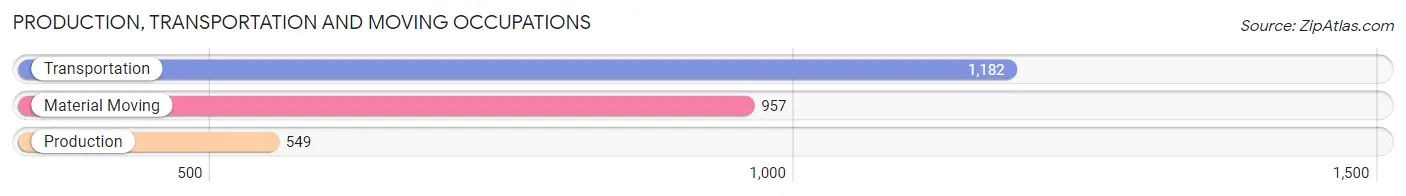
Production, Transportation and Moving Occupations by Sex
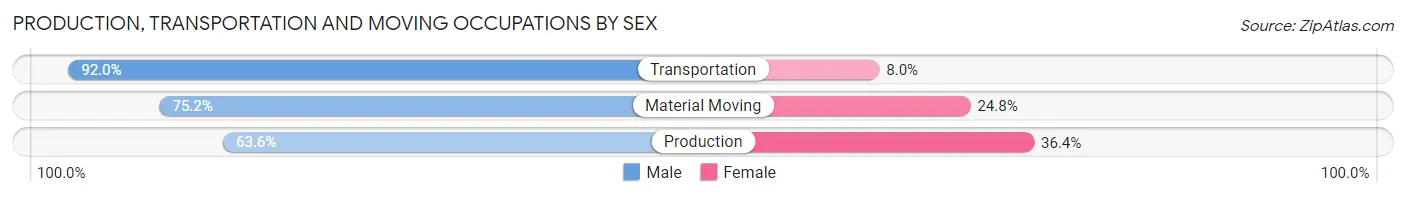
| Occupation | Male | Female |
| Production | 349 (63.6%) | 200 (36.4%) |
| Transportation | 1,087 (92.0%) | 95 (8.0%) |
| Material Moving | 720 (75.2%) | 237 (24.8%) |
| Total (Category) | 2,156 (80.2%) | 532 (19.8%) |
| Total (Overall) | 16,006 (53.6%) | 13,828 (46.4%) |
Employment Industries by Sex in Brentwood
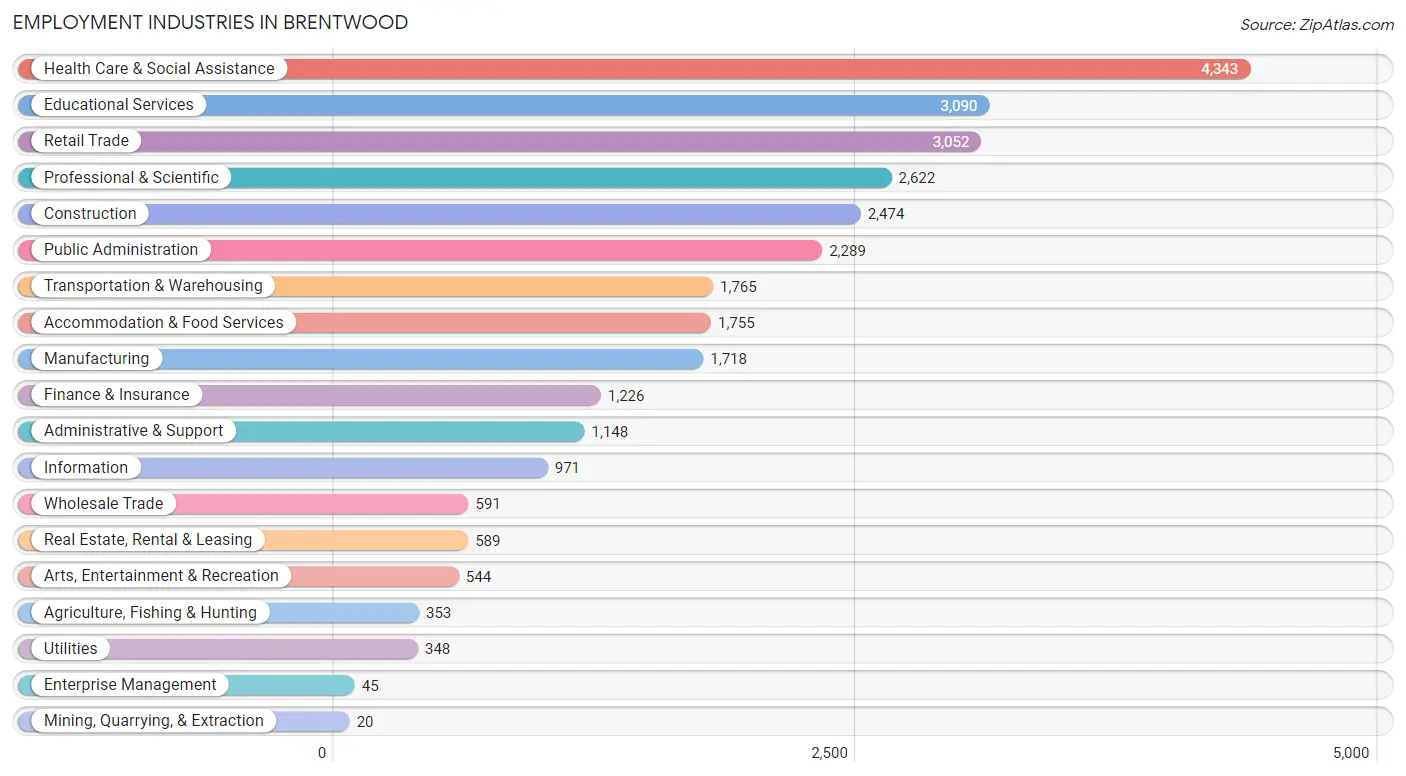
Employment Industries in Brentwood
The major employment industries in Brentwood include Health Care & Social Assistance (4,343 | 14.6%), Educational Services (3,090 | 10.4%), Retail Trade (3,052 | 10.2%), Professional & Scientific (2,622 | 8.8%), and Construction (2,474 | 8.3%).
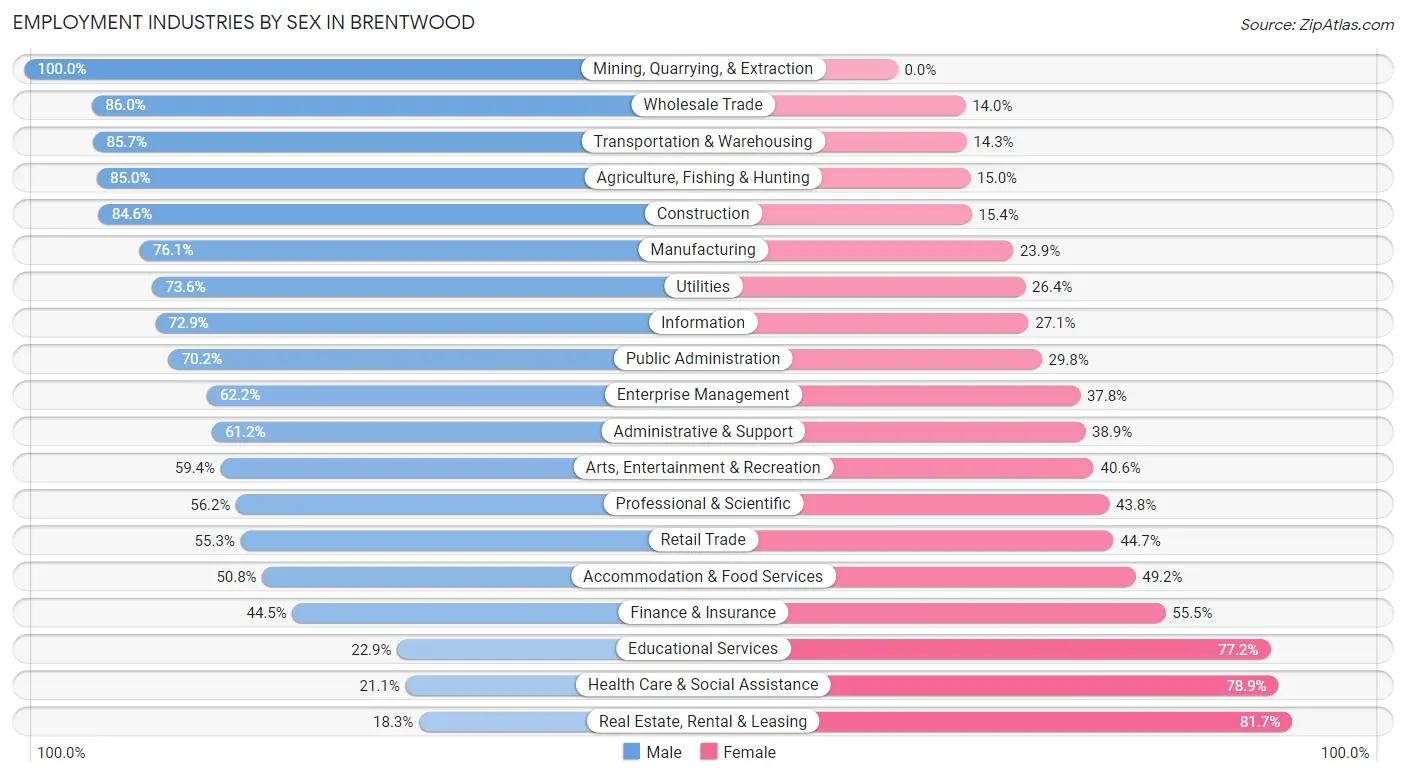
Employment Industries by Sex in Brentwood
The Brentwood industries that see more men than women are Mining, Quarrying, & Extraction (100.0%), Wholesale Trade (86.0%), and Transportation & Warehousing (85.7%), whereas the industries that tend to have a higher number of women are Real Estate, Rental & Leasing (81.7%), Health Care & Social Assistance (78.9%), and Educational Services (77.1%).
| Industry | Male | Female |
| Agriculture, Fishing & Hunting | 300 (85.0%) | 53 (15.0%) |
| Mining, Quarrying, & Extraction | 20 (100.0%) | 0 (0.0%) |
| Construction | 2,094 (84.6%) | 380 (15.4%) |
| Manufacturing | 1,307 (76.1%) | 411 (23.9%) |
| Wholesale Trade | 508 (86.0%) | 83 (14.0%) |
| Retail Trade | 1,687 (55.3%) | 1,365 (44.7%) |
| Transportation & Warehousing | 1,513 (85.7%) | 252 (14.3%) |
| Utilities | 256 (73.6%) | 92 (26.4%) |
| Information | 708 (72.9%) | 263 (27.1%) |
| Finance & Insurance | 546 (44.5%) | 680 (55.5%) |
| Real Estate, Rental & Leasing | 108 (18.3%) | 481 (81.7%) |
| Professional & Scientific | 1,473 (56.2%) | 1,149 (43.8%) |
| Enterprise Management | 28 (62.2%) | 17 (37.8%) |
| Administrative & Support | 702 (61.2%) | 446 (38.9%) |
| Educational Services | 706 (22.9%) | 2,384 (77.1%) |
| Health Care & Social Assistance | 918 (21.1%) | 3,425 (78.9%) |
| Arts, Entertainment & Recreation | 323 (59.4%) | 221 (40.6%) |
| Accommodation & Food Services | 891 (50.8%) | 864 (49.2%) |
| Public Administration | 1,606 (70.2%) | 683 (29.8%) |
| Total | 16,006 (53.6%) | 13,828 (46.4%) |
Education in Brentwood
School Enrollment in Brentwood
The most common levels of schooling among the 19,495 students in Brentwood are high school (5,708 | 29.3%), middle school (4,144 | 21.3%), and college / undergraduate (3,818 | 19.6%).
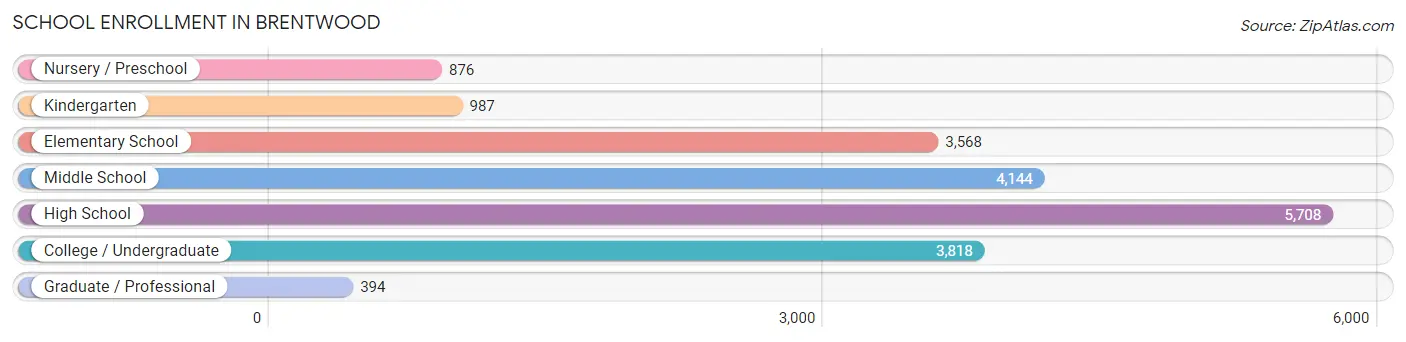
| School Level | # Students | % Students |
| Nursery / Preschool | 876 | 4.5% |
| Kindergarten | 987 | 5.1% |
| Elementary School | 3,568 | 18.3% |
| Middle School | 4,144 | 21.3% |
| High School | 5,708 | 29.3% |
| College / Undergraduate | 3,818 | 19.6% |
| Graduate / Professional | 394 | 2.0% |
| Total | 19,495 | 100.0% |
School Enrollment by Age by Funding Source in Brentwood
Out of a total of 19,495 students who are enrolled in schools in Brentwood, 2,086 (10.7%) attend a private institution, while the remaining 17,409 (89.3%) are enrolled in public schools. The age group of 3 to 4 year olds has the highest likelihood of being enrolled in private schools, with 276 (51.4% in the age bracket) enrolled. Conversely, the age group of 10 to 14 year olds has the lowest likelihood of being enrolled in a private school, with 5,490 (94.6% in the age bracket) attending a public institution.
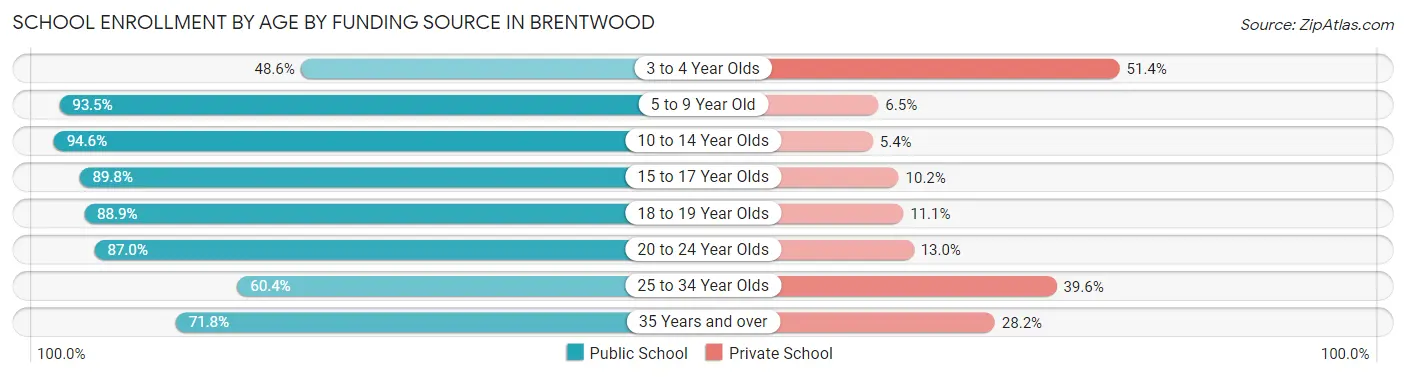
| Age Bracket | Public School | Private School |
| 3 to 4 Year Olds | 261 (48.6%) | 276 (51.4%) |
| 5 to 9 Year Old | 4,190 (93.5%) | 290 (6.5%) |
| 10 to 14 Year Olds | 5,490 (94.6%) | 315 (5.4%) |
| 15 to 17 Year Olds | 3,379 (89.8%) | 385 (10.2%) |
| 18 to 19 Year Olds | 1,770 (88.9%) | 221 (11.1%) |
| 20 to 24 Year Olds | 1,507 (87.0%) | 226 (13.0%) |
| 25 to 34 Year Olds | 201 (60.4%) | 132 (39.6%) |
| 35 Years and over | 612 (71.8%) | 240 (28.2%) |
| Total | 17,409 (89.3%) | 2,086 (10.7%) |
Educational Attainment by Field of Study in Brentwood
Business (3,222 | 19.2%), science & technology (2,019 | 12.0%), arts & humanities (1,469 | 8.7%), engineering (1,260 | 7.5%), and social sciences (1,200 | 7.1%) are the most common fields of study among 16,800 individuals in Brentwood who have obtained a bachelor's degree or higher.
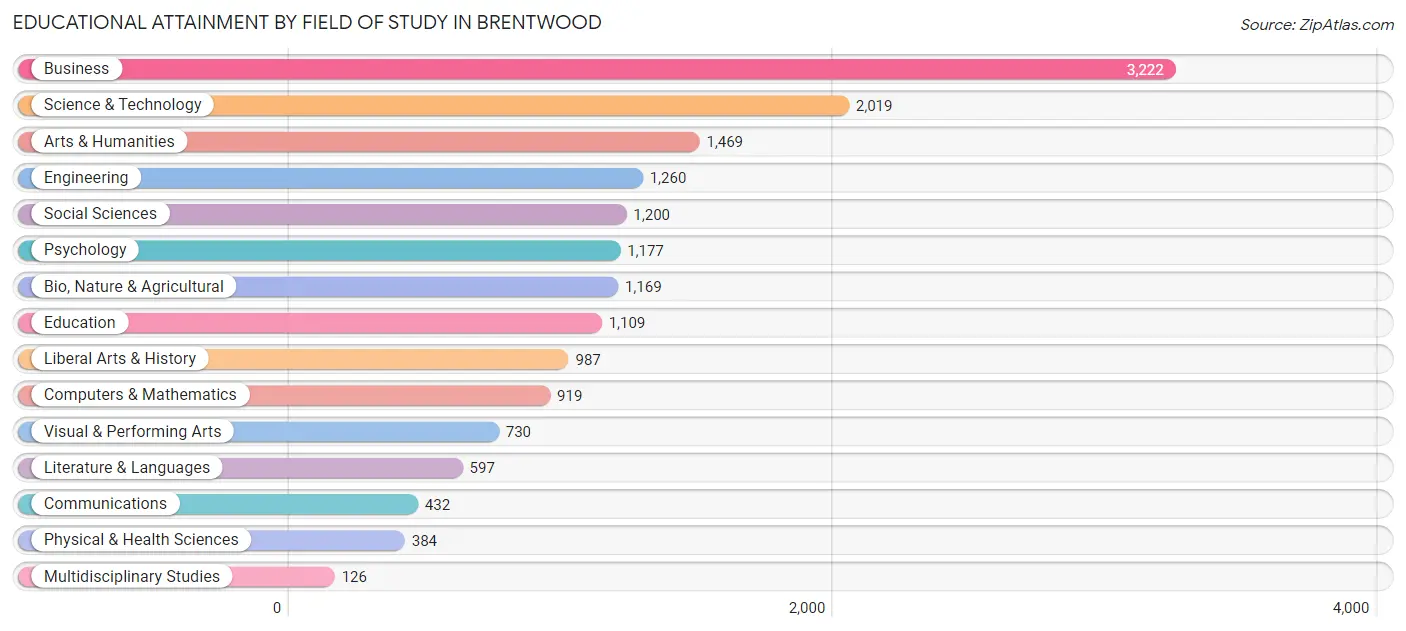
| Field of Study | # Graduates | % Graduates |
| Computers & Mathematics | 919 | 5.5% |
| Bio, Nature & Agricultural | 1,169 | 7.0% |
| Physical & Health Sciences | 384 | 2.3% |
| Psychology | 1,177 | 7.0% |
| Social Sciences | 1,200 | 7.1% |
| Engineering | 1,260 | 7.5% |
| Multidisciplinary Studies | 126 | 0.7% |
| Science & Technology | 2,019 | 12.0% |
| Business | 3,222 | 19.2% |
| Education | 1,109 | 6.6% |
| Literature & Languages | 597 | 3.5% |
| Liberal Arts & History | 987 | 5.9% |
| Visual & Performing Arts | 730 | 4.3% |
| Communications | 432 | 2.6% |
| Arts & Humanities | 1,469 | 8.7% |
| Total | 16,800 | 100.0% |
Transportation & Commute in Brentwood
Vehicle Availability by Sex in Brentwood
The most prevalent vehicle ownership categories in Brentwood are males with 3 vehicles (5,381, accounting for 34.6%) and females with 3 vehicles (4,156, making up 39.7%).
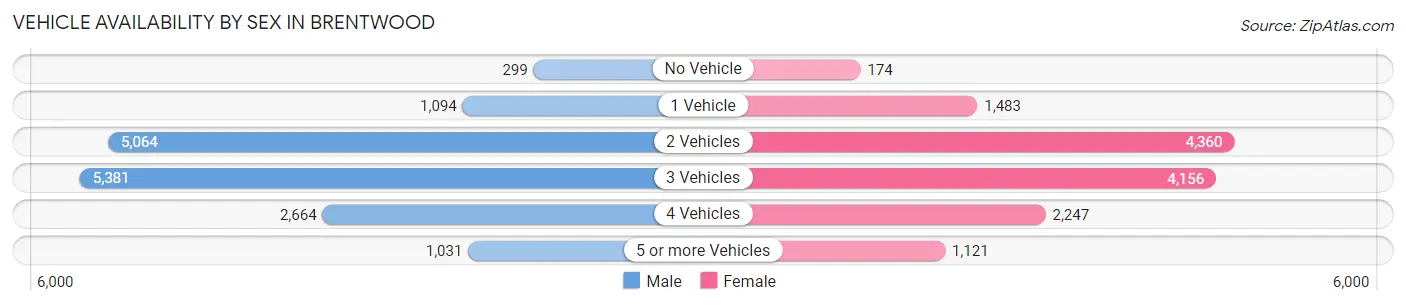
| Vehicles Available | Male | Female |
| No Vehicle | 299 (1.9%) | 174 (1.3%) |
| 1 Vehicle | 1,094 (7.0%) | 1,483 (11.0%) |
| 2 Vehicles | 5,064 (32.6%) | 4,360 (32.2%) |
| 3 Vehicles | 5,381 (34.6%) | 4,156 (30.7%) |
| 4 Vehicles | 2,664 (17.2%) | 2,247 (16.6%) |
| 5 or more Vehicles | 1,031 (6.6%) | 1,121 (8.3%) |
| Total | 15,533 (100.0%) | 13,541 (100.0%) |
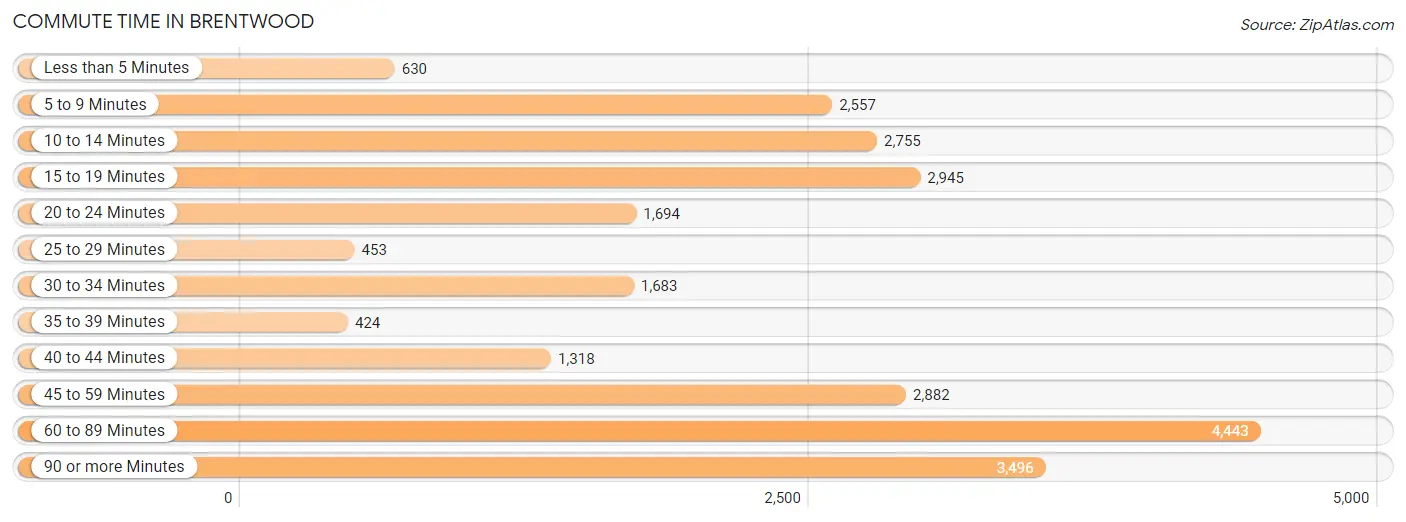
Commute Time in Brentwood
The most frequently occuring commute durations in Brentwood are 60 to 89 minutes (4,443 commuters, 17.6%), 90 or more minutes (3,496 commuters, 13.8%), and 15 to 19 minutes (2,945 commuters, 11.7%).
| Commute Time | # Commuters | % Commuters |
| Less than 5 Minutes | 630 | 2.5% |
| 5 to 9 Minutes | 2,557 | 10.1% |
| 10 to 14 Minutes | 2,755 | 10.9% |
| 15 to 19 Minutes | 2,945 | 11.7% |
| 20 to 24 Minutes | 1,694 | 6.7% |
| 25 to 29 Minutes | 453 | 1.8% |
| 30 to 34 Minutes | 1,683 | 6.7% |
| 35 to 39 Minutes | 424 | 1.7% |
| 40 to 44 Minutes | 1,318 | 5.2% |
| 45 to 59 Minutes | 2,882 | 11.4% |
| 60 to 89 Minutes | 4,443 | 17.6% |
| 90 or more Minutes | 3,496 | 13.8% |
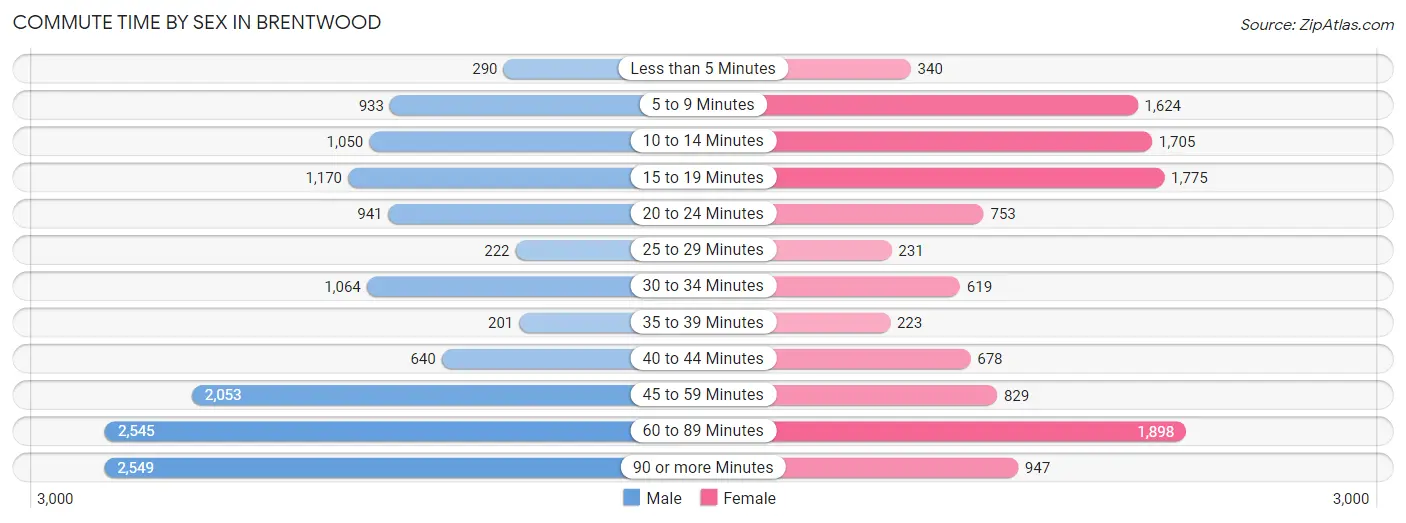
Commute Time by Sex in Brentwood
The most common commute times in Brentwood are 90 or more minutes (2,549 commuters, 18.7%) for males and 60 to 89 minutes (1,898 commuters, 16.3%) for females.
| Commute Time | Male | Female |
| Less than 5 Minutes | 290 (2.1%) | 340 (2.9%) |
| 5 to 9 Minutes | 933 (6.8%) | 1,624 (14.0%) |
| 10 to 14 Minutes | 1,050 (7.7%) | 1,705 (14.7%) |
| 15 to 19 Minutes | 1,170 (8.6%) | 1,775 (15.3%) |
| 20 to 24 Minutes | 941 (6.9%) | 753 (6.5%) |
| 25 to 29 Minutes | 222 (1.6%) | 231 (2.0%) |
| 30 to 34 Minutes | 1,064 (7.8%) | 619 (5.3%) |
| 35 to 39 Minutes | 201 (1.5%) | 223 (1.9%) |
| 40 to 44 Minutes | 640 (4.7%) | 678 (5.8%) |
| 45 to 59 Minutes | 2,053 (15.0%) | 829 (7.1%) |
| 60 to 89 Minutes | 2,545 (18.6%) | 1,898 (16.3%) |
| 90 or more Minutes | 2,549 (18.7%) | 947 (8.2%) |
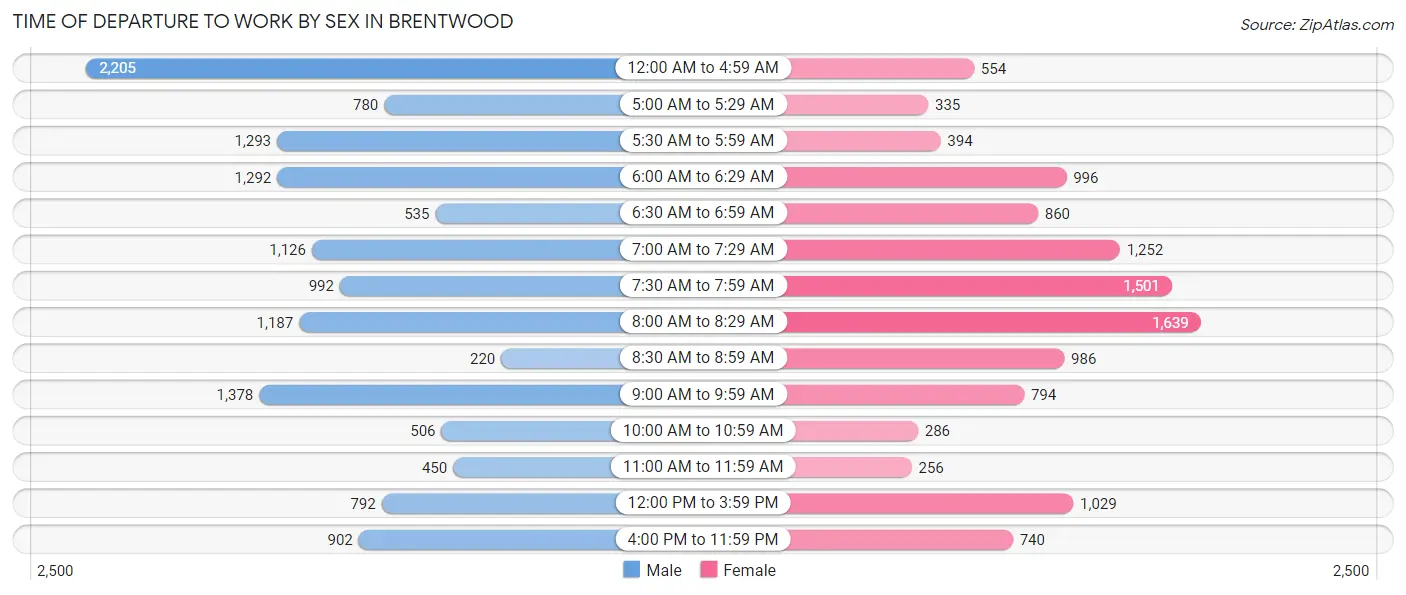
Time of Departure to Work by Sex in Brentwood
The most frequent times of departure to work in Brentwood are 12:00 AM to 4:59 AM (2,205, 16.1%) for males and 8:00 AM to 8:29 AM (1,639, 14.1%) for females.
| Time of Departure | Male | Female |
| 12:00 AM to 4:59 AM | 2,205 (16.1%) | 554 (4.8%) |
| 5:00 AM to 5:29 AM | 780 (5.7%) | 335 (2.9%) |
| 5:30 AM to 5:59 AM | 1,293 (9.5%) | 394 (3.4%) |
| 6:00 AM to 6:29 AM | 1,292 (9.5%) | 996 (8.6%) |
| 6:30 AM to 6:59 AM | 535 (3.9%) | 860 (7.4%) |
| 7:00 AM to 7:29 AM | 1,126 (8.2%) | 1,252 (10.8%) |
| 7:30 AM to 7:59 AM | 992 (7.3%) | 1,501 (12.9%) |
| 8:00 AM to 8:29 AM | 1,187 (8.7%) | 1,639 (14.1%) |
| 8:30 AM to 8:59 AM | 220 (1.6%) | 986 (8.5%) |
| 9:00 AM to 9:59 AM | 1,378 (10.1%) | 794 (6.8%) |
| 10:00 AM to 10:59 AM | 506 (3.7%) | 286 (2.5%) |
| 11:00 AM to 11:59 AM | 450 (3.3%) | 256 (2.2%) |
| 12:00 PM to 3:59 PM | 792 (5.8%) | 1,029 (8.8%) |
| 4:00 PM to 11:59 PM | 902 (6.6%) | 740 (6.4%) |
| Total | 13,658 (100.0%) | 11,622 (100.0%) |
Housing Occupancy in Brentwood
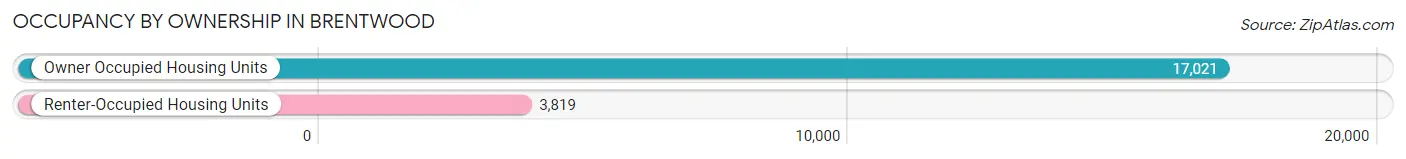
Occupancy by Ownership in Brentwood
Of the total 20,840 dwellings in Brentwood, owner-occupied units account for 17,021 (81.7%), while renter-occupied units make up 3,819 (18.3%).
| Occupancy | # Housing Units | % Housing Units |
| Owner Occupied Housing Units | 17,021 | 81.7% |
| Renter-Occupied Housing Units | 3,819 | 18.3% |
| Total Occupied Housing Units | 20,840 | 100.0% |
Occupancy by Household Size in Brentwood
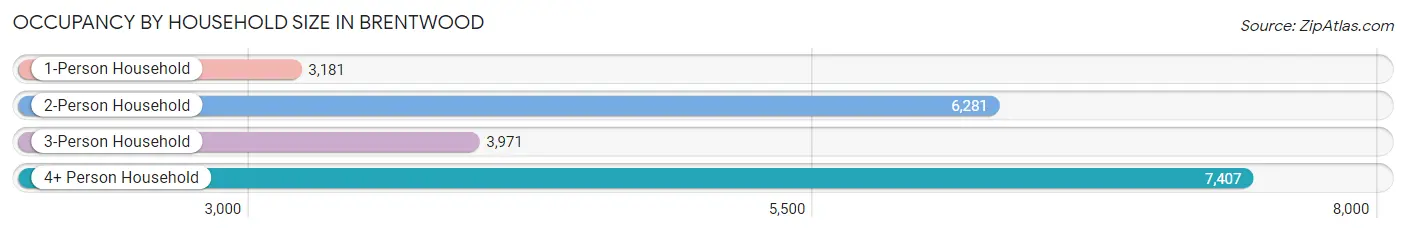
| Household Size | # Housing Units | % Housing Units |
| 1-Person Household | 3,181 | 15.3% |
| 2-Person Household | 6,281 | 30.1% |
| 3-Person Household | 3,971 | 19.1% |
| 4+ Person Household | 7,407 | 35.5% |
| Total Housing Units | 20,840 | 100.0% |
Occupancy by Ownership by Household Size in Brentwood
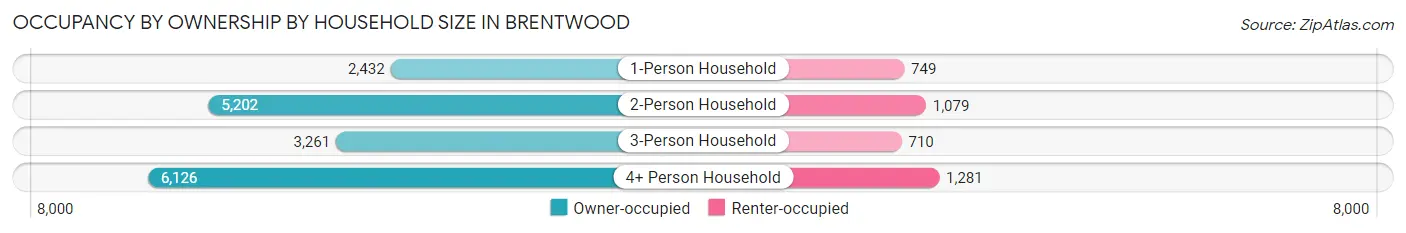
| Household Size | Owner-occupied | Renter-occupied |
| 1-Person Household | 2,432 (76.4%) | 749 (23.5%) |
| 2-Person Household | 5,202 (82.8%) | 1,079 (17.2%) |
| 3-Person Household | 3,261 (82.1%) | 710 (17.9%) |
| 4+ Person Household | 6,126 (82.7%) | 1,281 (17.3%) |
| Total Housing Units | 17,021 (81.7%) | 3,819 (18.3%) |
Occupancy by Educational Attainment in Brentwood
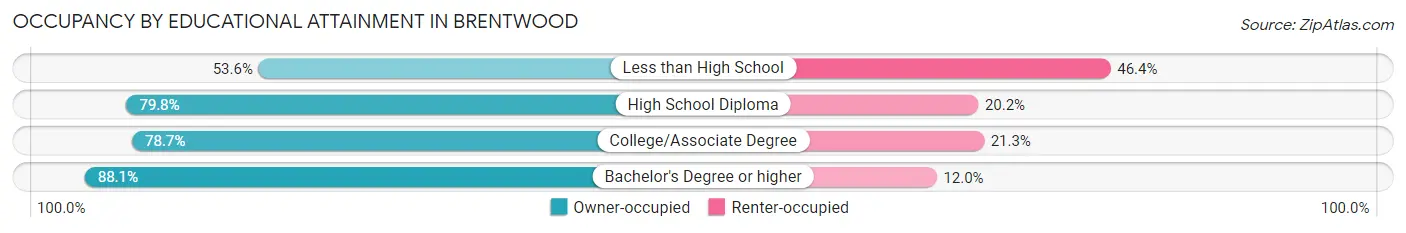
| Household Size | Owner-occupied | Renter-occupied |
| Less than High School | 516 (53.6%) | 447 (46.4%) |
| High School Diploma | 2,879 (79.8%) | 728 (20.2%) |
| College/Associate Degree | 5,879 (78.7%) | 1,593 (21.3%) |
| Bachelor's Degree or higher | 7,747 (88.0%) | 1,051 (11.9%) |
Occupancy by Age of Householder in Brentwood
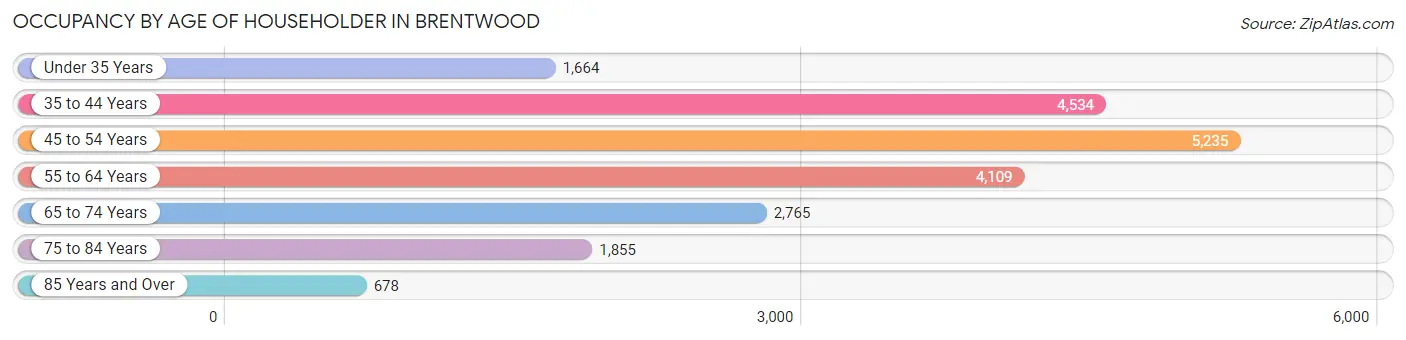
| Age Bracket | # Households | % Households |
| Under 35 Years | 1,664 | 8.0% |
| 35 to 44 Years | 4,534 | 21.8% |
| 45 to 54 Years | 5,235 | 25.1% |
| 55 to 64 Years | 4,109 | 19.7% |
| 65 to 74 Years | 2,765 | 13.3% |
| 75 to 84 Years | 1,855 | 8.9% |
| 85 Years and Over | 678 | 3.3% |
| Total | 20,840 | 100.0% |
Housing Finances in Brentwood
Median Income by Occupancy in Brentwood
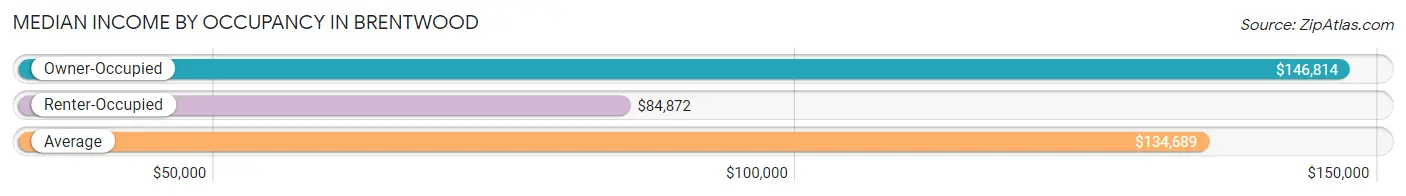
| Occupancy Type | # Households | Median Income |
| Owner-Occupied | 17,021 (81.7%) | $146,814 |
| Renter-Occupied | 3,819 (18.3%) | $84,872 |
| Average | 20,840 (100.0%) | $134,689 |
Occupancy by Householder Income Bracket in Brentwood
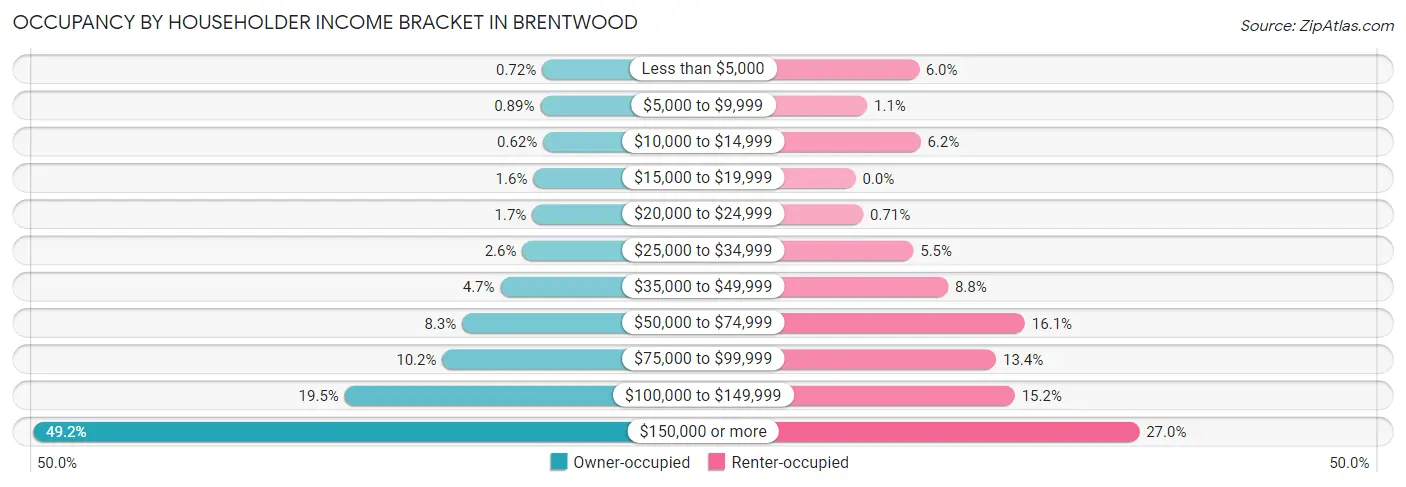
| Income Bracket | Owner-occupied | Renter-occupied |
| Less than $5,000 | 123 (0.7%) | 230 (6.0%) |
| $5,000 to $9,999 | 152 (0.9%) | 42 (1.1%) |
| $10,000 to $14,999 | 106 (0.6%) | 236 (6.2%) |
| $15,000 to $19,999 | 265 (1.6%) | 0 (0.0%) |
| $20,000 to $24,999 | 282 (1.7%) | 27 (0.7%) |
| $25,000 to $34,999 | 442 (2.6%) | 210 (5.5%) |
| $35,000 to $49,999 | 799 (4.7%) | 336 (8.8%) |
| $50,000 to $74,999 | 1,419 (8.3%) | 616 (16.1%) |
| $75,000 to $99,999 | 1,739 (10.2%) | 511 (13.4%) |
| $100,000 to $149,999 | 3,323 (19.5%) | 579 (15.2%) |
| $150,000 or more | 8,371 (49.2%) | 1,032 (27.0%) |
| Total | 17,021 (100.0%) | 3,819 (100.0%) |
Monthly Housing Cost Tiers in Brentwood
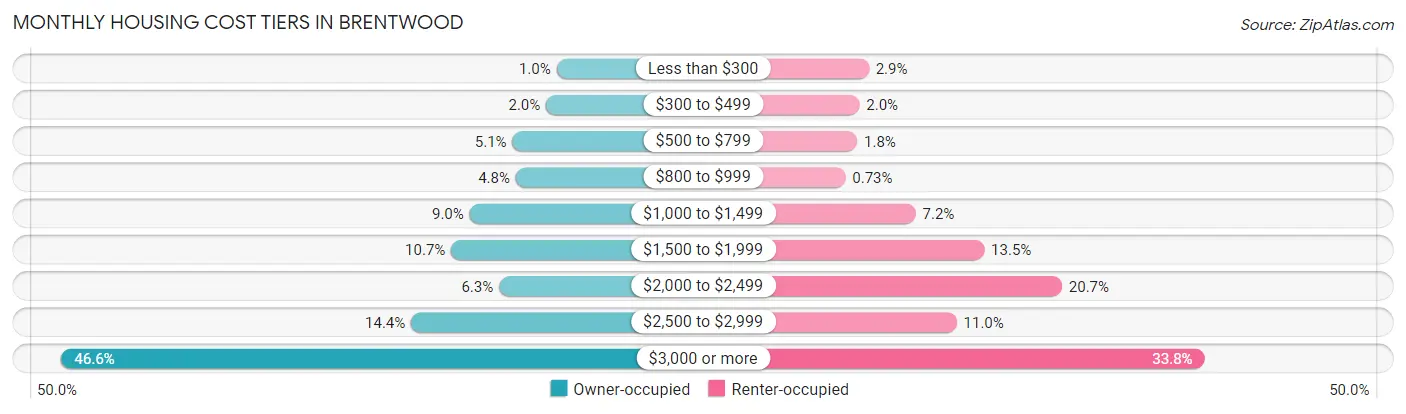
| Monthly Cost | Owner-occupied | Renter-occupied |
| Less than $300 | 175 (1.0%) | 110 (2.9%) |
| $300 to $499 | 338 (2.0%) | 77 (2.0%) |
| $500 to $799 | 867 (5.1%) | 69 (1.8%) |
| $800 to $999 | 813 (4.8%) | 28 (0.7%) |
| $1,000 to $1,499 | 1,537 (9.0%) | 275 (7.2%) |
| $1,500 to $1,999 | 1,827 (10.7%) | 516 (13.5%) |
| $2,000 to $2,499 | 1,076 (6.3%) | 789 (20.7%) |
| $2,500 to $2,999 | 2,454 (14.4%) | 419 (11.0%) |
| $3,000 or more | 7,934 (46.6%) | 1,290 (33.8%) |
| Total | 17,021 (100.0%) | 3,819 (100.0%) |
Physical Housing Characteristics in Brentwood
Housing Structures in Brentwood
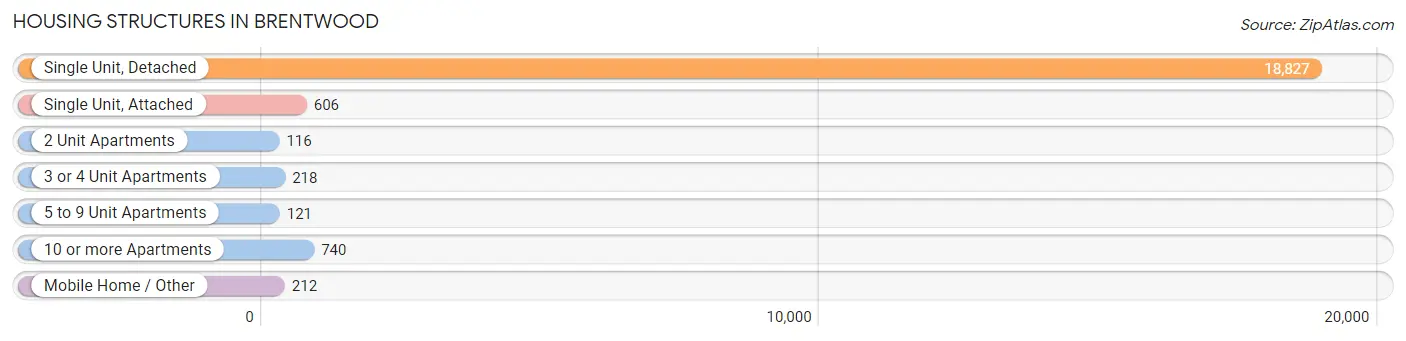
| Structure Type | # Housing Units | % Housing Units |
| Single Unit, Detached | 18,827 | 90.3% |
| Single Unit, Attached | 606 | 2.9% |
| 2 Unit Apartments | 116 | 0.6% |
| 3 or 4 Unit Apartments | 218 | 1.1% |
| 5 to 9 Unit Apartments | 121 | 0.6% |
| 10 or more Apartments | 740 | 3.5% |
| Mobile Home / Other | 212 | 1.0% |
| Total | 20,840 | 100.0% |
Housing Structures by Occupancy in Brentwood
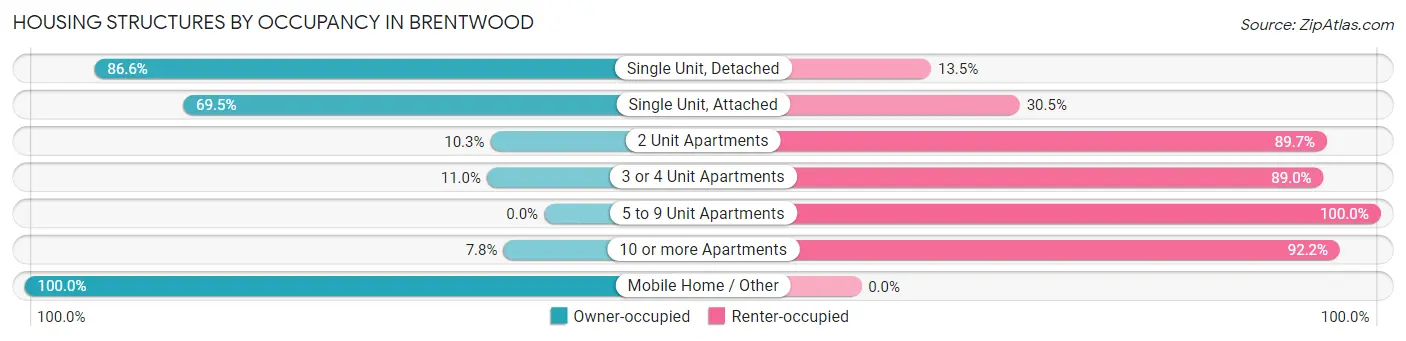
| Structure Type | Owner-occupied | Renter-occupied |
| Single Unit, Detached | 16,294 (86.6%) | 2,533 (13.5%) |
| Single Unit, Attached | 421 (69.5%) | 185 (30.5%) |
| 2 Unit Apartments | 12 (10.3%) | 104 (89.7%) |
| 3 or 4 Unit Apartments | 24 (11.0%) | 194 (89.0%) |
| 5 to 9 Unit Apartments | 0 (0.0%) | 121 (100.0%) |
| 10 or more Apartments | 58 (7.8%) | 682 (92.2%) |
| Mobile Home / Other | 212 (100.0%) | 0 (0.0%) |
| Total | 17,021 (81.7%) | 3,819 (18.3%) |
Housing Structures by Number of Rooms in Brentwood
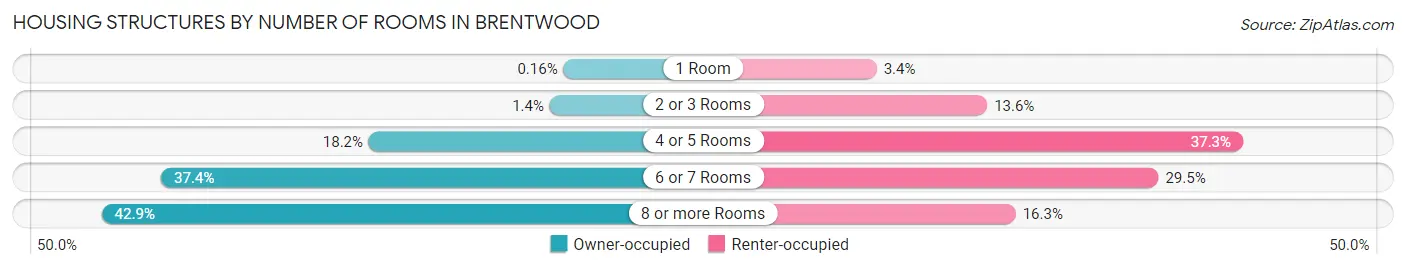
| Number of Rooms | Owner-occupied | Renter-occupied |
| 1 Room | 28 (0.2%) | 130 (3.4%) |
| 2 or 3 Rooms | 243 (1.4%) | 520 (13.6%) |
| 4 or 5 Rooms | 3,091 (18.2%) | 1,423 (37.3%) |
| 6 or 7 Rooms | 6,362 (37.4%) | 1,125 (29.5%) |
| 8 or more Rooms | 7,297 (42.9%) | 621 (16.3%) |
| Total | 17,021 (100.0%) | 3,819 (100.0%) |
Housing Structure by Heating Type in Brentwood
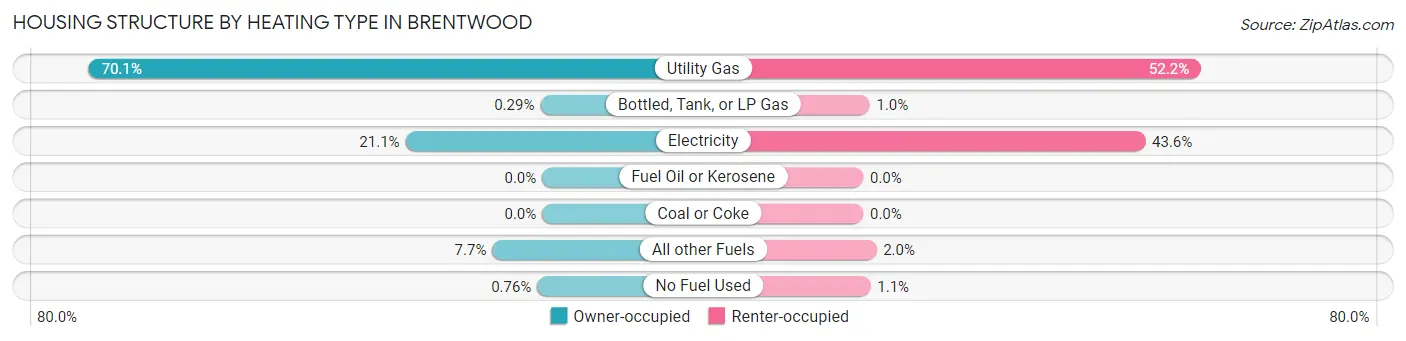
| Heating Type | Owner-occupied | Renter-occupied |
| Utility Gas | 11,933 (70.1%) | 1,995 (52.2%) |
| Bottled, Tank, or LP Gas | 49 (0.3%) | 38 (1.0%) |
| Electricity | 3,597 (21.1%) | 1,665 (43.6%) |
| Fuel Oil or Kerosene | 0 (0.0%) | 0 (0.0%) |
| Coal or Coke | 0 (0.0%) | 0 (0.0%) |
| All other Fuels | 1,312 (7.7%) | 78 (2.0%) |
| No Fuel Used | 130 (0.8%) | 43 (1.1%) |
| Total | 17,021 (100.0%) | 3,819 (100.0%) |
Household Vehicle Usage in Brentwood
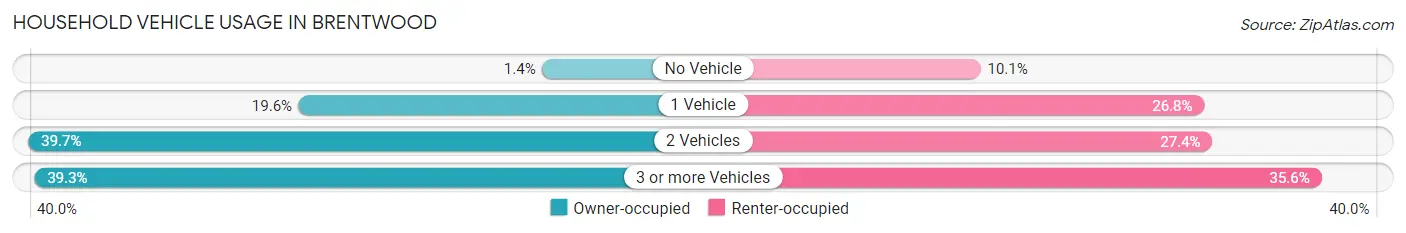
| Vehicles per Household | Owner-occupied | Renter-occupied |
| No Vehicle | 238 (1.4%) | 387 (10.1%) |
| 1 Vehicle | 3,334 (19.6%) | 1,025 (26.8%) |
| 2 Vehicles | 6,764 (39.7%) | 1,048 (27.4%) |
| 3 or more Vehicles | 6,685 (39.3%) | 1,359 (35.6%) |
| Total | 17,021 (100.0%) | 3,819 (100.0%) |
Real Estate & Mortgages in Brentwood
Real Estate and Mortgage Overview in Brentwood
| Characteristic | Without Mortgage | With Mortgage |
| Housing Units | 3,786 | 13,235 |
| Median Property Value | $708,900 | $742,900 |
| Median Household Income | $92,991 | $7,212 |
| Monthly Housing Costs | $968 | $7,903 |
| Real Estate Taxes | $6,532 | $106 |
Property Value by Mortgage Status in Brentwood
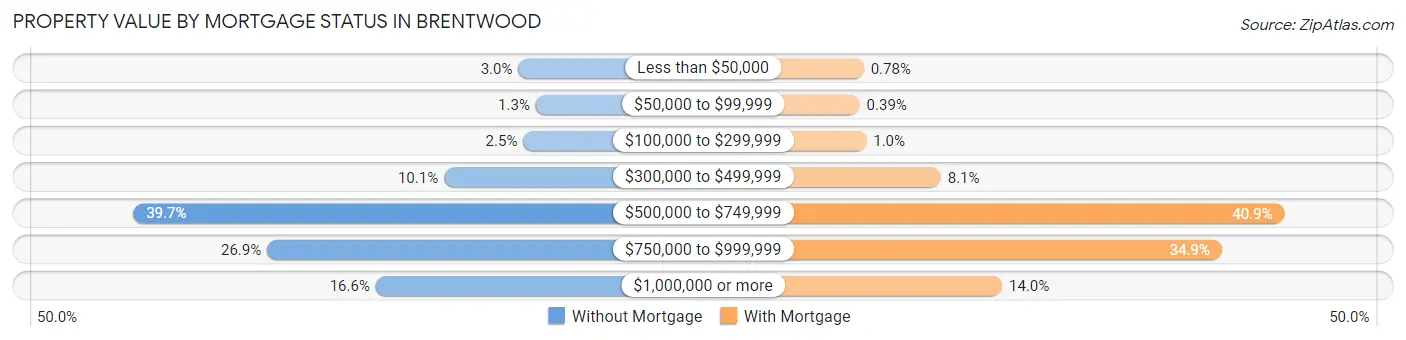
| Property Value | Without Mortgage | With Mortgage |
| Less than $50,000 | 113 (3.0%) | 103 (0.8%) |
| $50,000 to $99,999 | 50 (1.3%) | 52 (0.4%) |
| $100,000 to $299,999 | 95 (2.5%) | 135 (1.0%) |
| $300,000 to $499,999 | 381 (10.1%) | 1,075 (8.1%) |
| $500,000 to $749,999 | 1,501 (39.7%) | 5,406 (40.8%) |
| $750,000 to $999,999 | 1,019 (26.9%) | 4,616 (34.9%) |
| $1,000,000 or more | 627 (16.6%) | 1,848 (14.0%) |
| Total | 3,786 (100.0%) | 13,235 (100.0%) |
Household Income by Mortgage Status in Brentwood
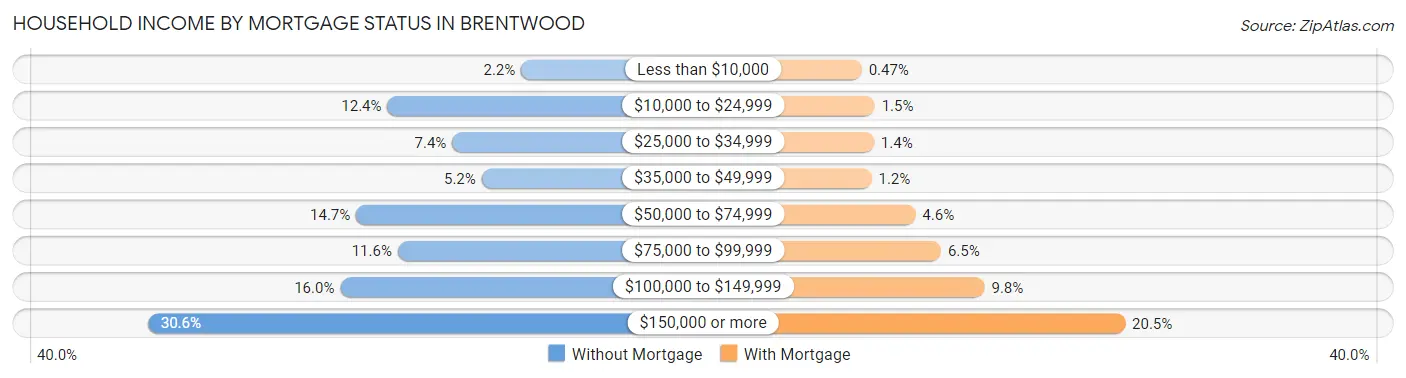
| Household Income | Without Mortgage | With Mortgage |
| Less than $10,000 | 82 (2.2%) | 62 (0.5%) |
| $10,000 to $24,999 | 468 (12.4%) | 193 (1.5%) |
| $25,000 to $34,999 | 281 (7.4%) | 185 (1.4%) |
| $35,000 to $49,999 | 196 (5.2%) | 161 (1.2%) |
| $50,000 to $74,999 | 558 (14.7%) | 603 (4.6%) |
| $75,000 to $99,999 | 438 (11.6%) | 861 (6.5%) |
| $100,000 to $149,999 | 604 (16.0%) | 1,301 (9.8%) |
| $150,000 or more | 1,159 (30.6%) | 2,719 (20.5%) |
| Total | 3,786 (100.0%) | 13,235 (100.0%) |
Property Value to Household Income Ratio in Brentwood
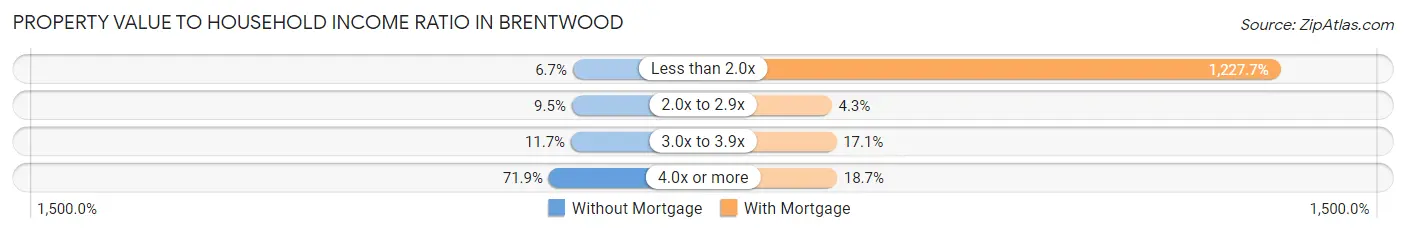
| Value-to-Income Ratio | Without Mortgage | With Mortgage |
| Less than 2.0x | 253 (6.7%) | 162,485 (1,227.7%) |
| 2.0x to 2.9x | 359 (9.5%) | 572 (4.3%) |
| 3.0x to 3.9x | 441 (11.7%) | 2,265 (17.1%) |
| 4.0x or more | 2,722 (71.9%) | 2,478 (18.7%) |
| Total | 3,786 (100.0%) | 13,235 (100.0%) |
Real Estate Taxes by Mortgage Status in Brentwood
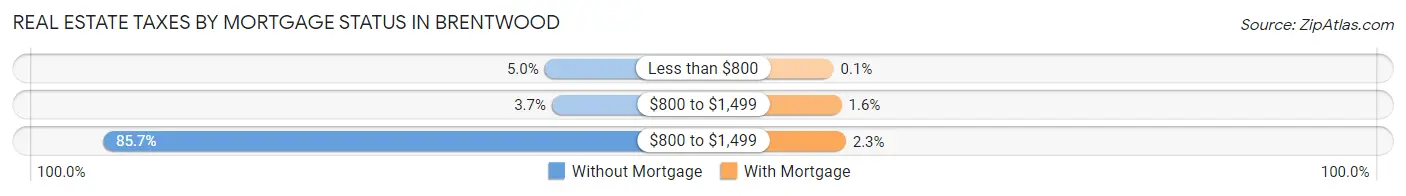
| Property Taxes | Without Mortgage | With Mortgage |
| Less than $800 | 191 (5.0%) | 13 (0.1%) |
| $800 to $1,499 | 140 (3.7%) | 206 (1.6%) |
| $800 to $1,499 | 3,243 (85.7%) | 308 (2.3%) |
| Total | 3,786 (100.0%) | 13,235 (100.0%) |
Health & Disability in Brentwood
Health Insurance Coverage by Age in Brentwood
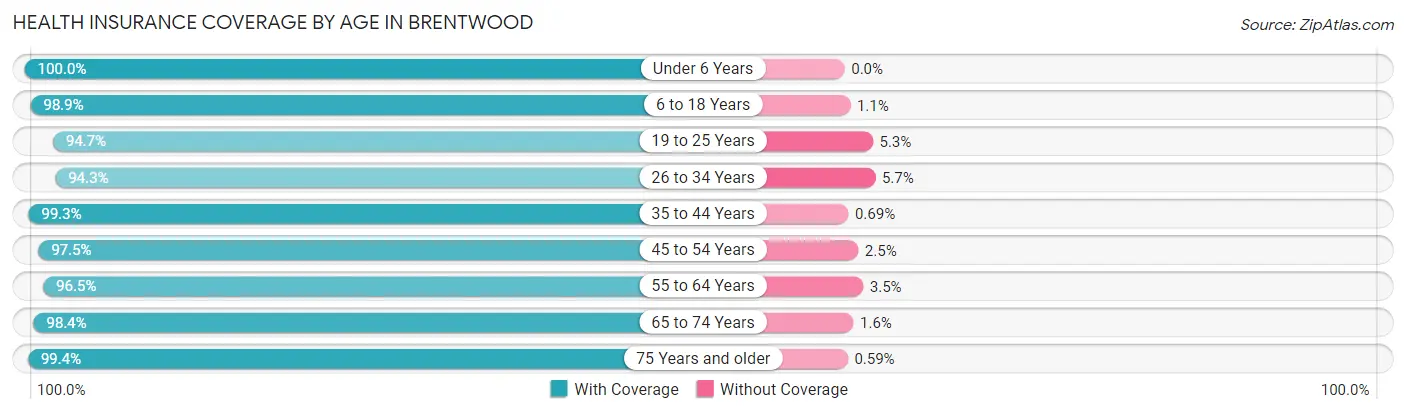
| Age Bracket | With Coverage | Without Coverage |
| Under 6 Years | 3,281 (100.0%) | 0 (0.0%) |
| 6 to 18 Years | 14,408 (98.9%) | 154 (1.1%) |
| 19 to 25 Years | 4,705 (94.7%) | 261 (5.3%) |
| 26 to 34 Years | 4,916 (94.3%) | 298 (5.7%) |
| 35 to 44 Years | 8,622 (99.3%) | 60 (0.7%) |
| 45 to 54 Years | 9,933 (97.5%) | 259 (2.5%) |
| 55 to 64 Years | 7,449 (96.5%) | 267 (3.5%) |
| 65 to 74 Years | 5,153 (98.4%) | 86 (1.6%) |
| 75 Years and older | 4,531 (99.4%) | 27 (0.6%) |
| Total | 62,998 (97.8%) | 1,412 (2.2%) |
Health Insurance Coverage by Citizenship Status in Brentwood
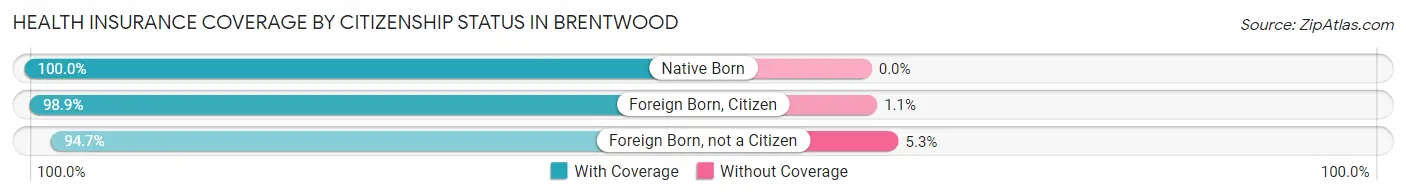
| Citizenship Status | With Coverage | Without Coverage |
| Native Born | 3,281 (100.0%) | 0 (0.0%) |
| Foreign Born, Citizen | 14,408 (98.9%) | 154 (1.1%) |
| Foreign Born, not a Citizen | 4,705 (94.7%) | 261 (5.3%) |
Health Insurance Coverage by Household Income in Brentwood
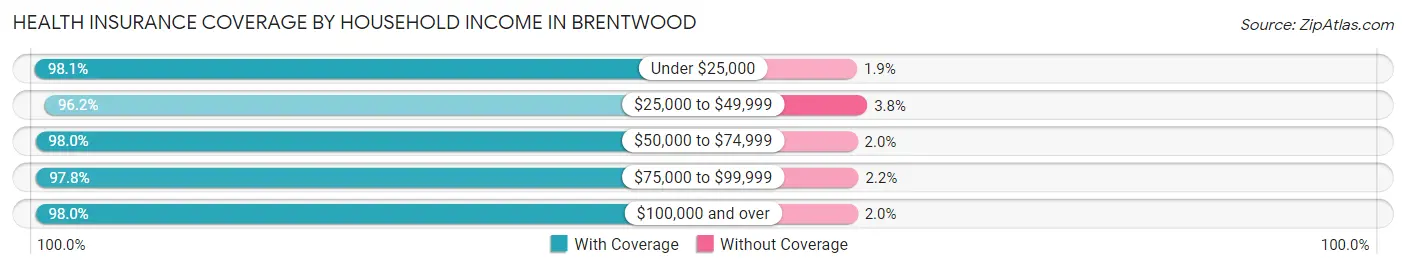
| Household Income | With Coverage | Without Coverage |
| Under $25,000 | 2,966 (98.1%) | 58 (1.9%) |
| $25,000 to $49,999 | 4,224 (96.2%) | 168 (3.8%) |
| $50,000 to $74,999 | 5,220 (98.0%) | 108 (2.0%) |
| $75,000 to $99,999 | 6,038 (97.8%) | 135 (2.2%) |
| $100,000 and over | 44,400 (98.0%) | 926 (2.0%) |
Public vs Private Health Insurance Coverage by Age in Brentwood
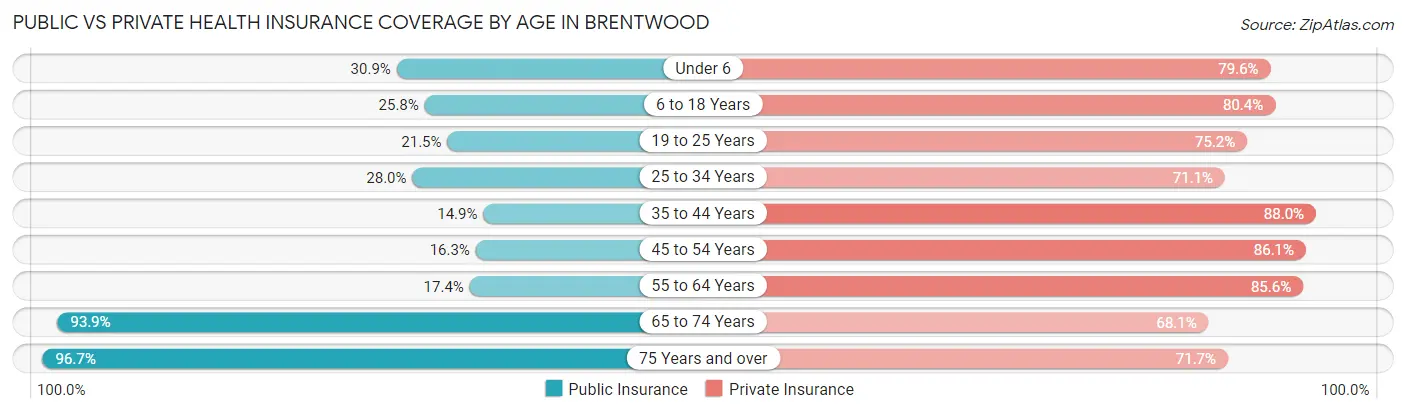
| Age Bracket | Public Insurance | Private Insurance |
| Under 6 | 1,015 (30.9%) | 2,610 (79.5%) |
| 6 to 18 Years | 3,749 (25.8%) | 11,709 (80.4%) |
| 19 to 25 Years | 1,069 (21.5%) | 3,736 (75.2%) |
| 25 to 34 Years | 1,461 (28.0%) | 3,707 (71.1%) |
| 35 to 44 Years | 1,290 (14.9%) | 7,640 (88.0%) |
| 45 to 54 Years | 1,658 (16.3%) | 8,778 (86.1%) |
| 55 to 64 Years | 1,342 (17.4%) | 6,605 (85.6%) |
| 65 to 74 Years | 4,920 (93.9%) | 3,566 (68.1%) |
| 75 Years and over | 4,406 (96.7%) | 3,266 (71.7%) |
| Total | 20,910 (32.5%) | 51,617 (80.1%) |
Disability Status by Sex by Age in Brentwood
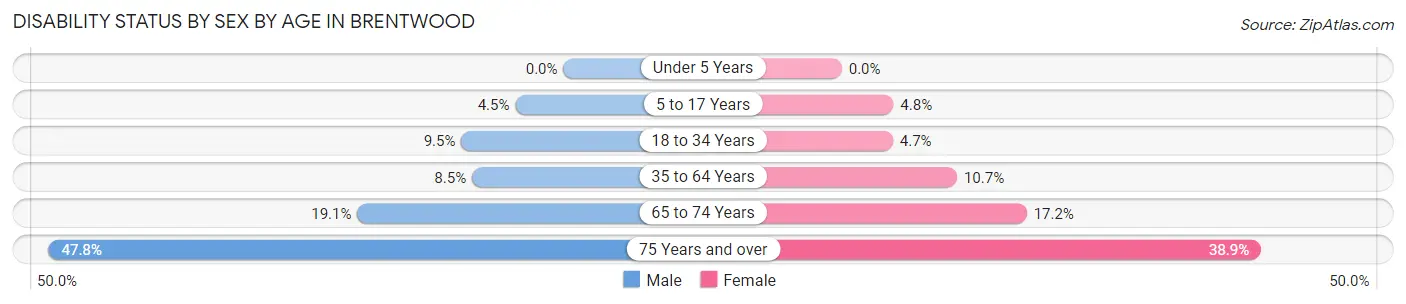
| Age Bracket | Male | Female |
| Under 5 Years | 0 (0.0%) | 0 (0.0%) |
| 5 to 17 Years | 307 (4.5%) | 360 (4.8%) |
| 18 to 34 Years | 532 (9.5%) | 278 (4.7%) |
| 35 to 64 Years | 1,115 (8.5%) | 1,437 (10.7%) |
| 65 to 74 Years | 438 (19.1%) | 506 (17.2%) |
| 75 Years and over | 952 (47.8%) | 998 (38.9%) |
Disability Class by Sex by Age in Brentwood
Disability Class: Hearing Difficulty
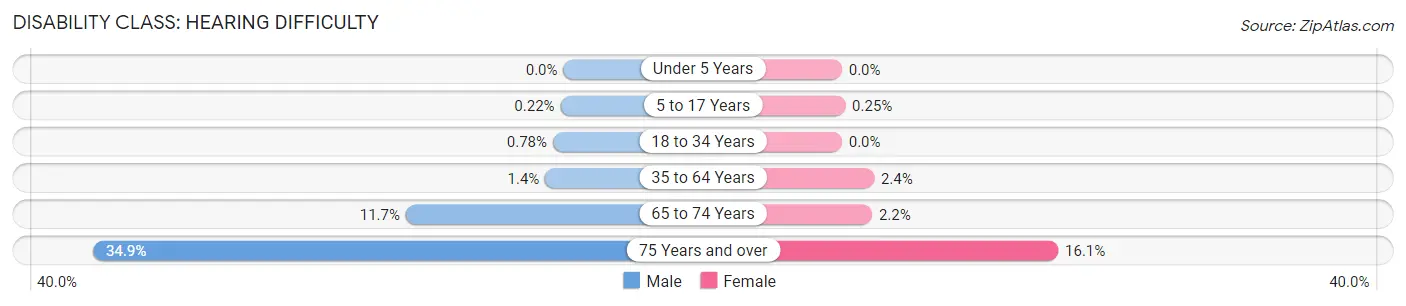
| Age Bracket | Male | Female |
| Under 5 Years | 0 (0.0%) | 0 (0.0%) |
| 5 to 17 Years | 15 (0.2%) | 19 (0.3%) |
| 18 to 34 Years | 44 (0.8%) | 0 (0.0%) |
| 35 to 64 Years | 178 (1.3%) | 321 (2.4%) |
| 65 to 74 Years | 268 (11.7%) | 66 (2.2%) |
| 75 Years and over | 696 (34.9%) | 412 (16.1%) |
Disability Class: Vision Difficulty
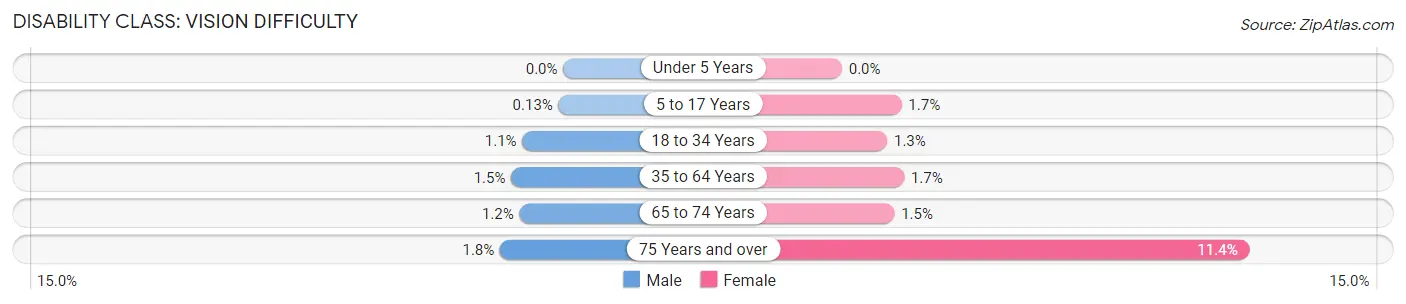
| Age Bracket | Male | Female |
| Under 5 Years | 0 (0.0%) | 0 (0.0%) |
| 5 to 17 Years | 9 (0.1%) | 125 (1.7%) |
| 18 to 34 Years | 64 (1.1%) | 74 (1.3%) |
| 35 to 64 Years | 190 (1.5%) | 232 (1.7%) |
| 65 to 74 Years | 28 (1.2%) | 43 (1.5%) |
| 75 Years and over | 35 (1.8%) | 291 (11.4%) |
Disability Class: Cognitive Difficulty
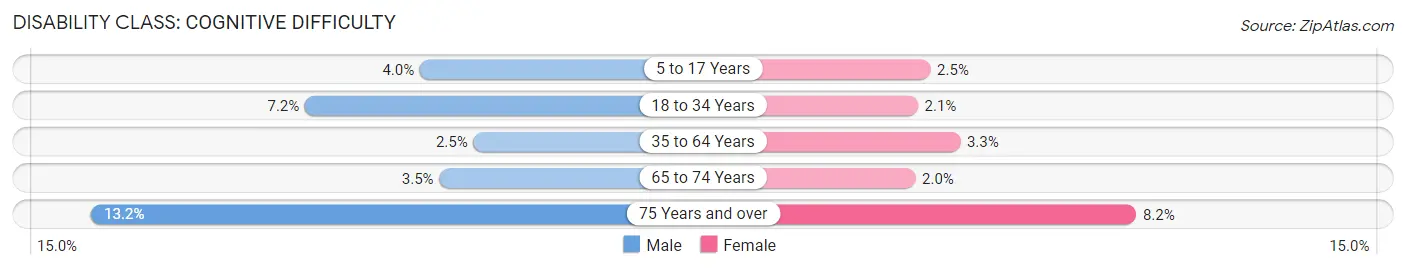
| Age Bracket | Male | Female |
| 5 to 17 Years | 275 (4.0%) | 185 (2.5%) |
| 18 to 34 Years | 404 (7.2%) | 124 (2.1%) |
| 35 to 64 Years | 328 (2.5%) | 442 (3.3%) |
| 65 to 74 Years | 79 (3.5%) | 60 (2.0%) |
| 75 Years and over | 262 (13.2%) | 210 (8.2%) |
Disability Class: Ambulatory Difficulty
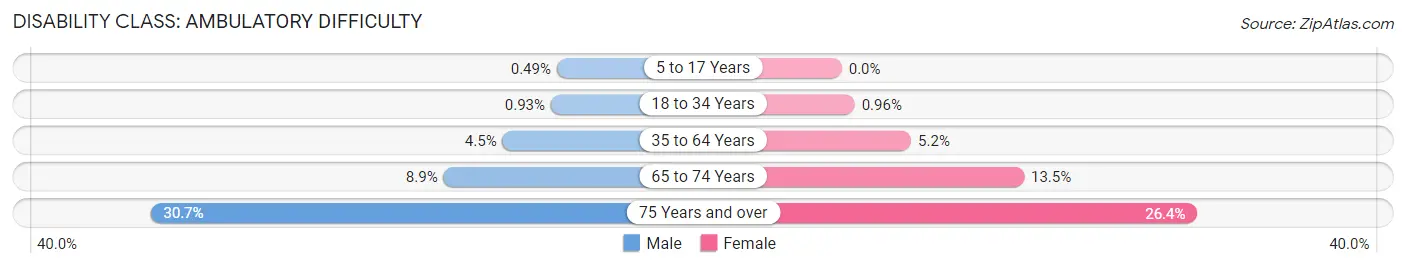
| Age Bracket | Male | Female |
| 5 to 17 Years | 34 (0.5%) | 0 (0.0%) |
| 18 to 34 Years | 52 (0.9%) | 56 (1.0%) |
| 35 to 64 Years | 594 (4.5%) | 692 (5.1%) |
| 65 to 74 Years | 204 (8.9%) | 399 (13.5%) |
| 75 Years and over | 611 (30.7%) | 677 (26.4%) |
Disability Class: Self-Care Difficulty
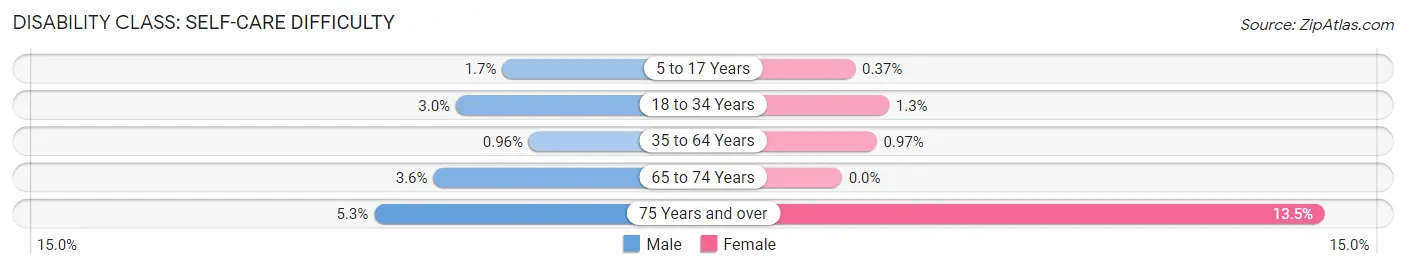
| Age Bracket | Male | Female |
| 5 to 17 Years | 117 (1.7%) | 28 (0.4%) |
| 18 to 34 Years | 168 (3.0%) | 77 (1.3%) |
| 35 to 64 Years | 126 (1.0%) | 131 (1.0%) |
| 65 to 74 Years | 83 (3.6%) | 0 (0.0%) |
| 75 Years and over | 105 (5.3%) | 345 (13.5%) |
Technology Access in Brentwood
Computing Device Access in Brentwood
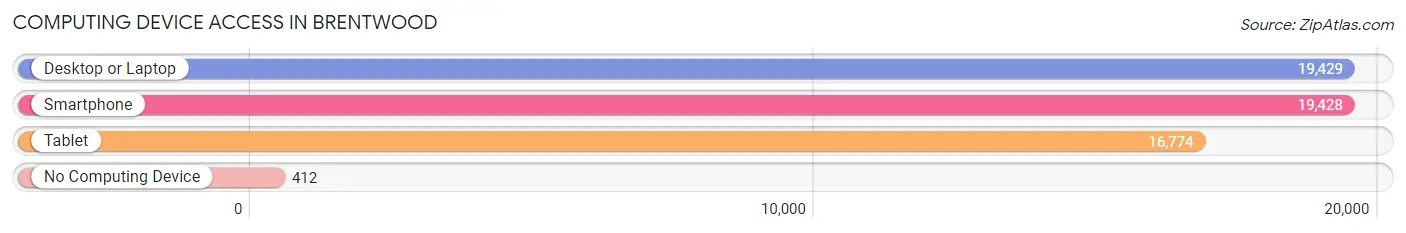
| Device Type | # Households | % Households |
| Desktop or Laptop | 19,429 | 93.2% |
| Smartphone | 19,428 | 93.2% |
| Tablet | 16,774 | 80.5% |
| No Computing Device | 412 | 2.0% |
| Total | 20,840 | 100.0% |
Internet Access in Brentwood
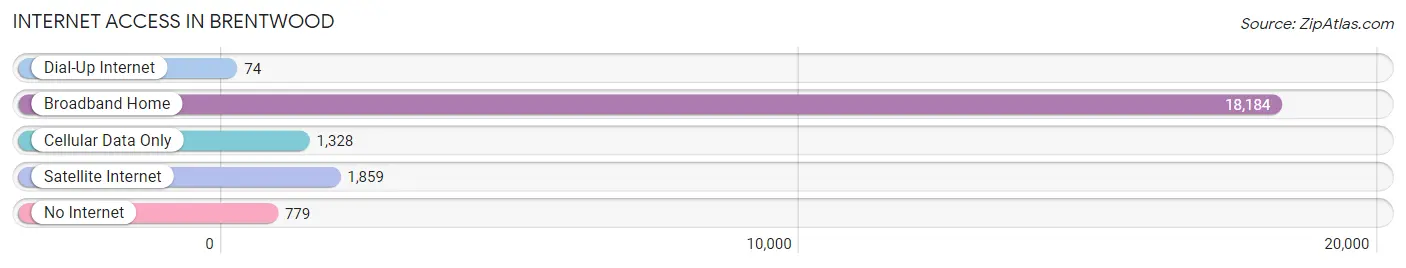
| Internet Type | # Households | % Households |
| Dial-Up Internet | 74 | 0.4% |
| Broadband Home | 18,184 | 87.3% |
| Cellular Data Only | 1,328 | 6.4% |
| Satellite Internet | 1,859 | 8.9% |
| No Internet | 779 | 3.7% |
| Total | 20,840 | 100.0% |
Brentwood Summary
Brentwood is a city located in Contra Costa County, California, United States. It is located in the East Bay region of the San Francisco Bay Area, about 30 miles east of downtown San Francisco. The population was 51,481 at the 2010 census, making it one of the largest cities in the county.
History
Brentwood was first settled in the late 1800s by farmers and ranchers. The area was originally known as Marsh Creek, and was renamed after the Brentwood Hotel, which was built in 1876. The hotel was named after the town of Brentwood in England.
In the early 1900s, the area began to develop as a residential community. The first subdivision was built in 1906, and the city was officially incorporated in 1948.
Geography
Brentwood is located in the East Bay region of the San Francisco Bay Area, about 30 miles east of downtown San Francisco. It is bordered by the cities of Oakley to the north, Antioch to the east, and Discovery Bay to the south. The city covers an area of about 15 square miles, and is located at the base of the Diablo Range.
The city is located in a Mediterranean climate zone, with hot, dry summers and mild, wet winters. The average annual precipitation is about 20 inches.
Economy
Brentwood is a primarily residential city, with a small but growing commercial sector. The city's largest employers are the Brentwood Union School District, the Contra Costa County Office of Education, and the Brentwood Medical Center.
The city is also home to several wineries including the Brentwood Winery and the Oakley Winery
Demographics
As of the 2010 census, there were 51,481 people, 17,845 households, and 13,845 families residing in the city. The population density was 3,400 people per square mile. The racial makeup of the city was 68.2% White, 11.3% African American, 0.7% Native American, 8.2% Asian, 0.3% Pacific Islander, 6.2% from other races, and 5.2% from two or more races. Hispanic or Latino of any race were 17.3% of the population.
The median income for a household in the city was $87,845, and the median income for a family was $103,845. The per capita income for the city was $37,845. About 4.2% of families and 5.7% of the population were below the poverty line, including 6.7% of those under age 18 and 4.2% of those age 65 or over.
Common Questions
What is Per Capita Income in Brentwood?
Per Capita income in Brentwood is $53,655.
What is the Median Family Income in Brentwood?
Median Family Income in Brentwood is $146,386.
What is the Median Household income in Brentwood?
Median Household Income in Brentwood is $134,689.
What is Income or Wage Gap in Brentwood?
Income or Wage Gap in Brentwood is 39.5%.
Women in Brentwood earn 60.5 cents for every dollar earned by a man.
What is Inequality or Gini Index in Brentwood?
Inequality or Gini Index in Brentwood is 0.41.
What is the Total Population of Brentwood?
Total Population of Brentwood is 64,443.
What is the Total Male Population of Brentwood?
Total Male Population of Brentwood is 31,028.
What is the Total Female Population of Brentwood?
Total Female Population of Brentwood is 33,415.
What is the Ratio of Males per 100 Females in Brentwood?
There are 92.86 Males per 100 Females in Brentwood.
What is the Ratio of Females per 100 Males in Brentwood?
There are 107.69 Females per 100 Males in Brentwood.
What is the Median Population Age in Brentwood?
Median Population Age in Brentwood is 40.7 Years.
What is the Average Family Size in Brentwood
Average Family Size in Brentwood is 3.4 People.
What is the Average Household Size in Brentwood
Average Household Size in Brentwood is 3.1 People.
How Large is the Labor Force in Brentwood?
There are 31,743 People in the Labor Forcein in Brentwood.
What is the Percentage of People in the Labor Force in Brentwood?
63.0% of People are in the Labor Force in Brentwood.
What is the Unemployment Rate in Brentwood?
Unemployment Rate in Brentwood is 6.0%.