Cities with the Lowest Percentage of Births to Unmarried Women over the Age of 35 in Virginia
RELATED REPORTS & OPTIONS
Lowest Illegitimacy | Women 35+
Virginia
Compare Cities
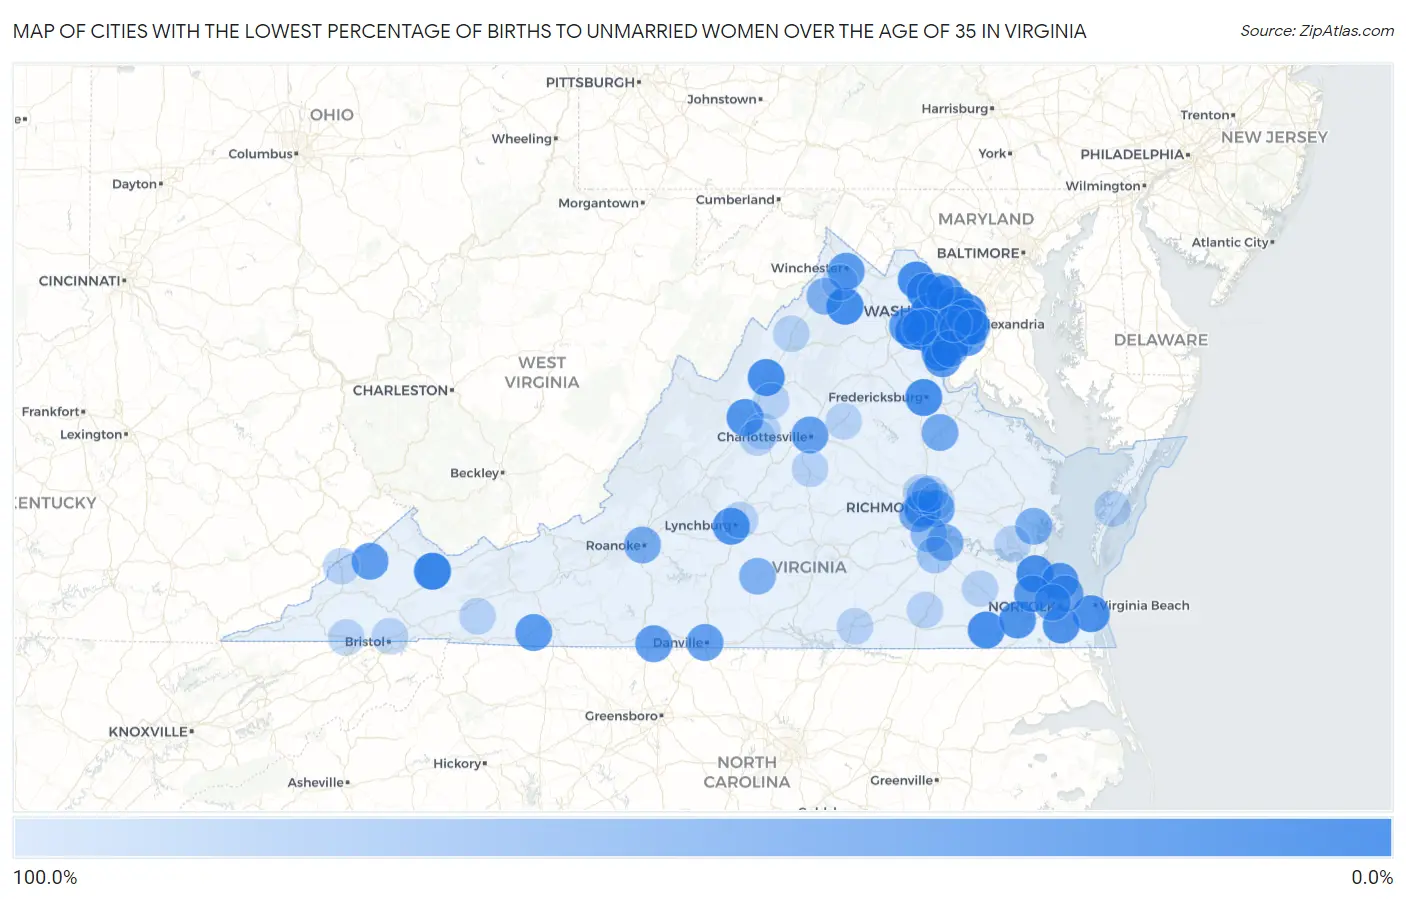
Map of Cities with the Lowest Percentage of Births to Unmarried Women over the Age of 35 in Virginia
100.0%
0.0%
Cities with the Lowest Percentage of Births to Unmarried Women over the Age of 35 in Virginia
| City | % Unmarried | vs State | vs National | |
| 1. | Newington | 1.7% | 16.7%(-15.0)#1 | 20.1%(-18.4)#16 |
| 2. | Linton Hall | 2.1% | 16.7%(-14.6)#2 | 20.1%(-18.0)#24 |
| 3. | Richlands | 3.4% | 16.7%(-13.3)#3 | 20.1%(-16.7)#61 |
| 4. | Woodlawn Cdp Fairfax County | 6.0% | 16.7%(-10.7)#4 | 20.1%(-14.1)#166 |
| 5. | Fairfax | 6.4% | 16.7%(-10.3)#5 | 20.1%(-13.7)#178 |
| 6. | Montclair | 6.5% | 16.7%(-10.2)#6 | 20.1%(-13.6)#186 |
| 7. | Reston | 9.0% | 16.7%(-7.70)#7 | 20.1%(-11.1)#301 |
| 8. | Centreville | 9.2% | 16.7%(-7.50)#8 | 20.1%(-10.9)#311 |
| 9. | Alexandria | 9.9% | 16.7%(-6.80)#9 | 20.1%(-10.2)#341 |
| 10. | Lake Ridge | 10.0% | 16.7%(-6.70)#10 | 20.1%(-10.1)#345 |
| 11. | Front Royal | 11.1% | 16.7%(-5.60)#11 | 20.1%(-9.00)#394 |
| 12. | Leesburg | 11.8% | 16.7%(-4.90)#12 | 20.1%(-8.30)#424 |
| 13. | Sudley | 12.1% | 16.7%(-4.60)#13 | 20.1%(-8.00)#439 |
| 14. | Annandale | 12.2% | 16.7%(-4.50)#14 | 20.1%(-7.90)#444 |
| 15. | Ashburn | 14.0% | 16.7%(-2.70)#15 | 20.1%(-6.10)#550 |
| 16. | Fredericksburg | 14.0% | 16.7%(-2.70)#16 | 20.1%(-6.10)#551 |
| 17. | Franklin | 14.4% | 16.7%(-2.30)#17 | 20.1%(-5.70)#576 |
| 18. | Chantilly | 14.6% | 16.7%(-2.10)#18 | 20.1%(-5.50)#591 |
| 19. | Harrisonburg | 15.1% | 16.7%(-1.60)#19 | 20.1%(-5.00)#622 |
| 20. | Arlington | 15.2% | 16.7%(-1.50)#20 | 20.1%(-4.90)#624 |
| 21. | Newport News | 16.0% | 16.7%(-0.700)#21 | 20.1%(-4.10)#673 |
| 22. | Franconia | 16.9% | 16.7%(+0.200)#22 | 20.1%(-3.20)#728 |
| 23. | West Falls Church | 17.3% | 16.7%(+0.600)#23 | 20.1%(-2.80)#744 |
| 24. | Leesylvania | 17.3% | 16.7%(+0.600)#24 | 20.1%(-2.80)#747 |
| 25. | Burke | 17.8% | 16.7%(+1.10)#25 | 20.1%(-2.30)#766 |
| 26. | Lorton | 18.0% | 16.7%(+1.30)#26 | 20.1%(-2.10)#785 |
| 27. | Manassas | 18.1% | 16.7%(+1.40)#27 | 20.1%(-2.00)#788 |
| 28. | Virginia Beach | 18.4% | 16.7%(+1.70)#28 | 20.1%(-1.70)#802 |
| 29. | West Springfield | 18.7% | 16.7%(+2.00)#29 | 20.1%(-1.40)#821 |
| 30. | Lynchburg | 19.4% | 16.7%(+2.70)#30 | 20.1%(-0.700)#846 |
| 31. | Chesapeake | 20.1% | 16.7%(+3.40)#31 | 20.1%(=0.000)#881 |
| 32. | Idylwood | 20.2% | 16.7%(+3.50)#32 | 20.1%(+0.100)#890 |
| 33. | Oakton | 20.8% | 16.7%(+4.10)#33 | 20.1%(+0.700)#918 |
| 34. | Great Falls | 20.8% | 16.7%(+4.10)#34 | 20.1%(+0.700)#920 |
| 35. | Yorkshire | 21.1% | 16.7%(+4.40)#35 | 20.1%(+1.00)#937 |
| 36. | Mclean | 21.3% | 16.7%(+4.60)#36 | 20.1%(+1.20)#945 |
| 37. | Suffolk | 21.4% | 16.7%(+4.70)#37 | 20.1%(+1.30)#946 |
| 38. | Kingstowne | 22.3% | 16.7%(+5.60)#38 | 20.1%(+2.20)#999 |
| 39. | Staunton | 23.0% | 16.7%(+6.30)#39 | 20.1%(+2.90)#1,021 |
| 40. | Hampton | 23.1% | 16.7%(+6.40)#40 | 20.1%(+3.00)#1,024 |
| 41. | Dale City | 23.7% | 16.7%(+7.00)#41 | 20.1%(+3.60)#1,057 |
| 42. | Springfield | 25.2% | 16.7%(+8.50)#42 | 20.1%(+5.10)#1,120 |
| 43. | Mount Vernon | 27.3% | 16.7%(+10.6)#43 | 20.1%(+7.20)#1,214 |
| 44. | Richmond | 28.3% | 16.7%(+11.6)#44 | 20.1%(+8.20)#1,263 |
| 45. | Carrollton | 28.6% | 16.7%(+11.9)#45 | 20.1%(+8.50)#1,281 |
| 46. | Galax | 28.9% | 16.7%(+12.2)#46 | 20.1%(+8.80)#1,296 |
| 47. | Winchester | 29.5% | 16.7%(+12.8)#47 | 20.1%(+9.40)#1,318 |
| 48. | Gainesville | 30.0% | 16.7%(+13.3)#48 | 20.1%(+9.90)#1,341 |
| 49. | Dumfries | 31.2% | 16.7%(+14.5)#49 | 20.1%(+11.1)#1,391 |
| 50. | Ridgeway | 33.3% | 16.7%(+16.6)#50 | 20.1%(+13.2)#1,495 |
| 51. | Clinchco | 33.3% | 16.7%(+16.6)#51 | 20.1%(+13.2)#1,507 |
| 52. | Danville | 35.6% | 16.7%(+18.9)#52 | 20.1%(+15.5)#1,584 |
| 53. | Hutchison | 35.9% | 16.7%(+19.2)#53 | 20.1%(+15.8)#1,600 |
| 54. | Huntington | 36.6% | 16.7%(+19.9)#54 | 20.1%(+16.5)#1,622 |
| 55. | Charlottesville | 36.9% | 16.7%(+20.2)#55 | 20.1%(+16.8)#1,631 |
| 56. | Norfolk | 38.0% | 16.7%(+21.3)#56 | 20.1%(+17.9)#1,675 |
| 57. | Montrose | 39.2% | 16.7%(+22.5)#57 | 20.1%(+19.1)#1,721 |
| 58. | One Loudoun | 40.0% | 16.7%(+23.3)#58 | 20.1%(+19.9)#1,747 |
| 59. | Bailey S Crossroads | 41.3% | 16.7%(+24.6)#59 | 20.1%(+21.2)#1,796 |
| 60. | Bowling Green | 50.0% | 16.7%(+33.3)#60 | 20.1%(+29.9)#2,057 |
| 61. | Portsmouth | 50.2% | 16.7%(+33.5)#61 | 20.1%(+30.1)#2,079 |
| 62. | Roanoke | 50.9% | 16.7%(+34.2)#62 | 20.1%(+30.8)#2,090 |
| 63. | Manchester | 52.4% | 16.7%(+35.7)#63 | 20.1%(+32.3)#2,132 |
| 64. | Hopewell | 55.1% | 16.7%(+38.4)#64 | 20.1%(+35.0)#2,193 |
| 65. | Gloucester Courthouse | 55.6% | 16.7%(+38.9)#65 | 20.1%(+35.5)#2,199 |
| 66. | Woodbridge | 58.8% | 16.7%(+42.1)#66 | 20.1%(+38.7)#2,273 |
| 67. | Strasburg | 59.2% | 16.7%(+42.5)#67 | 20.1%(+39.1)#2,279 |
| 68. | Brookneal | 59.4% | 16.7%(+42.7)#68 | 20.1%(+39.3)#2,284 |
| 69. | Sugarland Run | 60.7% | 16.7%(+44.0)#69 | 20.1%(+40.6)#2,315 |
| 70. | Lakeside | 64.7% | 16.7%(+48.0)#70 | 20.1%(+44.6)#2,413 |
| 71. | Chester | 72.5% | 16.7%(+55.8)#71 | 20.1%(+52.4)#2,540 |
| 72. | Petersburg | 83.3% | 16.7%(+66.6)#72 | 20.1%(+63.2)#2,655 |
| 73. | Bull Run | 87.5% | 16.7%(+70.8)#73 | 20.1%(+67.4)#2,687 |
| 74. | Waynesboro | 100.0% | 16.7%(+83.3)#74 | 20.1%(+79.9)#2,770 |
| 75. | Laurel | 100.0% | 16.7%(+83.3)#75 | 20.1%(+79.9)#2,788 |
| 76. | Bristol | 100.0% | 16.7%(+83.3)#76 | 20.1%(+79.9)#2,794 |
| 77. | East Highland Park | 100.0% | 16.7%(+83.3)#77 | 20.1%(+79.9)#2,803 |
| 78. | Williamsburg | 100.0% | 16.7%(+83.3)#78 | 20.1%(+79.9)#2,817 |
| 79. | Madison Heights | 100.0% | 16.7%(+83.3)#79 | 20.1%(+79.9)#2,895 |
| 80. | Belle Haven | 100.0% | 16.7%(+83.3)#80 | 20.1%(+79.9)#3,031 |
| 81. | Chamberlayne | 100.0% | 16.7%(+83.3)#81 | 20.1%(+79.9)#3,122 |
| 82. | Grottoes | 100.0% | 16.7%(+83.3)#82 | 20.1%(+79.9)#3,291 |
| 83. | Ravensworth | 100.0% | 16.7%(+83.3)#83 | 20.1%(+79.9)#3,341 |
| 84. | Stephens City | 100.0% | 16.7%(+83.3)#84 | 20.1%(+79.9)#3,424 |
| 85. | Gordonsville | 100.0% | 16.7%(+83.3)#85 | 20.1%(+79.9)#3,460 |
| 86. | Mount Jackson | 100.0% | 16.7%(+83.3)#86 | 20.1%(+79.9)#3,485 |
| 87. | Lyndhurst | 100.0% | 16.7%(+83.3)#87 | 20.1%(+79.9)#3,505 |
| 88. | Exmore | 100.0% | 16.7%(+83.3)#88 | 20.1%(+79.9)#3,508 |
| 89. | Weber City | 100.0% | 16.7%(+83.3)#89 | 20.1%(+79.9)#3,546 |
| 90. | Wakefield | 100.0% | 16.7%(+83.3)#90 | 20.1%(+79.9)#3,623 |
| 91. | Rio | 100.0% | 16.7%(+83.3)#91 | 20.1%(+79.9)#3,722 |
| 92. | Jarratt | 100.0% | 16.7%(+83.3)#92 | 20.1%(+79.9)#3,734 |
| 93. | Pound | 100.0% | 16.7%(+83.3)#93 | 20.1%(+79.9)#3,736 |
| 94. | Sugar Grove | 100.0% | 16.7%(+83.3)#94 | 20.1%(+79.9)#3,835 |
| 95. | Scottsville | 100.0% | 16.7%(+83.3)#95 | 20.1%(+79.9)#3,901 |
| 96. | La Crosse | 100.0% | 16.7%(+83.3)#96 | 20.1%(+79.9)#3,905 |
Common Questions
What are the Top 10 Cities with the Lowest Percentage of Births to Unmarried Women over the Age of 35 in Virginia?
Top 10 Cities with the Lowest Percentage of Births to Unmarried Women over the Age of 35 in Virginia are:
#1
0.0%
#2
0.0%
#3
0.0%
#4
0.0%
#5
1.7%
#6
2.1%
#7
3.4%
#8
6.4%
#9
6.5%
#10
9.0%
What city has the Lowest Percentage of Births to Unmarried Women over the Age of 35 in Virginia?
Newington has the Lowest Percentage of Births to Unmarried Women over the Age of 35 in Virginia with 1.7%.
What is the Percentage of Births to Unmarried Women over the Age of 35 in the State of Virginia?
Percentage of Births to Unmarried Women over the Age of 35 in Virginia is 16.7%.
What is the Percentage of Births to Unmarried Women over the Age of 35 in the United States?
Percentage of Births to Unmarried Women over the Age of 35 in the United States is 20.1%.