Rancho Santa Margarita, CA Map & Demographics
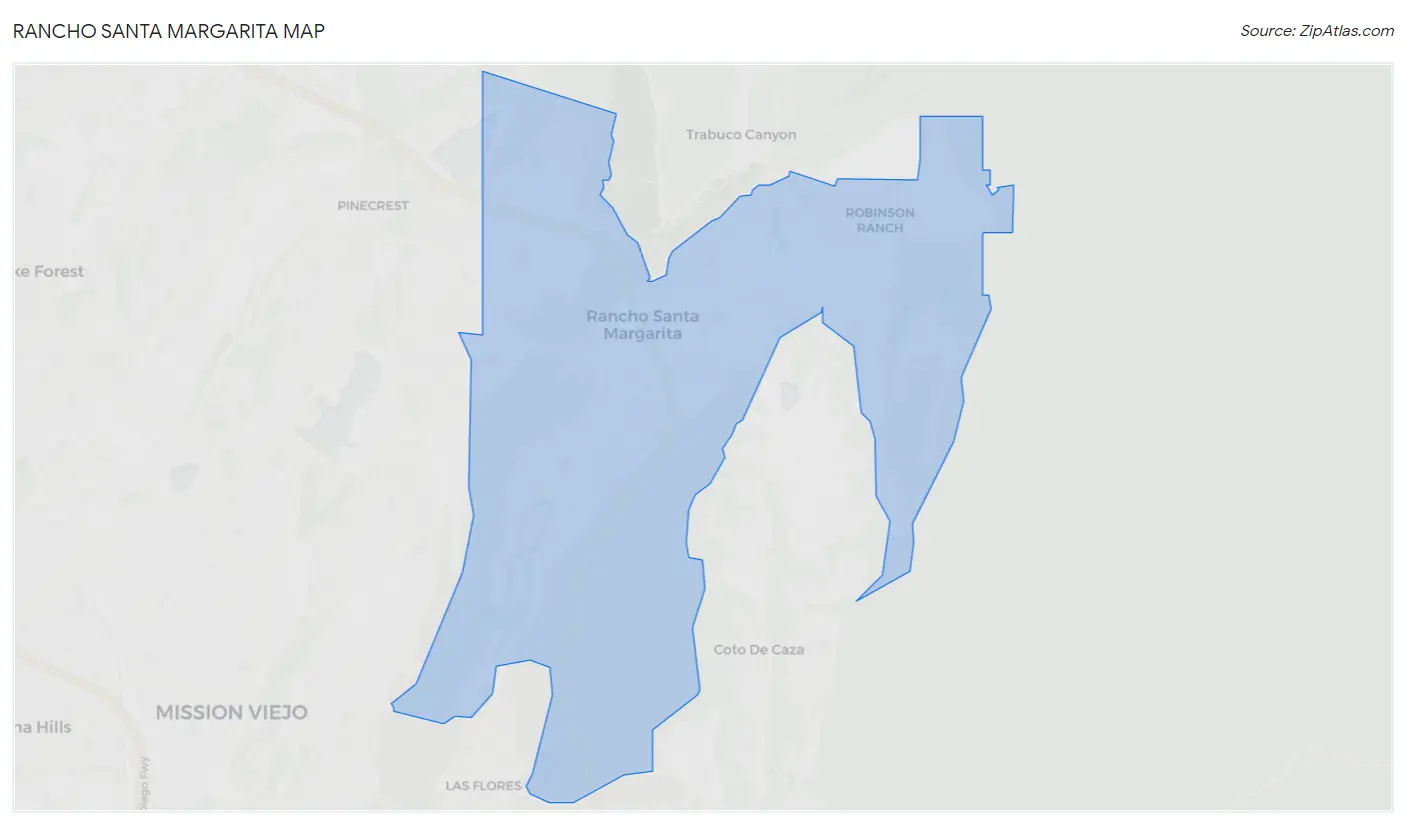
Rancho Santa Margarita Map
Rancho Santa Margarita Overview
$62,035
PER CAPITA INCOME
$179,002
AVG FAMILY INCOME
$150,146
AVG HOUSEHOLD INCOME
28.5%
WAGE / INCOME GAP [ % ]
71.5¢/ $1
WAGE / INCOME GAP [ $ ]
$12,617
FAMILY INCOME DEFICIT
0.38
INEQUALITY / GINI INDEX
47,702
TOTAL POPULATION
23,675
MALE POPULATION
24,027
FEMALE POPULATION
98.53
MALES / 100 FEMALES
101.49
FEMALES / 100 MALES
40.1
MEDIAN AGE
3.3
AVG FAMILY SIZE
2.8
AVG HOUSEHOLD SIZE
28,365
LABOR FORCE [ PEOPLE ]
74.3%
PERCENT IN LABOR FORCE
3.3%
UNEMPLOYMENT RATE
Rancho Santa Margarita Zip Codes
Rancho Santa Margarita Area Codes
Income in Rancho Santa Margarita
Income Overview in Rancho Santa Margarita
Per Capita Income in Rancho Santa Margarita is $62,035, while median incomes of families and households are $179,002 and $150,146 respectively.
| Characteristic | Number | Measure |
| Per Capita Income | 47,702 | $62,035 |
| Median Family Income | 12,843 | $179,002 |
| Mean Family Income | 12,843 | $193,970 |
| Median Household Income | 16,798 | $150,146 |
| Mean Household Income | 16,798 | $173,790 |
| Income Deficit | 12,843 | $12,617 |
| Wage / Income Gap (%) | 47,702 | 28.47% |
| Wage / Income Gap ($) | 47,702 | 71.53¢ per $1 |
| Gini / Inequality Index | 47,702 | 0.38 |
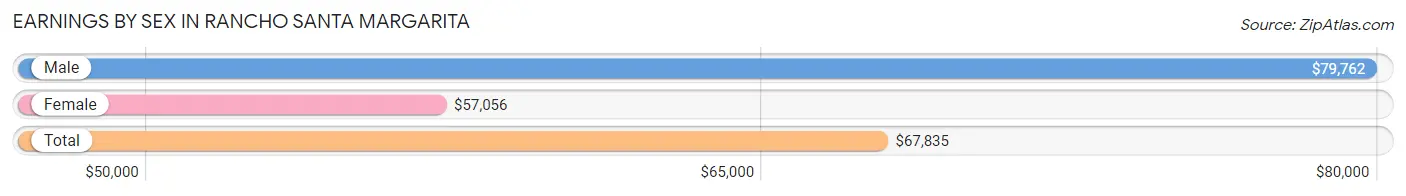
Earnings by Sex in Rancho Santa Margarita
Average Earnings in Rancho Santa Margarita are $67,835, $79,762 for men and $57,056 for women, a difference of 28.5%.
| Sex | Number | Average Earnings |
| Male | 15,601 (53.6%) | $79,762 |
| Female | 13,477 (46.4%) | $57,056 |
| Total | 29,078 (100.0%) | $67,835 |
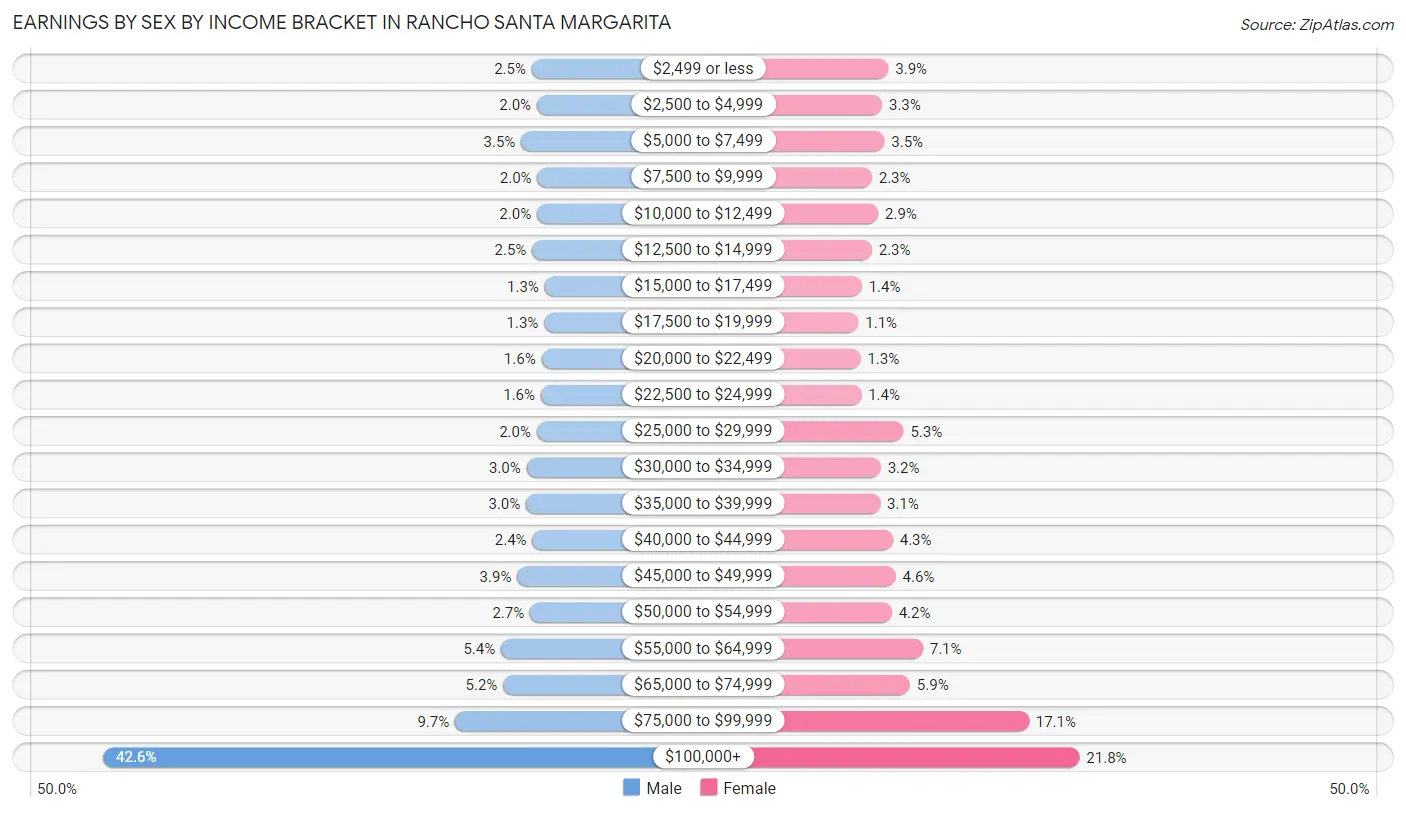
Earnings by Sex by Income Bracket in Rancho Santa Margarita
The most common earnings brackets in Rancho Santa Margarita are $100,000+ for men (6,652 | 42.6%) and $100,000+ for women (2,937 | 21.8%).
| Income | Male | Female |
| $2,499 or less | 388 (2.5%) | 524 (3.9%) |
| $2,500 to $4,999 | 313 (2.0%) | 445 (3.3%) |
| $5,000 to $7,499 | 543 (3.5%) | 474 (3.5%) |
| $7,500 to $9,999 | 306 (2.0%) | 316 (2.3%) |
| $10,000 to $12,499 | 312 (2.0%) | 395 (2.9%) |
| $12,500 to $14,999 | 382 (2.5%) | 315 (2.3%) |
| $15,000 to $17,499 | 199 (1.3%) | 189 (1.4%) |
| $17,500 to $19,999 | 207 (1.3%) | 146 (1.1%) |
| $20,000 to $22,499 | 247 (1.6%) | 173 (1.3%) |
| $22,500 to $24,999 | 256 (1.6%) | 182 (1.3%) |
| $25,000 to $29,999 | 315 (2.0%) | 715 (5.3%) |
| $30,000 to $34,999 | 463 (3.0%) | 429 (3.2%) |
| $35,000 to $39,999 | 471 (3.0%) | 419 (3.1%) |
| $40,000 to $44,999 | 379 (2.4%) | 581 (4.3%) |
| $45,000 to $49,999 | 601 (3.8%) | 616 (4.6%) |
| $50,000 to $54,999 | 413 (2.6%) | 567 (4.2%) |
| $55,000 to $64,999 | 838 (5.4%) | 959 (7.1%) |
| $65,000 to $74,999 | 806 (5.2%) | 797 (5.9%) |
| $75,000 to $99,999 | 1,510 (9.7%) | 2,298 (17.1%) |
| $100,000+ | 6,652 (42.6%) | 2,937 (21.8%) |
| Total | 15,601 (100.0%) | 13,477 (100.0%) |
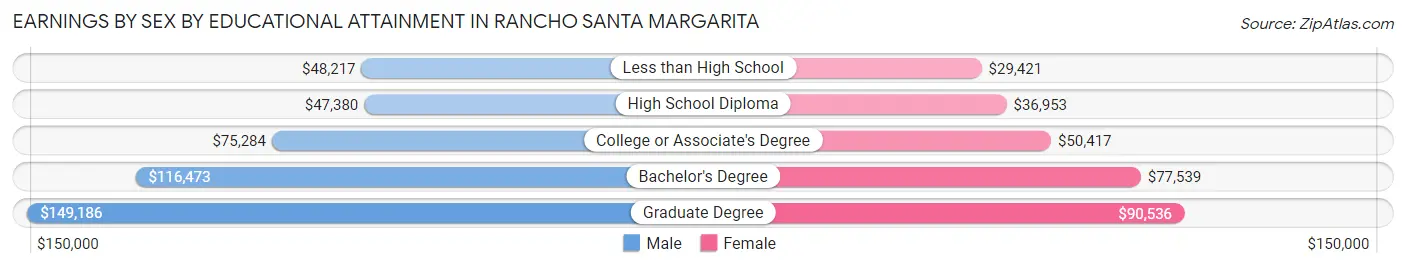
Earnings by Sex by Educational Attainment in Rancho Santa Margarita
Average earnings in Rancho Santa Margarita are $92,981 for men and $64,378 for women, a difference of 30.8%. Men with an educational attainment of graduate degree enjoy the highest average annual earnings of $149,186, while those with high school diploma education earn the least with $47,380. Women with an educational attainment of graduate degree earn the most with the average annual earnings of $90,536, while those with less than high school education have the smallest earnings of $29,421.
| Educational Attainment | Male Income | Female Income |
| Less than High School | $48,217 | $29,421 |
| High School Diploma | $47,380 | $36,953 |
| College or Associate's Degree | $75,284 | $50,417 |
| Bachelor's Degree | $116,473 | $77,539 |
| Graduate Degree | $149,186 | $90,536 |
| Total | $92,981 | $64,378 |
Family Income in Rancho Santa Margarita
Family Income Brackets in Rancho Santa Margarita
According to the Rancho Santa Margarita family income data, there are 5,407 families falling into the $200,000+ income range, which is the most common income bracket and makes up 42.1% of all families. Conversely, the $10,000 to $14,999 income bracket is the least frequent group with only 64 families (0.5%) belonging to this category.
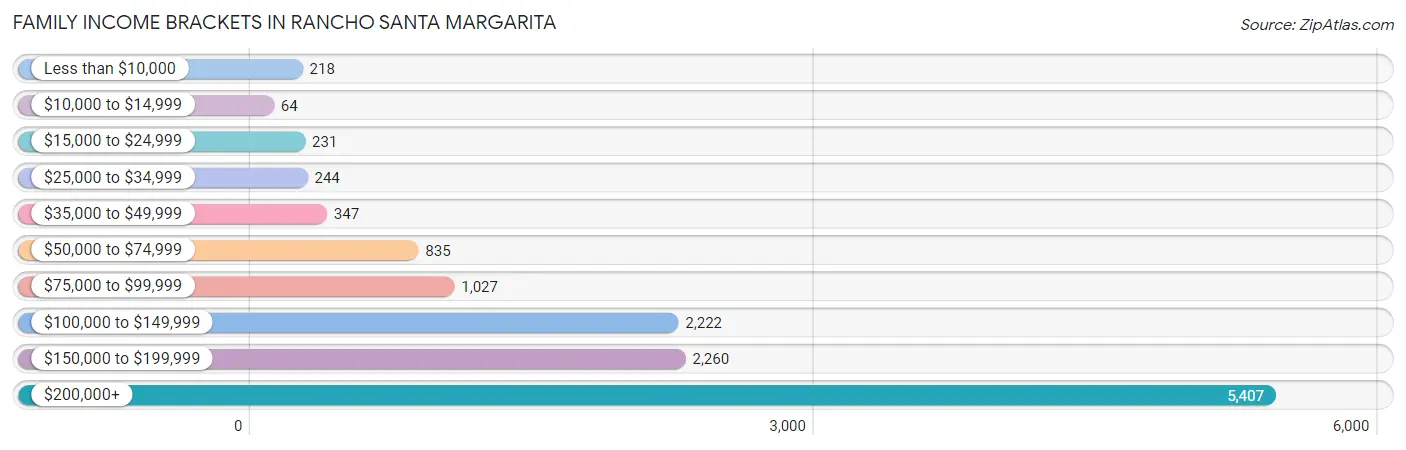
| Income Bracket | # Families | % Families |
| Less than $10,000 | 218 | 1.7% |
| $10,000 to $14,999 | 64 | 0.5% |
| $15,000 to $24,999 | 231 | 1.8% |
| $25,000 to $34,999 | 244 | 1.9% |
| $35,000 to $49,999 | 347 | 2.7% |
| $50,000 to $74,999 | 835 | 6.5% |
| $75,000 to $99,999 | 1,027 | 8.0% |
| $100,000 to $149,999 | 2,222 | 17.3% |
| $150,000 to $199,999 | 2,260 | 17.6% |
| $200,000+ | 5,407 | 42.1% |
Family Income by Famaliy Size in Rancho Santa Margarita
7+ person families (193 | 1.5%) account for the highest median family income in Rancho Santa Margarita with $250,001 per family, while 2-person families (4,813 | 37.5%) have the highest median income of $76,754 per family member.
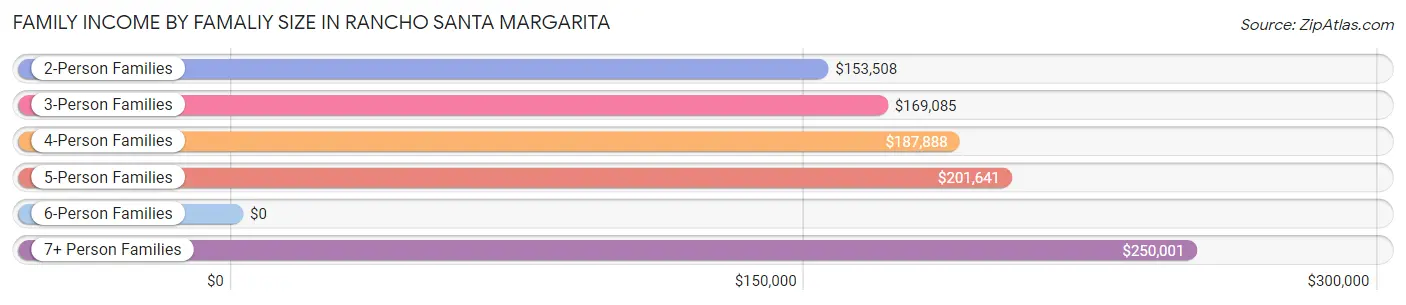
| Income Bracket | # Families | Median Income |
| 2-Person Families | 4,813 (37.5%) | $153,508 |
| 3-Person Families | 3,074 (23.9%) | $169,085 |
| 4-Person Families | 3,575 (27.8%) | $187,888 |
| 5-Person Families | 985 (7.7%) | $201,641 |
| 6-Person Families | 203 (1.6%) | $0 |
| 7+ Person Families | 193 (1.5%) | $250,001 |
| Total | 12,843 (100.0%) | $179,002 |
Family Income by Number of Earners in Rancho Santa Margarita
The median family income in Rancho Santa Margarita is $179,002, with families comprising 3+ earners (2,267) having the highest median family income of $210,461, while families with no earners (717) have the lowest median family income of $68,250, accounting for 17.6% and 5.6% of families, respectively.
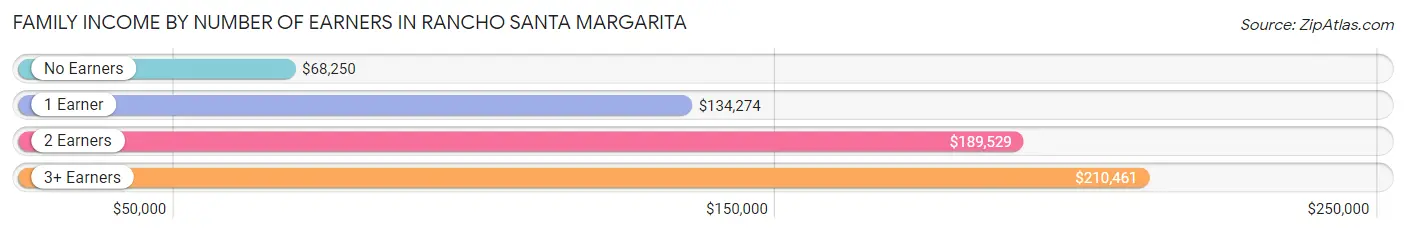
| Number of Earners | # Families | Median Income |
| No Earners | 717 (5.6%) | $68,250 |
| 1 Earner | 3,300 (25.7%) | $134,274 |
| 2 Earners | 6,559 (51.1%) | $189,529 |
| 3+ Earners | 2,267 (17.6%) | $210,461 |
| Total | 12,843 (100.0%) | $179,002 |
Household Income in Rancho Santa Margarita
Household Income Brackets in Rancho Santa Margarita
With 5,980 households falling in the category, the $200,000+ income range is the most frequent in Rancho Santa Margarita, accounting for 35.6% of all households. In contrast, only 168 households (1.0%) fall into the $10,000 to $14,999 income bracket, making it the least populous group.
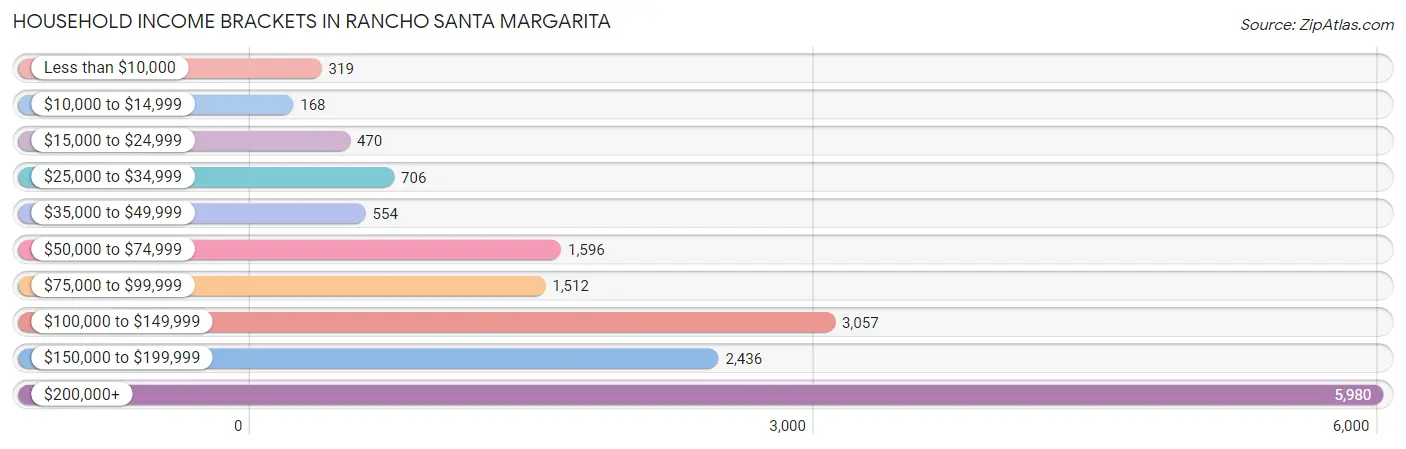
| Income Bracket | # Households | % Households |
| Less than $10,000 | 319 | 1.9% |
| $10,000 to $14,999 | 168 | 1.0% |
| $15,000 to $24,999 | 470 | 2.8% |
| $25,000 to $34,999 | 706 | 4.2% |
| $35,000 to $49,999 | 554 | 3.3% |
| $50,000 to $74,999 | 1,596 | 9.5% |
| $75,000 to $99,999 | 1,512 | 9.0% |
| $100,000 to $149,999 | 3,057 | 18.2% |
| $150,000 to $199,999 | 2,436 | 14.5% |
| $200,000+ | 5,980 | 35.6% |
Household Income by Householder Age in Rancho Santa Margarita
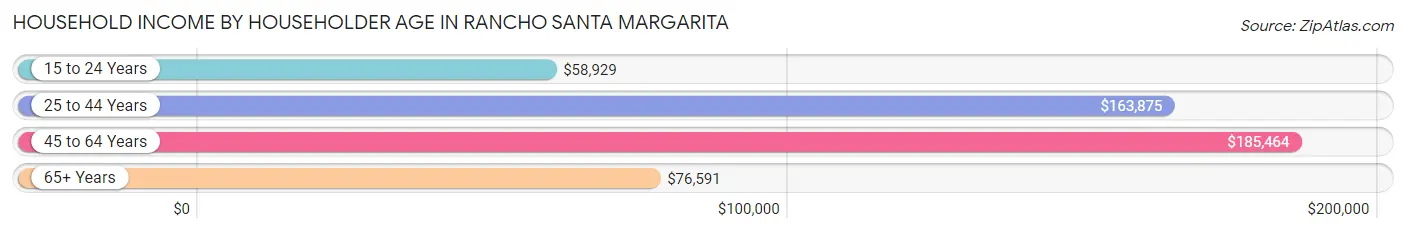
The median household income in Rancho Santa Margarita is $150,146, with the highest median household income of $185,464 found in the 45 to 64 years age bracket for the primary householder. A total of 8,177 households (48.7%) fall into this category. Meanwhile, the 15 to 24 years age bracket for the primary householder has the lowest median household income of $58,929, with 150 households (0.9%) in this group.
| Income Bracket | # Households | Median Income |
| 15 to 24 Years | 150 (0.9%) | $58,929 |
| 25 to 44 Years | 5,461 (32.5%) | $163,875 |
| 45 to 64 Years | 8,177 (48.7%) | $185,464 |
| 65+ Years | 3,010 (17.9%) | $76,591 |
| Total | 16,798 (100.0%) | $150,146 |
Poverty in Rancho Santa Margarita
Income Below Poverty by Sex and Age in Rancho Santa Margarita
With 3.8% poverty level for males and 4.0% for females among the residents of Rancho Santa Margarita, 15 year old males and 12 to 14 year old females are the most vulnerable to poverty, with 72 males (19.3%) and 114 females (11.4%) in their respective age groups living below the poverty level.
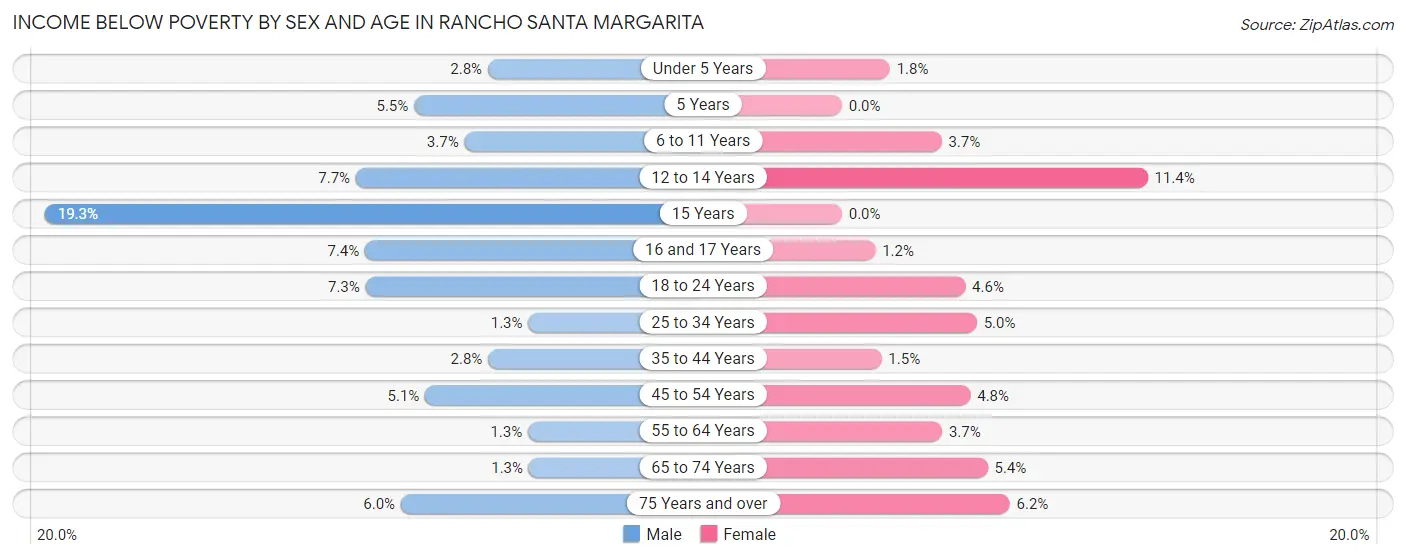
| Age Bracket | Male | Female |
| Under 5 Years | 33 (2.8%) | 27 (1.8%) |
| 5 Years | 17 (5.5%) | 0 (0.0%) |
| 6 to 11 Years | 77 (3.7%) | 60 (3.7%) |
| 12 to 14 Years | 68 (7.7%) | 114 (11.4%) |
| 15 Years | 72 (19.3%) | 0 (0.0%) |
| 16 and 17 Years | 44 (7.4%) | 10 (1.2%) |
| 18 to 24 Years | 153 (7.3%) | 77 (4.6%) |
| 25 to 34 Years | 34 (1.3%) | 131 (5.0%) |
| 35 to 44 Years | 97 (2.8%) | 58 (1.5%) |
| 45 to 54 Years | 189 (5.1%) | 195 (4.8%) |
| 55 to 64 Years | 53 (1.3%) | 133 (3.7%) |
| 65 to 74 Years | 19 (1.3%) | 85 (5.4%) |
| 75 Years and over | 51 (6.0%) | 67 (6.2%) |
| Total | 907 (3.8%) | 957 (4.0%) |
Income Above Poverty by Sex and Age in Rancho Santa Margarita
According to the poverty statistics in Rancho Santa Margarita, males aged 65 to 74 years and females aged 5 years are the age groups that are most secure financially, with 98.7% of males and 100.0% of females in these age groups living above the poverty line.
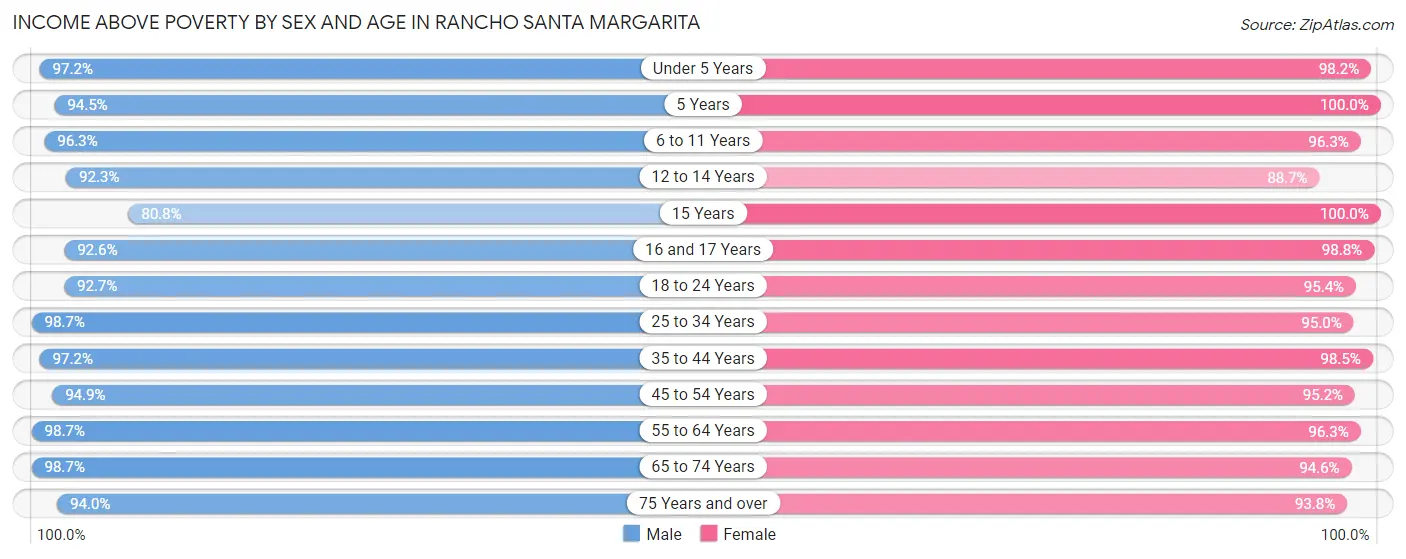
| Age Bracket | Male | Female |
| Under 5 Years | 1,147 (97.2%) | 1,493 (98.2%) |
| 5 Years | 290 (94.5%) | 167 (100.0%) |
| 6 to 11 Years | 2,019 (96.3%) | 1,562 (96.3%) |
| 12 to 14 Years | 815 (92.3%) | 890 (88.6%) |
| 15 Years | 302 (80.7%) | 330 (100.0%) |
| 16 and 17 Years | 554 (92.6%) | 798 (98.8%) |
| 18 to 24 Years | 1,931 (92.7%) | 1,605 (95.4%) |
| 25 to 34 Years | 2,573 (98.7%) | 2,485 (95.0%) |
| 35 to 44 Years | 3,379 (97.2%) | 3,887 (98.5%) |
| 45 to 54 Years | 3,497 (94.9%) | 3,889 (95.2%) |
| 55 to 64 Years | 3,982 (98.7%) | 3,445 (96.3%) |
| 65 to 74 Years | 1,466 (98.7%) | 1,485 (94.6%) |
| 75 Years and over | 795 (94.0%) | 1,009 (93.8%) |
| Total | 22,750 (96.2%) | 23,045 (96.0%) |
Income Below Poverty Among Married-Couple Families in Rancho Santa Margarita
The poverty statistics for married-couple families in Rancho Santa Margarita show that 2.2% or 242 of the total 10,961 families live below the poverty line. Families with 1 or 2 children have the highest poverty rate of 3.7%, comprising of 185 families. On the other hand, families with 3 or 4 children have the lowest poverty rate of 0.0%, which includes 0 families.
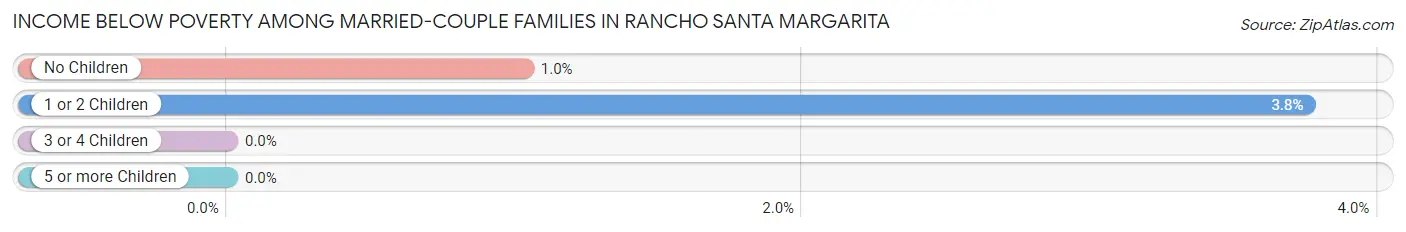
| Children | Above Poverty | Below Poverty |
| No Children | 5,469 (99.0%) | 57 (1.0%) |
| 1 or 2 Children | 4,747 (96.3%) | 185 (3.7%) |
| 3 or 4 Children | 503 (100.0%) | 0 (0.0%) |
| 5 or more Children | 0 (0.0%) | 0 (0.0%) |
| Total | 10,719 (97.8%) | 242 (2.2%) |
Income Below Poverty Among Single-Parent Households in Rancho Santa Margarita
According to the poverty data in Rancho Santa Margarita, 9.8% or 58 single-father households and 10.6% or 137 single-mother households are living below the poverty line. Among single-father households, those with no children have the highest poverty rate, with 44 households (10.4%) experiencing poverty. Likewise, among single-mother households, those with 5 or more children have the highest poverty rate, with 14 households (100.0%) falling below the poverty line.
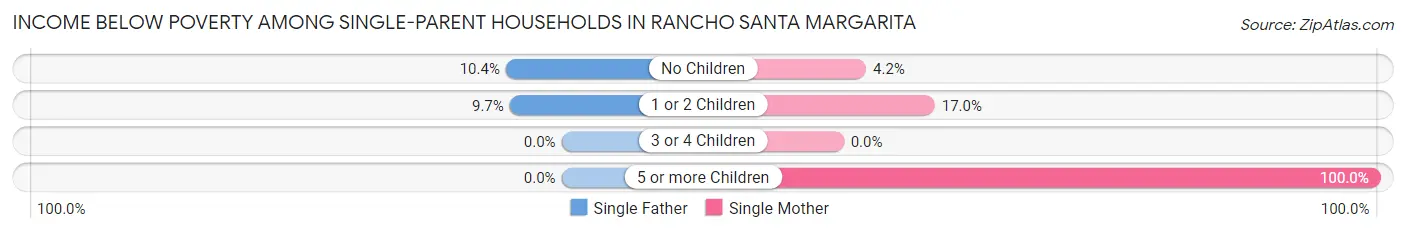
| Children | Single Father | Single Mother |
| No Children | 44 (10.4%) | 30 (4.2%) |
| 1 or 2 Children | 14 (9.7%) | 93 (17.0%) |
| 3 or 4 Children | 0 (0.0%) | 0 (0.0%) |
| 5 or more Children | 0 (0.0%) | 14 (100.0%) |
| Total | 58 (9.8%) | 137 (10.6%) |
Income Below Poverty Among Married-Couple vs Single-Parent Households in Rancho Santa Margarita
The poverty data for Rancho Santa Margarita shows that 242 of the married-couple family households (2.2%) and 195 of the single-parent households (10.4%) are living below the poverty level. Within the married-couple family households, those with 1 or 2 children have the highest poverty rate, with 185 households (3.7%) falling below the poverty line. Among the single-parent households, those with 5 or more children have the highest poverty rate, with 14 household (100.0%) living below poverty.
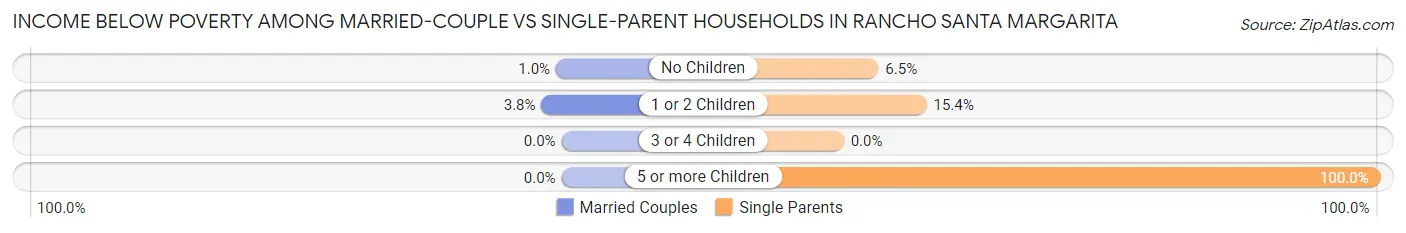
| Children | Married-Couple Families | Single-Parent Households |
| No Children | 57 (1.0%) | 74 (6.5%) |
| 1 or 2 Children | 185 (3.7%) | 107 (15.4%) |
| 3 or 4 Children | 0 (0.0%) | 0 (0.0%) |
| 5 or more Children | 0 (0.0%) | 14 (100.0%) |
| Total | 242 (2.2%) | 195 (10.4%) |
Race in Rancho Santa Margarita
The most populous races in Rancho Santa Margarita are White / Caucasian (32,623 | 68.4%), Hispanic or Latino (9,734 | 20.4%), and Asian (5,947 | 12.5%).
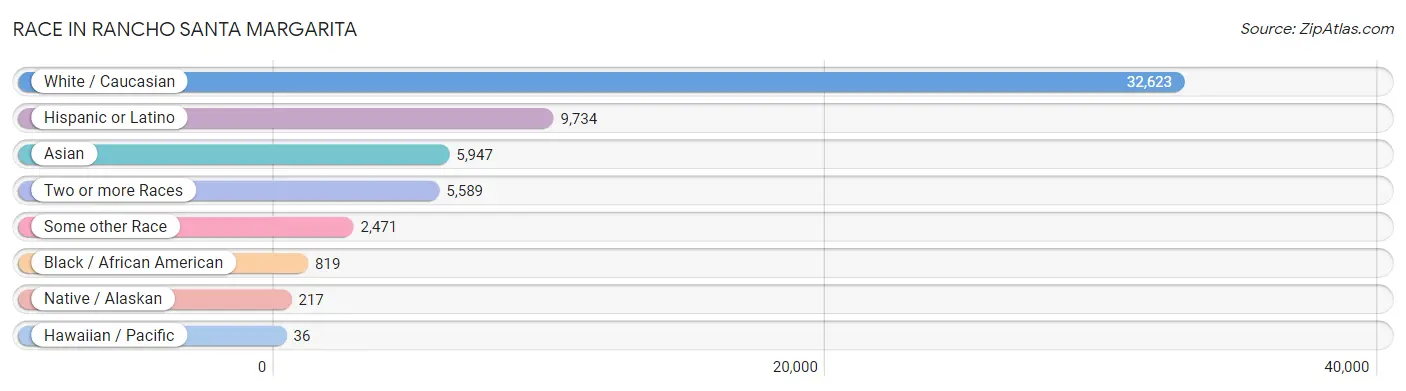
| Race | # Population | % Population |
| Asian | 5,947 | 12.5% |
| Black / African American | 819 | 1.7% |
| Hawaiian / Pacific | 36 | 0.1% |
| Hispanic or Latino | 9,734 | 20.4% |
| Native / Alaskan | 217 | 0.4% |
| White / Caucasian | 32,623 | 68.4% |
| Two or more Races | 5,589 | 11.7% |
| Some other Race | 2,471 | 5.2% |
| Total | 47,702 | 100.0% |
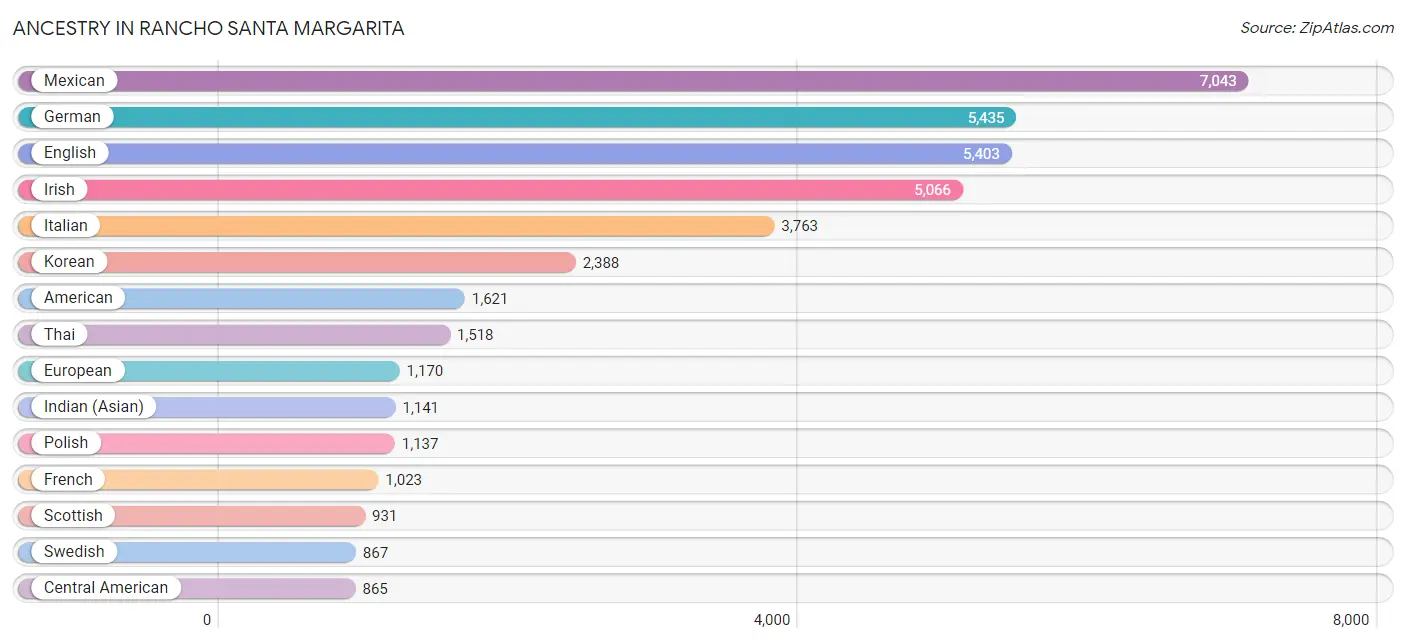
Ancestry in Rancho Santa Margarita
The most populous ancestries reported in Rancho Santa Margarita are Mexican (7,043 | 14.8%), German (5,435 | 11.4%), English (5,403 | 11.3%), Irish (5,066 | 10.6%), and Italian (3,763 | 7.9%), together accounting for 56.0% of all Rancho Santa Margarita residents.
| Ancestry | # Population | % Population |
| Afghan | 127 | 0.3% |
| Albanian | 48 | 0.1% |
| American | 1,621 | 3.4% |
| Arab | 303 | 0.6% |
| Argentinean | 120 | 0.3% |
| Armenian | 160 | 0.3% |
| Austrian | 165 | 0.4% |
| Basque | 22 | 0.1% |
| Belgian | 73 | 0.2% |
| Bhutanese | 850 | 1.8% |
| Bolivian | 31 | 0.1% |
| Brazilian | 347 | 0.7% |
| British | 478 | 1.0% |
| Bulgarian | 74 | 0.2% |
| Burmese | 292 | 0.6% |
| Canadian | 62 | 0.1% |
| Central American | 865 | 1.8% |
| Cherokee | 365 | 0.8% |
| Chilean | 28 | 0.1% |
| Colombian | 106 | 0.2% |
| Costa Rican | 152 | 0.3% |
| Croatian | 51 | 0.1% |
| Cuban | 58 | 0.1% |
| Czech | 152 | 0.3% |
| Czechoslovakian | 4 | 0.0% |
| Danish | 364 | 0.8% |
| Dominican | 13 | 0.0% |
| Dutch | 843 | 1.8% |
| Eastern European | 100 | 0.2% |
| Ecuadorian | 126 | 0.3% |
| Egyptian | 59 | 0.1% |
| English | 5,403 | 11.3% |
| Estonian | 45 | 0.1% |
| European | 1,170 | 2.5% |
| Filipino | 153 | 0.3% |
| Finnish | 142 | 0.3% |
| French | 1,023 | 2.1% |
| French Canadian | 249 | 0.5% |
| German | 5,435 | 11.4% |
| Ghanaian | 36 | 0.1% |
| Greek | 75 | 0.2% |
| Guamanian / Chamorro | 98 | 0.2% |
| Guatemalan | 183 | 0.4% |
| Haitian | 11 | 0.0% |
| Honduran | 53 | 0.1% |
| Hopi | 26 | 0.1% |
| Hungarian | 229 | 0.5% |
| Icelander | 34 | 0.1% |
| Indian (Asian) | 1,141 | 2.4% |
| Indonesian | 7 | 0.0% |
| Iranian | 814 | 1.7% |
| Iraqi | 37 | 0.1% |
| Irish | 5,066 | 10.6% |
| Italian | 3,763 | 7.9% |
| Jamaican | 29 | 0.1% |
| Japanese | 20 | 0.0% |
| Jordanian | 35 | 0.1% |
| Korean | 2,388 | 5.0% |
| Laotian | 90 | 0.2% |
| Lebanese | 49 | 0.1% |
| Lithuanian | 62 | 0.1% |
| Malaysian | 128 | 0.3% |
| Maltese | 25 | 0.1% |
| Mexican | 7,043 | 14.8% |
| Mexican American Indian | 207 | 0.4% |
| Moroccan | 81 | 0.2% |
| Native Hawaiian | 226 | 0.5% |
| Navajo | 304 | 0.6% |
| Nicaraguan | 83 | 0.2% |
| Nigerian | 113 | 0.2% |
| Northern European | 56 | 0.1% |
| Norwegian | 598 | 1.3% |
| Pakistani | 99 | 0.2% |
| Palestinian | 14 | 0.0% |
| Peruvian | 267 | 0.6% |
| Polish | 1,137 | 2.4% |
| Portuguese | 361 | 0.8% |
| Puerto Rican | 168 | 0.4% |
| Puget Sound Salish | 4 | 0.0% |
| Romanian | 84 | 0.2% |
| Russian | 760 | 1.6% |
| Salvadoran | 368 | 0.8% |
| Scandinavian | 114 | 0.2% |
| Scotch-Irish | 400 | 0.8% |
| Scottish | 931 | 1.9% |
| Slavic | 17 | 0.0% |
| Slovak | 13 | 0.0% |
| Slovene | 9 | 0.0% |
| South African | 95 | 0.2% |
| South American | 728 | 1.5% |
| South American Indian | 12 | 0.0% |
| Spaniard | 322 | 0.7% |
| Spanish | 247 | 0.5% |
| Sri Lankan | 824 | 1.7% |
| Subsaharan African | 244 | 0.5% |
| Swedish | 867 | 1.8% |
| Swiss | 195 | 0.4% |
| Syrian | 41 | 0.1% |
| Thai | 1,518 | 3.2% |
| Turkish | 34 | 0.1% |
| Ukrainian | 132 | 0.3% |
| Venezuelan | 32 | 0.1% |
| Welsh | 253 | 0.5% |
| West Indian | 22 | 0.1% |
| Yaqui | 28 | 0.1% |
| Yugoslavian | 19 | 0.0% | View All 106 Rows |
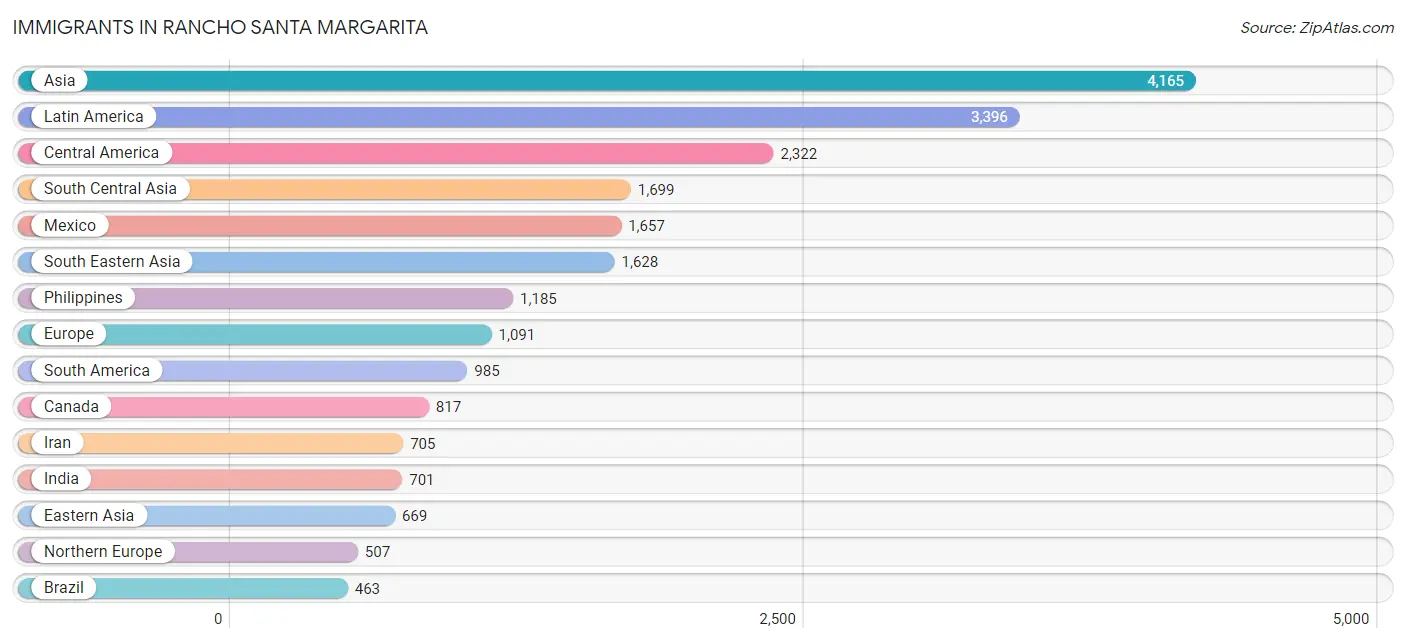
Immigrants in Rancho Santa Margarita
The most numerous immigrant groups reported in Rancho Santa Margarita came from Asia (4,165 | 8.7%), Latin America (3,396 | 7.1%), Central America (2,322 | 4.9%), South Central Asia (1,699 | 3.6%), and Mexico (1,657 | 3.5%), together accounting for 27.7% of all Rancho Santa Margarita residents.
| Immigration Origin | # Population | % Population |
| Afghanistan | 74 | 0.2% |
| Africa | 415 | 0.9% |
| Albania | 24 | 0.1% |
| Argentina | 115 | 0.2% |
| Armenia | 11 | 0.0% |
| Asia | 4,165 | 8.7% |
| Australia | 21 | 0.0% |
| Bolivia | 10 | 0.0% |
| Brazil | 463 | 1.0% |
| Bulgaria | 35 | 0.1% |
| Cambodia | 12 | 0.0% |
| Canada | 817 | 1.7% |
| Caribbean | 89 | 0.2% |
| Central America | 2,322 | 4.9% |
| Chile | 20 | 0.0% |
| China | 425 | 0.9% |
| Colombia | 27 | 0.1% |
| Costa Rica | 30 | 0.1% |
| Cuba | 58 | 0.1% |
| Czechoslovakia | 15 | 0.0% |
| Eastern Africa | 43 | 0.1% |
| Eastern Asia | 669 | 1.4% |
| Eastern Europe | 290 | 0.6% |
| Ecuador | 86 | 0.2% |
| Egypt | 22 | 0.1% |
| El Salvador | 447 | 0.9% |
| England | 304 | 0.6% |
| Europe | 1,091 | 2.3% |
| France | 12 | 0.0% |
| Germany | 81 | 0.2% |
| Ghana | 36 | 0.1% |
| Guatemala | 83 | 0.2% |
| Guyana | 11 | 0.0% |
| Haiti | 11 | 0.0% |
| Honduras | 22 | 0.1% |
| Hong Kong | 13 | 0.0% |
| Hungary | 31 | 0.1% |
| India | 701 | 1.5% |
| Indonesia | 92 | 0.2% |
| Iran | 705 | 1.5% |
| Italy | 56 | 0.1% |
| Jamaica | 20 | 0.0% |
| Japan | 49 | 0.1% |
| Jordan | 19 | 0.0% |
| Kazakhstan | 53 | 0.1% |
| Kenya | 43 | 0.1% |
| Korea | 195 | 0.4% |
| Latin America | 3,396 | 7.1% |
| Lebanon | 36 | 0.1% |
| Liberia | 7 | 0.0% |
| Mexico | 1,657 | 3.5% |
| Morocco | 47 | 0.1% |
| Nepal | 28 | 0.1% |
| Netherlands | 126 | 0.3% |
| Nicaragua | 83 | 0.2% |
| Nigeria | 93 | 0.2% |
| Northern Africa | 87 | 0.2% |
| Northern Europe | 507 | 1.1% |
| Norway | 15 | 0.0% |
| Oceania | 21 | 0.0% |
| Pakistan | 34 | 0.1% |
| Peru | 221 | 0.5% |
| Philippines | 1,185 | 2.5% |
| Poland | 25 | 0.1% |
| Portugal | 12 | 0.0% |
| Russia | 76 | 0.2% |
| Saudi Arabia | 61 | 0.1% |
| Scotland | 14 | 0.0% |
| Singapore | 24 | 0.1% |
| South Africa | 149 | 0.3% |
| South America | 985 | 2.1% |
| South Central Asia | 1,699 | 3.6% |
| South Eastern Asia | 1,628 | 3.4% |
| Southern Europe | 68 | 0.1% |
| Sri Lanka | 17 | 0.0% |
| Sudan | 18 | 0.0% |
| Switzerland | 7 | 0.0% |
| Syria | 24 | 0.1% |
| Taiwan | 218 | 0.5% |
| Thailand | 64 | 0.1% |
| Turkey | 18 | 0.0% |
| Ukraine | 8 | 0.0% |
| Uzbekistan | 87 | 0.2% |
| Venezuela | 32 | 0.1% |
| Vietnam | 251 | 0.5% |
| Western Africa | 136 | 0.3% |
| Western Asia | 169 | 0.4% |
| Western Europe | 226 | 0.5% | View All 88 Rows |
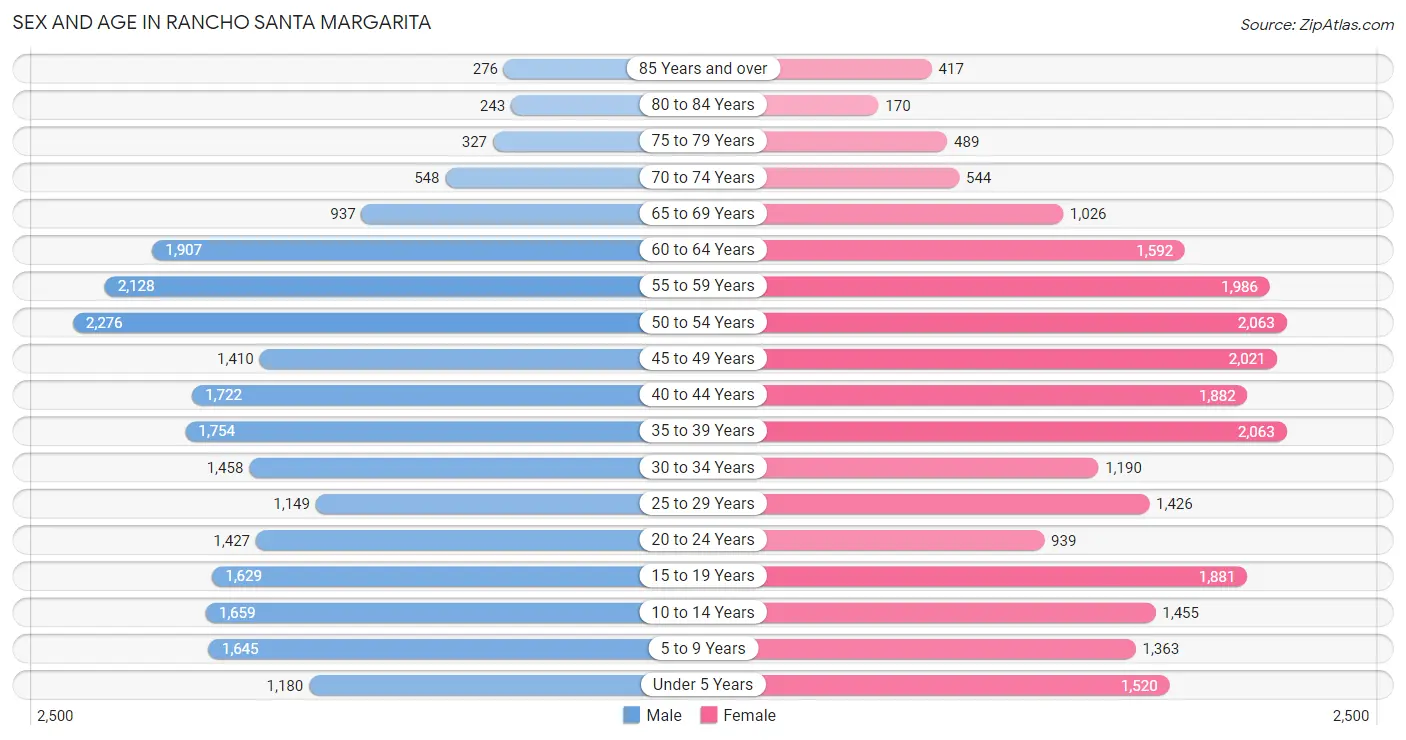
Sex and Age in Rancho Santa Margarita
Sex and Age in Rancho Santa Margarita
The most populous age groups in Rancho Santa Margarita are 50 to 54 Years (2,276 | 9.6%) for men and 35 to 39 Years (2,063 | 8.6%) for women.
| Age Bracket | Male | Female |
| Under 5 Years | 1,180 (5.0%) | 1,520 (6.3%) |
| 5 to 9 Years | 1,645 (7.0%) | 1,363 (5.7%) |
| 10 to 14 Years | 1,659 (7.0%) | 1,455 (6.1%) |
| 15 to 19 Years | 1,629 (6.9%) | 1,881 (7.8%) |
| 20 to 24 Years | 1,427 (6.0%) | 939 (3.9%) |
| 25 to 29 Years | 1,149 (4.9%) | 1,426 (5.9%) |
| 30 to 34 Years | 1,458 (6.2%) | 1,190 (5.0%) |
| 35 to 39 Years | 1,754 (7.4%) | 2,063 (8.6%) |
| 40 to 44 Years | 1,722 (7.3%) | 1,882 (7.8%) |
| 45 to 49 Years | 1,410 (6.0%) | 2,021 (8.4%) |
| 50 to 54 Years | 2,276 (9.6%) | 2,063 (8.6%) |
| 55 to 59 Years | 2,128 (9.0%) | 1,986 (8.3%) |
| 60 to 64 Years | 1,907 (8.1%) | 1,592 (6.6%) |
| 65 to 69 Years | 937 (4.0%) | 1,026 (4.3%) |
| 70 to 74 Years | 548 (2.3%) | 544 (2.3%) |
| 75 to 79 Years | 327 (1.4%) | 489 (2.0%) |
| 80 to 84 Years | 243 (1.0%) | 170 (0.7%) |
| 85 Years and over | 276 (1.2%) | 417 (1.7%) |
| Total | 23,675 (100.0%) | 24,027 (100.0%) |
Families and Households in Rancho Santa Margarita
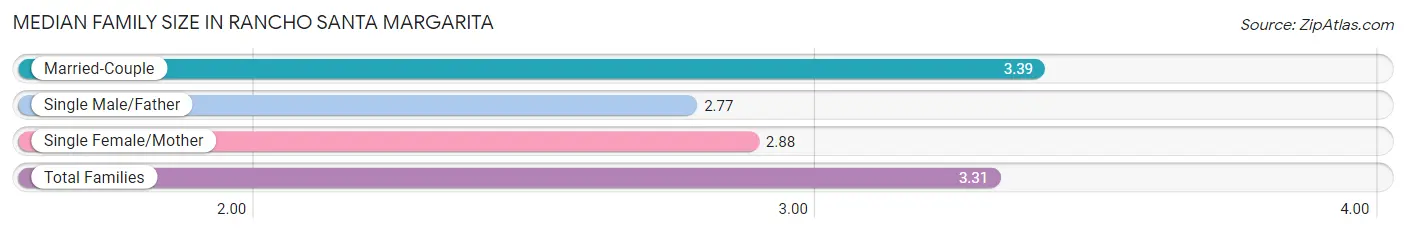
Median Family Size in Rancho Santa Margarita
The median family size in Rancho Santa Margarita is 3.31 persons per family, with married-couple families (10,961 | 85.4%) accounting for the largest median family size of 3.39 persons per family. On the other hand, single male/father families (591 | 4.6%) represent the smallest median family size with 2.77 persons per family.
| Family Type | # Families | Family Size |
| Married-Couple | 10,961 (85.4%) | 3.39 |
| Single Male/Father | 591 (4.6%) | 2.77 |
| Single Female/Mother | 1,291 (10.1%) | 2.88 |
| Total Families | 12,843 (100.0%) | 3.31 |
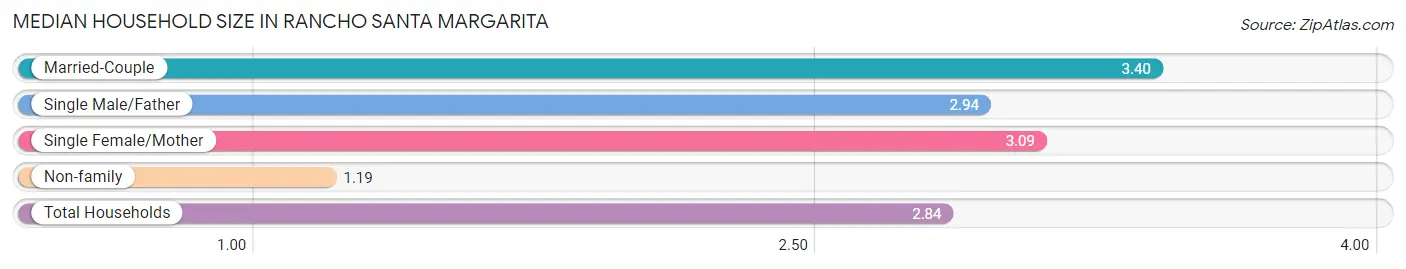
Median Household Size in Rancho Santa Margarita
The median household size in Rancho Santa Margarita is 2.84 persons per household, with married-couple households (10,961 | 65.2%) accounting for the largest median household size of 3.4 persons per household. non-family households (3,955 | 23.5%) represent the smallest median household size with 1.19 persons per household.
| Household Type | # Households | Household Size |
| Married-Couple | 10,961 (65.2%) | 3.40 |
| Single Male/Father | 591 (3.5%) | 2.94 |
| Single Female/Mother | 1,291 (7.7%) | 3.09 |
| Non-family | 3,955 (23.5%) | 1.19 |
| Total Households | 16,798 (100.0%) | 2.84 |
Household Size by Marriage Status in Rancho Santa Margarita
Out of a total of 16,798 households in Rancho Santa Margarita, 12,843 (76.5%) are family households, while 3,955 (23.5%) are nonfamily households. The most numerous type of family households are 2-person households, comprising 4,610, and the most common type of nonfamily households are 1-person households, comprising 3,335.
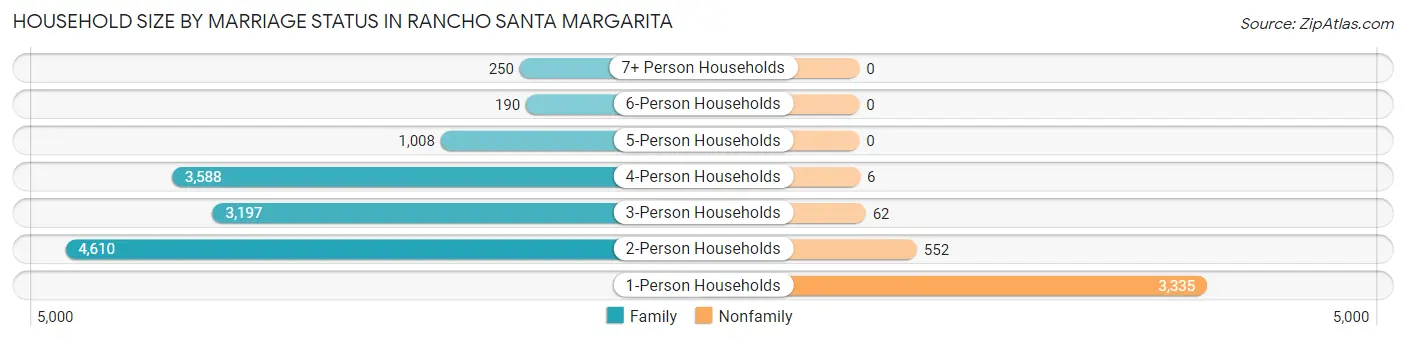
| Household Size | Family Households | Nonfamily Households |
| 1-Person Households | - | 3,335 (19.9%) |
| 2-Person Households | 4,610 (27.4%) | 552 (3.3%) |
| 3-Person Households | 3,197 (19.0%) | 62 (0.4%) |
| 4-Person Households | 3,588 (21.4%) | 6 (0.0%) |
| 5-Person Households | 1,008 (6.0%) | 0 (0.0%) |
| 6-Person Households | 190 (1.1%) | 0 (0.0%) |
| 7+ Person Households | 250 (1.5%) | 0 (0.0%) |
| Total | 12,843 (76.5%) | 3,955 (23.5%) |
Female Fertility in Rancho Santa Margarita
Fertility by Age in Rancho Santa Margarita
Average fertility rate in Rancho Santa Margarita is 47.0 births per 1,000 women. Women in the age bracket of 20 to 34 years have the highest fertility rate with 97.0 births per 1,000 women. Women in the age bracket of 20 to 34 years acount for 62.2% of all women with births.
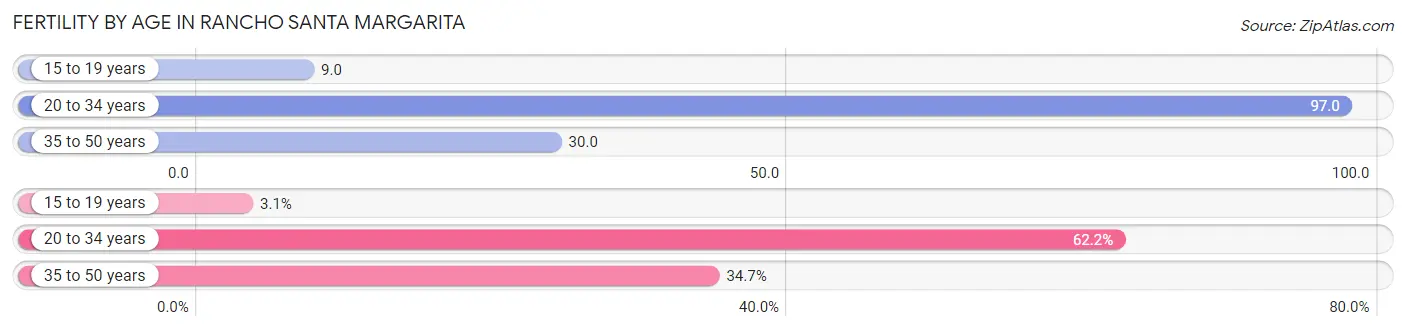
| Age Bracket | Women with Births | Births / 1,000 Women |
| 15 to 19 years | 17 (3.1%) | 9.0 |
| 20 to 34 years | 346 (62.2%) | 97.0 |
| 35 to 50 years | 193 (34.7%) | 30.0 |
| Total | 556 (100.0%) | 47.0 |
Fertility by Age by Marriage Status in Rancho Santa Margarita
98.7% of women with births (556) in Rancho Santa Margarita are married. The highest percentage of unmarried women with births falls into 35 to 50 years age bracket with 3.6% of them unmarried at the time of birth, while the lowest percentage of unmarried women with births belong to 15 to 19 years age bracket with 0.0% of them unmarried.
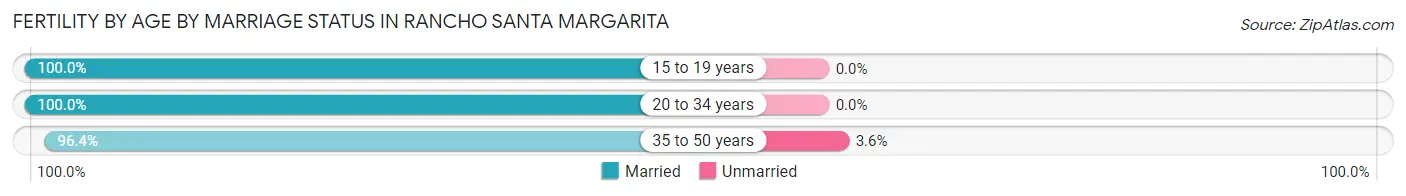
| Age Bracket | Married | Unmarried |
| 15 to 19 years | 17 (100.0%) | 0 (0.0%) |
| 20 to 34 years | 346 (100.0%) | 0 (0.0%) |
| 35 to 50 years | 186 (96.4%) | 7 (3.6%) |
| Total | 549 (98.7%) | 7 (1.3%) |
Fertility by Education in Rancho Santa Margarita
Average fertility rate in Rancho Santa Margarita is 47.0 births per 1,000 women. Women with the education attainment of graduate degree have the highest fertility rate of 102.0 births per 1,000 women, while women with the education attainment of less than high school have the lowest fertility at 10.0 births per 1,000 women. Women with the education attainment of bachelor's degree represent 44.2% of all women with births.
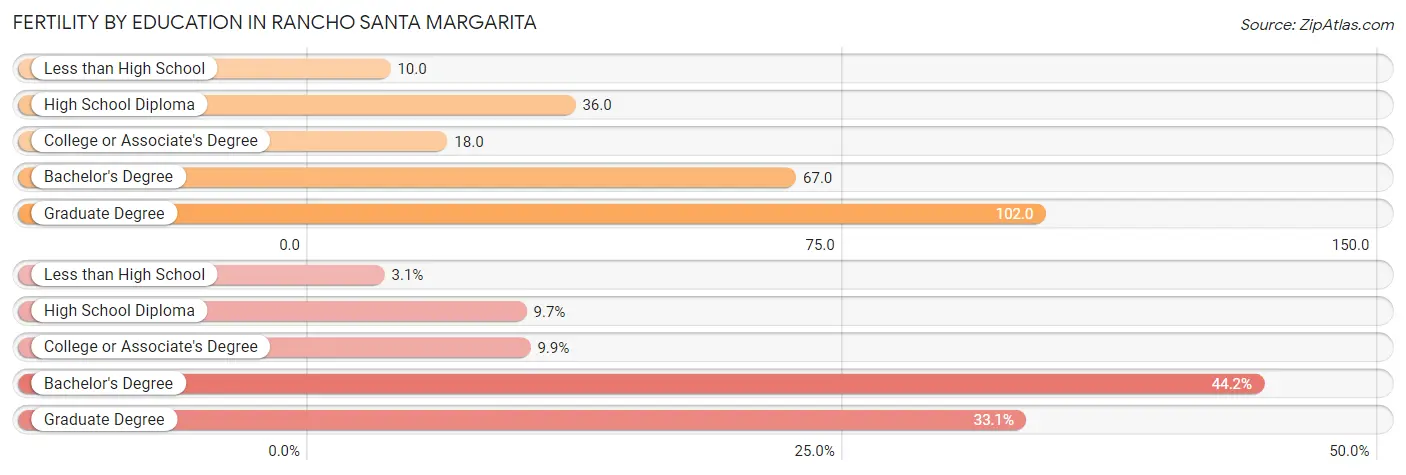
| Educational Attainment | Women with Births | Births / 1,000 Women |
| Less than High School | 17 (3.1%) | 10.0 |
| High School Diploma | 54 (9.7%) | 36.0 |
| College or Associate's Degree | 55 (9.9%) | 18.0 |
| Bachelor's Degree | 246 (44.2%) | 67.0 |
| Graduate Degree | 184 (33.1%) | 102.0 |
| Total | 556 (100.0%) | 47.0 |
Fertility by Education by Marriage Status in Rancho Santa Margarita
1.3% of women with births in Rancho Santa Margarita are unmarried. Women with the educational attainment of less than high school are most likely to be married with 100.0% of them married at childbirth, while women with the educational attainment of graduate degree are least likely to be married with 3.8% of them unmarried at childbirth.
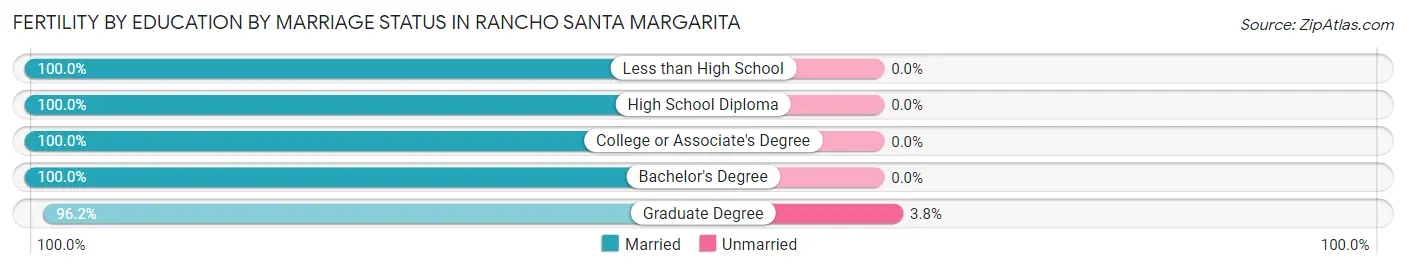
| Educational Attainment | Married | Unmarried |
| Less than High School | 17 (100.0%) | 0 (0.0%) |
| High School Diploma | 54 (100.0%) | 0 (0.0%) |
| College or Associate's Degree | 55 (100.0%) | 0 (0.0%) |
| Bachelor's Degree | 246 (100.0%) | 0 (0.0%) |
| Graduate Degree | 177 (96.2%) | 7 (3.8%) |
| Total | 549 (98.7%) | 7 (1.3%) |
Employment Characteristics in Rancho Santa Margarita
Employment by Class of Employer in Rancho Santa Margarita
Among the 27,033 employed individuals in Rancho Santa Margarita, private company employees (18,869 | 69.8%), not-for-profit organizations (2,280 | 8.4%), and local government employees (1,779 | 6.6%) make up the most common classes of employment.
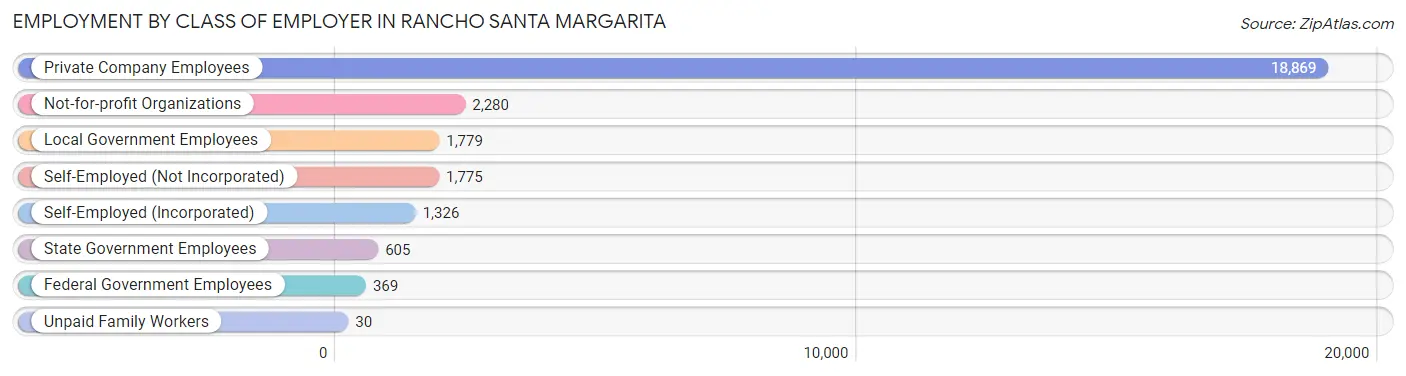
| Employer Class | # Employees | % Employees |
| Private Company Employees | 18,869 | 69.8% |
| Self-Employed (Incorporated) | 1,326 | 4.9% |
| Self-Employed (Not Incorporated) | 1,775 | 6.6% |
| Not-for-profit Organizations | 2,280 | 8.4% |
| Local Government Employees | 1,779 | 6.6% |
| State Government Employees | 605 | 2.2% |
| Federal Government Employees | 369 | 1.4% |
| Unpaid Family Workers | 30 | 0.1% |
| Total | 27,033 | 100.0% |
Employment Status by Age in Rancho Santa Margarita
According to the labor force statistics for Rancho Santa Margarita, out of the total population over 16 years of age (38,176), 74.3% or 28,365 individuals are in the labor force, with 3.3% or 936 of them unemployed. The age group with the highest labor force participation rate is 25 to 29 years, with 90.4% or 2,328 individuals in the labor force. Within the labor force, the 16 to 19 years age range has the highest percentage of unemployed individuals, with 12.0% or 115 of them being unemployed.
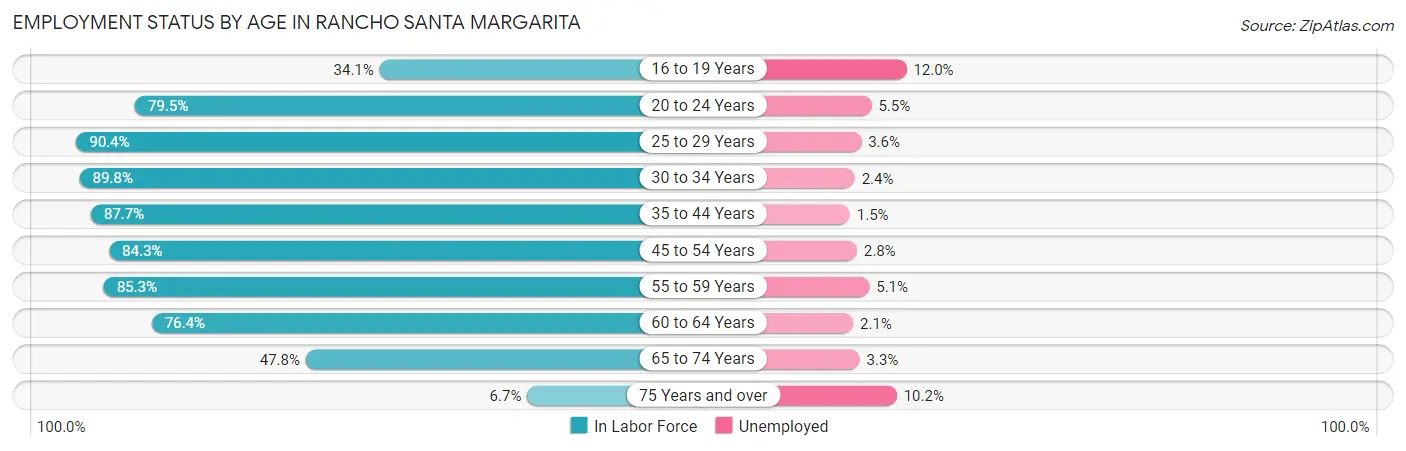
| Age Bracket | In Labor Force | Unemployed |
| 16 to 19 Years | 957 (34.1%) | 115 (12.0%) |
| 20 to 24 Years | 1,881 (79.5%) | 103 (5.5%) |
| 25 to 29 Years | 2,328 (90.4%) | 84 (3.6%) |
| 30 to 34 Years | 2,378 (89.8%) | 57 (2.4%) |
| 35 to 44 Years | 6,508 (87.7%) | 98 (1.5%) |
| 45 to 54 Years | 6,550 (84.3%) | 183 (2.8%) |
| 55 to 59 Years | 3,509 (85.3%) | 179 (5.1%) |
| 60 to 64 Years | 2,673 (76.4%) | 56 (2.1%) |
| 65 to 74 Years | 1,460 (47.8%) | 48 (3.3%) |
| 75 Years and over | 129 (6.7%) | 13 (10.2%) |
| Total | 28,365 (74.3%) | 936 (3.3%) |
Employment Status by Educational Attainment in Rancho Santa Margarita
According to labor force statistics for Rancho Santa Margarita, 85.5% of individuals (23,963) out of the total population between 25 and 64 years of age (28,027) are in the labor force, with 2.7% or 647 of them being unemployed. The group with the highest labor force participation rate are those with the educational attainment of bachelor's degree or higher, with 89.1% or 12,748 individuals in the labor force. Within the labor force, individuals with college / associate degree education have the highest percentage of unemployment, with 4.3% or 308 of them being unemployed.
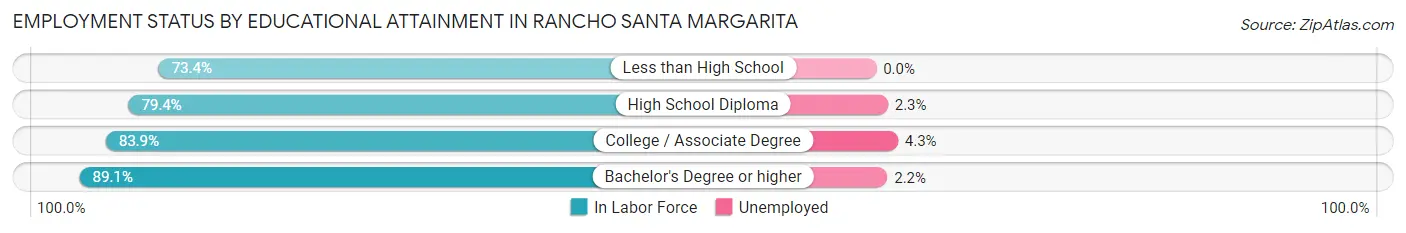
| Educational Attainment | In Labor Force | Unemployed |
| Less than High School | 974 (73.4%) | 0 (0.0%) |
| High School Diploma | 3,065 (79.4%) | 89 (2.3%) |
| College / Associate Degree | 7,158 (83.9%) | 367 (4.3%) |
| Bachelor's Degree or higher | 12,748 (89.1%) | 315 (2.2%) |
| Total | 23,963 (85.5%) | 757 (2.7%) |
Employment Occupations by Sex in Rancho Santa Margarita
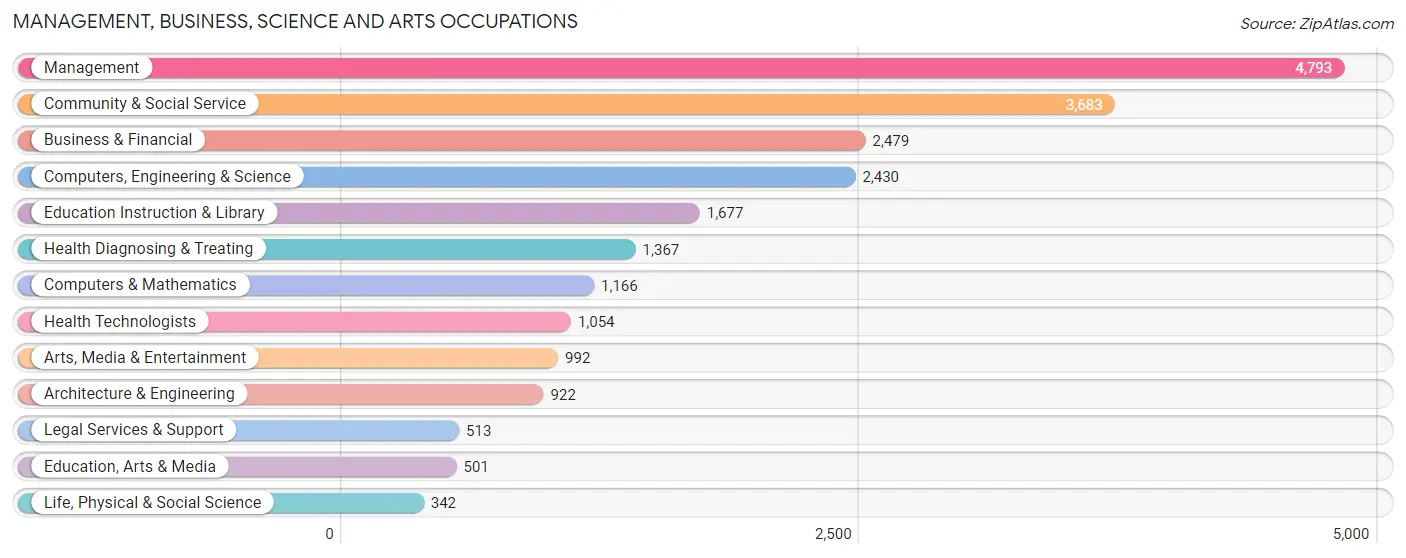
Management, Business, Science and Arts Occupations
The most common Management, Business, Science and Arts occupations in Rancho Santa Margarita are Management (4,793 | 17.5%), Community & Social Service (3,683 | 13.4%), Business & Financial (2,479 | 9.0%), Computers, Engineering & Science (2,430 | 8.9%), and Education Instruction & Library (1,677 | 6.1%).
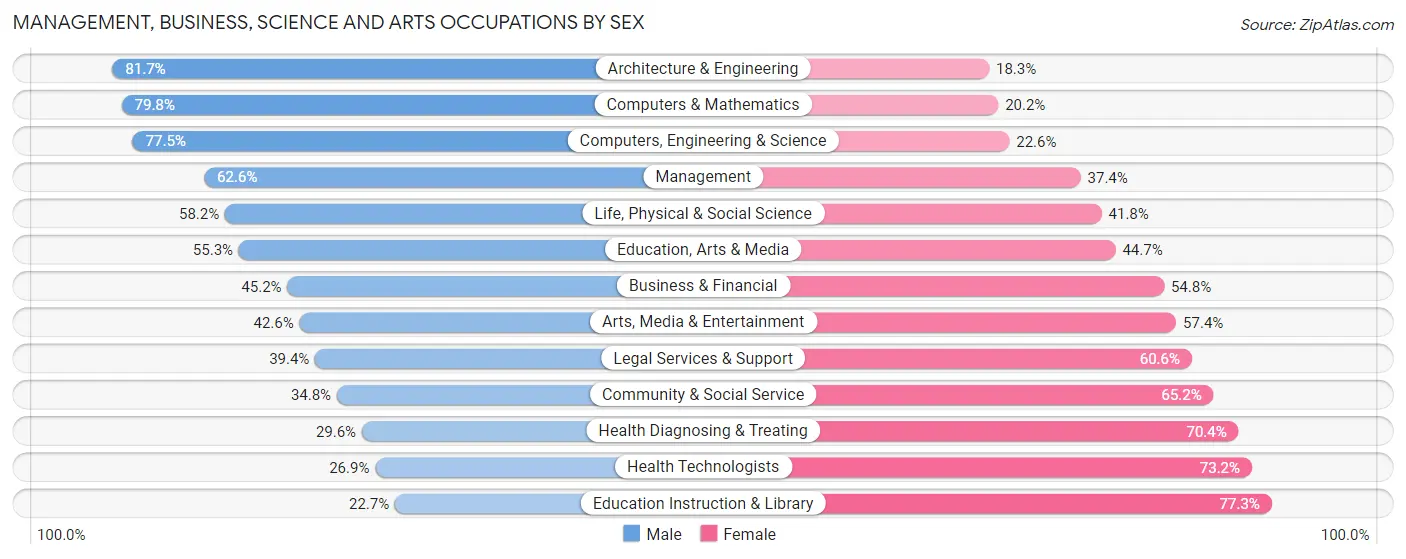
Management, Business, Science and Arts Occupations by Sex
Within the Management, Business, Science and Arts occupations in Rancho Santa Margarita, the most male-oriented occupations are Architecture & Engineering (81.7%), Computers & Mathematics (79.8%), and Computers, Engineering & Science (77.4%), while the most female-oriented occupations are Education Instruction & Library (77.3%), Health Technologists (73.2%), and Health Diagnosing & Treating (70.4%).
| Occupation | Male | Female |
| Management | 2,999 (62.6%) | 1,794 (37.4%) |
| Business & Financial | 1,120 (45.2%) | 1,359 (54.8%) |
| Computers, Engineering & Science | 1,882 (77.4%) | 548 (22.6%) |
| Computers & Mathematics | 930 (79.8%) | 236 (20.2%) |
| Architecture & Engineering | 753 (81.7%) | 169 (18.3%) |
| Life, Physical & Social Science | 199 (58.2%) | 143 (41.8%) |
| Community & Social Service | 1,283 (34.8%) | 2,400 (65.2%) |
| Education, Arts & Media | 277 (55.3%) | 224 (44.7%) |
| Legal Services & Support | 202 (39.4%) | 311 (60.6%) |
| Education Instruction & Library | 381 (22.7%) | 1,296 (77.3%) |
| Arts, Media & Entertainment | 423 (42.6%) | 569 (57.4%) |
| Health Diagnosing & Treating | 405 (29.6%) | 962 (70.4%) |
| Health Technologists | 283 (26.9%) | 771 (73.2%) |
| Total (Category) | 7,689 (52.1%) | 7,063 (47.9%) |
| Total (Overall) | 14,731 (53.7%) | 12,702 (46.3%) |
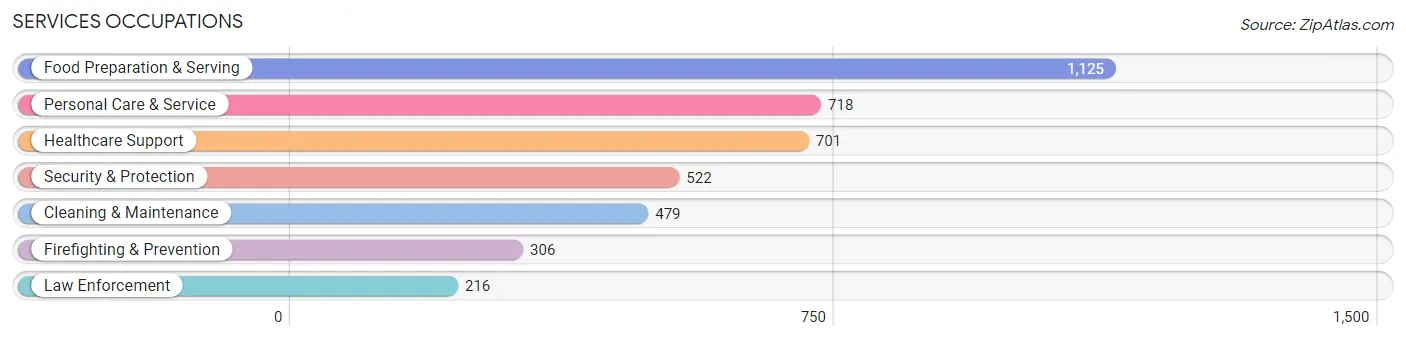
Services Occupations
The most common Services occupations in Rancho Santa Margarita are Food Preparation & Serving (1,125 | 4.1%), Personal Care & Service (718 | 2.6%), Healthcare Support (701 | 2.6%), Security & Protection (522 | 1.9%), and Cleaning & Maintenance (479 | 1.8%).
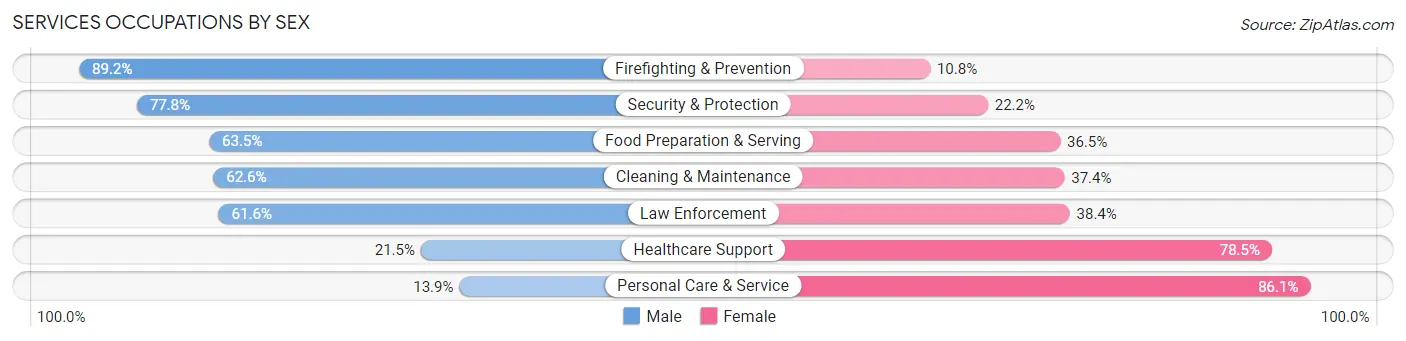
Services Occupations by Sex
Within the Services occupations in Rancho Santa Margarita, the most male-oriented occupations are Firefighting & Prevention (89.2%), Security & Protection (77.8%), and Food Preparation & Serving (63.5%), while the most female-oriented occupations are Personal Care & Service (86.1%), Healthcare Support (78.5%), and Law Enforcement (38.4%).
| Occupation | Male | Female |
| Healthcare Support | 151 (21.5%) | 550 (78.5%) |
| Security & Protection | 406 (77.8%) | 116 (22.2%) |
| Firefighting & Prevention | 273 (89.2%) | 33 (10.8%) |
| Law Enforcement | 133 (61.6%) | 83 (38.4%) |
| Food Preparation & Serving | 714 (63.5%) | 411 (36.5%) |
| Cleaning & Maintenance | 300 (62.6%) | 179 (37.4%) |
| Personal Care & Service | 100 (13.9%) | 618 (86.1%) |
| Total (Category) | 1,671 (47.1%) | 1,874 (52.9%) |
| Total (Overall) | 14,731 (53.7%) | 12,702 (46.3%) |
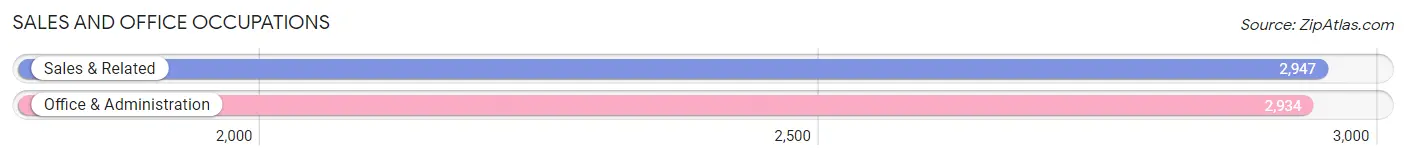
Sales and Office Occupations
The most common Sales and Office occupations in Rancho Santa Margarita are Sales & Related (2,947 | 10.7%), and Office & Administration (2,934 | 10.7%).
Sales and Office Occupations by Sex
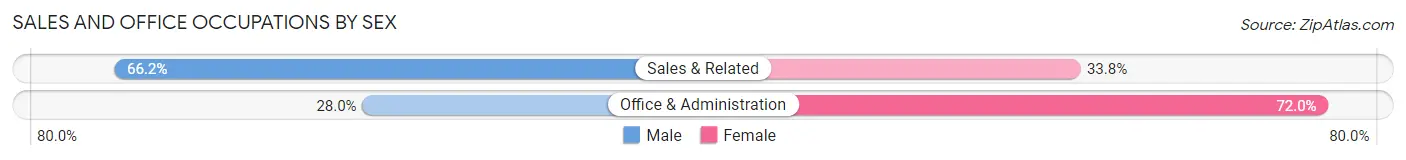
| Occupation | Male | Female |
| Sales & Related | 1,952 (66.2%) | 995 (33.8%) |
| Office & Administration | 822 (28.0%) | 2,112 (72.0%) |
| Total (Category) | 2,774 (47.2%) | 3,107 (52.8%) |
| Total (Overall) | 14,731 (53.7%) | 12,702 (46.3%) |
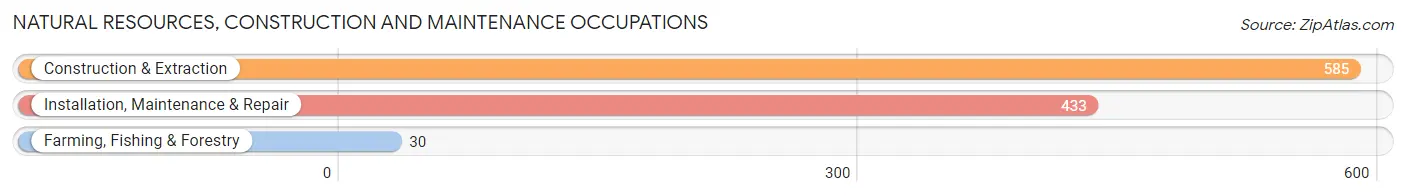
Natural Resources, Construction and Maintenance Occupations
The most common Natural Resources, Construction and Maintenance occupations in Rancho Santa Margarita are Construction & Extraction (585 | 2.1%), Installation, Maintenance & Repair (433 | 1.6%), and Farming, Fishing & Forestry (30 | 0.1%).
Natural Resources, Construction and Maintenance Occupations by Sex
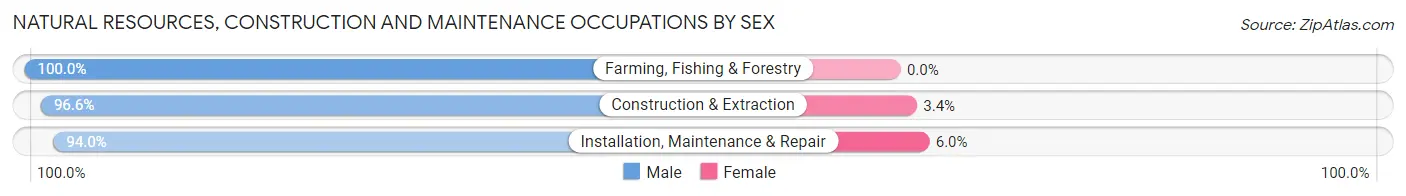
| Occupation | Male | Female |
| Farming, Fishing & Forestry | 30 (100.0%) | 0 (0.0%) |
| Construction & Extraction | 565 (96.6%) | 20 (3.4%) |
| Installation, Maintenance & Repair | 407 (94.0%) | 26 (6.0%) |
| Total (Category) | 1,002 (95.6%) | 46 (4.4%) |
| Total (Overall) | 14,731 (53.7%) | 12,702 (46.3%) |
Production, Transportation and Moving Occupations
The most common Production, Transportation and Moving occupations in Rancho Santa Margarita are Production (1,109 | 4.0%), Transportation (663 | 2.4%), and Material Moving (435 | 1.6%).
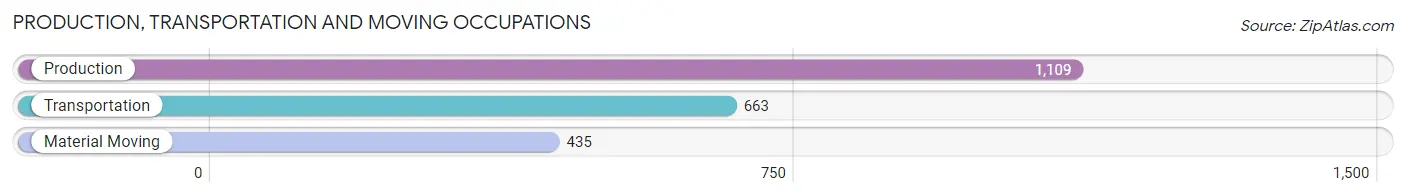
Production, Transportation and Moving Occupations by Sex
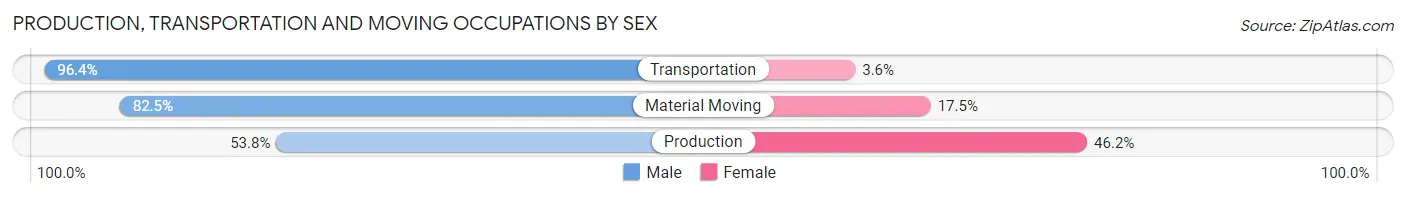
| Occupation | Male | Female |
| Production | 597 (53.8%) | 512 (46.2%) |
| Transportation | 639 (96.4%) | 24 (3.6%) |
| Material Moving | 359 (82.5%) | 76 (17.5%) |
| Total (Category) | 1,595 (72.3%) | 612 (27.7%) |
| Total (Overall) | 14,731 (53.7%) | 12,702 (46.3%) |
Employment Industries by Sex in Rancho Santa Margarita
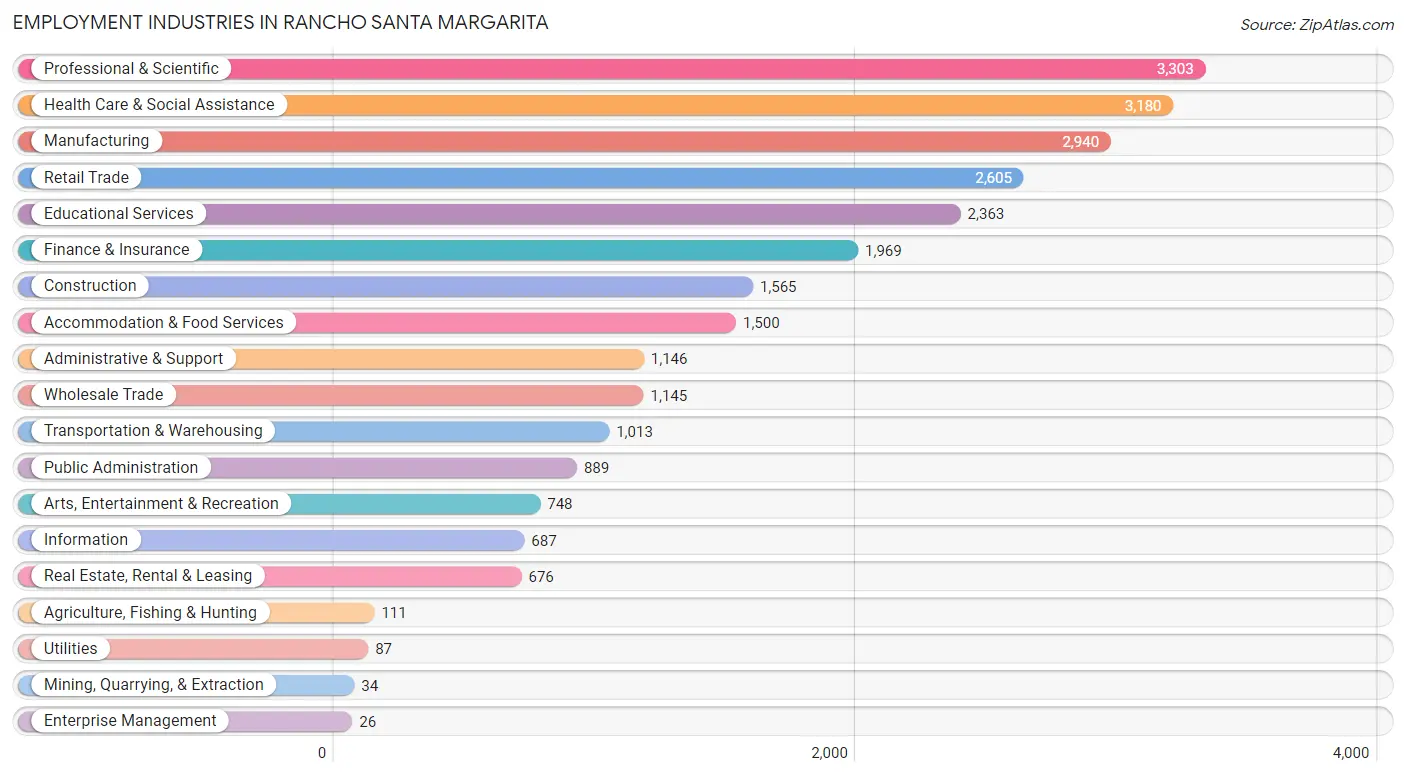
Employment Industries in Rancho Santa Margarita
The major employment industries in Rancho Santa Margarita include Professional & Scientific (3,303 | 12.0%), Health Care & Social Assistance (3,180 | 11.6%), Manufacturing (2,940 | 10.7%), Retail Trade (2,605 | 9.5%), and Educational Services (2,363 | 8.6%).
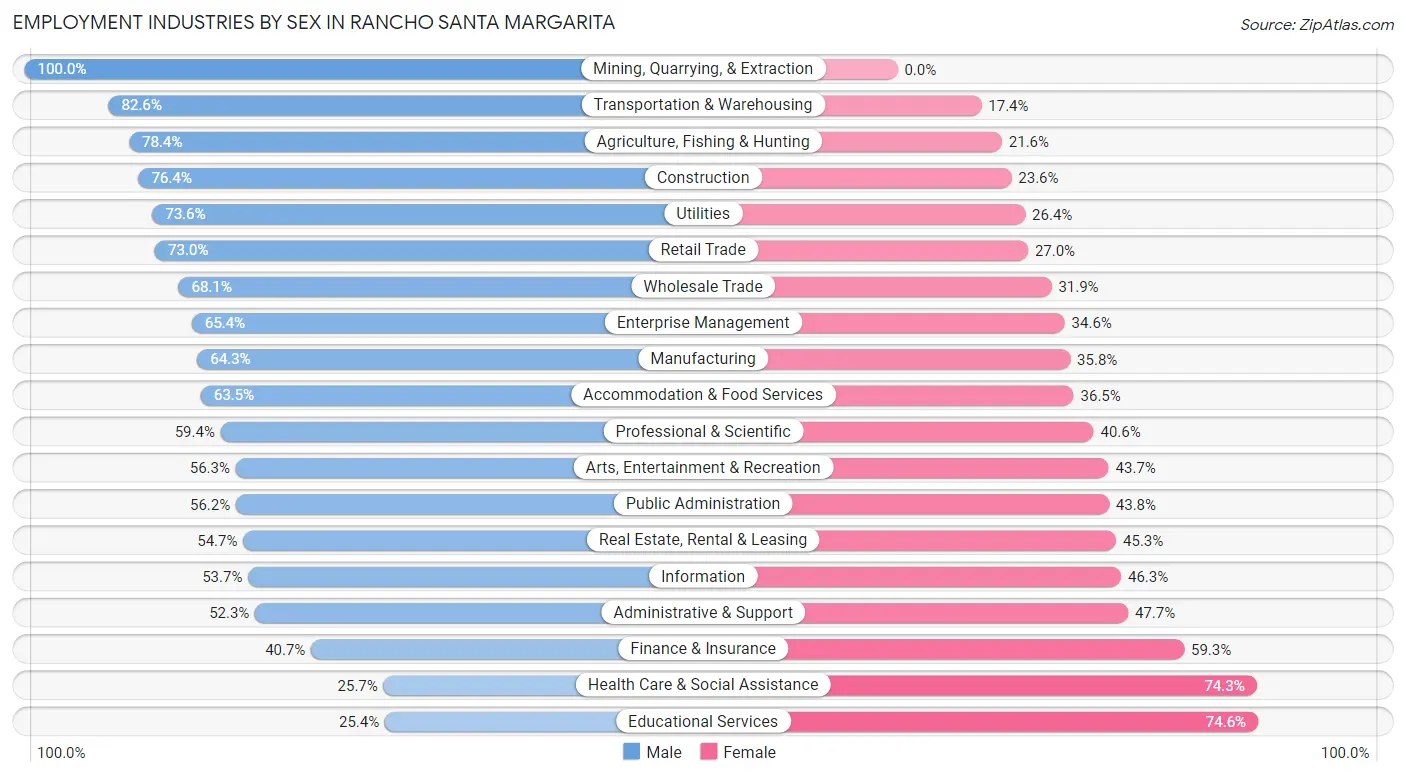
Employment Industries by Sex in Rancho Santa Margarita
The Rancho Santa Margarita industries that see more men than women are Mining, Quarrying, & Extraction (100.0%), Transportation & Warehousing (82.6%), and Agriculture, Fishing & Hunting (78.4%), whereas the industries that tend to have a higher number of women are Educational Services (74.6%), Health Care & Social Assistance (74.3%), and Finance & Insurance (59.3%).
| Industry | Male | Female |
| Agriculture, Fishing & Hunting | 87 (78.4%) | 24 (21.6%) |
| Mining, Quarrying, & Extraction | 34 (100.0%) | 0 (0.0%) |
| Construction | 1,196 (76.4%) | 369 (23.6%) |
| Manufacturing | 1,889 (64.2%) | 1,051 (35.7%) |
| Wholesale Trade | 780 (68.1%) | 365 (31.9%) |
| Retail Trade | 1,901 (73.0%) | 704 (27.0%) |
| Transportation & Warehousing | 837 (82.6%) | 176 (17.4%) |
| Utilities | 64 (73.6%) | 23 (26.4%) |
| Information | 369 (53.7%) | 318 (46.3%) |
| Finance & Insurance | 801 (40.7%) | 1,168 (59.3%) |
| Real Estate, Rental & Leasing | 370 (54.7%) | 306 (45.3%) |
| Professional & Scientific | 1,962 (59.4%) | 1,341 (40.6%) |
| Enterprise Management | 17 (65.4%) | 9 (34.6%) |
| Administrative & Support | 599 (52.3%) | 547 (47.7%) |
| Educational Services | 600 (25.4%) | 1,763 (74.6%) |
| Health Care & Social Assistance | 817 (25.7%) | 2,363 (74.3%) |
| Arts, Entertainment & Recreation | 421 (56.3%) | 327 (43.7%) |
| Accommodation & Food Services | 953 (63.5%) | 547 (36.5%) |
| Public Administration | 500 (56.2%) | 389 (43.8%) |
| Total | 14,731 (53.7%) | 12,702 (46.3%) |
Education in Rancho Santa Margarita
School Enrollment in Rancho Santa Margarita
The most common levels of schooling among the 12,818 students in Rancho Santa Margarita are high school (2,926 | 22.8%), college / undergraduate (2,802 | 21.9%), and elementary school (2,457 | 19.2%).
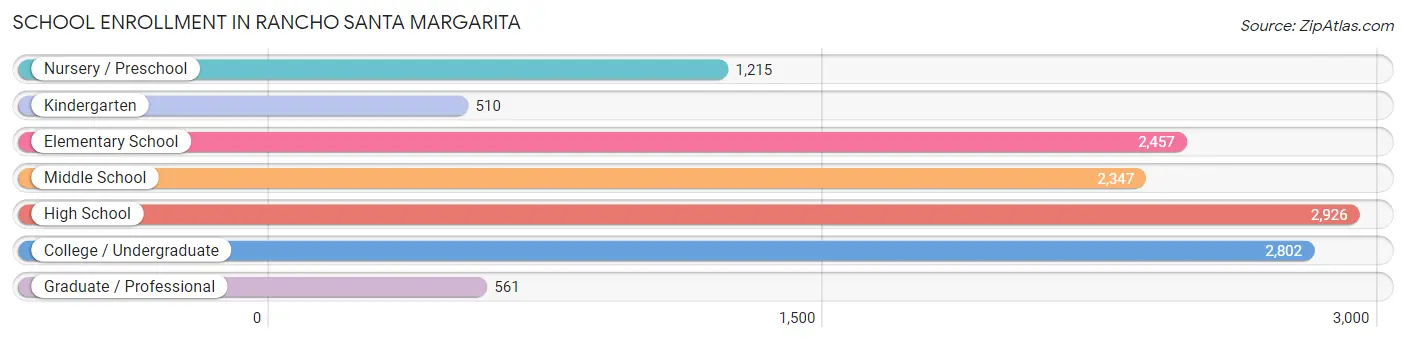
| School Level | # Students | % Students |
| Nursery / Preschool | 1,215 | 9.5% |
| Kindergarten | 510 | 4.0% |
| Elementary School | 2,457 | 19.2% |
| Middle School | 2,347 | 18.3% |
| High School | 2,926 | 22.8% |
| College / Undergraduate | 2,802 | 21.9% |
| Graduate / Professional | 561 | 4.4% |
| Total | 12,818 | 100.0% |
School Enrollment by Age by Funding Source in Rancho Santa Margarita
Out of a total of 12,818 students who are enrolled in schools in Rancho Santa Margarita, 2,999 (23.4%) attend a private institution, while the remaining 9,819 (76.6%) are enrolled in public schools. The age group of 3 to 4 year olds has the highest likelihood of being enrolled in private schools, with 689 (68.4% in the age bracket) enrolled. Conversely, the age group of 18 to 19 year olds has the lowest likelihood of being enrolled in a private school, with 1,030 (90.7% in the age bracket) attending a public institution.
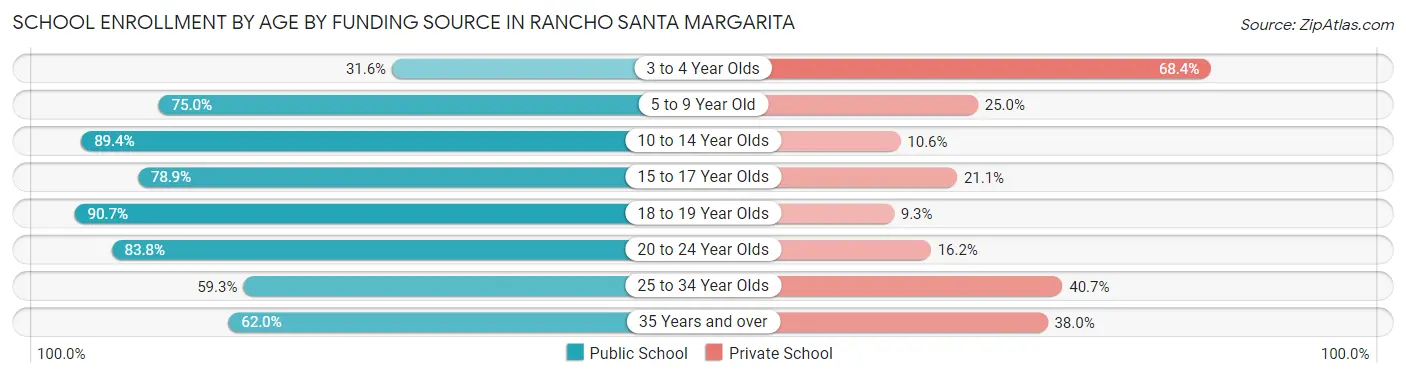
| Age Bracket | Public School | Private School |
| 3 to 4 Year Olds | 318 (31.6%) | 689 (68.4%) |
| 5 to 9 Year Old | 2,120 (75.0%) | 706 (25.0%) |
| 10 to 14 Year Olds | 2,778 (89.4%) | 328 (10.6%) |
| 15 to 17 Year Olds | 1,645 (78.9%) | 440 (21.1%) |
| 18 to 19 Year Olds | 1,030 (90.7%) | 106 (9.3%) |
| 20 to 24 Year Olds | 1,122 (83.8%) | 217 (16.2%) |
| 25 to 34 Year Olds | 329 (59.3%) | 226 (40.7%) |
| 35 Years and over | 474 (62.0%) | 290 (38.0%) |
| Total | 9,819 (76.6%) | 2,999 (23.4%) |
Educational Attainment by Field of Study in Rancho Santa Margarita
Business (3,727 | 21.3%), social sciences (1,925 | 11.0%), engineering (1,828 | 10.4%), science & technology (1,534 | 8.8%), and education (1,198 | 6.9%) are the most common fields of study among 17,490 individuals in Rancho Santa Margarita who have obtained a bachelor's degree or higher.
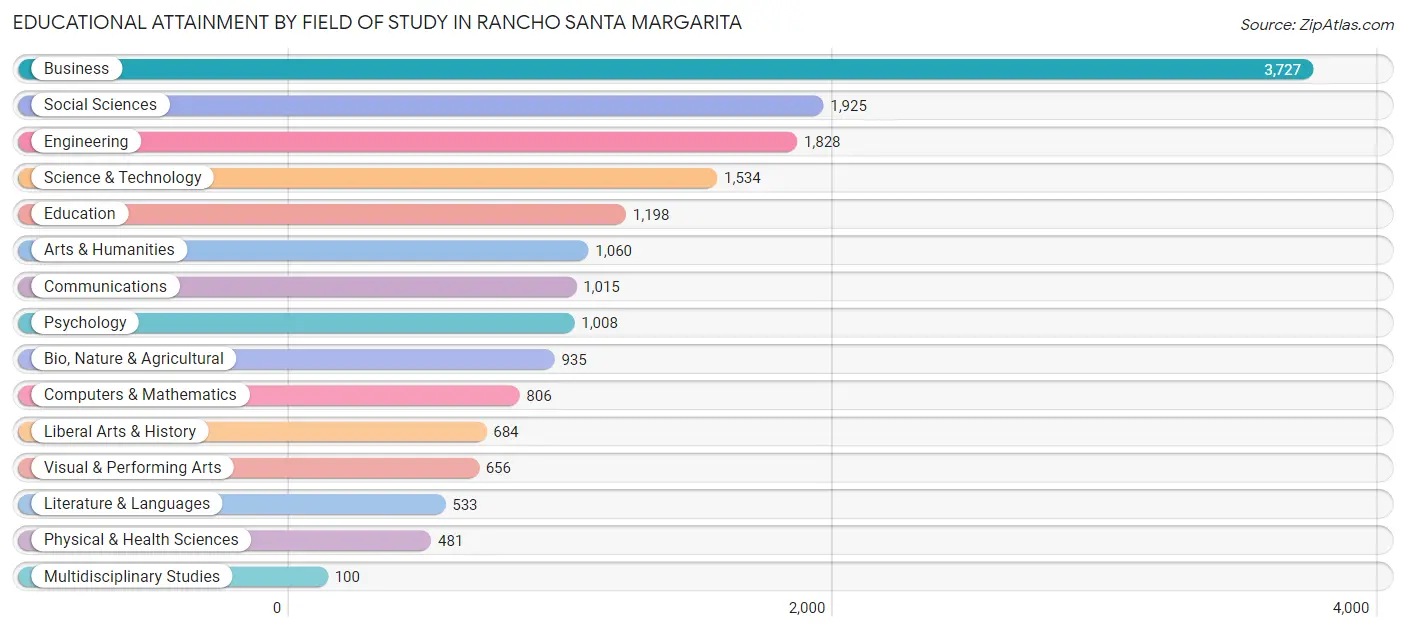
| Field of Study | # Graduates | % Graduates |
| Computers & Mathematics | 806 | 4.6% |
| Bio, Nature & Agricultural | 935 | 5.3% |
| Physical & Health Sciences | 481 | 2.8% |
| Psychology | 1,008 | 5.8% |
| Social Sciences | 1,925 | 11.0% |
| Engineering | 1,828 | 10.4% |
| Multidisciplinary Studies | 100 | 0.6% |
| Science & Technology | 1,534 | 8.8% |
| Business | 3,727 | 21.3% |
| Education | 1,198 | 6.9% |
| Literature & Languages | 533 | 3.0% |
| Liberal Arts & History | 684 | 3.9% |
| Visual & Performing Arts | 656 | 3.7% |
| Communications | 1,015 | 5.8% |
| Arts & Humanities | 1,060 | 6.1% |
| Total | 17,490 | 100.0% |
Transportation & Commute in Rancho Santa Margarita
Vehicle Availability by Sex in Rancho Santa Margarita
The most prevalent vehicle ownership categories in Rancho Santa Margarita are males with 2 vehicles (6,306, accounting for 43.4%) and females with 2 vehicles (5,259, making up 50.4%).
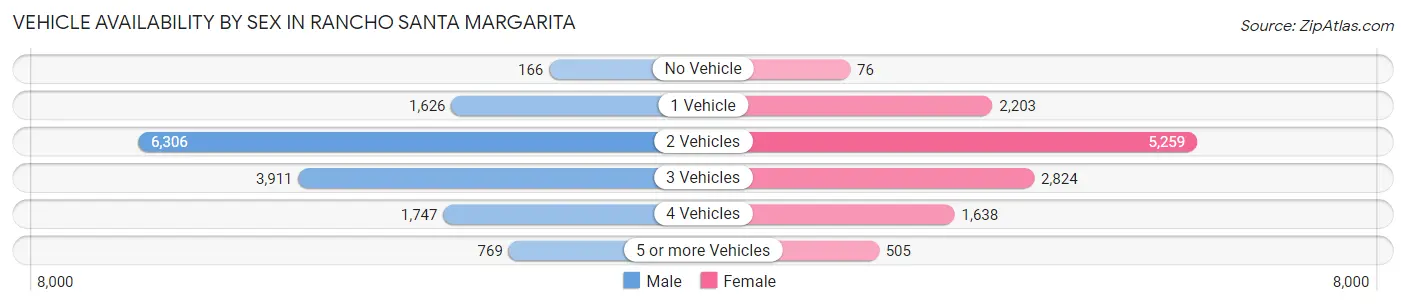
| Vehicles Available | Male | Female |
| No Vehicle | 166 (1.1%) | 76 (0.6%) |
| 1 Vehicle | 1,626 (11.2%) | 2,203 (17.6%) |
| 2 Vehicles | 6,306 (43.4%) | 5,259 (42.1%) |
| 3 Vehicles | 3,911 (26.9%) | 2,824 (22.6%) |
| 4 Vehicles | 1,747 (12.0%) | 1,638 (13.1%) |
| 5 or more Vehicles | 769 (5.3%) | 505 (4.0%) |
| Total | 14,525 (100.0%) | 12,505 (100.0%) |
Commute Time in Rancho Santa Margarita
The most frequently occuring commute durations in Rancho Santa Margarita are 30 to 34 minutes (3,898 commuters, 17.6%), 15 to 19 minutes (3,168 commuters, 14.3%), and 20 to 24 minutes (2,659 commuters, 12.0%).
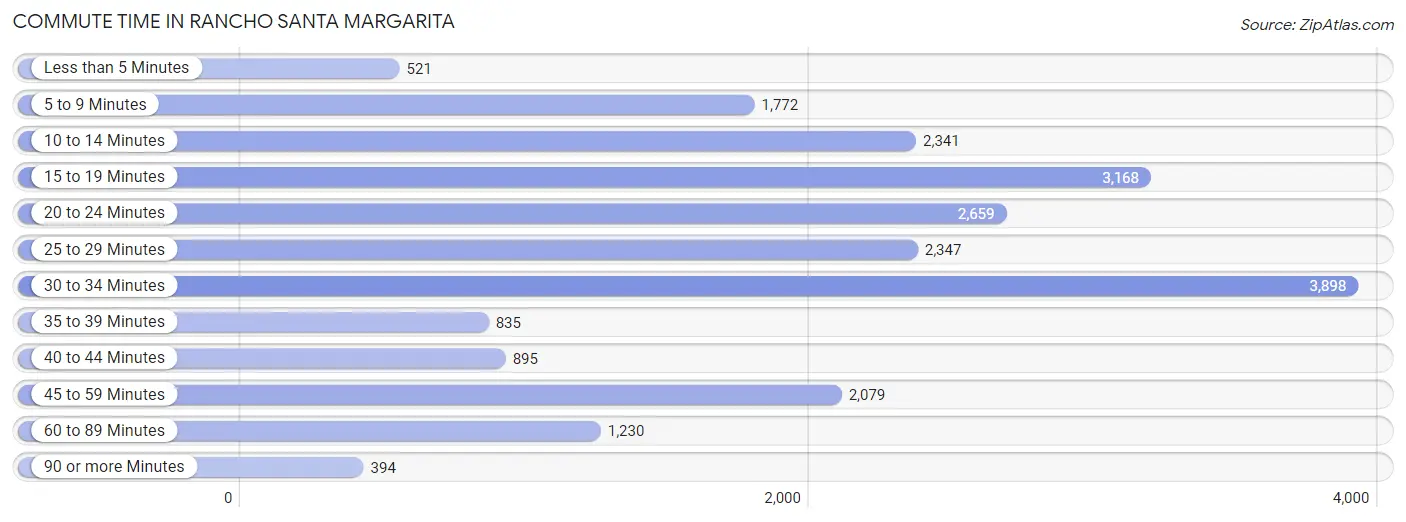
| Commute Time | # Commuters | % Commuters |
| Less than 5 Minutes | 521 | 2.4% |
| 5 to 9 Minutes | 1,772 | 8.0% |
| 10 to 14 Minutes | 2,341 | 10.6% |
| 15 to 19 Minutes | 3,168 | 14.3% |
| 20 to 24 Minutes | 2,659 | 12.0% |
| 25 to 29 Minutes | 2,347 | 10.6% |
| 30 to 34 Minutes | 3,898 | 17.6% |
| 35 to 39 Minutes | 835 | 3.8% |
| 40 to 44 Minutes | 895 | 4.0% |
| 45 to 59 Minutes | 2,079 | 9.4% |
| 60 to 89 Minutes | 1,230 | 5.6% |
| 90 or more Minutes | 394 | 1.8% |
Commute Time by Sex in Rancho Santa Margarita
The most common commute times in Rancho Santa Margarita are 30 to 34 minutes (2,508 commuters, 20.7%) for males and 15 to 19 minutes (1,789 commuters, 17.9%) for females.
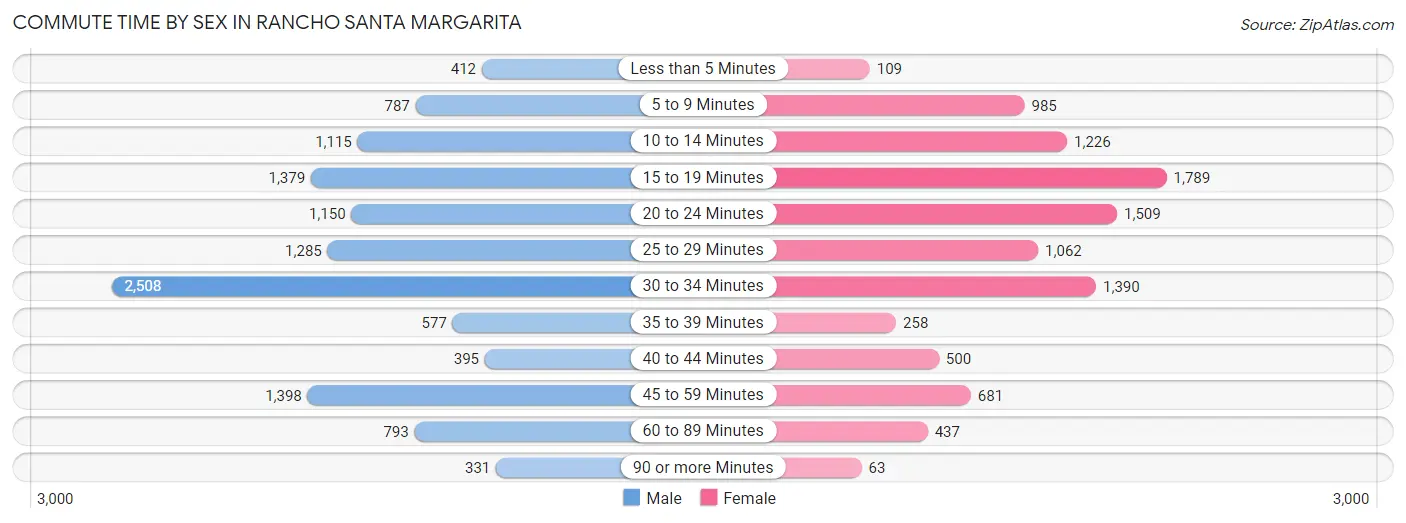
| Commute Time | Male | Female |
| Less than 5 Minutes | 412 (3.4%) | 109 (1.1%) |
| 5 to 9 Minutes | 787 (6.5%) | 985 (9.8%) |
| 10 to 14 Minutes | 1,115 (9.2%) | 1,226 (12.2%) |
| 15 to 19 Minutes | 1,379 (11.4%) | 1,789 (17.9%) |
| 20 to 24 Minutes | 1,150 (9.5%) | 1,509 (15.1%) |
| 25 to 29 Minutes | 1,285 (10.6%) | 1,062 (10.6%) |
| 30 to 34 Minutes | 2,508 (20.7%) | 1,390 (13.9%) |
| 35 to 39 Minutes | 577 (4.8%) | 258 (2.6%) |
| 40 to 44 Minutes | 395 (3.3%) | 500 (5.0%) |
| 45 to 59 Minutes | 1,398 (11.5%) | 681 (6.8%) |
| 60 to 89 Minutes | 793 (6.5%) | 437 (4.4%) |
| 90 or more Minutes | 331 (2.7%) | 63 (0.6%) |
Time of Departure to Work by Sex in Rancho Santa Margarita
The most frequent times of departure to work in Rancho Santa Margarita are 7:00 AM to 7:29 AM (1,859, 15.3%) for males and 8:00 AM to 8:29 AM (1,634, 16.3%) for females.
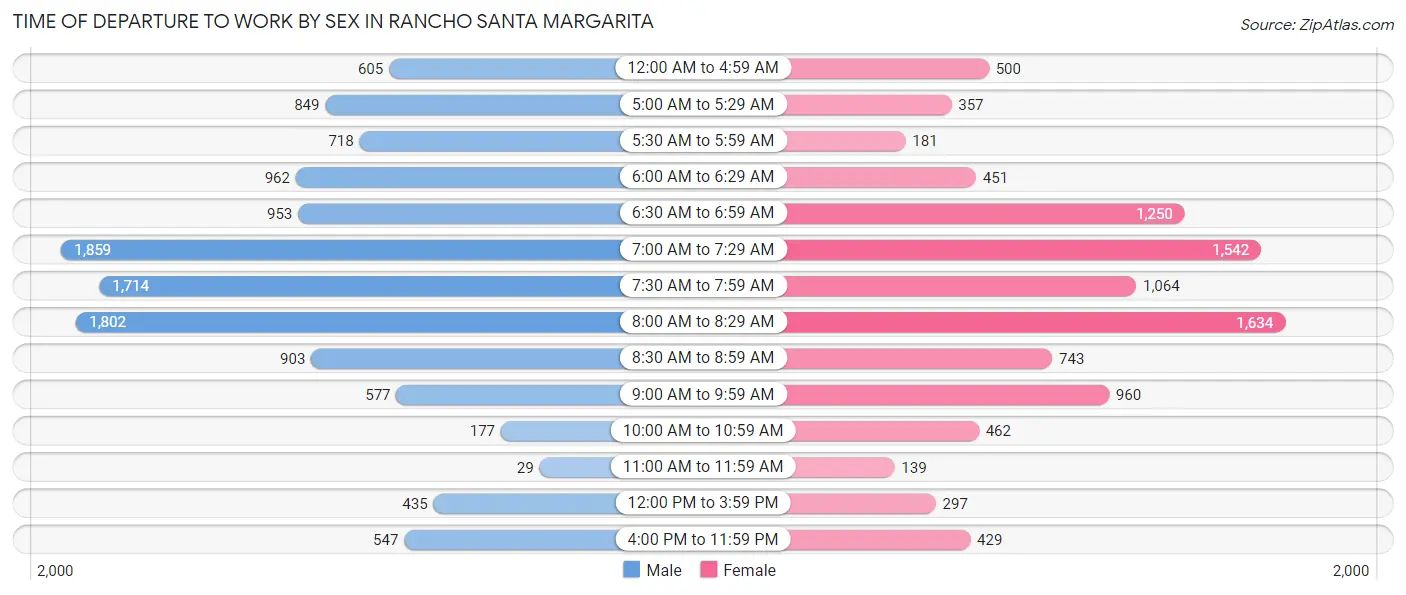
| Time of Departure | Male | Female |
| 12:00 AM to 4:59 AM | 605 (5.0%) | 500 (5.0%) |
| 5:00 AM to 5:29 AM | 849 (7.0%) | 357 (3.6%) |
| 5:30 AM to 5:59 AM | 718 (5.9%) | 181 (1.8%) |
| 6:00 AM to 6:29 AM | 962 (7.9%) | 451 (4.5%) |
| 6:30 AM to 6:59 AM | 953 (7.9%) | 1,250 (12.5%) |
| 7:00 AM to 7:29 AM | 1,859 (15.3%) | 1,542 (15.4%) |
| 7:30 AM to 7:59 AM | 1,714 (14.1%) | 1,064 (10.6%) |
| 8:00 AM to 8:29 AM | 1,802 (14.9%) | 1,634 (16.3%) |
| 8:30 AM to 8:59 AM | 903 (7.4%) | 743 (7.4%) |
| 9:00 AM to 9:59 AM | 577 (4.8%) | 960 (9.6%) |
| 10:00 AM to 10:59 AM | 177 (1.5%) | 462 (4.6%) |
| 11:00 AM to 11:59 AM | 29 (0.2%) | 139 (1.4%) |
| 12:00 PM to 3:59 PM | 435 (3.6%) | 297 (3.0%) |
| 4:00 PM to 11:59 PM | 547 (4.5%) | 429 (4.3%) |
| Total | 12,130 (100.0%) | 10,009 (100.0%) |
Housing Occupancy in Rancho Santa Margarita
Occupancy by Ownership in Rancho Santa Margarita
Of the total 16,798 dwellings in Rancho Santa Margarita, owner-occupied units account for 12,240 (72.9%), while renter-occupied units make up 4,558 (27.1%).
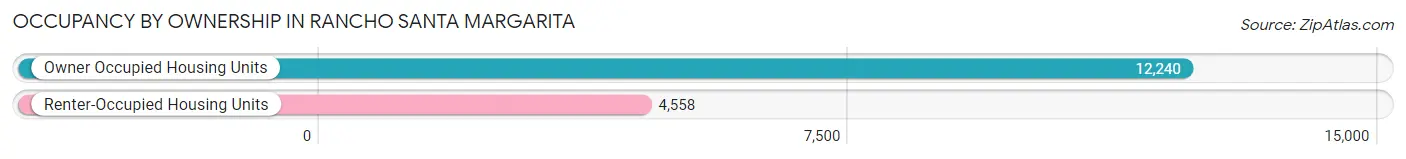
| Occupancy | # Housing Units | % Housing Units |
| Owner Occupied Housing Units | 12,240 | 72.9% |
| Renter-Occupied Housing Units | 4,558 | 27.1% |
| Total Occupied Housing Units | 16,798 | 100.0% |
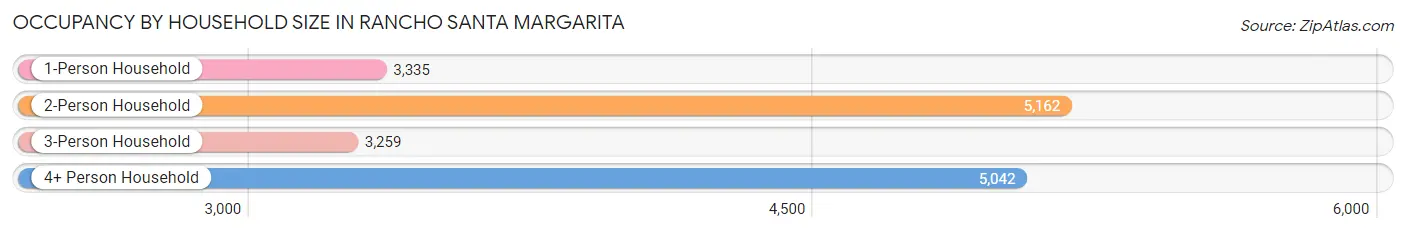
Occupancy by Household Size in Rancho Santa Margarita
| Household Size | # Housing Units | % Housing Units |
| 1-Person Household | 3,335 | 19.9% |
| 2-Person Household | 5,162 | 30.7% |
| 3-Person Household | 3,259 | 19.4% |
| 4+ Person Household | 5,042 | 30.0% |
| Total Housing Units | 16,798 | 100.0% |
Occupancy by Ownership by Household Size in Rancho Santa Margarita
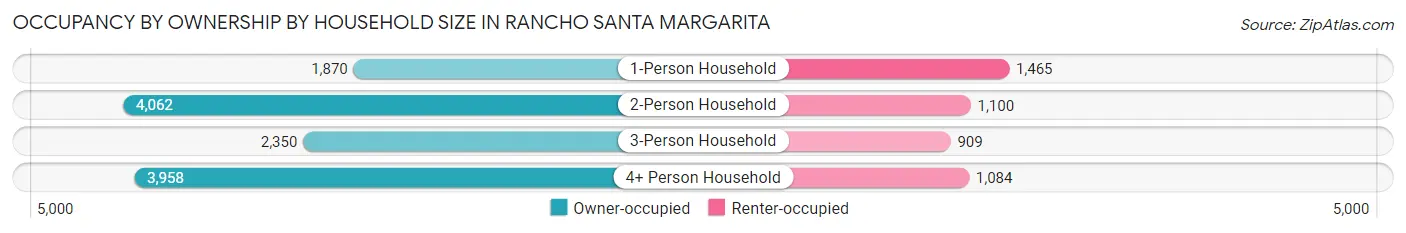
| Household Size | Owner-occupied | Renter-occupied |
| 1-Person Household | 1,870 (56.1%) | 1,465 (43.9%) |
| 2-Person Household | 4,062 (78.7%) | 1,100 (21.3%) |
| 3-Person Household | 2,350 (72.1%) | 909 (27.9%) |
| 4+ Person Household | 3,958 (78.5%) | 1,084 (21.5%) |
| Total Housing Units | 12,240 (72.9%) | 4,558 (27.1%) |
Occupancy by Educational Attainment in Rancho Santa Margarita
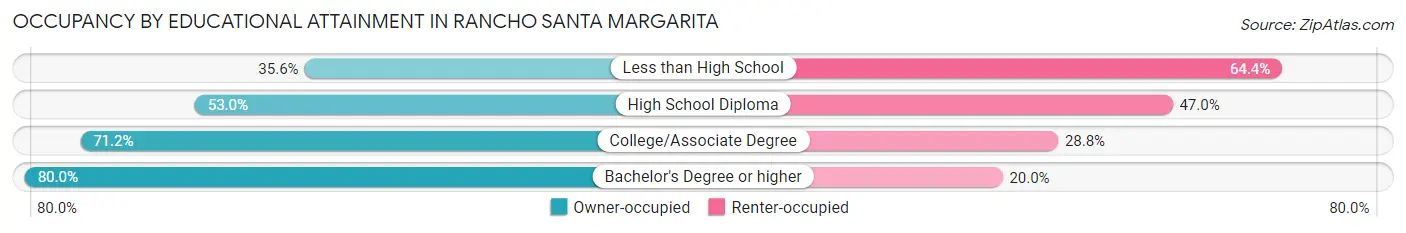
| Household Size | Owner-occupied | Renter-occupied |
| Less than High School | 182 (35.6%) | 329 (64.4%) |
| High School Diploma | 972 (53.0%) | 862 (47.0%) |
| College/Associate Degree | 3,817 (71.2%) | 1,546 (28.8%) |
| Bachelor's Degree or higher | 7,269 (80.0%) | 1,821 (20.0%) |
Occupancy by Age of Householder in Rancho Santa Margarita
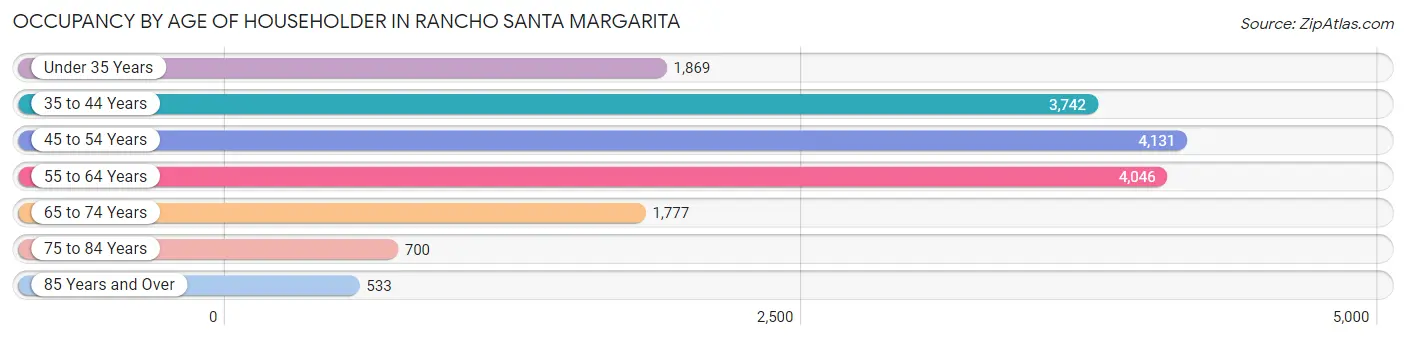
| Age Bracket | # Households | % Households |
| Under 35 Years | 1,869 | 11.1% |
| 35 to 44 Years | 3,742 | 22.3% |
| 45 to 54 Years | 4,131 | 24.6% |
| 55 to 64 Years | 4,046 | 24.1% |
| 65 to 74 Years | 1,777 | 10.6% |
| 75 to 84 Years | 700 | 4.2% |
| 85 Years and Over | 533 | 3.2% |
| Total | 16,798 | 100.0% |
Housing Finances in Rancho Santa Margarita
Median Income by Occupancy in Rancho Santa Margarita
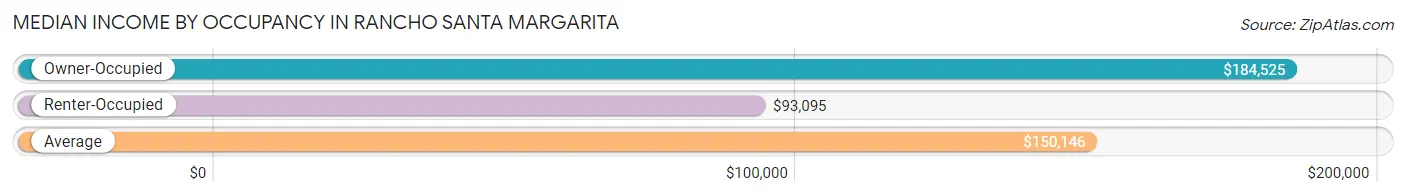
| Occupancy Type | # Households | Median Income |
| Owner-Occupied | 12,240 (72.9%) | $184,525 |
| Renter-Occupied | 4,558 (27.1%) | $93,095 |
| Average | 16,798 (100.0%) | $150,146 |
Occupancy by Householder Income Bracket in Rancho Santa Margarita
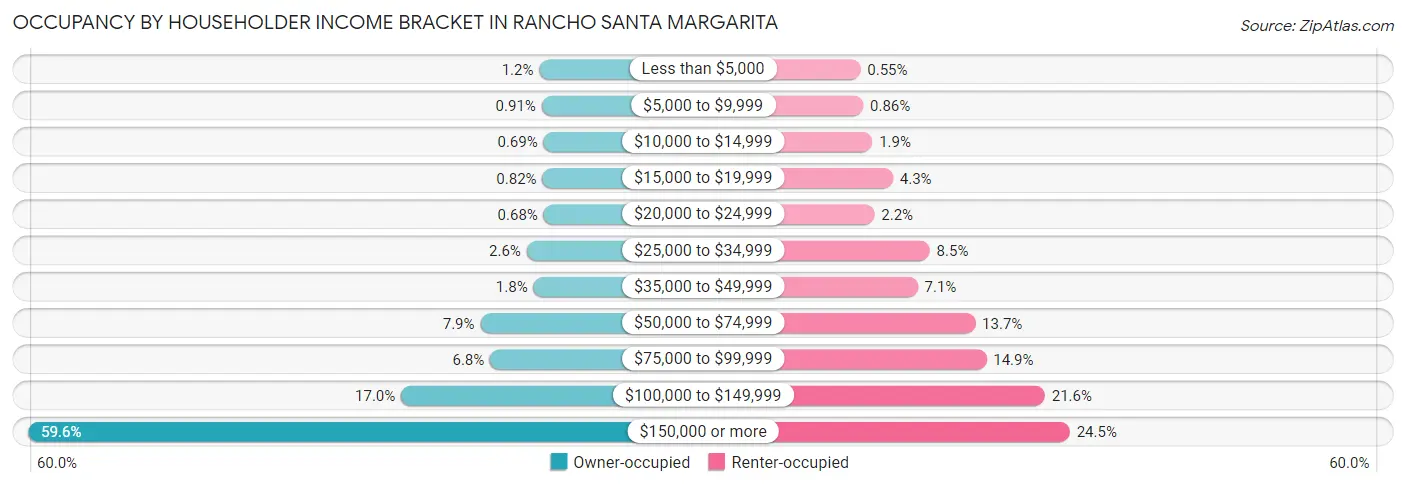
| Income Bracket | Owner-occupied | Renter-occupied |
| Less than $5,000 | 144 (1.2%) | 25 (0.5%) |
| $5,000 to $9,999 | 111 (0.9%) | 39 (0.9%) |
| $10,000 to $14,999 | 84 (0.7%) | 87 (1.9%) |
| $15,000 to $19,999 | 100 (0.8%) | 194 (4.3%) |
| $20,000 to $24,999 | 83 (0.7%) | 98 (2.1%) |
| $25,000 to $34,999 | 321 (2.6%) | 386 (8.5%) |
| $35,000 to $49,999 | 225 (1.8%) | 323 (7.1%) |
| $50,000 to $74,999 | 968 (7.9%) | 623 (13.7%) |
| $75,000 to $99,999 | 832 (6.8%) | 681 (14.9%) |
| $100,000 to $149,999 | 2,077 (17.0%) | 986 (21.6%) |
| $150,000 or more | 7,295 (59.6%) | 1,116 (24.5%) |
| Total | 12,240 (100.0%) | 4,558 (100.0%) |
Monthly Housing Cost Tiers in Rancho Santa Margarita
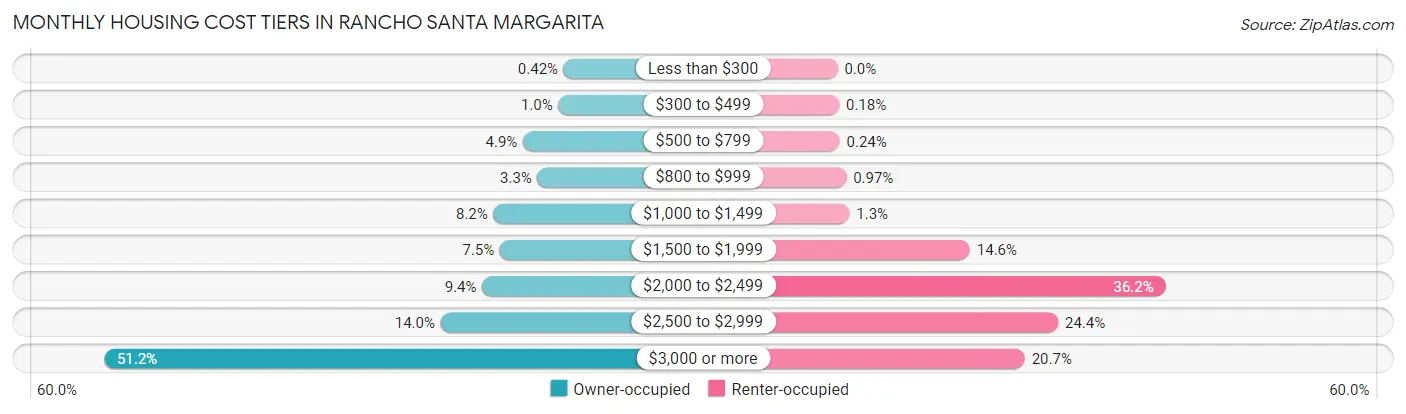
| Monthly Cost | Owner-occupied | Renter-occupied |
| Less than $300 | 51 (0.4%) | 0 (0.0%) |
| $300 to $499 | 124 (1.0%) | 8 (0.2%) |
| $500 to $799 | 602 (4.9%) | 11 (0.2%) |
| $800 to $999 | 406 (3.3%) | 44 (1.0%) |
| $1,000 to $1,499 | 1,003 (8.2%) | 60 (1.3%) |
| $1,500 to $1,999 | 914 (7.5%) | 667 (14.6%) |
| $2,000 to $2,499 | 1,154 (9.4%) | 1,652 (36.2%) |
| $2,500 to $2,999 | 1,716 (14.0%) | 1,111 (24.4%) |
| $3,000 or more | 6,270 (51.2%) | 943 (20.7%) |
| Total | 12,240 (100.0%) | 4,558 (100.0%) |
Physical Housing Characteristics in Rancho Santa Margarita
Housing Structures in Rancho Santa Margarita
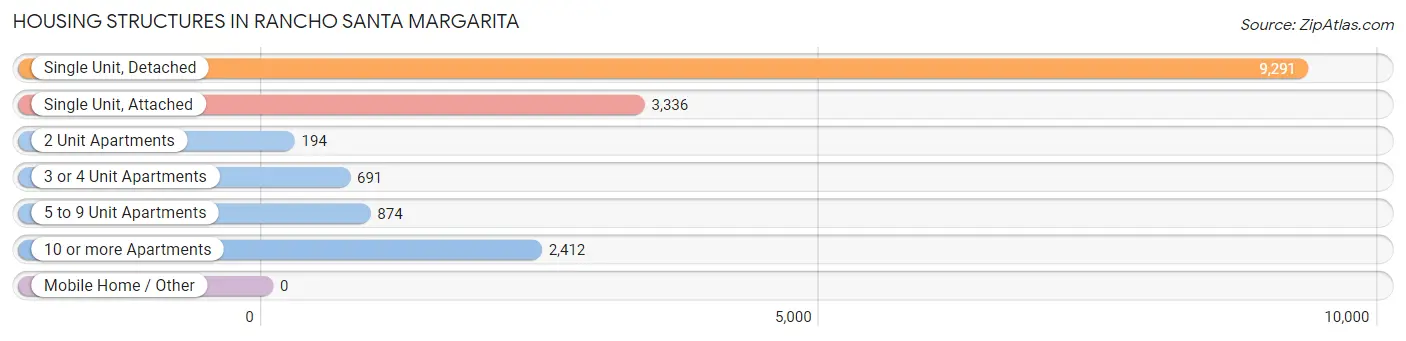
| Structure Type | # Housing Units | % Housing Units |
| Single Unit, Detached | 9,291 | 55.3% |
| Single Unit, Attached | 3,336 | 19.9% |
| 2 Unit Apartments | 194 | 1.1% |
| 3 or 4 Unit Apartments | 691 | 4.1% |
| 5 to 9 Unit Apartments | 874 | 5.2% |
| 10 or more Apartments | 2,412 | 14.4% |
| Mobile Home / Other | 0 | 0.0% |
| Total | 16,798 | 100.0% |
Housing Structures by Occupancy in Rancho Santa Margarita
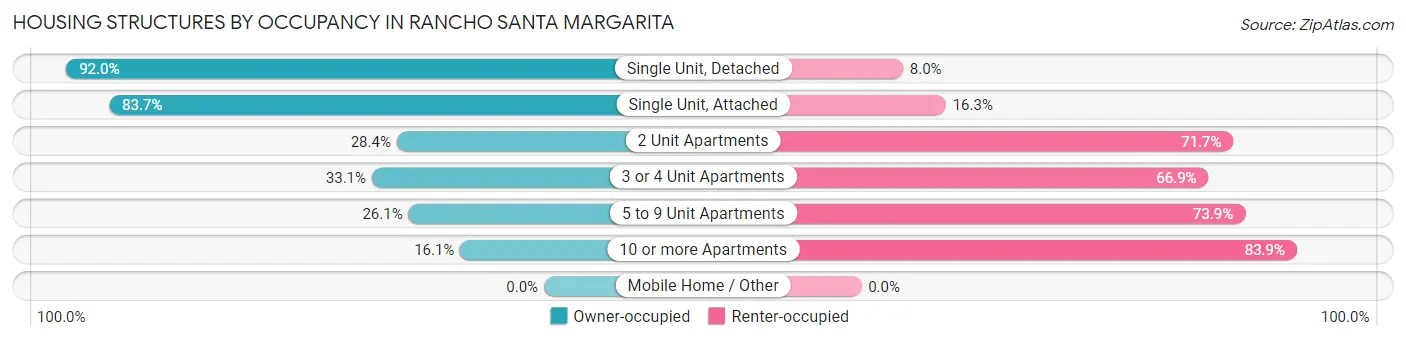
| Structure Type | Owner-occupied | Renter-occupied |
| Single Unit, Detached | 8,546 (92.0%) | 745 (8.0%) |
| Single Unit, Attached | 2,793 (83.7%) | 543 (16.3%) |
| 2 Unit Apartments | 55 (28.3%) | 139 (71.7%) |
| 3 or 4 Unit Apartments | 229 (33.1%) | 462 (66.9%) |
| 5 to 9 Unit Apartments | 228 (26.1%) | 646 (73.9%) |
| 10 or more Apartments | 389 (16.1%) | 2,023 (83.9%) |
| Mobile Home / Other | 0 (0.0%) | 0 (0.0%) |
| Total | 12,240 (72.9%) | 4,558 (27.1%) |
Housing Structures by Number of Rooms in Rancho Santa Margarita
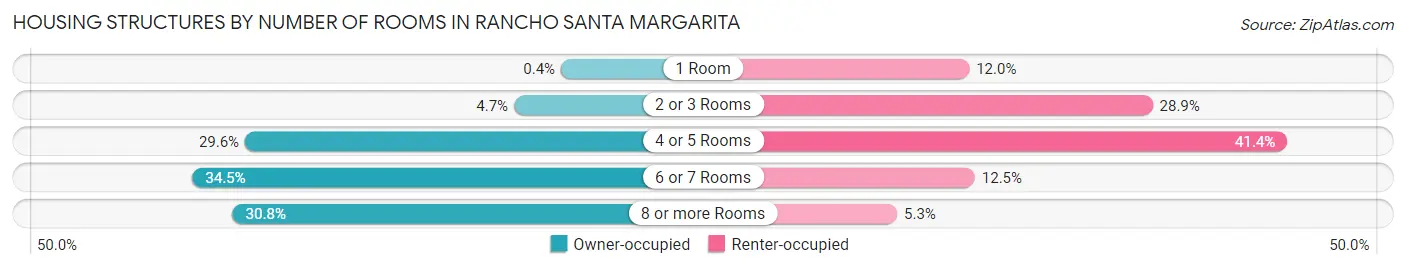
| Number of Rooms | Owner-occupied | Renter-occupied |
| 1 Room | 49 (0.4%) | 545 (12.0%) |
| 2 or 3 Rooms | 580 (4.7%) | 1,318 (28.9%) |
| 4 or 5 Rooms | 3,626 (29.6%) | 1,885 (41.4%) |
| 6 or 7 Rooms | 4,220 (34.5%) | 569 (12.5%) |
| 8 or more Rooms | 3,765 (30.8%) | 241 (5.3%) |
| Total | 12,240 (100.0%) | 4,558 (100.0%) |
Housing Structure by Heating Type in Rancho Santa Margarita
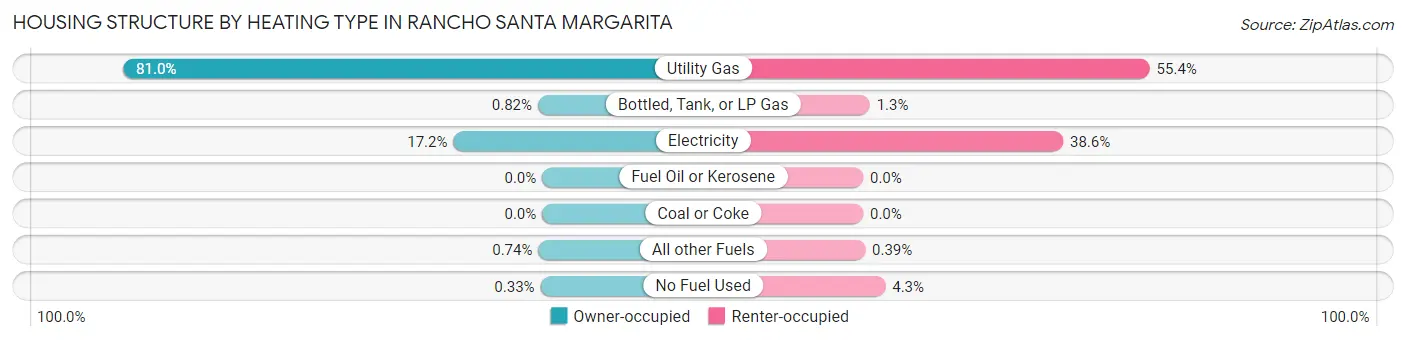
| Heating Type | Owner-occupied | Renter-occupied |
| Utility Gas | 9,908 (80.9%) | 2,524 (55.4%) |
| Bottled, Tank, or LP Gas | 100 (0.8%) | 59 (1.3%) |
| Electricity | 2,100 (17.2%) | 1,761 (38.6%) |
| Fuel Oil or Kerosene | 0 (0.0%) | 0 (0.0%) |
| Coal or Coke | 0 (0.0%) | 0 (0.0%) |
| All other Fuels | 91 (0.7%) | 18 (0.4%) |
| No Fuel Used | 41 (0.3%) | 196 (4.3%) |
| Total | 12,240 (100.0%) | 4,558 (100.0%) |
Household Vehicle Usage in Rancho Santa Margarita
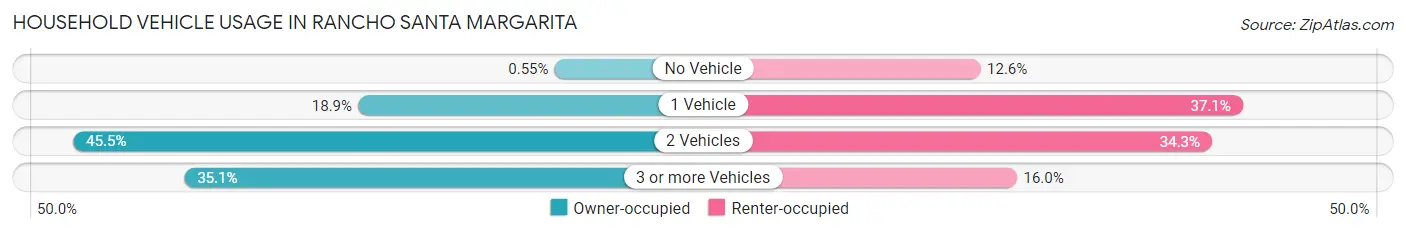
| Vehicles per Household | Owner-occupied | Renter-occupied |
| No Vehicle | 67 (0.5%) | 575 (12.6%) |
| 1 Vehicle | 2,312 (18.9%) | 1,692 (37.1%) |
| 2 Vehicles | 5,565 (45.5%) | 1,561 (34.3%) |
| 3 or more Vehicles | 4,296 (35.1%) | 730 (16.0%) |
| Total | 12,240 (100.0%) | 4,558 (100.0%) |
Real Estate & Mortgages in Rancho Santa Margarita
Real Estate and Mortgage Overview in Rancho Santa Margarita
| Characteristic | Without Mortgage | With Mortgage |
| Housing Units | 1,953 | 10,287 |
| Median Property Value | $838,200 | $865,800 |
| Median Household Income | $133,958 | $6,470 |
| Monthly Housing Costs | $913 | $6,251 |
| Real Estate Taxes | $5,379 | $96 |
Property Value by Mortgage Status in Rancho Santa Margarita
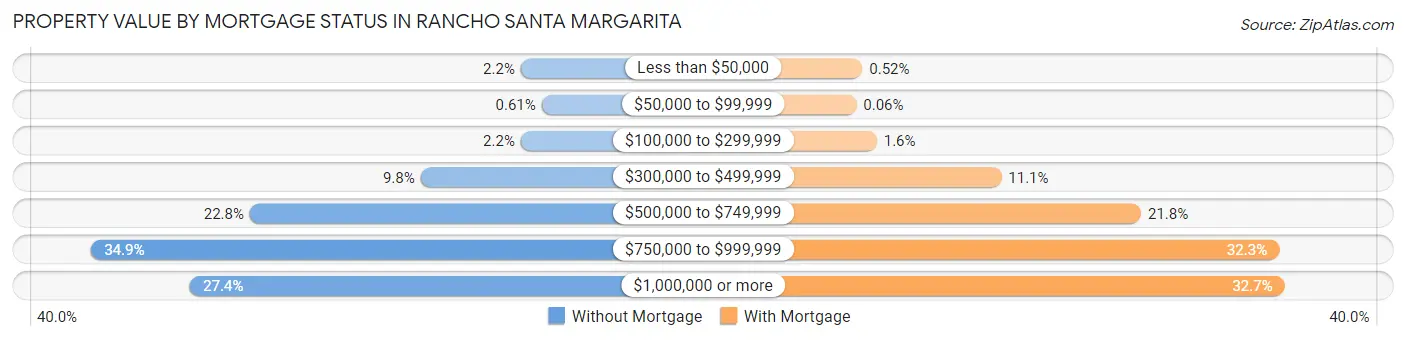
| Property Value | Without Mortgage | With Mortgage |
| Less than $50,000 | 43 (2.2%) | 53 (0.5%) |
| $50,000 to $99,999 | 12 (0.6%) | 6 (0.1%) |
| $100,000 to $299,999 | 43 (2.2%) | 167 (1.6%) |
| $300,000 to $499,999 | 192 (9.8%) | 1,143 (11.1%) |
| $500,000 to $749,999 | 446 (22.8%) | 2,237 (21.7%) |
| $750,000 to $999,999 | 682 (34.9%) | 3,319 (32.3%) |
| $1,000,000 or more | 535 (27.4%) | 3,362 (32.7%) |
| Total | 1,953 (100.0%) | 10,287 (100.0%) |
Household Income by Mortgage Status in Rancho Santa Margarita
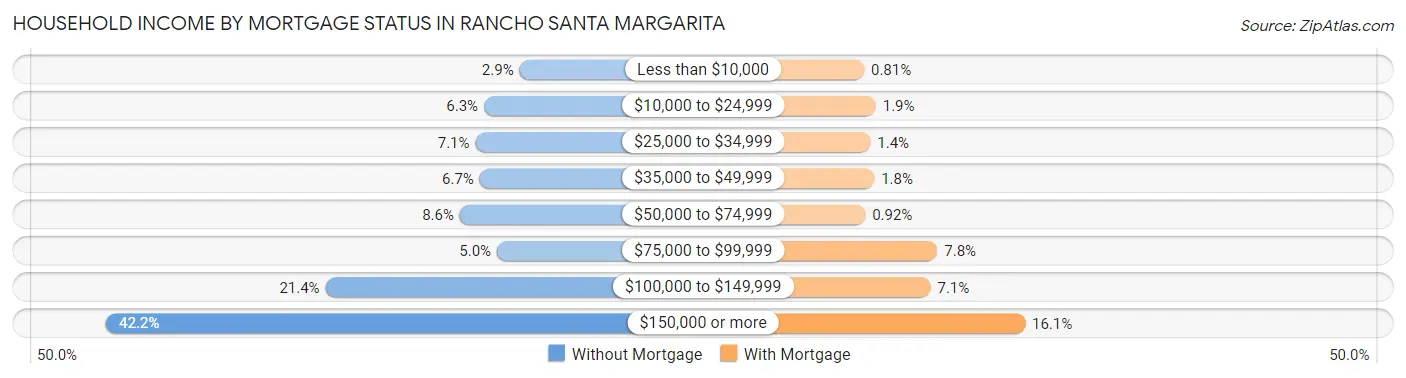
| Household Income | Without Mortgage | With Mortgage |
| Less than $10,000 | 56 (2.9%) | 83 (0.8%) |
| $10,000 to $24,999 | 122 (6.2%) | 199 (1.9%) |
| $25,000 to $34,999 | 138 (7.1%) | 145 (1.4%) |
| $35,000 to $49,999 | 130 (6.7%) | 183 (1.8%) |
| $50,000 to $74,999 | 167 (8.6%) | 95 (0.9%) |
| $75,000 to $99,999 | 98 (5.0%) | 801 (7.8%) |
| $100,000 to $149,999 | 417 (21.3%) | 734 (7.1%) |
| $150,000 or more | 825 (42.2%) | 1,660 (16.1%) |
| Total | 1,953 (100.0%) | 10,287 (100.0%) |
Property Value to Household Income Ratio in Rancho Santa Margarita
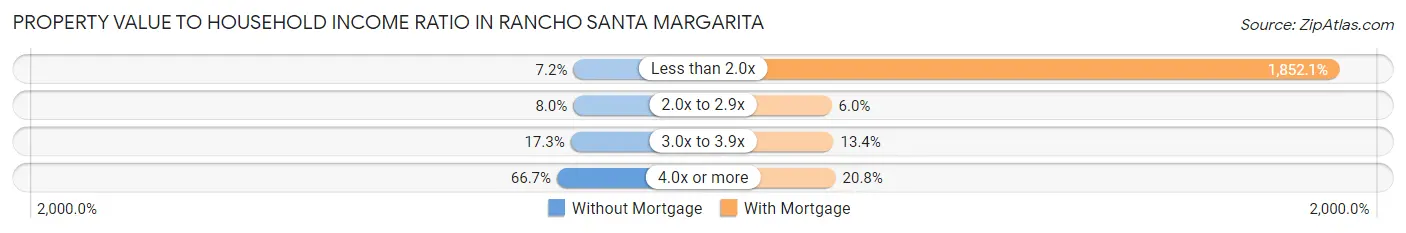
| Value-to-Income Ratio | Without Mortgage | With Mortgage |
| Less than 2.0x | 140 (7.2%) | 190,530 (1,852.1%) |
| 2.0x to 2.9x | 156 (8.0%) | 621 (6.0%) |
| 3.0x to 3.9x | 337 (17.3%) | 1,376 (13.4%) |
| 4.0x or more | 1,303 (66.7%) | 2,136 (20.8%) |
| Total | 1,953 (100.0%) | 10,287 (100.0%) |
Real Estate Taxes by Mortgage Status in Rancho Santa Margarita
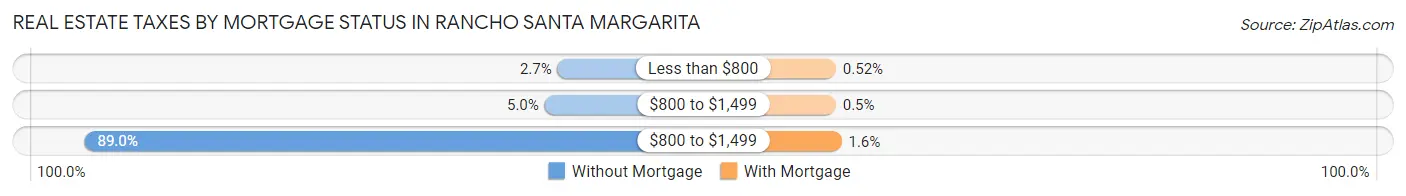
| Property Taxes | Without Mortgage | With Mortgage |
| Less than $800 | 52 (2.7%) | 53 (0.5%) |
| $800 to $1,499 | 98 (5.0%) | 51 (0.5%) |
| $800 to $1,499 | 1,739 (89.0%) | 159 (1.5%) |
| Total | 1,953 (100.0%) | 10,287 (100.0%) |
Health & Disability in Rancho Santa Margarita
Health Insurance Coverage by Age in Rancho Santa Margarita
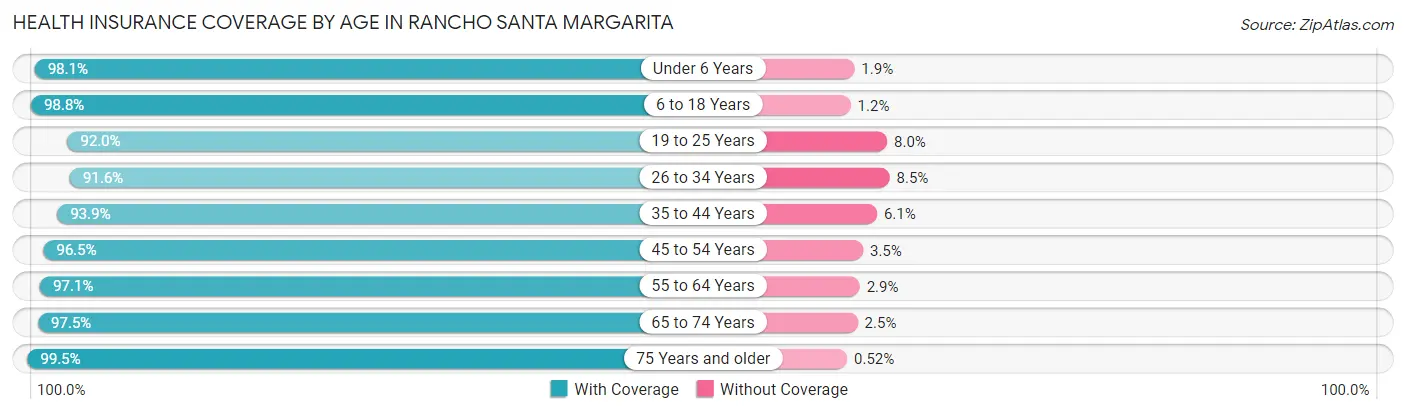
| Age Bracket | With Coverage | Without Coverage |
| Under 6 Years | 3,114 (98.1%) | 60 (1.9%) |
| 6 to 18 Years | 8,528 (98.8%) | 103 (1.2%) |
| 19 to 25 Years | 3,080 (92.0%) | 267 (8.0%) |
| 26 to 34 Years | 4,366 (91.5%) | 403 (8.5%) |
| 35 to 44 Years | 6,959 (93.9%) | 451 (6.1%) |
| 45 to 54 Years | 7,498 (96.5%) | 272 (3.5%) |
| 55 to 64 Years | 7,394 (97.1%) | 219 (2.9%) |
| 65 to 74 Years | 2,979 (97.5%) | 76 (2.5%) |
| 75 Years and older | 1,912 (99.5%) | 10 (0.5%) |
| Total | 45,830 (96.1%) | 1,861 (3.9%) |
Health Insurance Coverage by Citizenship Status in Rancho Santa Margarita
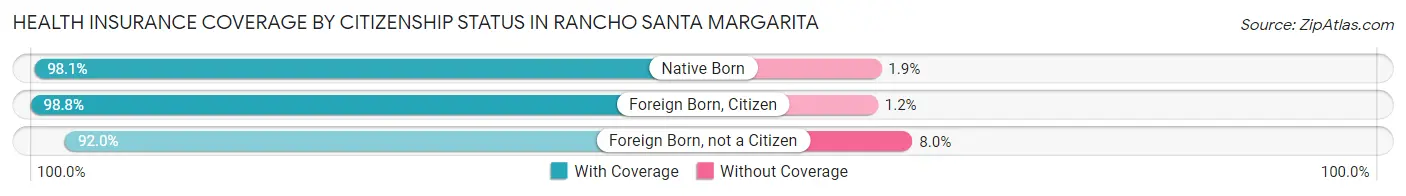
| Citizenship Status | With Coverage | Without Coverage |
| Native Born | 3,114 (98.1%) | 60 (1.9%) |
| Foreign Born, Citizen | 8,528 (98.8%) | 103 (1.2%) |
| Foreign Born, not a Citizen | 3,080 (92.0%) | 267 (8.0%) |
Health Insurance Coverage by Household Income in Rancho Santa Margarita
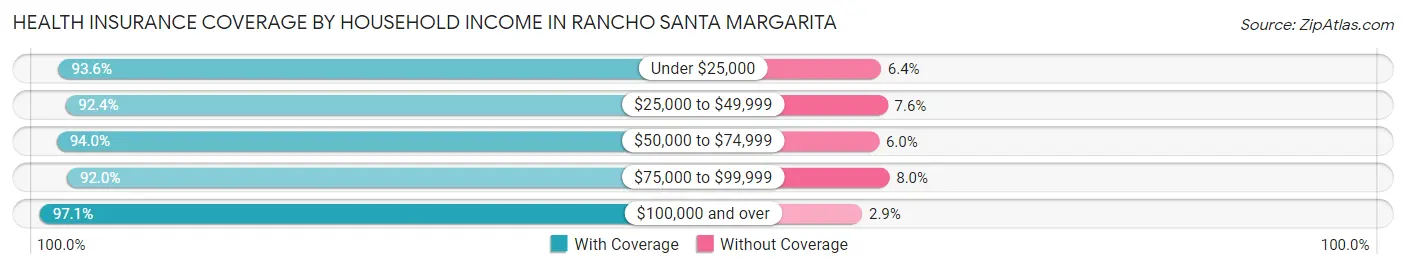
| Household Income | With Coverage | Without Coverage |
| Under $25,000 | 1,819 (93.6%) | 124 (6.4%) |
| $25,000 to $49,999 | 2,199 (92.4%) | 182 (7.6%) |
| $50,000 to $74,999 | 3,319 (94.0%) | 213 (6.0%) |
| $75,000 to $99,999 | 3,643 (92.0%) | 315 (8.0%) |
| $100,000 and over | 34,847 (97.1%) | 1,027 (2.9%) |
Public vs Private Health Insurance Coverage by Age in Rancho Santa Margarita
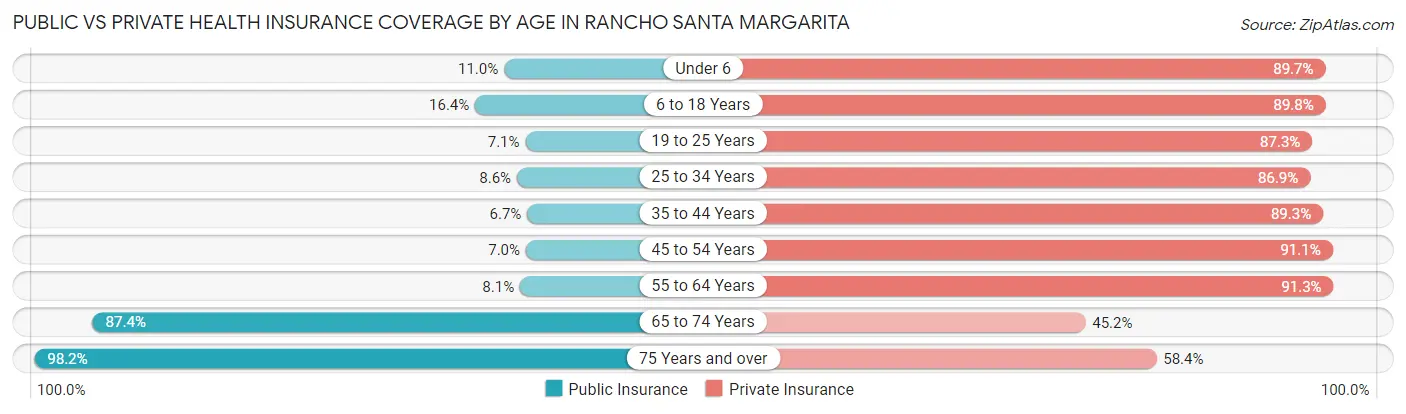
| Age Bracket | Public Insurance | Private Insurance |
| Under 6 | 349 (11.0%) | 2,848 (89.7%) |
| 6 to 18 Years | 1,414 (16.4%) | 7,749 (89.8%) |
| 19 to 25 Years | 236 (7.0%) | 2,922 (87.3%) |
| 25 to 34 Years | 411 (8.6%) | 4,145 (86.9%) |
| 35 to 44 Years | 498 (6.7%) | 6,618 (89.3%) |
| 45 to 54 Years | 541 (7.0%) | 7,076 (91.1%) |
| 55 to 64 Years | 613 (8.1%) | 6,947 (91.2%) |
| 65 to 74 Years | 2,669 (87.4%) | 1,381 (45.2%) |
| 75 Years and over | 1,887 (98.2%) | 1,122 (58.4%) |
| Total | 8,618 (18.1%) | 40,808 (85.6%) |
Disability Status by Sex by Age in Rancho Santa Margarita
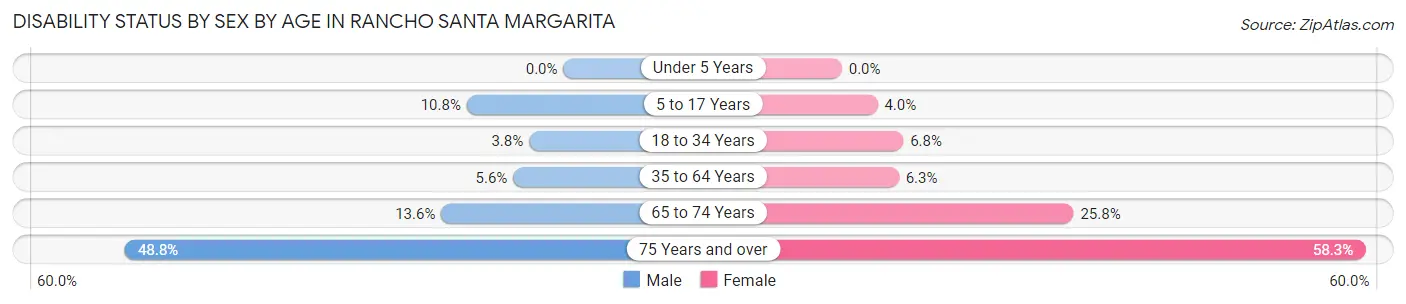
| Age Bracket | Male | Female |
| Under 5 Years | 0 (0.0%) | 0 (0.0%) |
| 5 to 17 Years | 460 (10.8%) | 157 (4.0%) |
| 18 to 34 Years | 179 (3.8%) | 294 (6.8%) |
| 35 to 64 Years | 625 (5.6%) | 736 (6.3%) |
| 65 to 74 Years | 202 (13.6%) | 405 (25.8%) |
| 75 Years and over | 413 (48.8%) | 627 (58.3%) |
Disability Class by Sex by Age in Rancho Santa Margarita
Disability Class: Hearing Difficulty
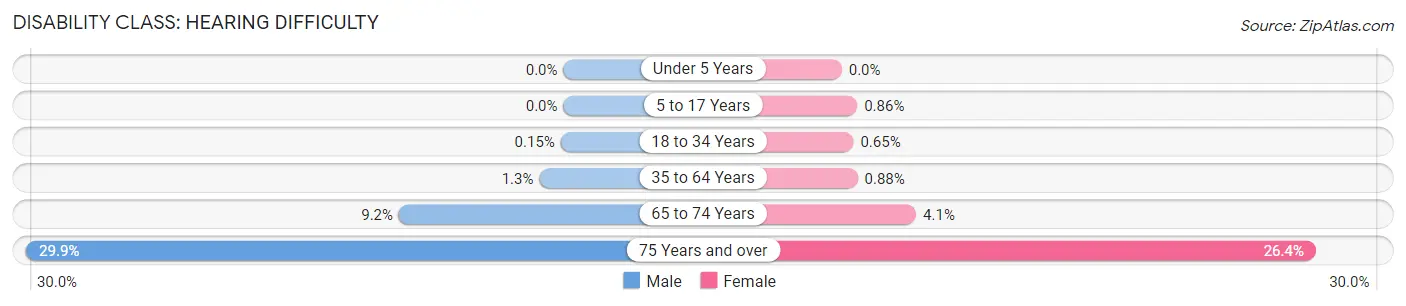
| Age Bracket | Male | Female |
| Under 5 Years | 0 (0.0%) | 0 (0.0%) |
| 5 to 17 Years | 0 (0.0%) | 34 (0.9%) |
| 18 to 34 Years | 7 (0.2%) | 28 (0.6%) |
| 35 to 64 Years | 150 (1.3%) | 102 (0.9%) |
| 65 to 74 Years | 136 (9.2%) | 65 (4.1%) |
| 75 Years and over | 253 (29.9%) | 284 (26.4%) |
Disability Class: Vision Difficulty
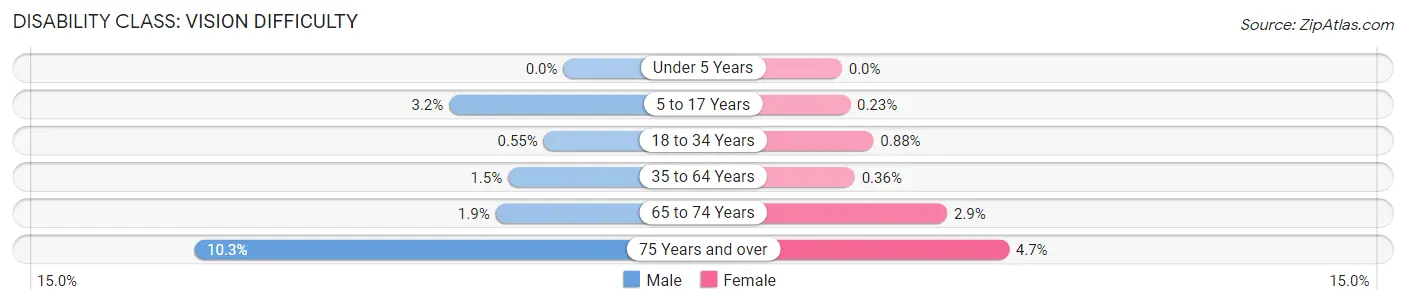
| Age Bracket | Male | Female |
| Under 5 Years | 0 (0.0%) | 0 (0.0%) |
| 5 to 17 Years | 136 (3.2%) | 9 (0.2%) |
| 18 to 34 Years | 26 (0.5%) | 38 (0.9%) |
| 35 to 64 Years | 172 (1.5%) | 42 (0.4%) |
| 65 to 74 Years | 28 (1.9%) | 46 (2.9%) |
| 75 Years and over | 87 (10.3%) | 50 (4.6%) |
Disability Class: Cognitive Difficulty
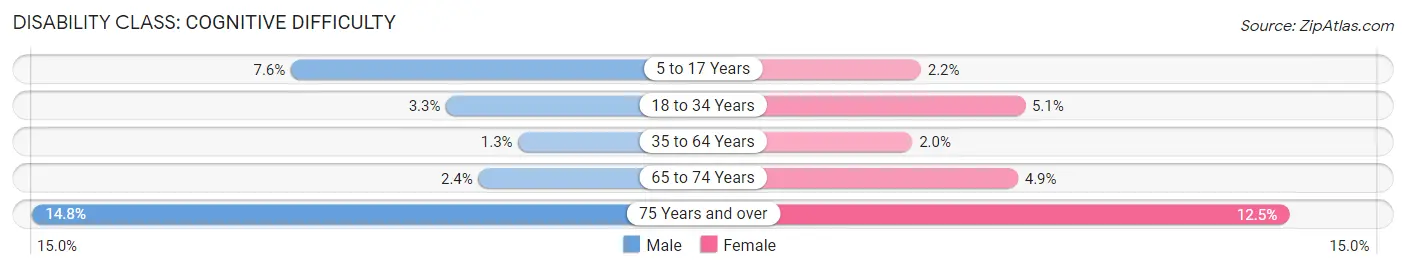
| Age Bracket | Male | Female |
| 5 to 17 Years | 324 (7.6%) | 87 (2.2%) |
| 18 to 34 Years | 153 (3.3%) | 219 (5.1%) |
| 35 to 64 Years | 140 (1.3%) | 228 (2.0%) |
| 65 to 74 Years | 35 (2.4%) | 77 (4.9%) |
| 75 Years and over | 125 (14.8%) | 134 (12.4%) |
Disability Class: Ambulatory Difficulty
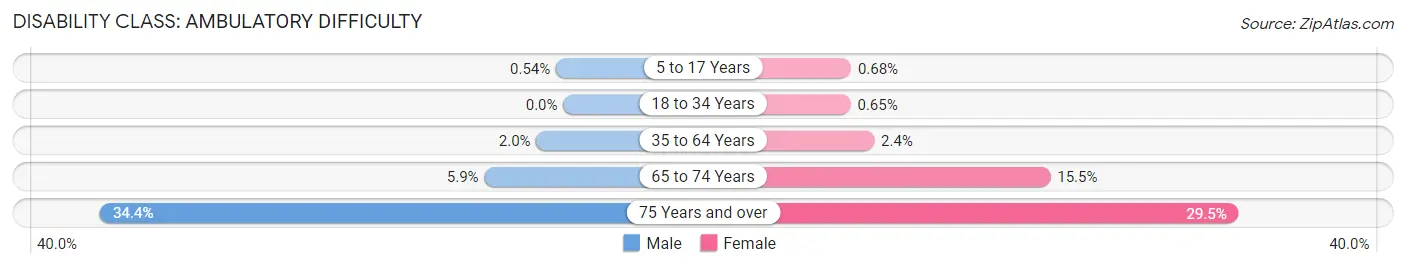
| Age Bracket | Male | Female |
| 5 to 17 Years | 23 (0.5%) | 27 (0.7%) |
| 18 to 34 Years | 0 (0.0%) | 28 (0.6%) |
| 35 to 64 Years | 224 (2.0%) | 279 (2.4%) |
| 65 to 74 Years | 87 (5.9%) | 243 (15.5%) |
| 75 Years and over | 291 (34.4%) | 317 (29.5%) |
Disability Class: Self-Care Difficulty
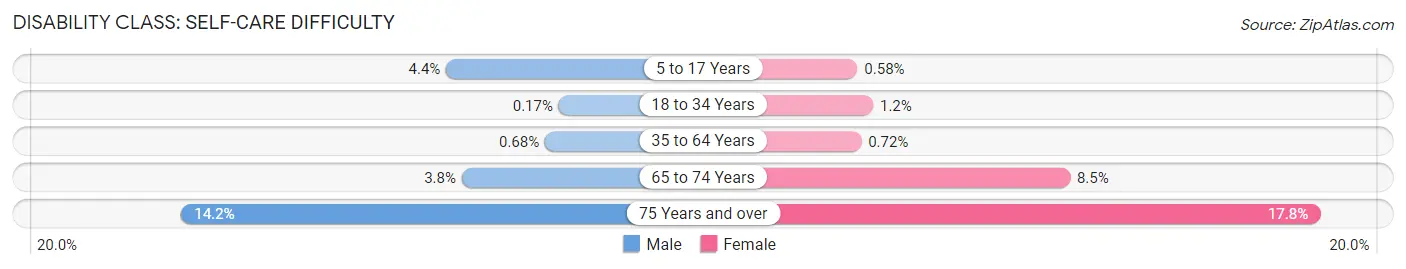
| Age Bracket | Male | Female |
| 5 to 17 Years | 186 (4.3%) | 23 (0.6%) |
| 18 to 34 Years | 8 (0.2%) | 50 (1.2%) |
| 35 to 64 Years | 76 (0.7%) | 83 (0.7%) |
| 65 to 74 Years | 56 (3.8%) | 133 (8.5%) |
| 75 Years and over | 120 (14.2%) | 191 (17.7%) |
Technology Access in Rancho Santa Margarita
Computing Device Access in Rancho Santa Margarita
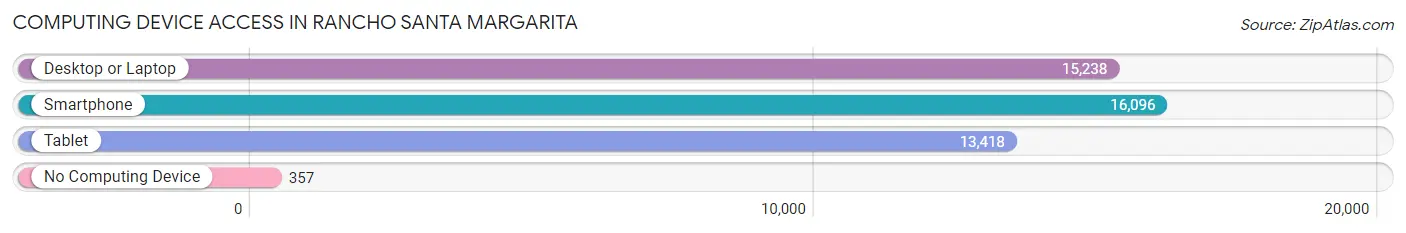
| Device Type | # Households | % Households |
| Desktop or Laptop | 15,238 | 90.7% |
| Smartphone | 16,096 | 95.8% |
| Tablet | 13,418 | 79.9% |
| No Computing Device | 357 | 2.1% |
| Total | 16,798 | 100.0% |
Internet Access in Rancho Santa Margarita
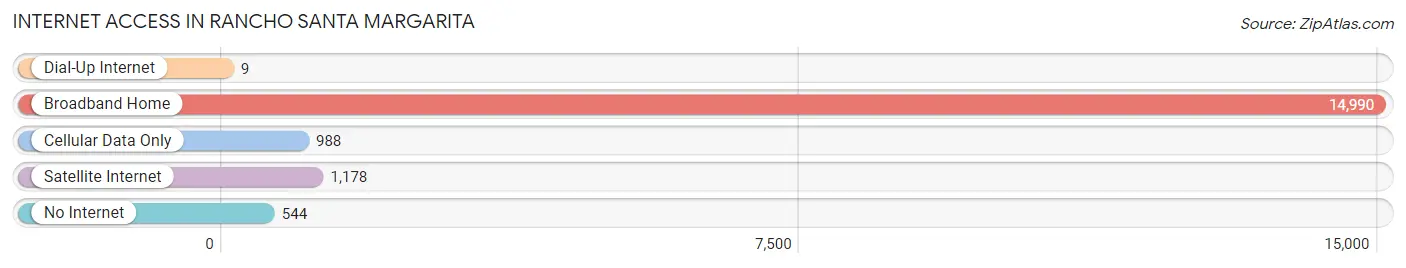
| Internet Type | # Households | % Households |
| Dial-Up Internet | 9 | 0.1% |
| Broadband Home | 14,990 | 89.2% |
| Cellular Data Only | 988 | 5.9% |
| Satellite Internet | 1,178 | 7.0% |
| No Internet | 544 | 3.2% |
| Total | 16,798 | 100.0% |
Rancho Santa Margarita Summary
Rancho Santa Margarita is a city located in Orange County, California. It is situated in the foothills of the Santa Ana Mountains, and is bordered by the cities of Mission Viejo, Coto de Caza, Las Flores, and Ladera Ranch. The city was incorporated in 2000, and has a population of around 48,000 people.
History
The area that is now Rancho Santa Margarita was originally inhabited by the Acjachemen Native American tribe. The first Europeans to settle in the area were Spanish missionaries, who established the Mission San Juan Capistrano in 1776. The area was later used for cattle ranching, and in 1841, the Rancho Santa Margarita y Las Flores Mexican land grant was granted to Juan Avila. The land was used for cattle ranching and farming until the 1960s, when it was developed into a residential community.
Geography
Rancho Santa Margarita is located in the foothills of the Santa Ana Mountains, and is bordered by the cities of Mission Viejo, Coto de Caza, Las Flores, and Ladera Ranch. The city covers an area of 8.3 square miles, and has an elevation of 1,000 feet. The city is located in a semi-arid climate zone, and experiences hot, dry summers and mild, wet winters.
Economy
Rancho Santa Margarita is home to a variety of businesses, including retail stores, restaurants, and professional services. The city is also home to several corporate headquarters, including the headquarters of the El Pollo Loco restaurant chain. The city is also home to the headquarters of the Saddleback Valley Unified School District.
Demographics
As of the 2010 census, the population of Rancho Santa Margarita was 48,064. The racial makeup of the city was 75.3% White, 8.2% Asian, 6.2% Hispanic or Latino, and 4.2% African American. The median household income was $93,845, and the median age was 37.
Rancho Santa Margarita is a vibrant and diverse city, with a strong economy and a variety of businesses and services. The city is home to a variety of people, and is a great place to live, work, and play.
Common Questions
What is Per Capita Income in Rancho Santa Margarita?
Per Capita income in Rancho Santa Margarita is $62,035.
What is the Median Family Income in Rancho Santa Margarita?
Median Family Income in Rancho Santa Margarita is $179,002.
What is the Median Household income in Rancho Santa Margarita?
Median Household Income in Rancho Santa Margarita is $150,146.
What is Income or Wage Gap in Rancho Santa Margarita?
Income or Wage Gap in Rancho Santa Margarita is 28.5%.
Women in Rancho Santa Margarita earn 71.5 cents for every dollar earned by a man.
What is Family Income Deficit in Rancho Santa Margarita?
Family Income Deficit in Rancho Santa Margarita is $12,617.
Families that are below poverty line in Rancho Santa Margarita earn $12,617 less on average than the poverty threshold level.
What is Inequality or Gini Index in Rancho Santa Margarita?
Inequality or Gini Index in Rancho Santa Margarita is 0.38.
What is the Total Population of Rancho Santa Margarita?
Total Population of Rancho Santa Margarita is 47,702.
What is the Total Male Population of Rancho Santa Margarita?
Total Male Population of Rancho Santa Margarita is 23,675.
What is the Total Female Population of Rancho Santa Margarita?
Total Female Population of Rancho Santa Margarita is 24,027.
What is the Ratio of Males per 100 Females in Rancho Santa Margarita?
There are 98.53 Males per 100 Females in Rancho Santa Margarita.
What is the Ratio of Females per 100 Males in Rancho Santa Margarita?
There are 101.49 Females per 100 Males in Rancho Santa Margarita.
What is the Median Population Age in Rancho Santa Margarita?
Median Population Age in Rancho Santa Margarita is 40.1 Years.
What is the Average Family Size in Rancho Santa Margarita
Average Family Size in Rancho Santa Margarita is 3.3 People.
What is the Average Household Size in Rancho Santa Margarita
Average Household Size in Rancho Santa Margarita is 2.8 People.
How Large is the Labor Force in Rancho Santa Margarita?
There are 28,365 People in the Labor Forcein in Rancho Santa Margarita.
What is the Percentage of People in the Labor Force in Rancho Santa Margarita?
74.3% of People are in the Labor Force in Rancho Santa Margarita.
What is the Unemployment Rate in Rancho Santa Margarita?
Unemployment Rate in Rancho Santa Margarita is 3.3%.