Santee, CA Map & Demographics
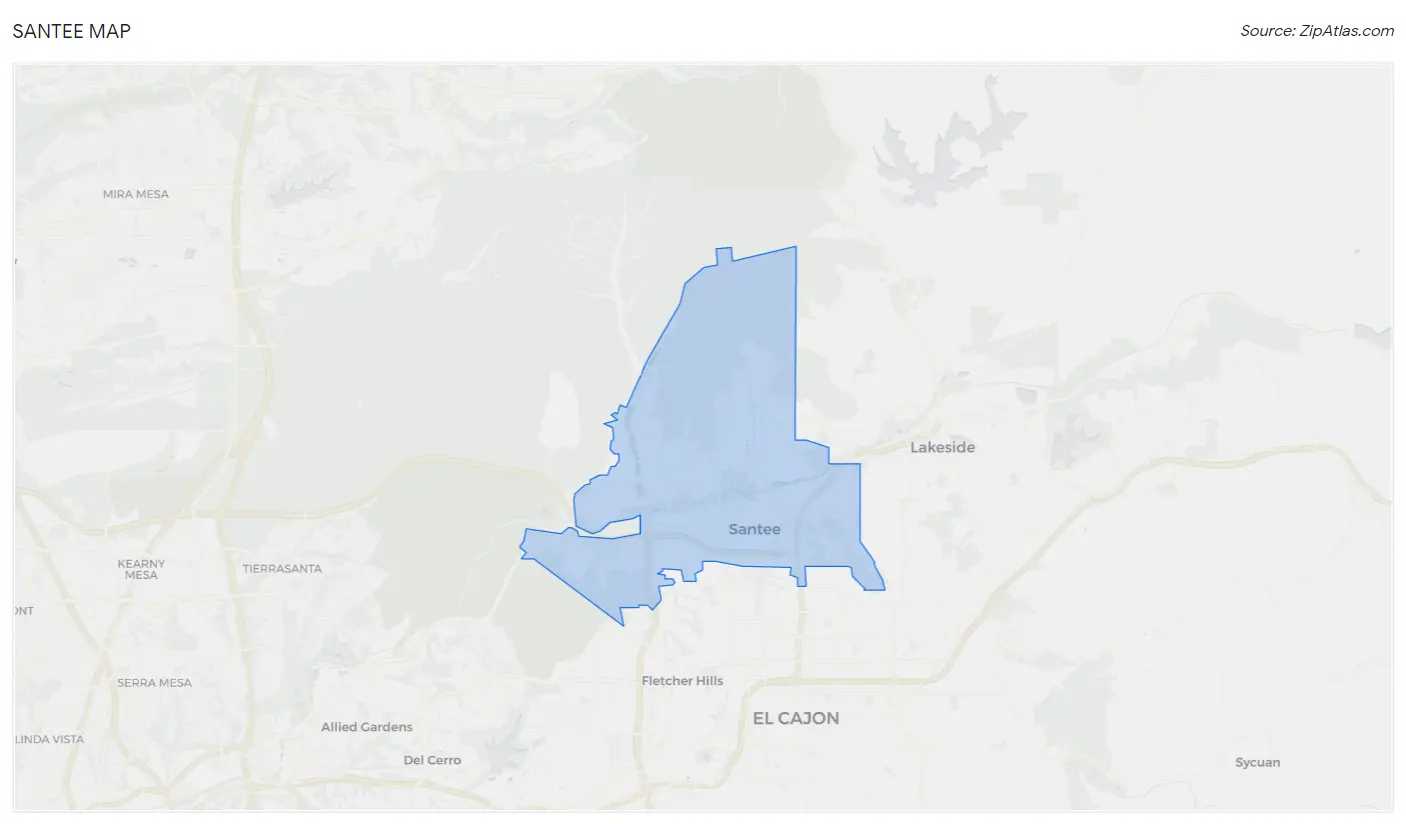
Santee Map
Santee Overview
$42,749
PER CAPITA INCOME
$112,029
AVG FAMILY INCOME
$101,777
AVG HOUSEHOLD INCOME
23.1%
WAGE / INCOME GAP [ % ]
76.9¢/ $1
WAGE / INCOME GAP [ $ ]
0.40
INEQUALITY / GINI INDEX
59,497
TOTAL POPULATION
29,868
MALE POPULATION
29,629
FEMALE POPULATION
100.81
MALES / 100 FEMALES
99.20
FEMALES / 100 MALES
39.0
MEDIAN AGE
3.3
AVG FAMILY SIZE
2.8
AVG HOUSEHOLD SIZE
29,975
LABOR FORCE [ PEOPLE ]
63.4%
PERCENT IN LABOR FORCE
5.4%
UNEMPLOYMENT RATE
Santee Zip Codes
Santee Area Codes
Income in Santee
Income Overview in Santee
Per Capita Income in Santee is $42,749, while median incomes of families and households are $112,029 and $101,777 respectively.
| Characteristic | Number | Measure |
| Per Capita Income | 59,497 | $42,749 |
| Median Family Income | 14,908 | $112,029 |
| Mean Family Income | 14,908 | $130,025 |
| Median Household Income | 20,642 | $101,777 |
| Mean Household Income | 20,642 | $119,016 |
| Income Deficit | 14,908 | $0 |
| Wage / Income Gap (%) | 59,497 | 23.10% |
| Wage / Income Gap ($) | 59,497 | 76.90¢ per $1 |
| Gini / Inequality Index | 59,497 | 0.40 |
Earnings by Sex in Santee
Average Earnings in Santee are $53,038, $59,528 for men and $45,776 for women, a difference of 23.1%.
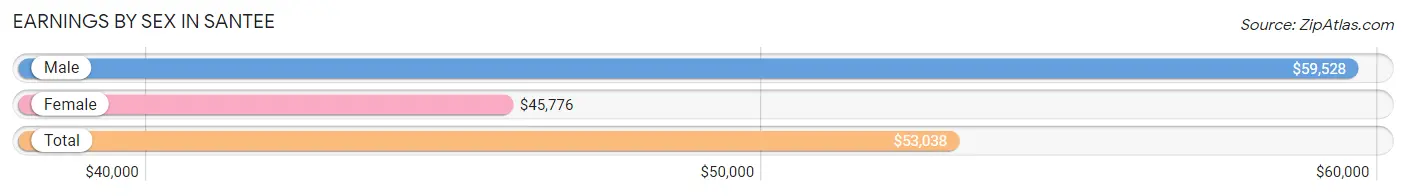
| Sex | Number | Average Earnings |
| Male | 17,020 (54.5%) | $59,528 |
| Female | 14,184 (45.5%) | $45,776 |
| Total | 31,204 (100.0%) | $53,038 |
Earnings by Sex by Income Bracket in Santee
The most common earnings brackets in Santee are $100,000+ for men (4,058 | 23.8%) and $100,000+ for women (1,939 | 13.7%).
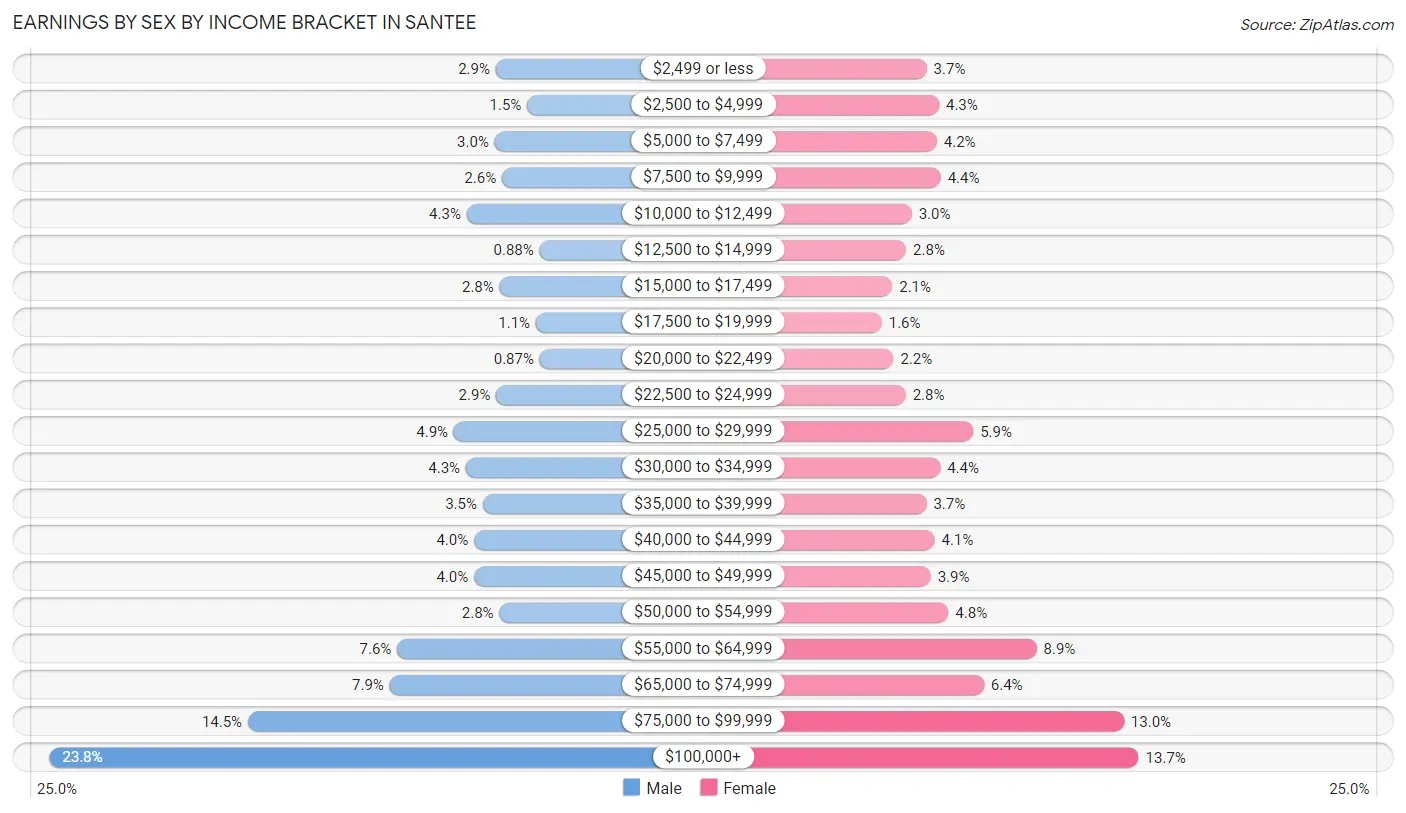
| Income | Male | Female |
| $2,499 or less | 498 (2.9%) | 531 (3.7%) |
| $2,500 to $4,999 | 248 (1.5%) | 613 (4.3%) |
| $5,000 to $7,499 | 507 (3.0%) | 599 (4.2%) |
| $7,500 to $9,999 | 449 (2.6%) | 624 (4.4%) |
| $10,000 to $12,499 | 731 (4.3%) | 431 (3.0%) |
| $12,500 to $14,999 | 150 (0.9%) | 394 (2.8%) |
| $15,000 to $17,499 | 468 (2.8%) | 302 (2.1%) |
| $17,500 to $19,999 | 178 (1.1%) | 232 (1.6%) |
| $20,000 to $22,499 | 148 (0.9%) | 311 (2.2%) |
| $22,500 to $24,999 | 495 (2.9%) | 392 (2.8%) |
| $25,000 to $29,999 | 832 (4.9%) | 839 (5.9%) |
| $30,000 to $34,999 | 737 (4.3%) | 621 (4.4%) |
| $35,000 to $39,999 | 602 (3.5%) | 529 (3.7%) |
| $40,000 to $44,999 | 673 (4.0%) | 583 (4.1%) |
| $45,000 to $49,999 | 672 (4.0%) | 557 (3.9%) |
| $50,000 to $54,999 | 470 (2.8%) | 675 (4.8%) |
| $55,000 to $64,999 | 1,285 (7.5%) | 1,261 (8.9%) |
| $65,000 to $74,999 | 1,345 (7.9%) | 910 (6.4%) |
| $75,000 to $99,999 | 2,474 (14.5%) | 1,841 (13.0%) |
| $100,000+ | 4,058 (23.8%) | 1,939 (13.7%) |
| Total | 17,020 (100.0%) | 14,184 (100.0%) |
Earnings by Sex by Educational Attainment in Santee
Average earnings in Santee are $67,874 for men and $51,382 for women, a difference of 24.3%. Men with an educational attainment of bachelor's degree enjoy the highest average annual earnings of $91,604, while those with less than high school education earn the least with $34,420. Women with an educational attainment of graduate degree earn the most with the average annual earnings of $80,955, while those with less than high school education have the smallest earnings of $20,492.
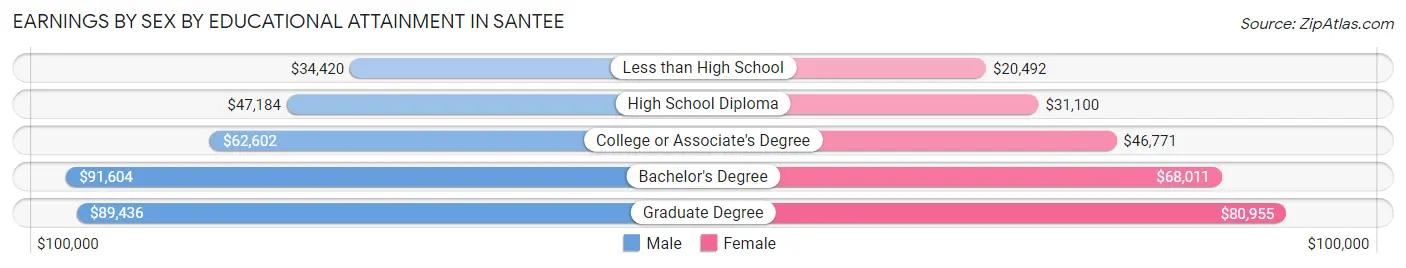
| Educational Attainment | Male Income | Female Income |
| Less than High School | $34,420 | $20,492 |
| High School Diploma | $47,184 | $31,100 |
| College or Associate's Degree | $62,602 | $46,771 |
| Bachelor's Degree | $91,604 | $68,011 |
| Graduate Degree | $89,436 | $80,955 |
| Total | $67,874 | $51,382 |
Family Income in Santee
Family Income Brackets in Santee
According to the Santee family income data, there are 3,369 families falling into the $100,000 to $149,999 income range, which is the most common income bracket and makes up 22.6% of all families. Conversely, the $10,000 to $14,999 income bracket is the least frequent group with only 209 families (1.4%) belonging to this category.
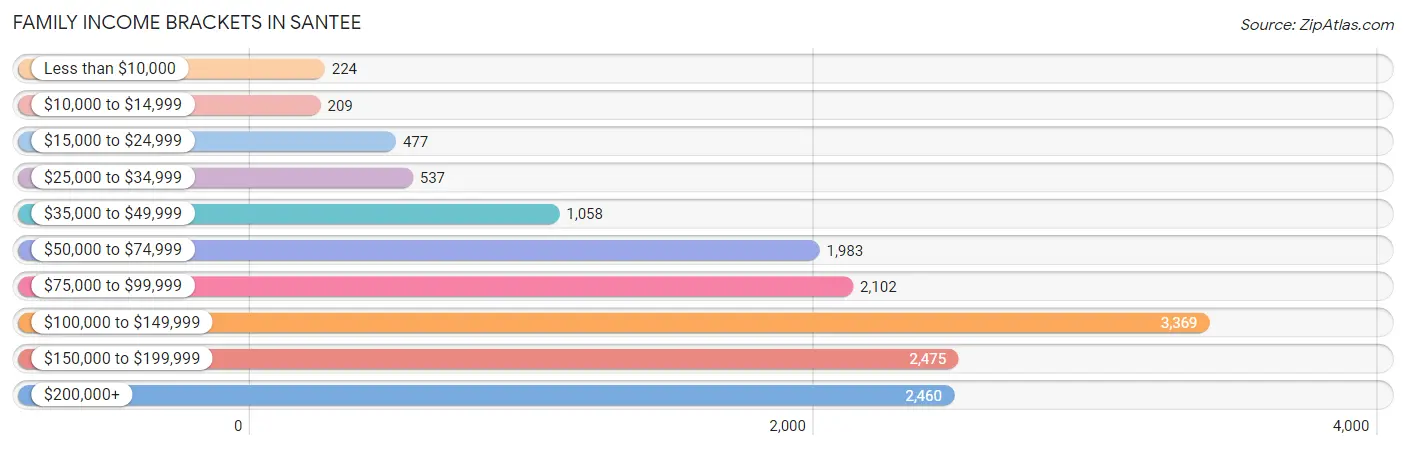
| Income Bracket | # Families | % Families |
| Less than $10,000 | 224 | 1.5% |
| $10,000 to $14,999 | 209 | 1.4% |
| $15,000 to $24,999 | 477 | 3.2% |
| $25,000 to $34,999 | 537 | 3.6% |
| $35,000 to $49,999 | 1,058 | 7.1% |
| $50,000 to $74,999 | 1,983 | 13.3% |
| $75,000 to $99,999 | 2,102 | 14.1% |
| $100,000 to $149,999 | 3,369 | 22.6% |
| $150,000 to $199,999 | 2,475 | 16.6% |
| $200,000+ | 2,460 | 16.5% |
Family Income by Famaliy Size in Santee
5-person families (1,320 | 8.8%) account for the highest median family income in Santee with $145,250 per family, while 2-person families (6,137 | 41.2%) have the highest median income of $45,510 per family member.
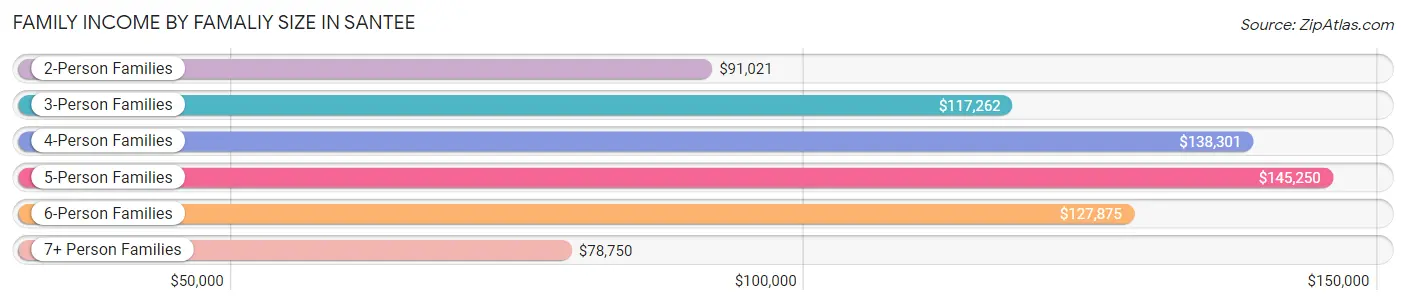
| Income Bracket | # Families | Median Income |
| 2-Person Families | 6,137 (41.2%) | $91,021 |
| 3-Person Families | 3,757 (25.2%) | $117,262 |
| 4-Person Families | 2,973 (19.9%) | $138,301 |
| 5-Person Families | 1,320 (8.8%) | $145,250 |
| 6-Person Families | 467 (3.1%) | $127,875 |
| 7+ Person Families | 254 (1.7%) | $78,750 |
| Total | 14,908 (100.0%) | $112,029 |
Family Income by Number of Earners in Santee
The median family income in Santee is $112,029, with families comprising 3+ earners (2,128) having the highest median family income of $176,000, while families with no earners (1,791) have the lowest median family income of $53,519, accounting for 14.3% and 12.0% of families, respectively.
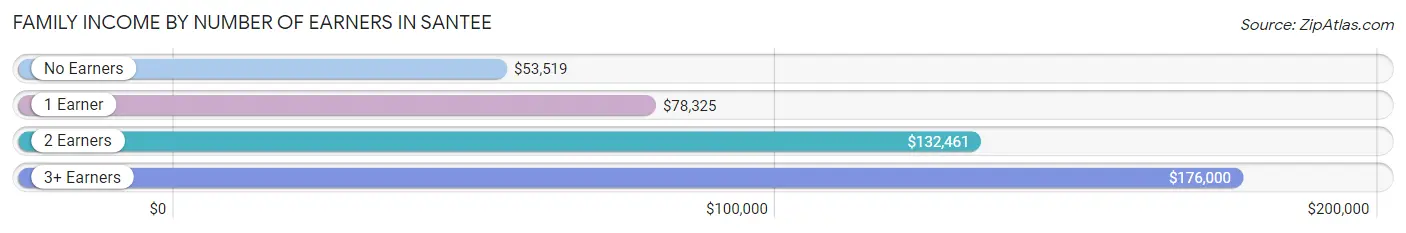
| Number of Earners | # Families | Median Income |
| No Earners | 1,791 (12.0%) | $53,519 |
| 1 Earner | 4,630 (31.1%) | $78,325 |
| 2 Earners | 6,359 (42.6%) | $132,461 |
| 3+ Earners | 2,128 (14.3%) | $176,000 |
| Total | 14,908 (100.0%) | $112,029 |
Household Income in Santee
Household Income Brackets in Santee
With 4,314 households falling in the category, the $100,000 to $149,999 income range is the most frequent in Santee, accounting for 20.9% of all households. In contrast, only 475 households (2.3%) fall into the $10,000 to $14,999 income bracket, making it the least populous group.
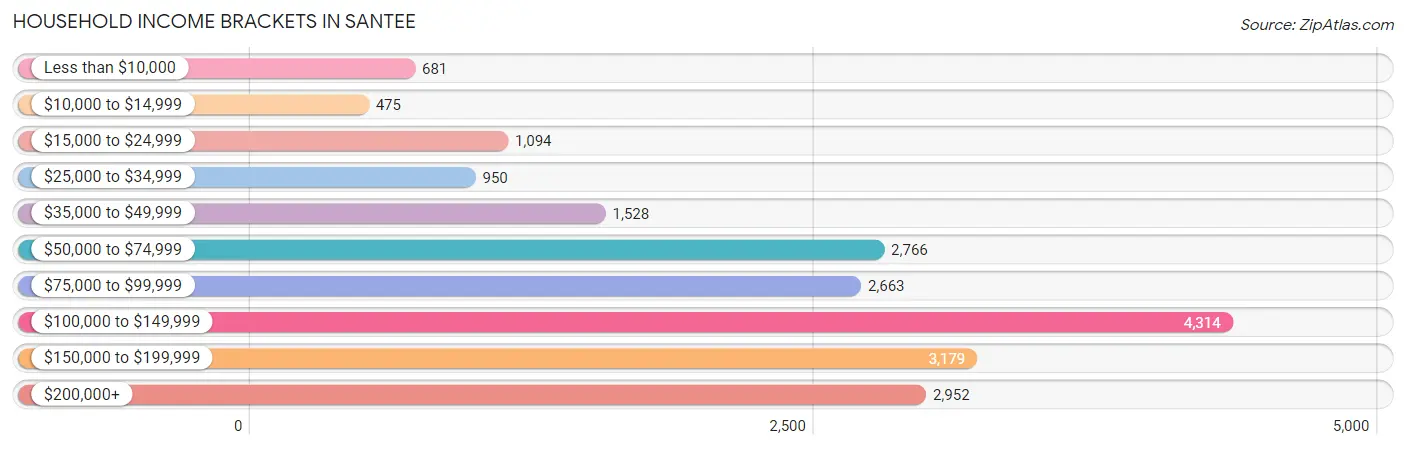
| Income Bracket | # Households | % Households |
| Less than $10,000 | 681 | 3.3% |
| $10,000 to $14,999 | 475 | 2.3% |
| $15,000 to $24,999 | 1,094 | 5.3% |
| $25,000 to $34,999 | 950 | 4.6% |
| $35,000 to $49,999 | 1,528 | 7.4% |
| $50,000 to $74,999 | 2,766 | 13.4% |
| $75,000 to $99,999 | 2,663 | 12.9% |
| $100,000 to $149,999 | 4,314 | 20.9% |
| $150,000 to $199,999 | 3,179 | 15.4% |
| $200,000+ | 2,952 | 14.3% |
Household Income by Householder Age in Santee
The median household income in Santee is $101,777, with the highest median household income of $118,487 found in the 45 to 64 years age bracket for the primary householder. A total of 7,804 households (37.8%) fall into this category. Meanwhile, the 15 to 24 years age bracket for the primary householder has the lowest median household income of $35,347, with 313 households (1.5%) in this group.
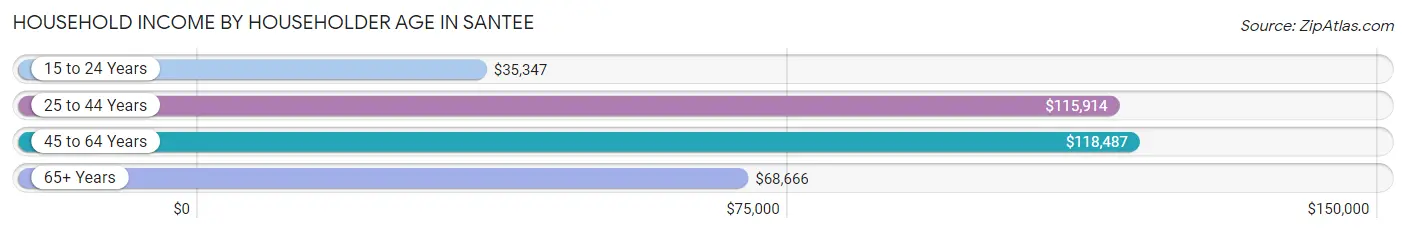
| Income Bracket | # Households | Median Income |
| 15 to 24 Years | 313 (1.5%) | $35,347 |
| 25 to 44 Years | 6,964 (33.7%) | $115,914 |
| 45 to 64 Years | 7,804 (37.8%) | $118,487 |
| 65+ Years | 5,561 (26.9%) | $68,666 |
| Total | 20,642 (100.0%) | $101,777 |
Poverty in Santee
Income Below Poverty by Sex and Age in Santee
With 7.0% poverty level for males and 10.0% for females among the residents of Santee, under 5 year old males and 5 year old females are the most vulnerable to poverty, with 341 males (14.1%) and 101 females (24.5%) in their respective age groups living below the poverty level.
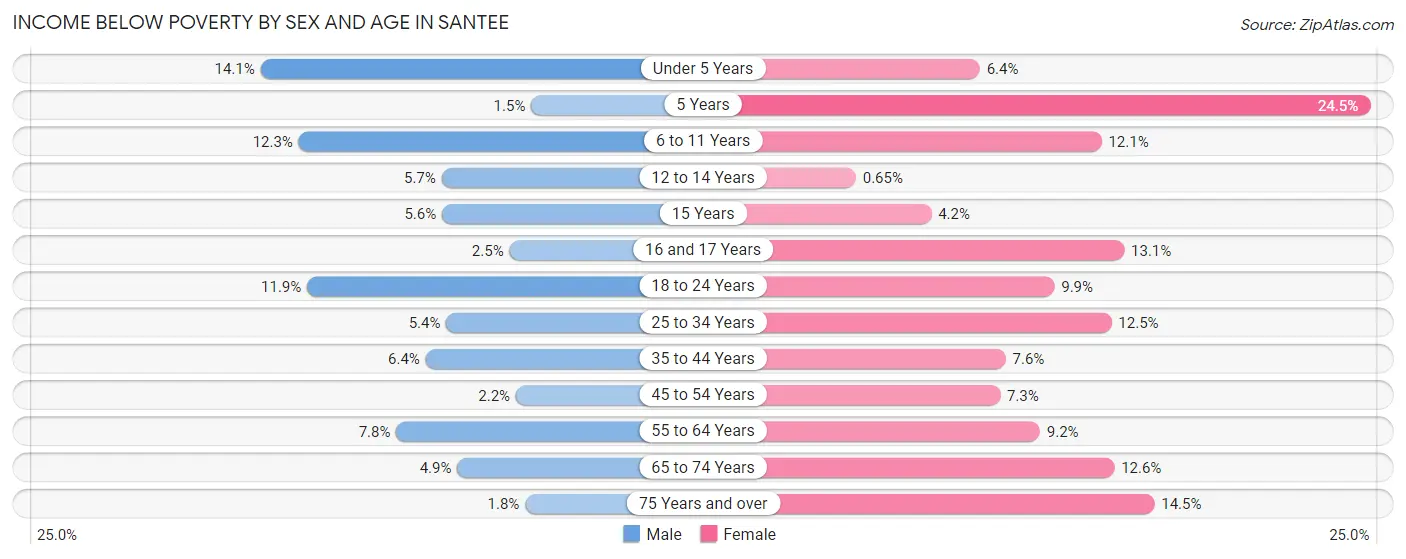
| Age Bracket | Male | Female |
| Under 5 Years | 341 (14.1%) | 115 (6.4%) |
| 5 Years | 4 (1.5%) | 101 (24.5%) |
| 6 to 11 Years | 284 (12.3%) | 239 (12.0%) |
| 12 to 14 Years | 59 (5.7%) | 6 (0.6%) |
| 15 Years | 25 (5.6%) | 13 (4.2%) |
| 16 and 17 Years | 20 (2.5%) | 74 (13.1%) |
| 18 to 24 Years | 295 (11.9%) | 165 (9.9%) |
| 25 to 34 Years | 216 (5.4%) | 501 (12.5%) |
| 35 to 44 Years | 279 (6.4%) | 314 (7.6%) |
| 45 to 54 Years | 77 (2.2%) | 272 (7.3%) |
| 55 to 64 Years | 290 (7.7%) | 355 (9.2%) |
| 65 to 74 Years | 122 (4.9%) | 389 (12.6%) |
| 75 Years and over | 26 (1.8%) | 297 (14.5%) |
| Total | 2,038 (7.0%) | 2,841 (10.0%) |
Income Above Poverty by Sex and Age in Santee
According to the poverty statistics in Santee, males aged 5 years and females aged 12 to 14 years are the age groups that are most secure financially, with 98.5% of males and 99.4% of females in these age groups living above the poverty line.
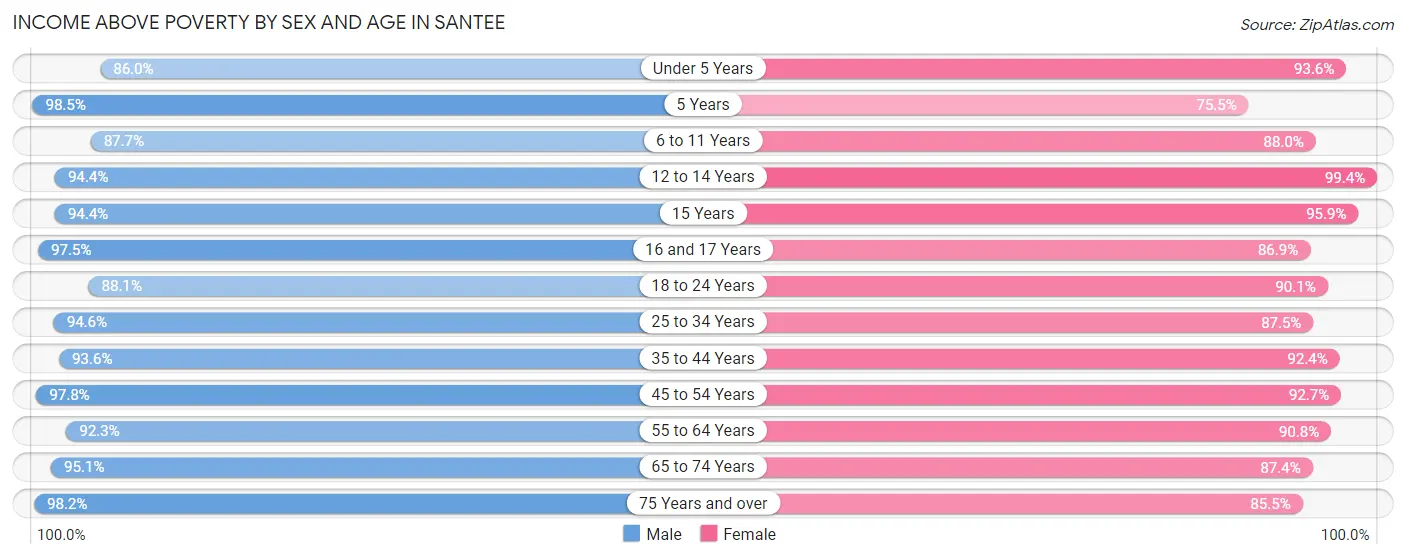
| Age Bracket | Male | Female |
| Under 5 Years | 2,086 (86.0%) | 1,682 (93.6%) |
| 5 Years | 264 (98.5%) | 311 (75.5%) |
| 6 to 11 Years | 2,029 (87.7%) | 1,745 (87.9%) |
| 12 to 14 Years | 985 (94.4%) | 924 (99.4%) |
| 15 Years | 419 (94.4%) | 300 (95.9%) |
| 16 and 17 Years | 779 (97.5%) | 491 (86.9%) |
| 18 to 24 Years | 2,187 (88.1%) | 1,509 (90.1%) |
| 25 to 34 Years | 3,759 (94.6%) | 3,504 (87.5%) |
| 35 to 44 Years | 4,084 (93.6%) | 3,818 (92.4%) |
| 45 to 54 Years | 3,430 (97.8%) | 3,433 (92.7%) |
| 55 to 64 Years | 3,452 (92.2%) | 3,509 (90.8%) |
| 65 to 74 Years | 2,358 (95.1%) | 2,688 (87.4%) |
| 75 Years and over | 1,440 (98.2%) | 1,751 (85.5%) |
| Total | 27,272 (93.0%) | 25,665 (90.0%) |
Income Below Poverty Among Married-Couple Families in Santee
The poverty statistics for married-couple families in Santee show that 3.0% or 350 of the total 11,545 families live below the poverty line. Families with 3 or 4 children have the highest poverty rate of 10.1%, comprising of 94 families. On the other hand, families with 5 or more children have the lowest poverty rate of 0.0%, which includes 0 families.
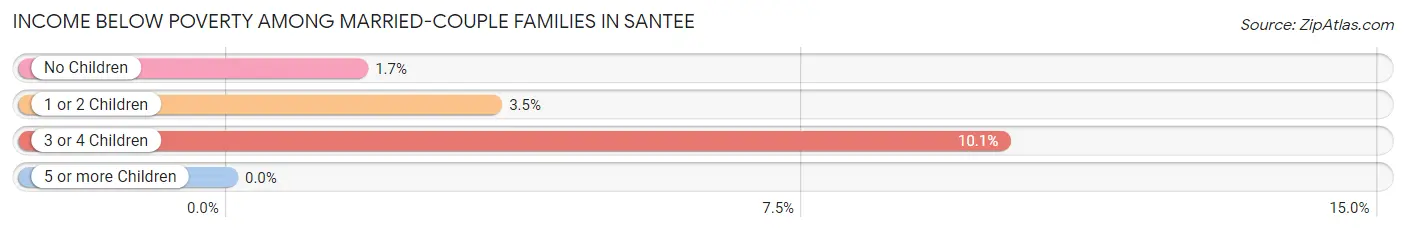
| Children | Above Poverty | Below Poverty |
| No Children | 5,957 (98.3%) | 103 (1.7%) |
| 1 or 2 Children | 4,279 (96.6%) | 153 (3.5%) |
| 3 or 4 Children | 839 (89.9%) | 94 (10.1%) |
| 5 or more Children | 120 (100.0%) | 0 (0.0%) |
| Total | 11,195 (97.0%) | 350 (3.0%) |
Income Below Poverty Among Single-Parent Households in Santee
According to the poverty data in Santee, 2.1% or 22 single-father households and 18.0% or 415 single-mother households are living below the poverty line. Among single-father households, those with no children have the highest poverty rate, with 22 households (3.8%) experiencing poverty. Likewise, among single-mother households, those with 3 or 4 children have the highest poverty rate, with 71 households (48.3%) falling below the poverty line.
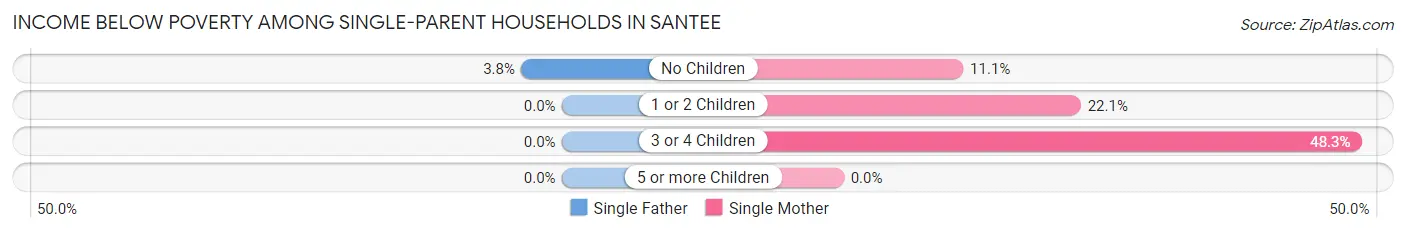
| Children | Single Father | Single Mother |
| No Children | 22 (3.8%) | 134 (11.1%) |
| 1 or 2 Children | 0 (0.0%) | 210 (22.1%) |
| 3 or 4 Children | 0 (0.0%) | 71 (48.3%) |
| 5 or more Children | 0 (0.0%) | 0 (0.0%) |
| Total | 22 (2.1%) | 415 (18.0%) |
Income Below Poverty Among Married-Couple vs Single-Parent Households in Santee
The poverty data for Santee shows that 350 of the married-couple family households (3.0%) and 437 of the single-parent households (13.0%) are living below the poverty level. Within the married-couple family households, those with 3 or 4 children have the highest poverty rate, with 94 households (10.1%) falling below the poverty line. Among the single-parent households, those with 3 or 4 children have the highest poverty rate, with 71 household (43.6%) living below poverty.
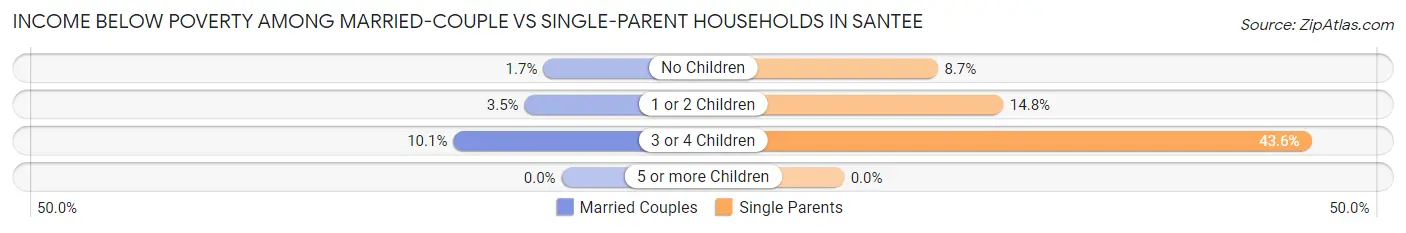
| Children | Married-Couple Families | Single-Parent Households |
| No Children | 103 (1.7%) | 156 (8.7%) |
| 1 or 2 Children | 153 (3.5%) | 210 (14.8%) |
| 3 or 4 Children | 94 (10.1%) | 71 (43.6%) |
| 5 or more Children | 0 (0.0%) | 0 (0.0%) |
| Total | 350 (3.0%) | 437 (13.0%) |
Race in Santee
The most populous races in Santee are White / Caucasian (44,058 | 74.1%), Hispanic or Latino (11,694 | 19.7%), and Two or more Races (8,067 | 13.6%).
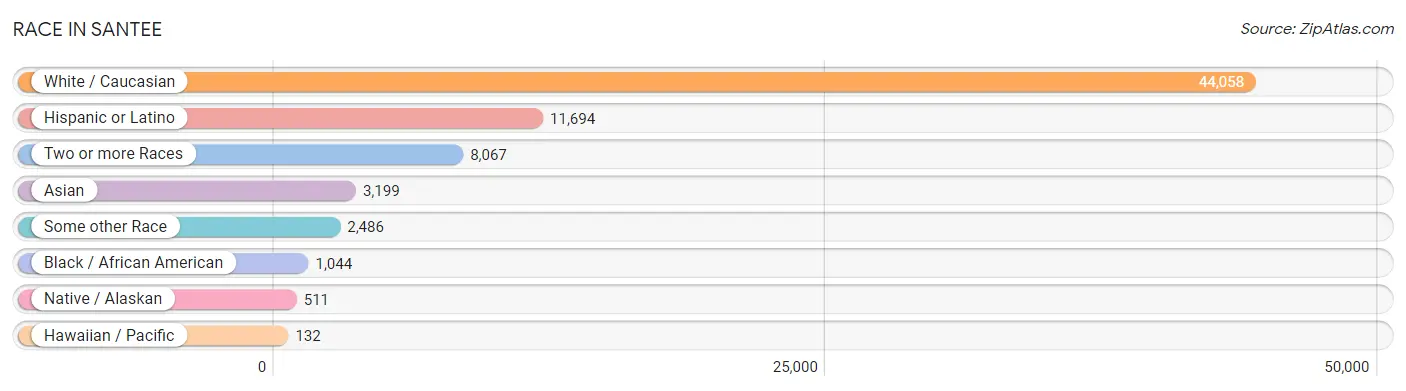
| Race | # Population | % Population |
| Asian | 3,199 | 5.4% |
| Black / African American | 1,044 | 1.8% |
| Hawaiian / Pacific | 132 | 0.2% |
| Hispanic or Latino | 11,694 | 19.7% |
| Native / Alaskan | 511 | 0.9% |
| White / Caucasian | 44,058 | 74.1% |
| Two or more Races | 8,067 | 13.6% |
| Some other Race | 2,486 | 4.2% |
| Total | 59,497 | 100.0% |
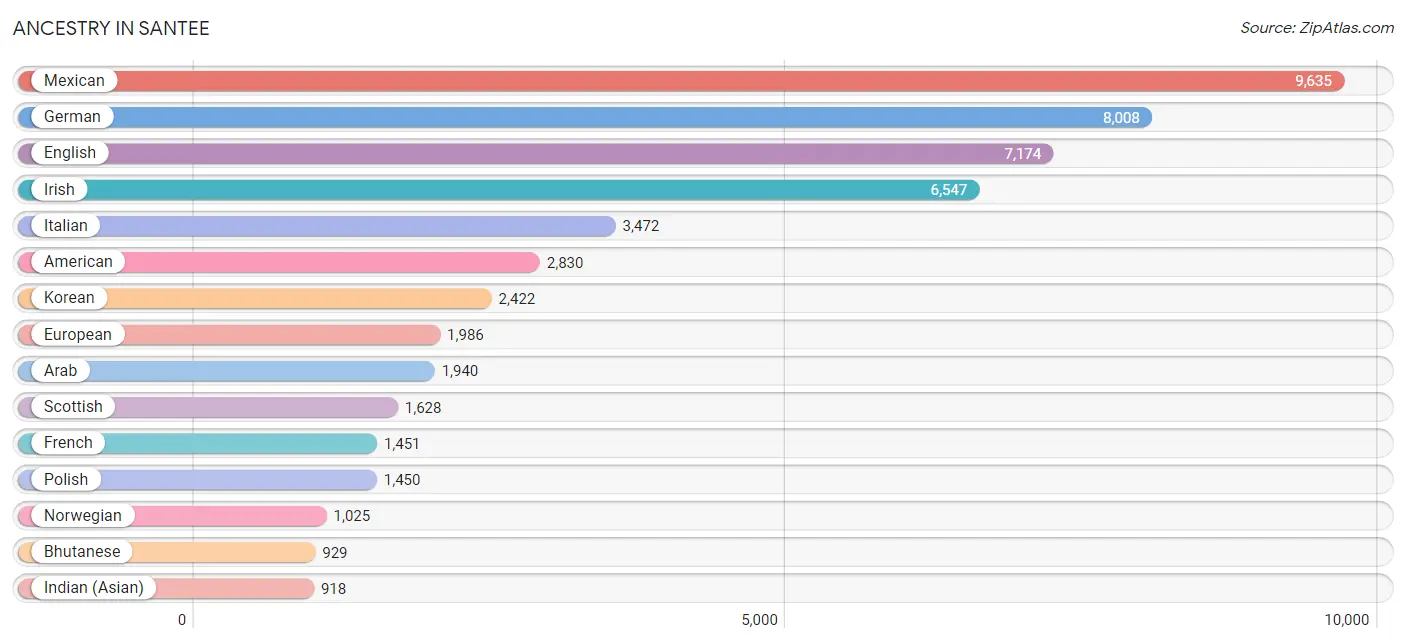
Ancestry in Santee
The most populous ancestries reported in Santee are Mexican (9,635 | 16.2%), German (8,008 | 13.5%), English (7,174 | 12.1%), Irish (6,547 | 11.0%), and Italian (3,472 | 5.8%), together accounting for 58.6% of all Santee residents.
| Ancestry | # Population | % Population |
| Afghan | 60 | 0.1% |
| African | 133 | 0.2% |
| Albanian | 291 | 0.5% |
| American | 2,830 | 4.8% |
| Apache | 12 | 0.0% |
| Arab | 1,940 | 3.3% |
| Argentinean | 7 | 0.0% |
| Armenian | 73 | 0.1% |
| Assyrian / Chaldean / Syriac | 94 | 0.2% |
| Australian | 1 | 0.0% |
| Austrian | 177 | 0.3% |
| Basque | 34 | 0.1% |
| Belgian | 10 | 0.0% |
| Belizean | 9 | 0.0% |
| Bhutanese | 929 | 1.6% |
| Blackfeet | 92 | 0.2% |
| British | 338 | 0.6% |
| Burmese | 127 | 0.2% |
| Cambodian | 28 | 0.1% |
| Canadian | 203 | 0.3% |
| Celtic | 32 | 0.1% |
| Central American | 383 | 0.6% |
| Cherokee | 204 | 0.3% |
| Cheyenne | 12 | 0.0% |
| Chippewa | 15 | 0.0% |
| Choctaw | 136 | 0.2% |
| Colombian | 107 | 0.2% |
| Creek | 12 | 0.0% |
| Croatian | 46 | 0.1% |
| Cuban | 17 | 0.0% |
| Czech | 224 | 0.4% |
| Czechoslovakian | 84 | 0.1% |
| Danish | 335 | 0.6% |
| Dominican | 104 | 0.2% |
| Dutch | 568 | 0.9% |
| Eastern European | 370 | 0.6% |
| Ecuadorian | 6 | 0.0% |
| Egyptian | 34 | 0.1% |
| English | 7,174 | 12.1% |
| European | 1,986 | 3.3% |
| Filipino | 25 | 0.0% |
| Finnish | 181 | 0.3% |
| French | 1,451 | 2.4% |
| French American Indian | 95 | 0.2% |
| French Canadian | 175 | 0.3% |
| German | 8,008 | 13.5% |
| Greek | 286 | 0.5% |
| Guamanian / Chamorro | 374 | 0.6% |
| Guatemalan | 15 | 0.0% |
| Haitian | 39 | 0.1% |
| Hmong | 20 | 0.0% |
| Honduran | 130 | 0.2% |
| Hungarian | 344 | 0.6% |
| Indian (Asian) | 918 | 1.5% |
| Iranian | 67 | 0.1% |
| Iraqi | 650 | 1.1% |
| Irish | 6,547 | 11.0% |
| Iroquois | 27 | 0.1% |
| Italian | 3,472 | 5.8% |
| Jamaican | 43 | 0.1% |
| Japanese | 57 | 0.1% |
| Jordanian | 7 | 0.0% |
| Korean | 2,422 | 4.1% |
| Laotian | 39 | 0.1% |
| Lebanese | 306 | 0.5% |
| Lithuanian | 130 | 0.2% |
| Malaysian | 84 | 0.1% |
| Maltese | 7 | 0.0% |
| Mexican | 9,635 | 16.2% |
| Mexican American Indian | 225 | 0.4% |
| Native Hawaiian | 456 | 0.8% |
| Nicaraguan | 82 | 0.1% |
| Northern European | 123 | 0.2% |
| Norwegian | 1,025 | 1.7% |
| Paiute | 10 | 0.0% |
| Pakistani | 146 | 0.3% |
| Palestinian | 149 | 0.3% |
| Panamanian | 15 | 0.0% |
| Peruvian | 107 | 0.2% |
| Pima | 31 | 0.1% |
| Polish | 1,450 | 2.4% |
| Portuguese | 281 | 0.5% |
| Puerto Rican | 308 | 0.5% |
| Romanian | 7 | 0.0% |
| Russian | 512 | 0.9% |
| Salvadoran | 141 | 0.2% |
| Samoan | 70 | 0.1% |
| Scandinavian | 284 | 0.5% |
| Scotch-Irish | 585 | 1.0% |
| Scottish | 1,628 | 2.7% |
| Seminole | 27 | 0.1% |
| Serbian | 11 | 0.0% |
| Shoshone | 24 | 0.0% |
| Sioux | 3 | 0.0% |
| Slovak | 64 | 0.1% |
| Slovene | 142 | 0.2% |
| South African | 96 | 0.2% |
| South American | 250 | 0.4% |
| South American Indian | 40 | 0.1% |
| Spaniard | 309 | 0.5% |
| Spanish | 215 | 0.4% |
| Sri Lankan | 672 | 1.1% |
| Subsaharan African | 256 | 0.4% |
| Swedish | 833 | 1.4% |
| Swiss | 97 | 0.2% |
| Syrian | 527 | 0.9% |
| Thai | 192 | 0.3% |
| Tlingit-Haida | 9 | 0.0% |
| Tongan | 11 | 0.0% |
| Turkish | 86 | 0.1% |
| Ugandan | 7 | 0.0% |
| Ukrainian | 103 | 0.2% |
| Venezuelan | 23 | 0.0% |
| Welsh | 163 | 0.3% |
| West Indian | 1 | 0.0% |
| Yaqui | 55 | 0.1% |
| Yugoslavian | 29 | 0.1% |
| Zimbabwean | 14 | 0.0% | View All 118 Rows |
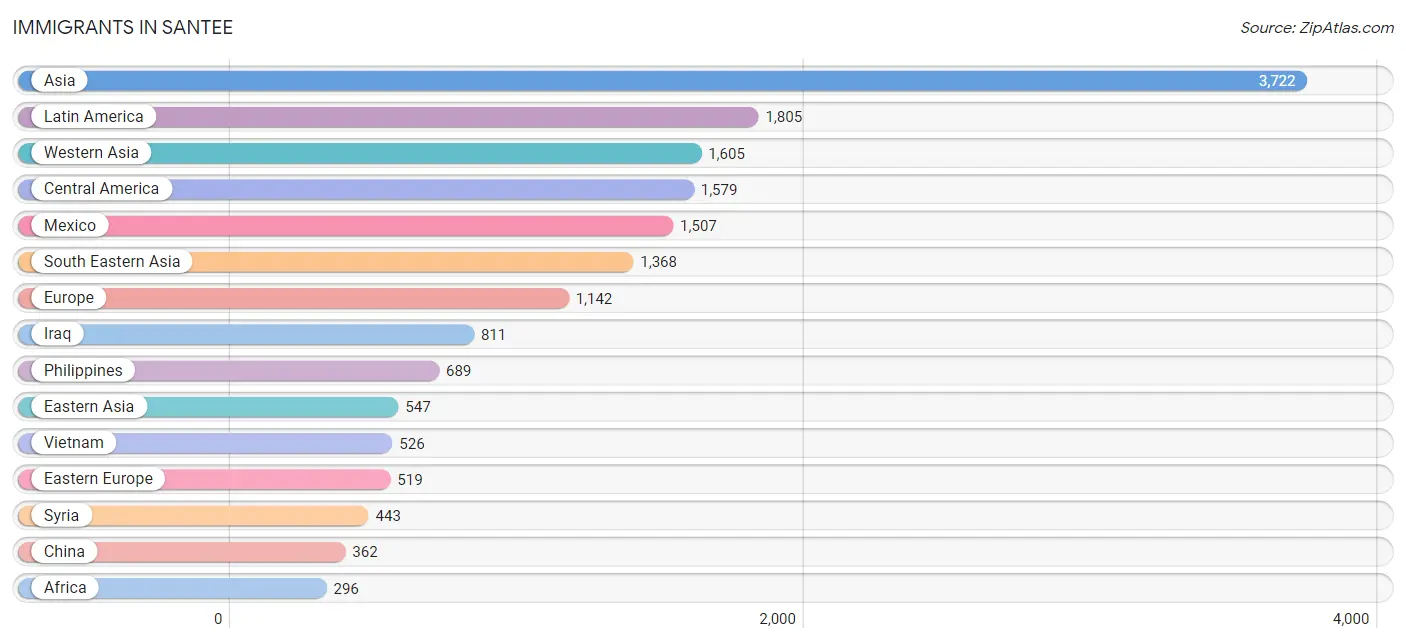
Immigrants in Santee
The most numerous immigrant groups reported in Santee came from Asia (3,722 | 6.3%), Latin America (1,805 | 3.0%), Western Asia (1,605 | 2.7%), Central America (1,579 | 2.6%), and Mexico (1,507 | 2.5%), together accounting for 17.2% of all Santee residents.
| Immigration Origin | # Population | % Population |
| Afghanistan | 60 | 0.1% |
| Africa | 296 | 0.5% |
| Albania | 51 | 0.1% |
| Argentina | 7 | 0.0% |
| Armenia | 3 | 0.0% |
| Asia | 3,722 | 6.3% |
| Australia | 9 | 0.0% |
| Austria | 36 | 0.1% |
| Belize | 9 | 0.0% |
| Brazil | 19 | 0.0% |
| Cambodia | 25 | 0.0% |
| Canada | 223 | 0.4% |
| Caribbean | 74 | 0.1% |
| Central America | 1,579 | 2.6% |
| Chile | 8 | 0.0% |
| China | 362 | 0.6% |
| Colombia | 61 | 0.1% |
| Czechoslovakia | 89 | 0.2% |
| Dominican Republic | 59 | 0.1% |
| Eastern Africa | 21 | 0.0% |
| Eastern Asia | 547 | 0.9% |
| Eastern Europe | 519 | 0.9% |
| Egypt | 38 | 0.1% |
| El Salvador | 57 | 0.1% |
| England | 71 | 0.1% |
| Europe | 1,142 | 1.9% |
| France | 88 | 0.2% |
| Germany | 23 | 0.0% |
| Greece | 52 | 0.1% |
| Guyana | 9 | 0.0% |
| Honduras | 6 | 0.0% |
| Hong Kong | 115 | 0.2% |
| India | 27 | 0.1% |
| Indonesia | 73 | 0.1% |
| Iran | 55 | 0.1% |
| Iraq | 811 | 1.4% |
| Ireland | 6 | 0.0% |
| Israel | 16 | 0.0% |
| Italy | 120 | 0.2% |
| Japan | 172 | 0.3% |
| Jordan | 117 | 0.2% |
| Korea | 13 | 0.0% |
| Laos | 20 | 0.0% |
| Latin America | 1,805 | 3.0% |
| Lebanon | 193 | 0.3% |
| Mexico | 1,507 | 2.5% |
| Nepal | 34 | 0.1% |
| Netherlands | 38 | 0.1% |
| Northern Africa | 38 | 0.1% |
| Northern Europe | 205 | 0.3% |
| Oceania | 40 | 0.1% |
| Pakistan | 7 | 0.0% |
| Peru | 25 | 0.0% |
| Philippines | 689 | 1.2% |
| Poland | 43 | 0.1% |
| Russia | 94 | 0.2% |
| Saudi Arabia | 6 | 0.0% |
| Scotland | 23 | 0.0% |
| South Africa | 237 | 0.4% |
| South America | 152 | 0.3% |
| South Central Asia | 202 | 0.3% |
| South Eastern Asia | 1,368 | 2.3% |
| Southern Europe | 225 | 0.4% |
| Spain | 32 | 0.1% |
| Switzerland | 8 | 0.0% |
| Syria | 443 | 0.7% |
| Taiwan | 37 | 0.1% |
| Thailand | 35 | 0.1% |
| Trinidad and Tobago | 15 | 0.0% |
| Turkey | 16 | 0.0% |
| Uganda | 7 | 0.0% |
| Ukraine | 70 | 0.1% |
| Uzbekistan | 19 | 0.0% |
| Venezuela | 23 | 0.0% |
| Vietnam | 526 | 0.9% |
| Western Asia | 1,605 | 2.7% |
| Western Europe | 193 | 0.3% |
| Zimbabwe | 14 | 0.0% | View All 78 Rows |
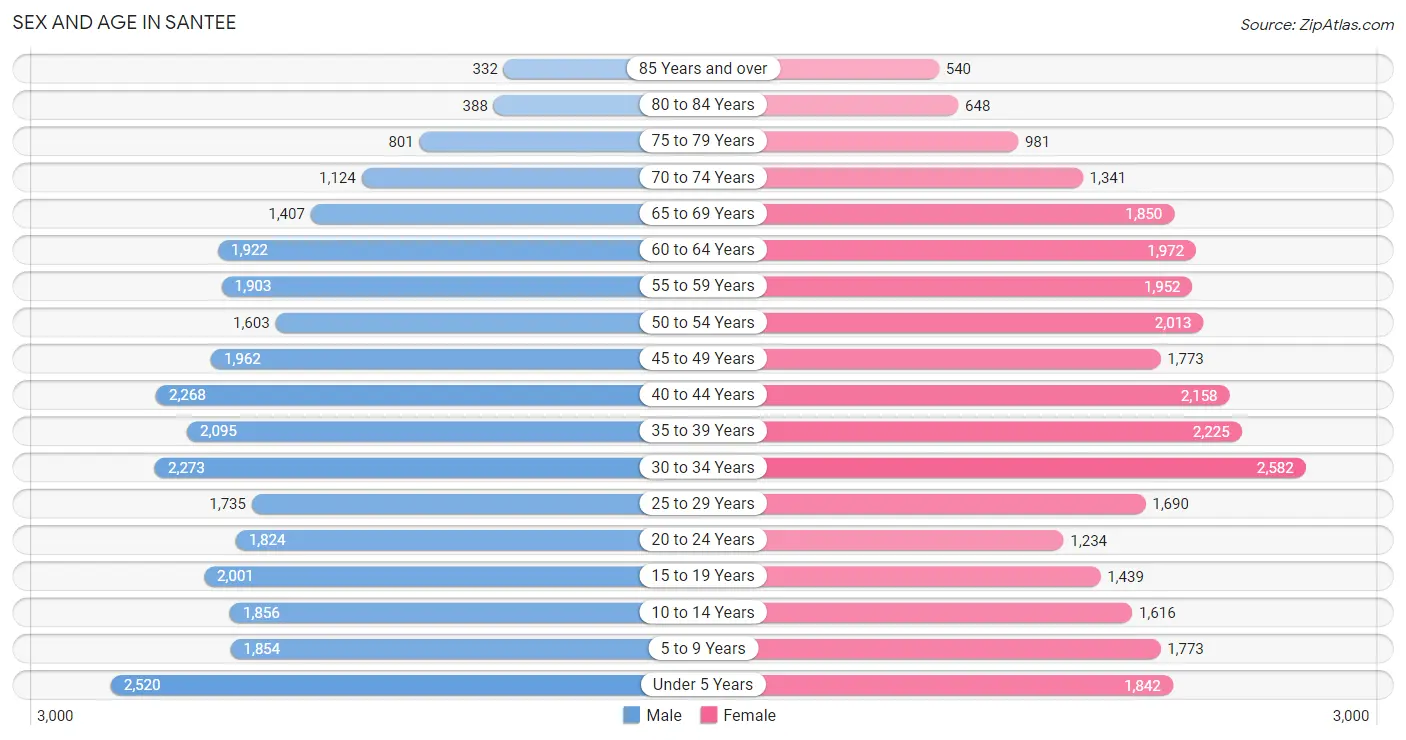
Sex and Age in Santee
Sex and Age in Santee
The most populous age groups in Santee are Under 5 Years (2,520 | 8.4%) for men and 30 to 34 Years (2,582 | 8.7%) for women.
| Age Bracket | Male | Female |
| Under 5 Years | 2,520 (8.4%) | 1,842 (6.2%) |
| 5 to 9 Years | 1,854 (6.2%) | 1,773 (6.0%) |
| 10 to 14 Years | 1,856 (6.2%) | 1,616 (5.4%) |
| 15 to 19 Years | 2,001 (6.7%) | 1,439 (4.9%) |
| 20 to 24 Years | 1,824 (6.1%) | 1,234 (4.2%) |
| 25 to 29 Years | 1,735 (5.8%) | 1,690 (5.7%) |
| 30 to 34 Years | 2,273 (7.6%) | 2,582 (8.7%) |
| 35 to 39 Years | 2,095 (7.0%) | 2,225 (7.5%) |
| 40 to 44 Years | 2,268 (7.6%) | 2,158 (7.3%) |
| 45 to 49 Years | 1,962 (6.6%) | 1,773 (6.0%) |
| 50 to 54 Years | 1,603 (5.4%) | 2,013 (6.8%) |
| 55 to 59 Years | 1,903 (6.4%) | 1,952 (6.6%) |
| 60 to 64 Years | 1,922 (6.4%) | 1,972 (6.7%) |
| 65 to 69 Years | 1,407 (4.7%) | 1,850 (6.2%) |
| 70 to 74 Years | 1,124 (3.8%) | 1,341 (4.5%) |
| 75 to 79 Years | 801 (2.7%) | 981 (3.3%) |
| 80 to 84 Years | 388 (1.3%) | 648 (2.2%) |
| 85 Years and over | 332 (1.1%) | 540 (1.8%) |
| Total | 29,868 (100.0%) | 29,629 (100.0%) |
Families and Households in Santee
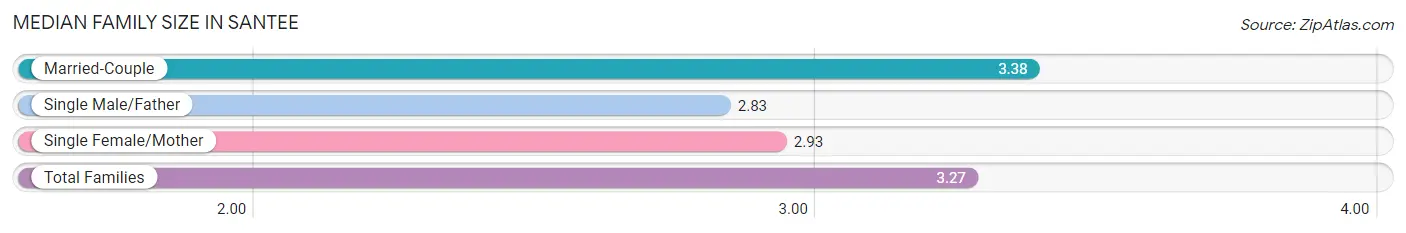
Median Family Size in Santee
The median family size in Santee is 3.27 persons per family, with married-couple families (11,545 | 77.4%) accounting for the largest median family size of 3.38 persons per family. On the other hand, single male/father families (1,061 | 7.1%) represent the smallest median family size with 2.83 persons per family.
| Family Type | # Families | Family Size |
| Married-Couple | 11,545 (77.4%) | 3.38 |
| Single Male/Father | 1,061 (7.1%) | 2.83 |
| Single Female/Mother | 2,302 (15.4%) | 2.93 |
| Total Families | 14,908 (100.0%) | 3.27 |
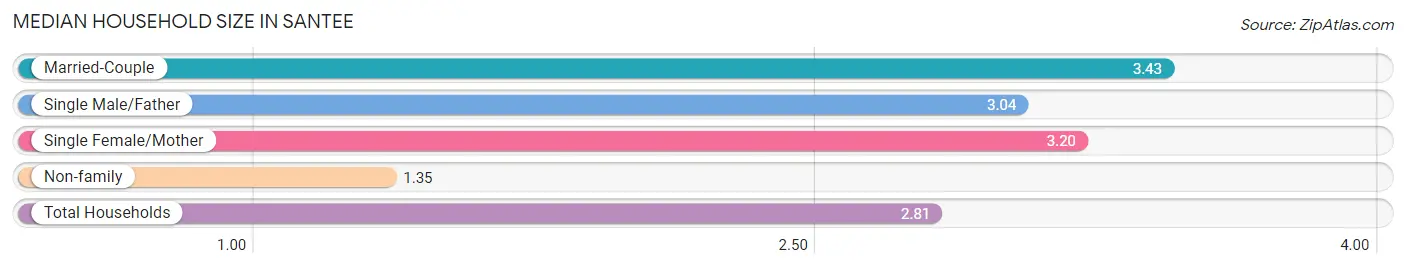
Median Household Size in Santee
The median household size in Santee is 2.81 persons per household, with married-couple households (11,545 | 55.9%) accounting for the largest median household size of 3.43 persons per household. non-family households (5,734 | 27.8%) represent the smallest median household size with 1.35 persons per household.
| Household Type | # Households | Household Size |
| Married-Couple | 11,545 (55.9%) | 3.43 |
| Single Male/Father | 1,061 (5.1%) | 3.04 |
| Single Female/Mother | 2,302 (11.2%) | 3.20 |
| Non-family | 5,734 (27.8%) | 1.35 |
| Total Households | 20,642 (100.0%) | 2.81 |
Household Size by Marriage Status in Santee
Out of a total of 20,642 households in Santee, 14,908 (72.2%) are family households, while 5,734 (27.8%) are nonfamily households. The most numerous type of family households are 2-person households, comprising 5,690, and the most common type of nonfamily households are 1-person households, comprising 4,272.
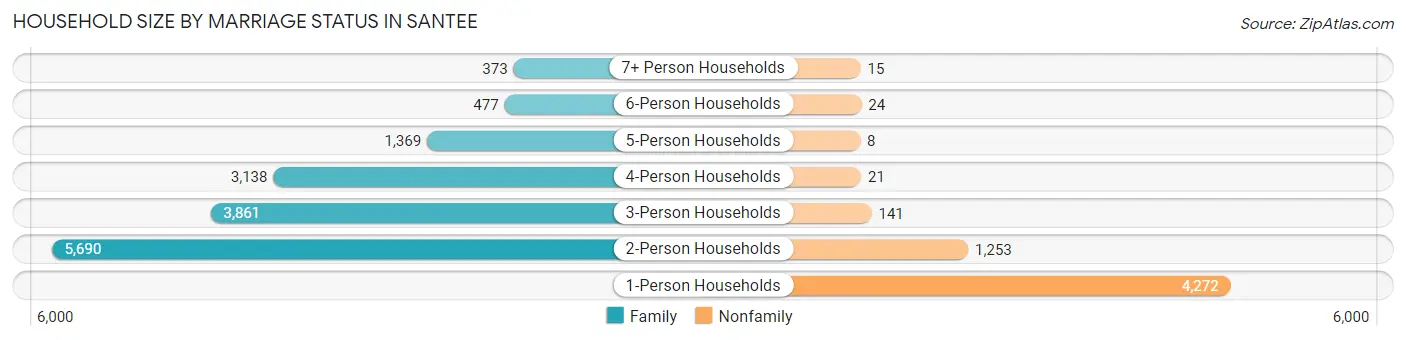
| Household Size | Family Households | Nonfamily Households |
| 1-Person Households | - | 4,272 (20.7%) |
| 2-Person Households | 5,690 (27.6%) | 1,253 (6.1%) |
| 3-Person Households | 3,861 (18.7%) | 141 (0.7%) |
| 4-Person Households | 3,138 (15.2%) | 21 (0.1%) |
| 5-Person Households | 1,369 (6.6%) | 8 (0.0%) |
| 6-Person Households | 477 (2.3%) | 24 (0.1%) |
| 7+ Person Households | 373 (1.8%) | 15 (0.1%) |
| Total | 14,908 (72.2%) | 5,734 (27.8%) |
Female Fertility in Santee
Fertility by Age in Santee
Average fertility rate in Santee is 54.0 births per 1,000 women. Women in the age bracket of 20 to 34 years have the highest fertility rate with 87.0 births per 1,000 women. Women in the age bracket of 20 to 34 years acount for 66.0% of all women with births.
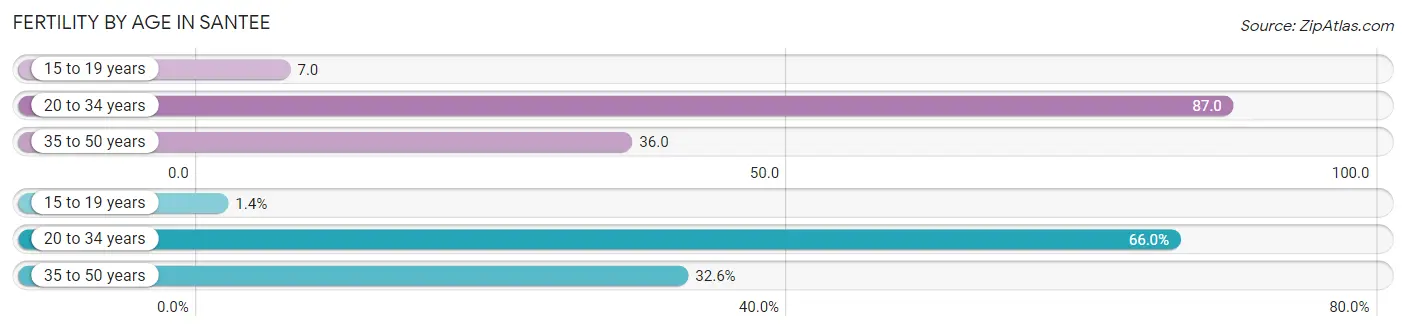
| Age Bracket | Women with Births | Births / 1,000 Women |
| 15 to 19 years | 10 (1.4%) | 7.0 |
| 20 to 34 years | 478 (66.0%) | 87.0 |
| 35 to 50 years | 236 (32.6%) | 36.0 |
| Total | 724 (100.0%) | 54.0 |
Fertility by Age by Marriage Status in Santee
85.5% of women with births (724) in Santee are married. The highest percentage of unmarried women with births falls into 15 to 19 years age bracket with 100.0% of them unmarried at the time of birth, while the lowest percentage of unmarried women with births belong to 20 to 34 years age bracket with 13.2% of them unmarried.
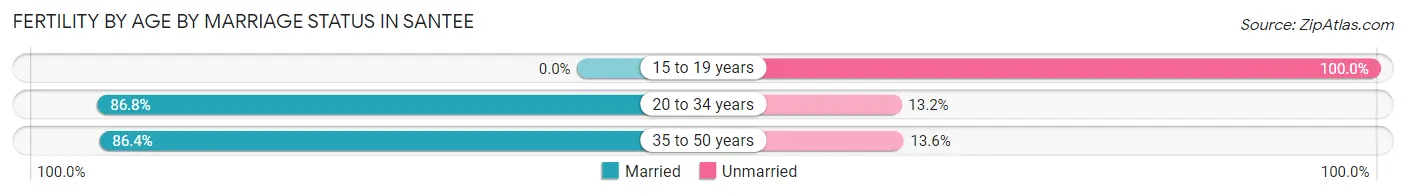
| Age Bracket | Married | Unmarried |
| 15 to 19 years | 0 (0.0%) | 10 (100.0%) |
| 20 to 34 years | 415 (86.8%) | 63 (13.2%) |
| 35 to 50 years | 204 (86.4%) | 32 (13.6%) |
| Total | 619 (85.5%) | 105 (14.5%) |
Fertility by Education in Santee
Average fertility rate in Santee is 54.0 births per 1,000 women. Women with the education attainment of bachelor's degree have the highest fertility rate of 80.0 births per 1,000 women, while women with the education attainment of less than high school have the lowest fertility at 5.0 births per 1,000 women. Women with the education attainment of bachelor's degree represent 34.8% of all women with births.
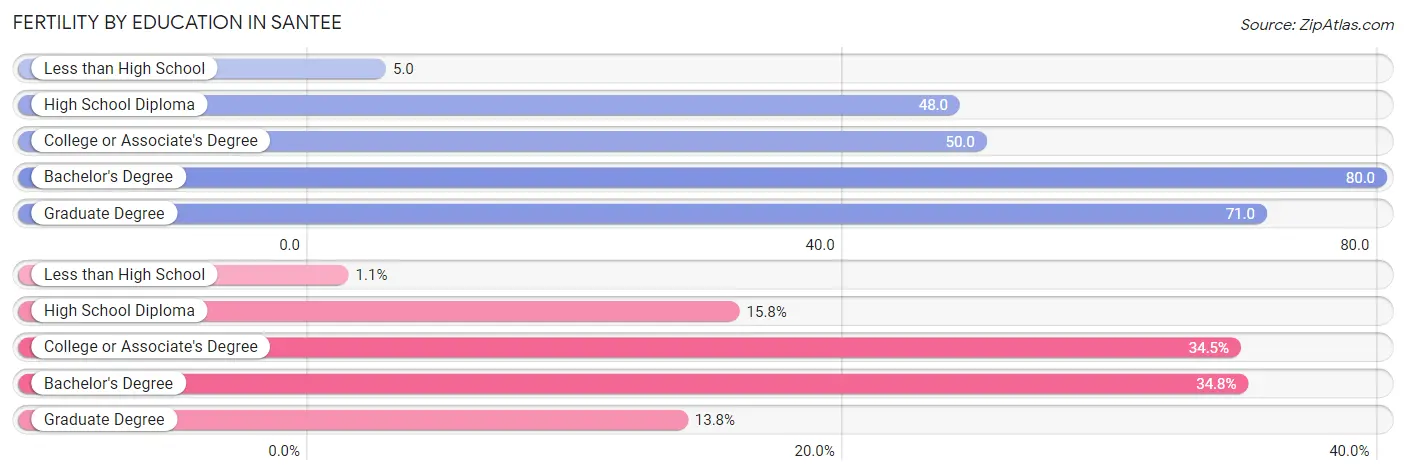
| Educational Attainment | Women with Births | Births / 1,000 Women |
| Less than High School | 8 (1.1%) | 5.0 |
| High School Diploma | 114 (15.8%) | 48.0 |
| College or Associate's Degree | 250 (34.5%) | 50.0 |
| Bachelor's Degree | 252 (34.8%) | 80.0 |
| Graduate Degree | 100 (13.8%) | 71.0 |
| Total | 724 (100.0%) | 54.0 |
Fertility by Education by Marriage Status in Santee
14.5% of women with births in Santee are unmarried. Women with the educational attainment of bachelor's degree are most likely to be married with 100.0% of them married at childbirth, while women with the educational attainment of high school diploma are least likely to be married with 50.9% of them unmarried at childbirth.
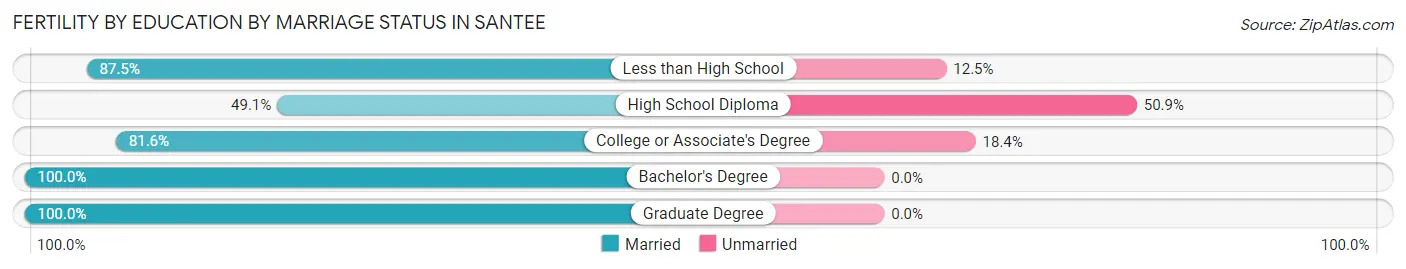
| Educational Attainment | Married | Unmarried |
| Less than High School | 7 (87.5%) | 1 (12.5%) |
| High School Diploma | 56 (49.1%) | 58 (50.9%) |
| College or Associate's Degree | 204 (81.6%) | 46 (18.4%) |
| Bachelor's Degree | 252 (100.0%) | 0 (0.0%) |
| Graduate Degree | 100 (100.0%) | 0 (0.0%) |
| Total | 619 (85.5%) | 105 (14.5%) |
Employment Characteristics in Santee
Employment by Class of Employer in Santee
Among the 27,516 employed individuals in Santee, private company employees (17,002 | 61.8%), not-for-profit organizations (2,832 | 10.3%), and federal government employees (2,376 | 8.6%) make up the most common classes of employment.
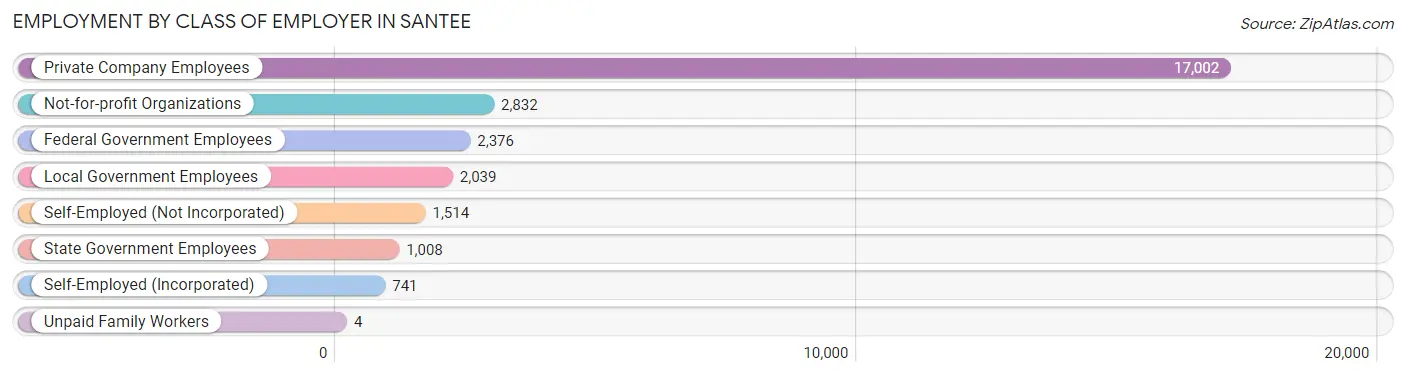
| Employer Class | # Employees | % Employees |
| Private Company Employees | 17,002 | 61.8% |
| Self-Employed (Incorporated) | 741 | 2.7% |
| Self-Employed (Not Incorporated) | 1,514 | 5.5% |
| Not-for-profit Organizations | 2,832 | 10.3% |
| Local Government Employees | 2,039 | 7.4% |
| State Government Employees | 1,008 | 3.7% |
| Federal Government Employees | 2,376 | 8.6% |
| Unpaid Family Workers | 4 | 0.0% |
| Total | 27,516 | 100.0% |
Employment Status by Age in Santee
According to the labor force statistics for Santee, out of the total population over 16 years of age (47,279), 63.4% or 29,975 individuals are in the labor force, with 5.4% or 1,619 of them unemployed. The age group with the highest labor force participation rate is 35 to 44 years, with 84.5% or 7,390 individuals in the labor force. Within the labor force, the 16 to 19 years age range has the highest percentage of unemployed individuals, with 15.0% or 162 of them being unemployed.
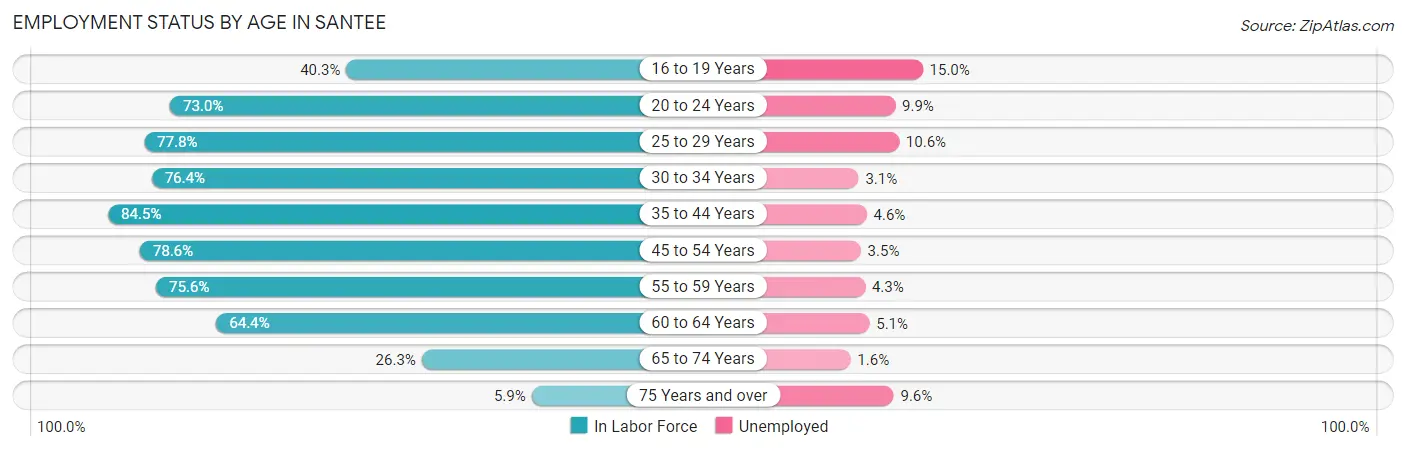
| Age Bracket | In Labor Force | Unemployed |
| 16 to 19 Years | 1,081 (40.3%) | 162 (15.0%) |
| 20 to 24 Years | 2,232 (73.0%) | 221 (9.9%) |
| 25 to 29 Years | 2,665 (77.8%) | 282 (10.6%) |
| 30 to 34 Years | 3,709 (76.4%) | 115 (3.1%) |
| 35 to 44 Years | 7,390 (84.5%) | 340 (4.6%) |
| 45 to 54 Years | 5,778 (78.6%) | 202 (3.5%) |
| 55 to 59 Years | 2,914 (75.6%) | 125 (4.3%) |
| 60 to 64 Years | 2,508 (64.4%) | 128 (5.1%) |
| 65 to 74 Years | 1,505 (26.3%) | 24 (1.6%) |
| 75 Years and over | 218 (5.9%) | 21 (9.6%) |
| Total | 29,975 (63.4%) | 1,619 (5.4%) |
Employment Status by Educational Attainment in Santee
According to labor force statistics for Santee, 77.7% of individuals (24,962) out of the total population between 25 and 64 years of age (32,126) are in the labor force, with 4.8% or 1,198 of them being unemployed. The group with the highest labor force participation rate are those with the educational attainment of bachelor's degree or higher, with 87.9% or 9,700 individuals in the labor force. Within the labor force, individuals with less than high school education have the highest percentage of unemployment, with 14.6% or 150 of them being unemployed.
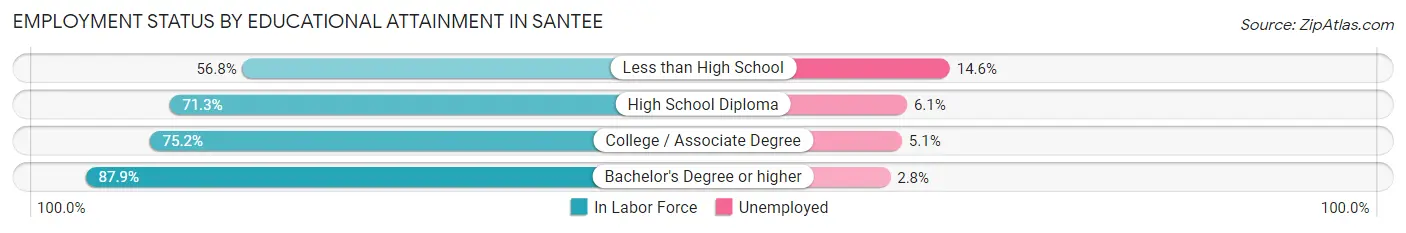
| Educational Attainment | In Labor Force | Unemployed |
| Less than High School | 1,024 (56.8%) | 263 (14.6%) |
| High School Diploma | 4,757 (71.3%) | 407 (6.1%) |
| College / Associate Degree | 9,488 (75.2%) | 643 (5.1%) |
| Bachelor's Degree or higher | 9,700 (87.9%) | 309 (2.8%) |
| Total | 24,962 (77.7%) | 1,542 (4.8%) |
Employment Occupations by Sex in Santee
Management, Business, Science and Arts Occupations
The most common Management, Business, Science and Arts occupations in Santee are Management (3,243 | 11.7%), Community & Social Service (3,016 | 10.8%), Computers, Engineering & Science (2,220 | 8.0%), Business & Financial (2,051 | 7.4%), and Health Diagnosing & Treating (1,704 | 6.1%).
Management, Business, Science and Arts Occupations by Sex
Within the Management, Business, Science and Arts occupations in Santee, the most male-oriented occupations are Architecture & Engineering (86.3%), Computers, Engineering & Science (78.4%), and Computers & Mathematics (76.6%), while the most female-oriented occupations are Health Technologists (84.0%), Legal Services & Support (80.7%), and Health Diagnosing & Treating (75.4%).
| Occupation | Male | Female |
| Management | 1,950 (60.1%) | 1,293 (39.9%) |
| Business & Financial | 1,054 (51.4%) | 997 (48.6%) |
| Computers, Engineering & Science | 1,741 (78.4%) | 479 (21.6%) |
| Computers & Mathematics | 838 (76.6%) | 256 (23.4%) |
| Architecture & Engineering | 756 (86.3%) | 120 (13.7%) |
| Life, Physical & Social Science | 147 (58.8%) | 103 (41.2%) |
| Community & Social Service | 1,028 (34.1%) | 1,988 (65.9%) |
| Education, Arts & Media | 151 (33.3%) | 303 (66.7%) |
| Legal Services & Support | 59 (19.3%) | 246 (80.7%) |
| Education Instruction & Library | 518 (31.0%) | 1,154 (69.0%) |
| Arts, Media & Entertainment | 300 (51.3%) | 285 (48.7%) |
| Health Diagnosing & Treating | 419 (24.6%) | 1,285 (75.4%) |
| Health Technologists | 182 (16.0%) | 957 (84.0%) |
| Total (Category) | 6,192 (50.6%) | 6,042 (49.4%) |
| Total (Overall) | 14,999 (53.9%) | 12,809 (46.1%) |
Services Occupations
The most common Services occupations in Santee are Food Preparation & Serving (1,584 | 5.7%), Healthcare Support (869 | 3.1%), Personal Care & Service (816 | 2.9%), Cleaning & Maintenance (770 | 2.8%), and Security & Protection (681 | 2.5%).
Services Occupations by Sex
Within the Services occupations in Santee, the most male-oriented occupations are Cleaning & Maintenance (79.5%), Law Enforcement (77.0%), and Security & Protection (76.5%), while the most female-oriented occupations are Healthcare Support (86.8%), Personal Care & Service (71.9%), and Food Preparation & Serving (44.9%).
| Occupation | Male | Female |
| Healthcare Support | 115 (13.2%) | 754 (86.8%) |
| Security & Protection | 521 (76.5%) | 160 (23.5%) |
| Firefighting & Prevention | 287 (76.1%) | 90 (23.9%) |
| Law Enforcement | 234 (77.0%) | 70 (23.0%) |
| Food Preparation & Serving | 873 (55.1%) | 711 (44.9%) |
| Cleaning & Maintenance | 612 (79.5%) | 158 (20.5%) |
| Personal Care & Service | 229 (28.1%) | 587 (71.9%) |
| Total (Category) | 2,350 (49.8%) | 2,370 (50.2%) |
| Total (Overall) | 14,999 (53.9%) | 12,809 (46.1%) |
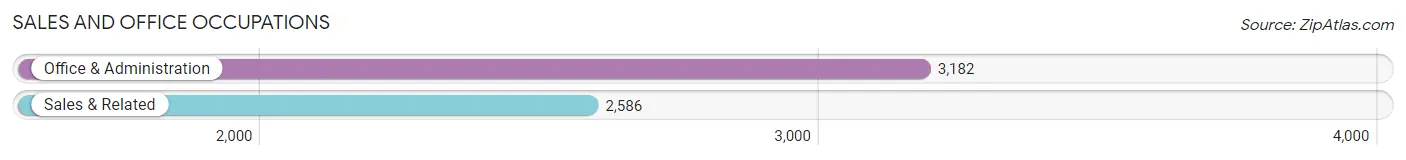
Sales and Office Occupations
The most common Sales and Office occupations in Santee are Office & Administration (3,182 | 11.4%), and Sales & Related (2,586 | 9.3%).
Sales and Office Occupations by Sex
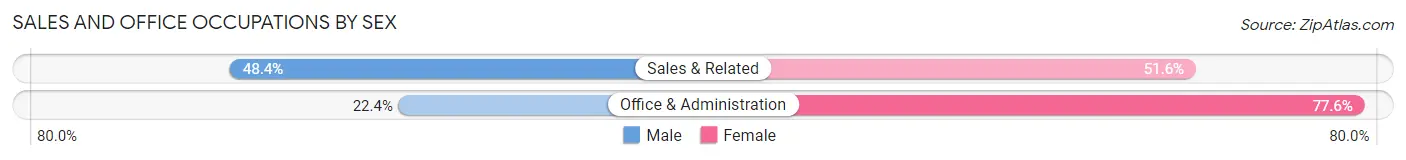
| Occupation | Male | Female |
| Sales & Related | 1,252 (48.4%) | 1,334 (51.6%) |
| Office & Administration | 714 (22.4%) | 2,468 (77.6%) |
| Total (Category) | 1,966 (34.1%) | 3,802 (65.9%) |
| Total (Overall) | 14,999 (53.9%) | 12,809 (46.1%) |
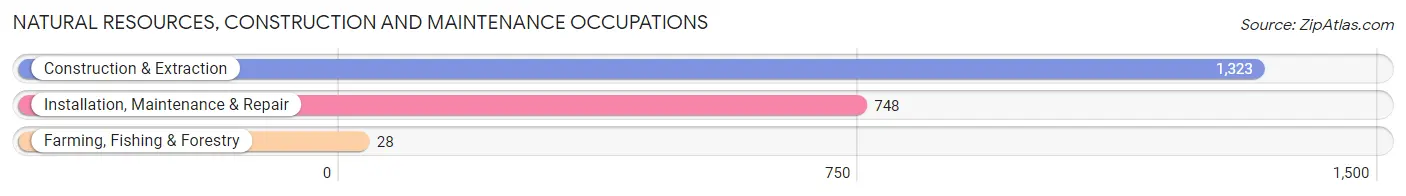
Natural Resources, Construction and Maintenance Occupations
The most common Natural Resources, Construction and Maintenance occupations in Santee are Construction & Extraction (1,323 | 4.8%), Installation, Maintenance & Repair (748 | 2.7%), and Farming, Fishing & Forestry (28 | 0.1%).
Natural Resources, Construction and Maintenance Occupations by Sex
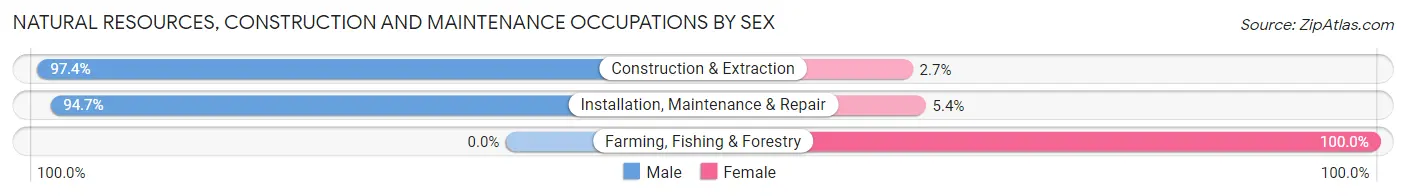
| Occupation | Male | Female |
| Farming, Fishing & Forestry | 0 (0.0%) | 28 (100.0%) |
| Construction & Extraction | 1,288 (97.4%) | 35 (2.6%) |
| Installation, Maintenance & Repair | 708 (94.7%) | 40 (5.3%) |
| Total (Category) | 1,996 (95.1%) | 103 (4.9%) |
| Total (Overall) | 14,999 (53.9%) | 12,809 (46.1%) |
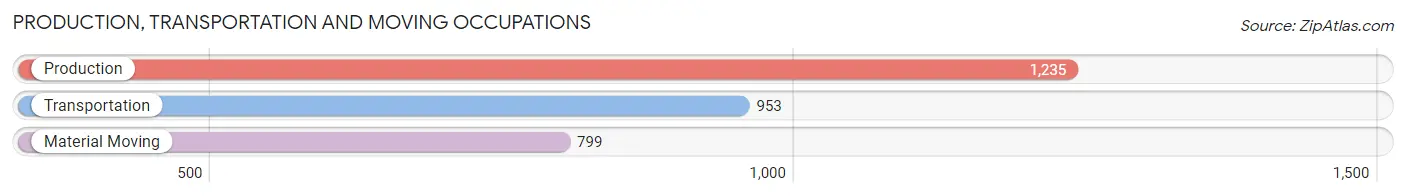
Production, Transportation and Moving Occupations
The most common Production, Transportation and Moving occupations in Santee are Production (1,235 | 4.4%), Transportation (953 | 3.4%), and Material Moving (799 | 2.9%).
Production, Transportation and Moving Occupations by Sex
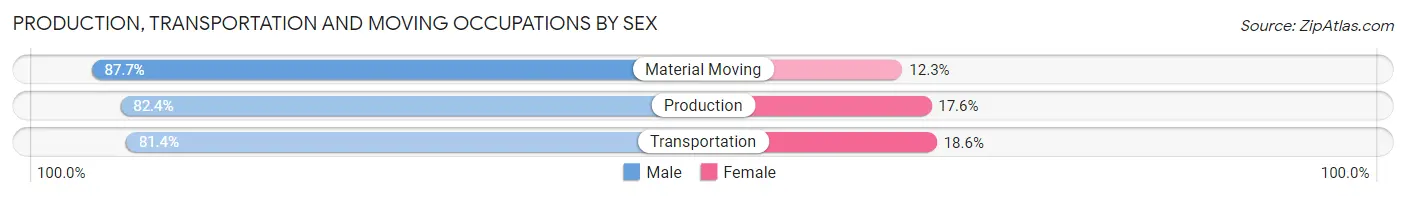
| Occupation | Male | Female |
| Production | 1,018 (82.4%) | 217 (17.6%) |
| Transportation | 776 (81.4%) | 177 (18.6%) |
| Material Moving | 701 (87.7%) | 98 (12.3%) |
| Total (Category) | 2,495 (83.5%) | 492 (16.5%) |
| Total (Overall) | 14,999 (53.9%) | 12,809 (46.1%) |
Employment Industries by Sex in Santee
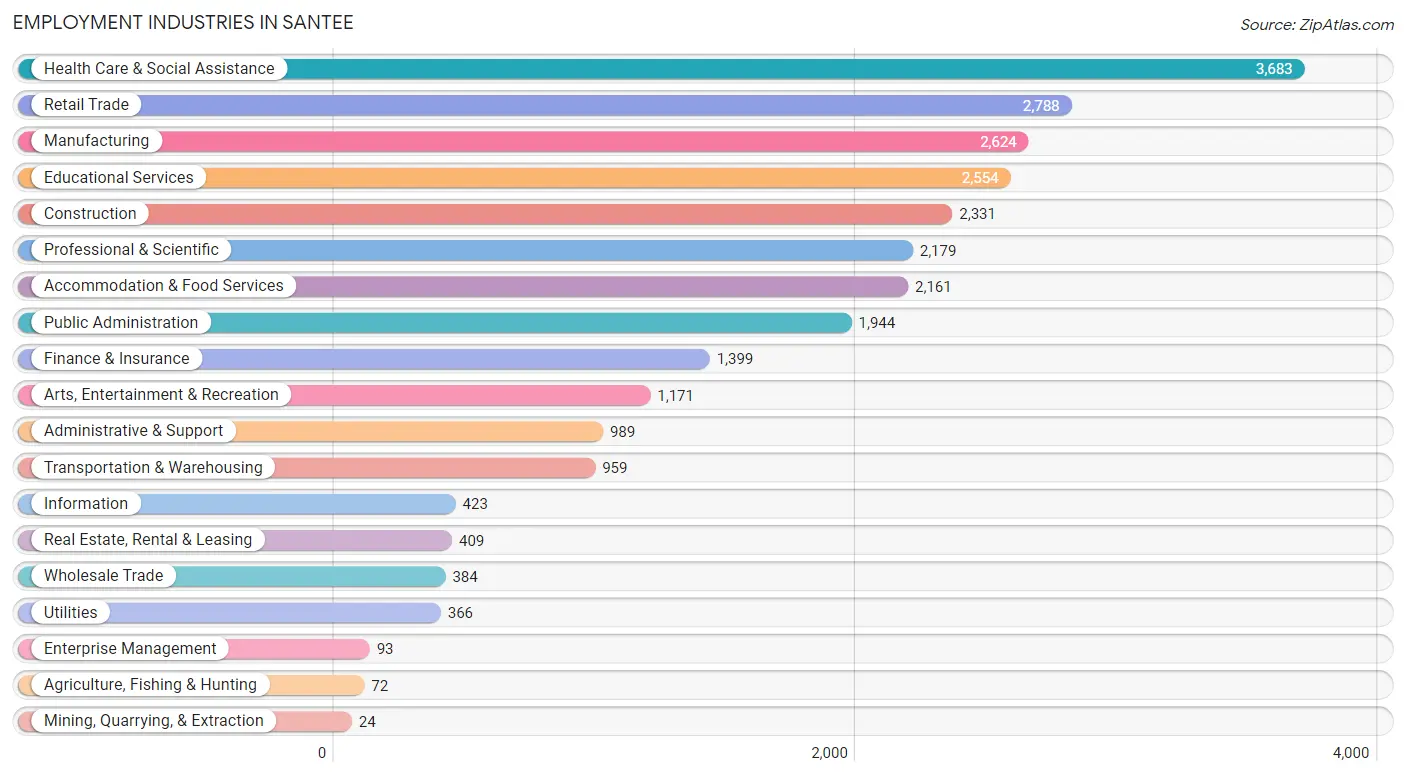
Employment Industries in Santee
The major employment industries in Santee include Health Care & Social Assistance (3,683 | 13.2%), Retail Trade (2,788 | 10.0%), Manufacturing (2,624 | 9.4%), Educational Services (2,554 | 9.2%), and Construction (2,331 | 8.4%).
Employment Industries by Sex in Santee
The Santee industries that see more men than women are Mining, Quarrying, & Extraction (100.0%), Construction (87.8%), and Utilities (84.4%), whereas the industries that tend to have a higher number of women are Health Care & Social Assistance (73.9%), Finance & Insurance (67.3%), and Educational Services (64.4%).
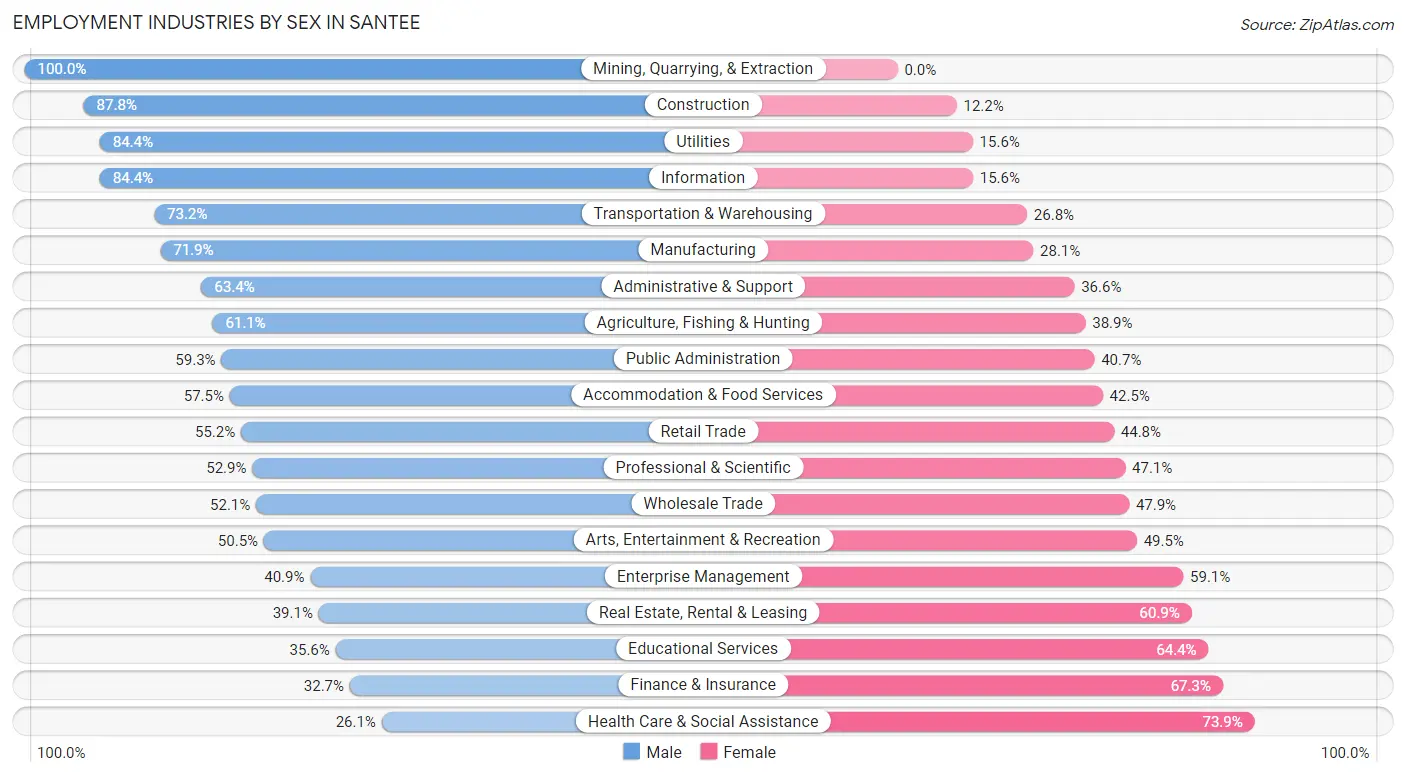
| Industry | Male | Female |
| Agriculture, Fishing & Hunting | 44 (61.1%) | 28 (38.9%) |
| Mining, Quarrying, & Extraction | 24 (100.0%) | 0 (0.0%) |
| Construction | 2,046 (87.8%) | 285 (12.2%) |
| Manufacturing | 1,887 (71.9%) | 737 (28.1%) |
| Wholesale Trade | 200 (52.1%) | 184 (47.9%) |
| Retail Trade | 1,539 (55.2%) | 1,249 (44.8%) |
| Transportation & Warehousing | 702 (73.2%) | 257 (26.8%) |
| Utilities | 309 (84.4%) | 57 (15.6%) |
| Information | 357 (84.4%) | 66 (15.6%) |
| Finance & Insurance | 457 (32.7%) | 942 (67.3%) |
| Real Estate, Rental & Leasing | 160 (39.1%) | 249 (60.9%) |
| Professional & Scientific | 1,152 (52.9%) | 1,027 (47.1%) |
| Enterprise Management | 38 (40.9%) | 55 (59.1%) |
| Administrative & Support | 627 (63.4%) | 362 (36.6%) |
| Educational Services | 910 (35.6%) | 1,644 (64.4%) |
| Health Care & Social Assistance | 961 (26.1%) | 2,722 (73.9%) |
| Arts, Entertainment & Recreation | 591 (50.5%) | 580 (49.5%) |
| Accommodation & Food Services | 1,243 (57.5%) | 918 (42.5%) |
| Public Administration | 1,152 (59.3%) | 792 (40.7%) |
| Total | 14,999 (53.9%) | 12,809 (46.1%) |
Education in Santee
School Enrollment in Santee
The most common levels of schooling among the 14,710 students in Santee are college / undergraduate (3,972 | 27.0%), high school (2,992 | 20.3%), and elementary school (2,811 | 19.1%).
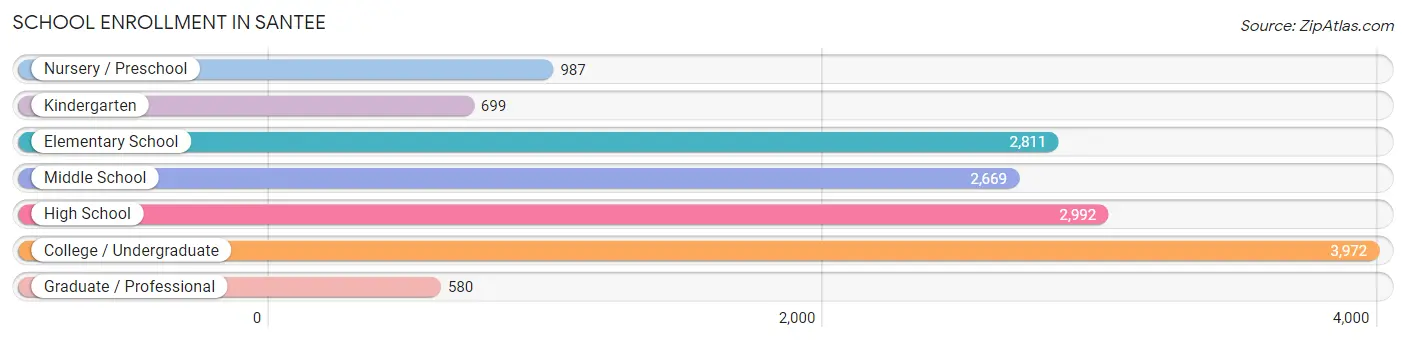
| School Level | # Students | % Students |
| Nursery / Preschool | 987 | 6.7% |
| Kindergarten | 699 | 4.8% |
| Elementary School | 2,811 | 19.1% |
| Middle School | 2,669 | 18.1% |
| High School | 2,992 | 20.3% |
| College / Undergraduate | 3,972 | 27.0% |
| Graduate / Professional | 580 | 3.9% |
| Total | 14,710 | 100.0% |
School Enrollment by Age by Funding Source in Santee
Out of a total of 14,710 students who are enrolled in schools in Santee, 2,471 (16.8%) attend a private institution, while the remaining 12,239 (83.2%) are enrolled in public schools. The age group of 3 to 4 year olds has the highest likelihood of being enrolled in private schools, with 505 (63.9% in the age bracket) enrolled. Conversely, the age group of 18 to 19 year olds has the lowest likelihood of being enrolled in a private school, with 958 (97.8% in the age bracket) attending a public institution.
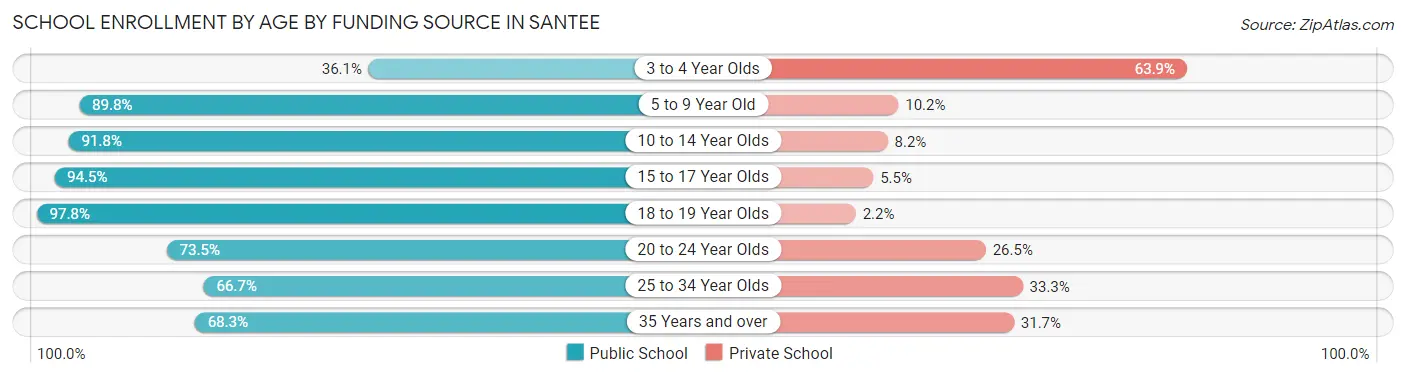
| Age Bracket | Public School | Private School |
| 3 to 4 Year Olds | 285 (36.1%) | 505 (63.9%) |
| 5 to 9 Year Old | 3,099 (89.8%) | 351 (10.2%) |
| 10 to 14 Year Olds | 3,167 (91.8%) | 282 (8.2%) |
| 15 to 17 Year Olds | 1,995 (94.5%) | 116 (5.5%) |
| 18 to 19 Year Olds | 958 (97.8%) | 22 (2.2%) |
| 20 to 24 Year Olds | 1,056 (73.5%) | 380 (26.5%) |
| 25 to 34 Year Olds | 794 (66.7%) | 397 (33.3%) |
| 35 Years and over | 890 (68.3%) | 413 (31.7%) |
| Total | 12,239 (83.2%) | 2,471 (16.8%) |
Educational Attainment by Field of Study in Santee
Business (3,124 | 22.3%), arts & humanities (1,210 | 8.6%), science & technology (1,205 | 8.6%), social sciences (1,097 | 7.8%), and engineering (1,012 | 7.2%) are the most common fields of study among 14,037 individuals in Santee who have obtained a bachelor's degree or higher.
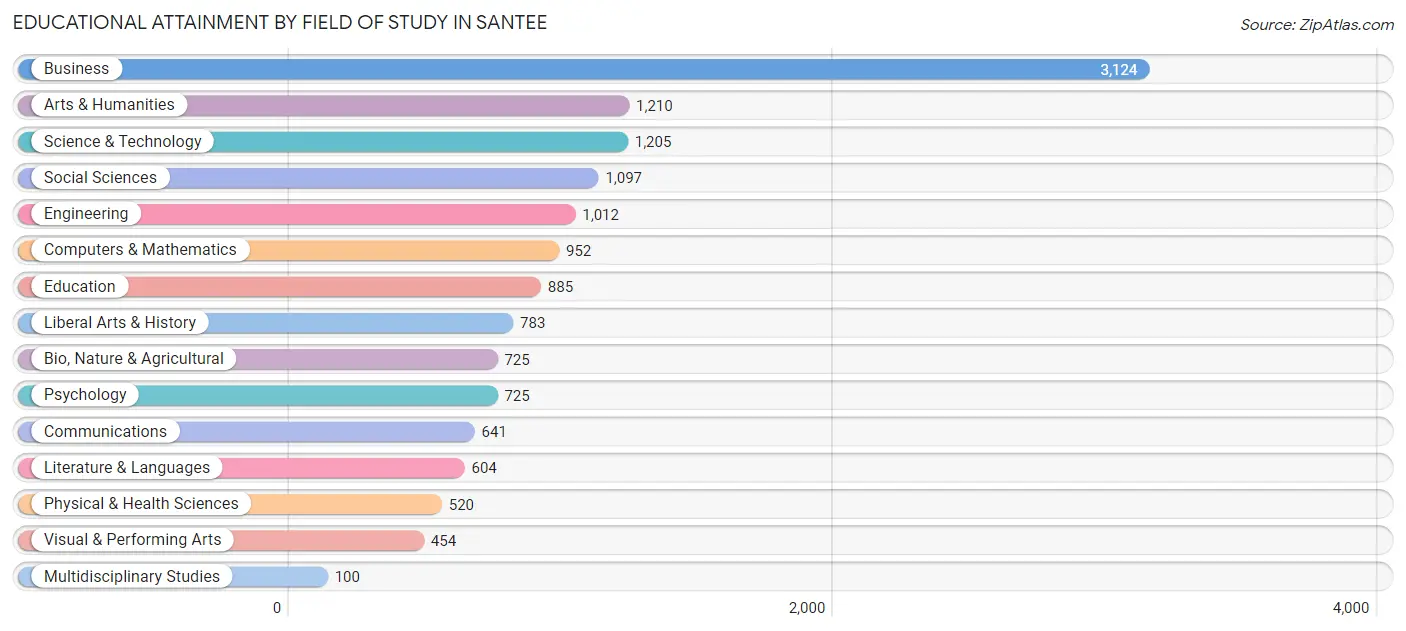
| Field of Study | # Graduates | % Graduates |
| Computers & Mathematics | 952 | 6.8% |
| Bio, Nature & Agricultural | 725 | 5.2% |
| Physical & Health Sciences | 520 | 3.7% |
| Psychology | 725 | 5.2% |
| Social Sciences | 1,097 | 7.8% |
| Engineering | 1,012 | 7.2% |
| Multidisciplinary Studies | 100 | 0.7% |
| Science & Technology | 1,205 | 8.6% |
| Business | 3,124 | 22.3% |
| Education | 885 | 6.3% |
| Literature & Languages | 604 | 4.3% |
| Liberal Arts & History | 783 | 5.6% |
| Visual & Performing Arts | 454 | 3.2% |
| Communications | 641 | 4.6% |
| Arts & Humanities | 1,210 | 8.6% |
| Total | 14,037 | 100.0% |
Transportation & Commute in Santee
Vehicle Availability by Sex in Santee
The most prevalent vehicle ownership categories in Santee are males with 2 vehicles (6,847, accounting for 45.2%) and females with 2 vehicles (5,530, making up 55.5%).
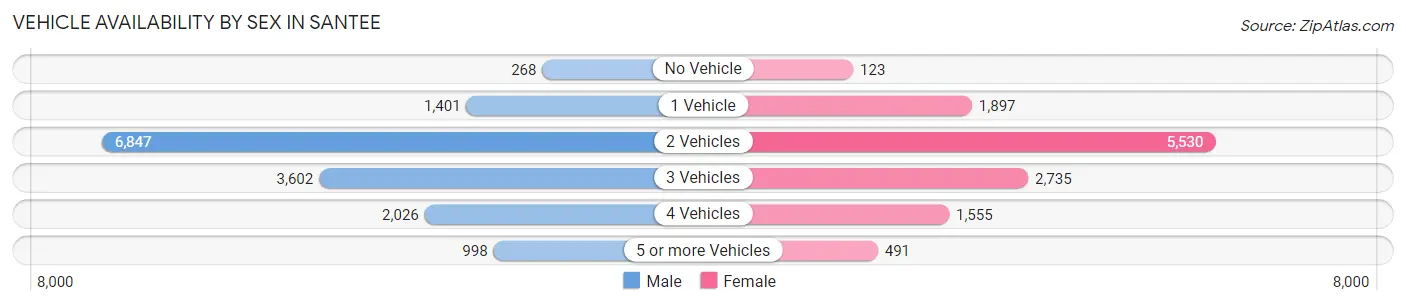
| Vehicles Available | Male | Female |
| No Vehicle | 268 (1.8%) | 123 (1.0%) |
| 1 Vehicle | 1,401 (9.2%) | 1,897 (15.4%) |
| 2 Vehicles | 6,847 (45.2%) | 5,530 (44.9%) |
| 3 Vehicles | 3,602 (23.8%) | 2,735 (22.2%) |
| 4 Vehicles | 2,026 (13.4%) | 1,555 (12.6%) |
| 5 or more Vehicles | 998 (6.6%) | 491 (4.0%) |
| Total | 15,142 (100.0%) | 12,331 (100.0%) |
Commute Time in Santee
The most frequently occuring commute durations in Santee are 30 to 34 minutes (4,839 commuters, 20.0%), 20 to 24 minutes (3,701 commuters, 15.3%), and 10 to 14 minutes (2,602 commuters, 10.7%).
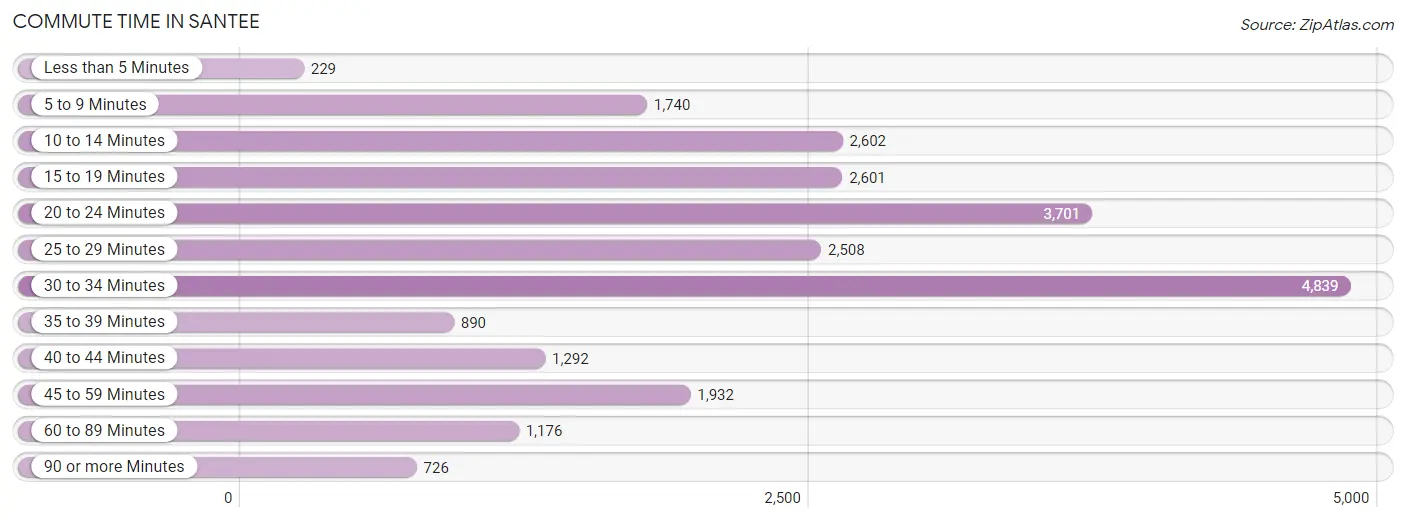
| Commute Time | # Commuters | % Commuters |
| Less than 5 Minutes | 229 | 0.9% |
| 5 to 9 Minutes | 1,740 | 7.2% |
| 10 to 14 Minutes | 2,602 | 10.7% |
| 15 to 19 Minutes | 2,601 | 10.7% |
| 20 to 24 Minutes | 3,701 | 15.3% |
| 25 to 29 Minutes | 2,508 | 10.3% |
| 30 to 34 Minutes | 4,839 | 20.0% |
| 35 to 39 Minutes | 890 | 3.7% |
| 40 to 44 Minutes | 1,292 | 5.3% |
| 45 to 59 Minutes | 1,932 | 8.0% |
| 60 to 89 Minutes | 1,176 | 4.9% |
| 90 or more Minutes | 726 | 3.0% |
Commute Time by Sex in Santee
The most common commute times in Santee are 30 to 34 minutes (2,784 commuters, 20.3%) for males and 30 to 34 minutes (2,055 commuters, 19.5%) for females.
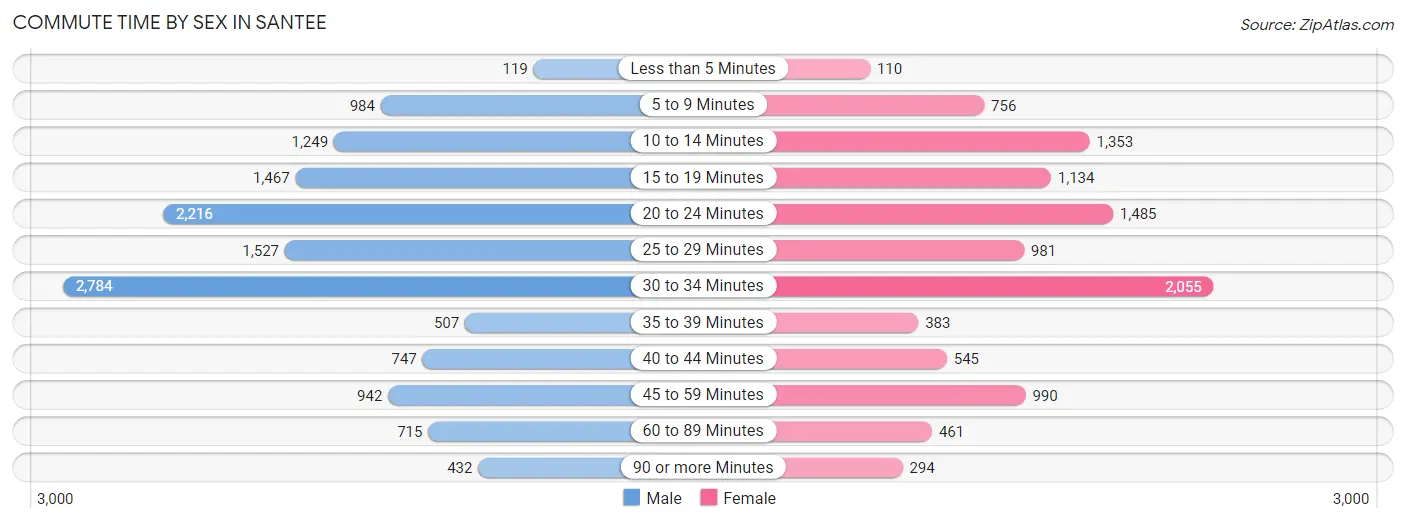
| Commute Time | Male | Female |
| Less than 5 Minutes | 119 (0.9%) | 110 (1.0%) |
| 5 to 9 Minutes | 984 (7.2%) | 756 (7.2%) |
| 10 to 14 Minutes | 1,249 (9.1%) | 1,353 (12.8%) |
| 15 to 19 Minutes | 1,467 (10.7%) | 1,134 (10.7%) |
| 20 to 24 Minutes | 2,216 (16.2%) | 1,485 (14.1%) |
| 25 to 29 Minutes | 1,527 (11.2%) | 981 (9.3%) |
| 30 to 34 Minutes | 2,784 (20.3%) | 2,055 (19.5%) |
| 35 to 39 Minutes | 507 (3.7%) | 383 (3.6%) |
| 40 to 44 Minutes | 747 (5.5%) | 545 (5.2%) |
| 45 to 59 Minutes | 942 (6.9%) | 990 (9.4%) |
| 60 to 89 Minutes | 715 (5.2%) | 461 (4.4%) |
| 90 or more Minutes | 432 (3.2%) | 294 (2.8%) |
Time of Departure to Work by Sex in Santee
The most frequent times of departure to work in Santee are 6:00 AM to 6:29 AM (1,590, 11.6%) for males and 7:30 AM to 7:59 AM (1,425, 13.5%) for females.
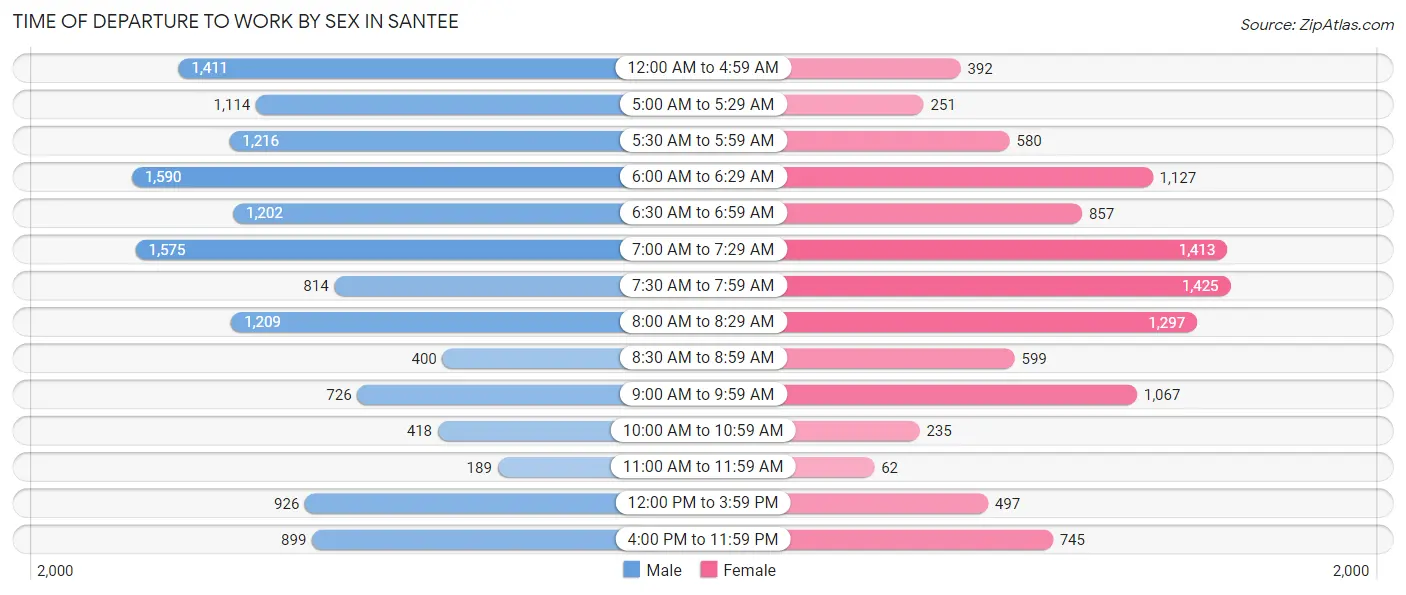
| Time of Departure | Male | Female |
| 12:00 AM to 4:59 AM | 1,411 (10.3%) | 392 (3.7%) |
| 5:00 AM to 5:29 AM | 1,114 (8.1%) | 251 (2.4%) |
| 5:30 AM to 5:59 AM | 1,216 (8.9%) | 580 (5.5%) |
| 6:00 AM to 6:29 AM | 1,590 (11.6%) | 1,127 (10.7%) |
| 6:30 AM to 6:59 AM | 1,202 (8.8%) | 857 (8.1%) |
| 7:00 AM to 7:29 AM | 1,575 (11.5%) | 1,413 (13.4%) |
| 7:30 AM to 7:59 AM | 814 (5.9%) | 1,425 (13.5%) |
| 8:00 AM to 8:29 AM | 1,209 (8.8%) | 1,297 (12.3%) |
| 8:30 AM to 8:59 AM | 400 (2.9%) | 599 (5.7%) |
| 9:00 AM to 9:59 AM | 726 (5.3%) | 1,067 (10.1%) |
| 10:00 AM to 10:59 AM | 418 (3.0%) | 235 (2.2%) |
| 11:00 AM to 11:59 AM | 189 (1.4%) | 62 (0.6%) |
| 12:00 PM to 3:59 PM | 926 (6.8%) | 497 (4.7%) |
| 4:00 PM to 11:59 PM | 899 (6.6%) | 745 (7.1%) |
| Total | 13,689 (100.0%) | 10,547 (100.0%) |
Housing Occupancy in Santee
Occupancy by Ownership in Santee
Of the total 20,642 dwellings in Santee, owner-occupied units account for 15,071 (73.0%), while renter-occupied units make up 5,571 (27.0%).
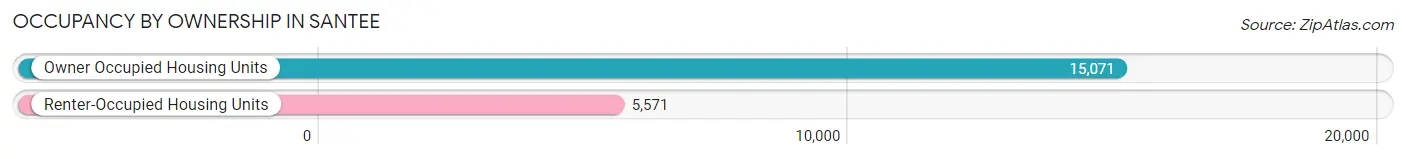
| Occupancy | # Housing Units | % Housing Units |
| Owner Occupied Housing Units | 15,071 | 73.0% |
| Renter-Occupied Housing Units | 5,571 | 27.0% |
| Total Occupied Housing Units | 20,642 | 100.0% |
Occupancy by Household Size in Santee
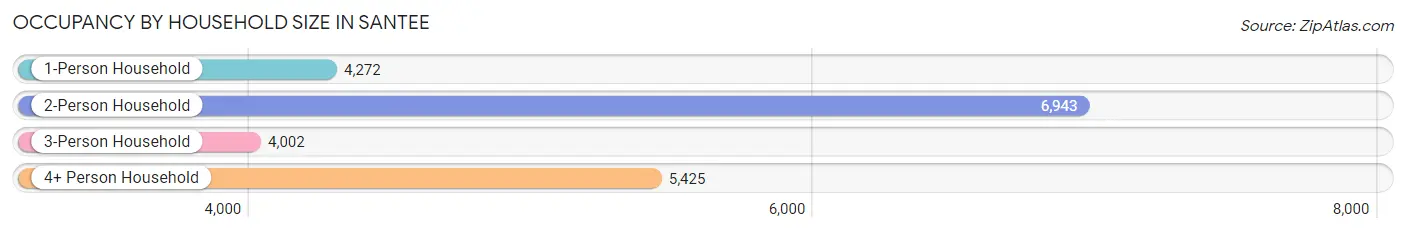
| Household Size | # Housing Units | % Housing Units |
| 1-Person Household | 4,272 | 20.7% |
| 2-Person Household | 6,943 | 33.6% |
| 3-Person Household | 4,002 | 19.4% |
| 4+ Person Household | 5,425 | 26.3% |
| Total Housing Units | 20,642 | 100.0% |
Occupancy by Ownership by Household Size in Santee
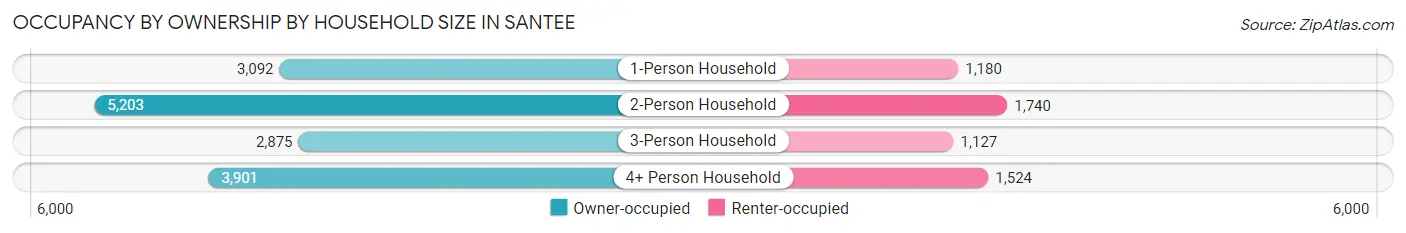
| Household Size | Owner-occupied | Renter-occupied |
| 1-Person Household | 3,092 (72.4%) | 1,180 (27.6%) |
| 2-Person Household | 5,203 (74.9%) | 1,740 (25.1%) |
| 3-Person Household | 2,875 (71.8%) | 1,127 (28.2%) |
| 4+ Person Household | 3,901 (71.9%) | 1,524 (28.1%) |
| Total Housing Units | 15,071 (73.0%) | 5,571 (27.0%) |
Occupancy by Educational Attainment in Santee
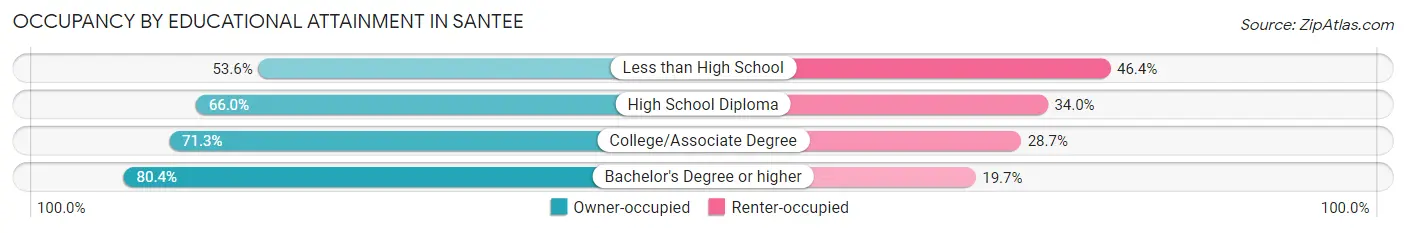
| Household Size | Owner-occupied | Renter-occupied |
| Less than High School | 539 (53.6%) | 466 (46.4%) |
| High School Diploma | 2,267 (66.0%) | 1,166 (34.0%) |
| College/Associate Degree | 5,980 (71.3%) | 2,402 (28.7%) |
| Bachelor's Degree or higher | 6,285 (80.3%) | 1,537 (19.7%) |
Occupancy by Age of Householder in Santee
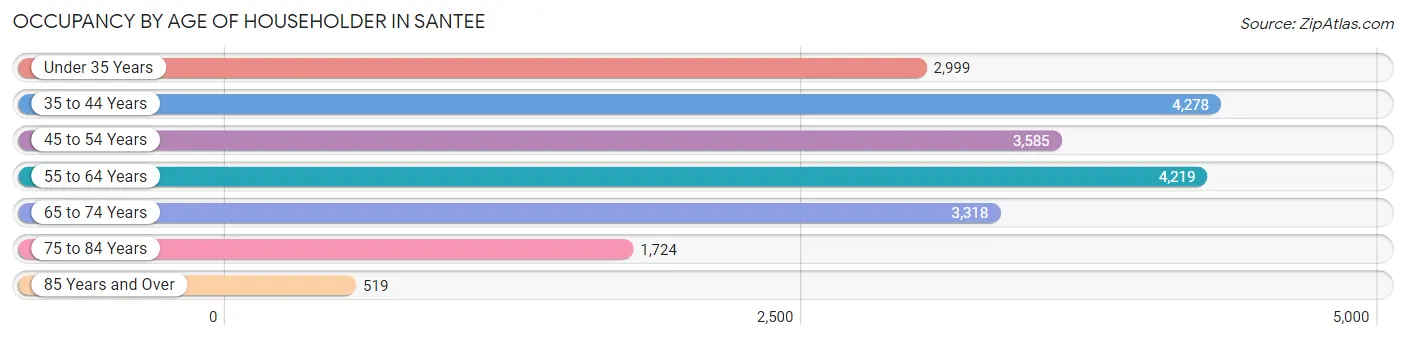
| Age Bracket | # Households | % Households |
| Under 35 Years | 2,999 | 14.5% |
| 35 to 44 Years | 4,278 | 20.7% |
| 45 to 54 Years | 3,585 | 17.4% |
| 55 to 64 Years | 4,219 | 20.4% |
| 65 to 74 Years | 3,318 | 16.1% |
| 75 to 84 Years | 1,724 | 8.4% |
| 85 Years and Over | 519 | 2.5% |
| Total | 20,642 | 100.0% |
Housing Finances in Santee
Median Income by Occupancy in Santee
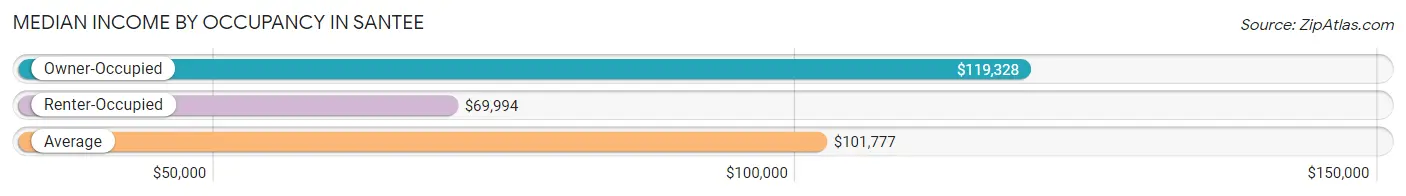
| Occupancy Type | # Households | Median Income |
| Owner-Occupied | 15,071 (73.0%) | $119,328 |
| Renter-Occupied | 5,571 (27.0%) | $69,994 |
| Average | 20,642 (100.0%) | $101,777 |
Occupancy by Householder Income Bracket in Santee
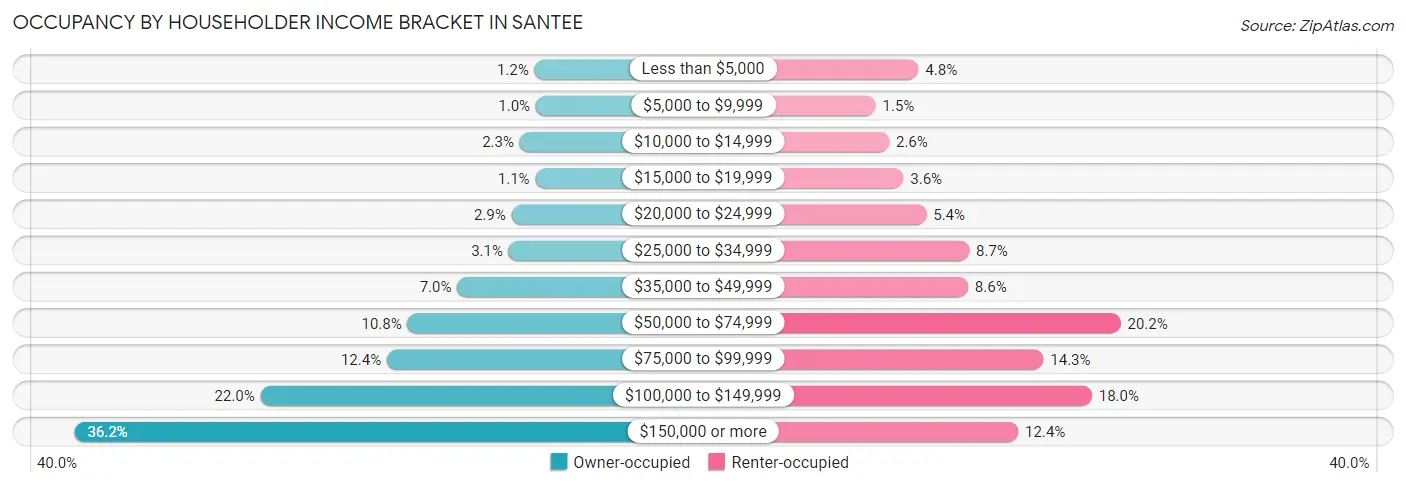
| Income Bracket | Owner-occupied | Renter-occupied |
| Less than $5,000 | 174 (1.1%) | 267 (4.8%) |
| $5,000 to $9,999 | 156 (1.0%) | 85 (1.5%) |
| $10,000 to $14,999 | 342 (2.3%) | 142 (2.5%) |
| $15,000 to $19,999 | 163 (1.1%) | 203 (3.6%) |
| $20,000 to $24,999 | 437 (2.9%) | 300 (5.4%) |
| $25,000 to $34,999 | 468 (3.1%) | 482 (8.6%) |
| $35,000 to $49,999 | 1,060 (7.0%) | 477 (8.6%) |
| $50,000 to $74,999 | 1,631 (10.8%) | 1,125 (20.2%) |
| $75,000 to $99,999 | 1,867 (12.4%) | 797 (14.3%) |
| $100,000 to $149,999 | 3,318 (22.0%) | 1,003 (18.0%) |
| $150,000 or more | 5,455 (36.2%) | 690 (12.4%) |
| Total | 15,071 (100.0%) | 5,571 (100.0%) |
Monthly Housing Cost Tiers in Santee
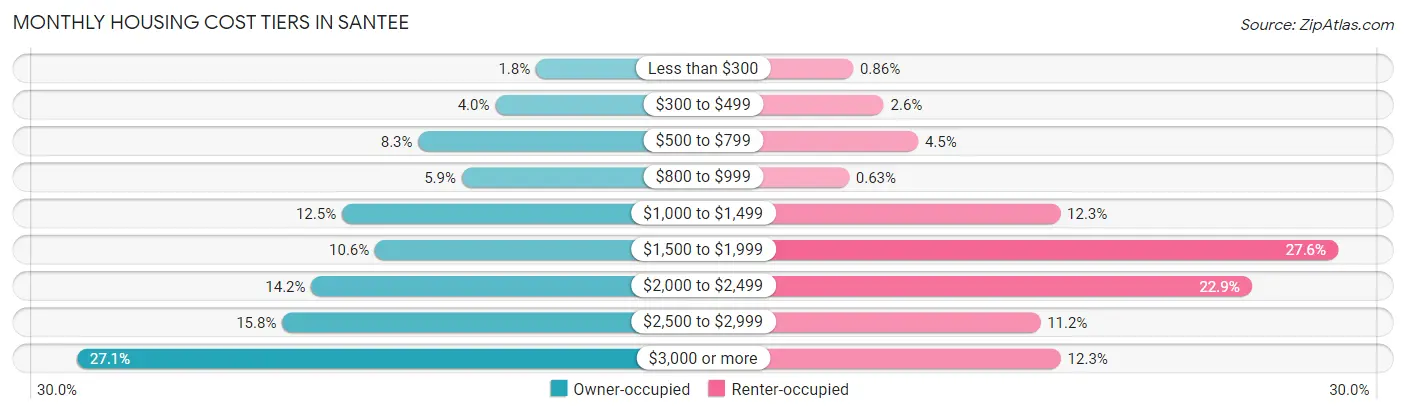
| Monthly Cost | Owner-occupied | Renter-occupied |
| Less than $300 | 264 (1.8%) | 48 (0.9%) |
| $300 to $499 | 603 (4.0%) | 142 (2.5%) |
| $500 to $799 | 1,243 (8.3%) | 248 (4.4%) |
| $800 to $999 | 882 (5.9%) | 35 (0.6%) |
| $1,000 to $1,499 | 1,880 (12.5%) | 685 (12.3%) |
| $1,500 to $1,999 | 1,604 (10.6%) | 1,540 (27.6%) |
| $2,000 to $2,499 | 2,134 (14.2%) | 1,274 (22.9%) |
| $2,500 to $2,999 | 2,376 (15.8%) | 624 (11.2%) |
| $3,000 or more | 4,085 (27.1%) | 687 (12.3%) |
| Total | 15,071 (100.0%) | 5,571 (100.0%) |
Physical Housing Characteristics in Santee
Housing Structures in Santee
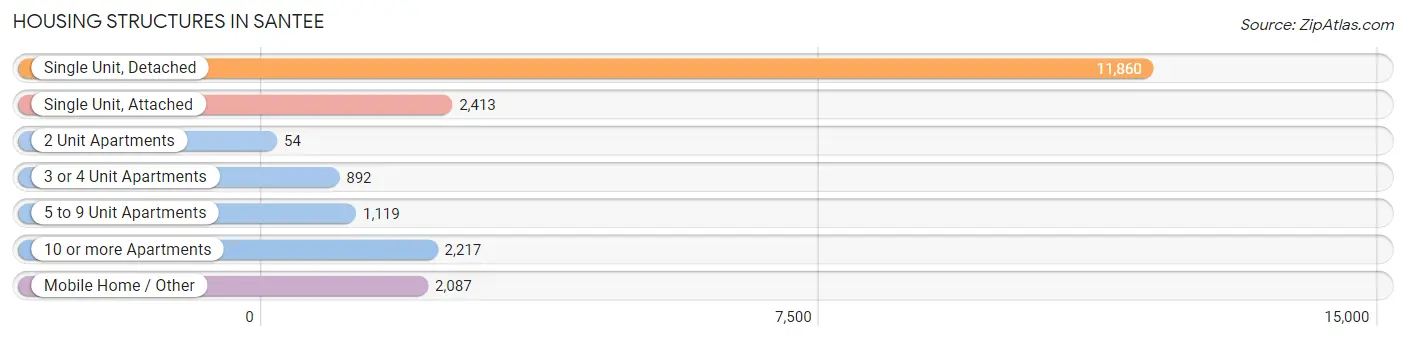
| Structure Type | # Housing Units | % Housing Units |
| Single Unit, Detached | 11,860 | 57.5% |
| Single Unit, Attached | 2,413 | 11.7% |
| 2 Unit Apartments | 54 | 0.3% |
| 3 or 4 Unit Apartments | 892 | 4.3% |
| 5 to 9 Unit Apartments | 1,119 | 5.4% |
| 10 or more Apartments | 2,217 | 10.7% |
| Mobile Home / Other | 2,087 | 10.1% |
| Total | 20,642 | 100.0% |
Housing Structures by Occupancy in Santee
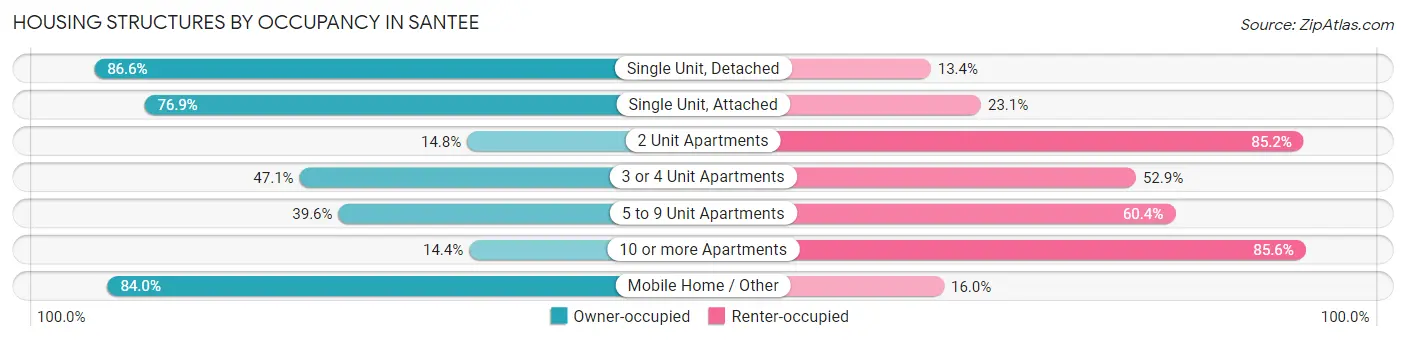
| Structure Type | Owner-occupied | Renter-occupied |
| Single Unit, Detached | 10,270 (86.6%) | 1,590 (13.4%) |
| Single Unit, Attached | 1,856 (76.9%) | 557 (23.1%) |
| 2 Unit Apartments | 8 (14.8%) | 46 (85.2%) |
| 3 or 4 Unit Apartments | 420 (47.1%) | 472 (52.9%) |
| 5 to 9 Unit Apartments | 443 (39.6%) | 676 (60.4%) |
| 10 or more Apartments | 320 (14.4%) | 1,897 (85.6%) |
| Mobile Home / Other | 1,754 (84.0%) | 333 (16.0%) |
| Total | 15,071 (73.0%) | 5,571 (27.0%) |
Housing Structures by Number of Rooms in Santee
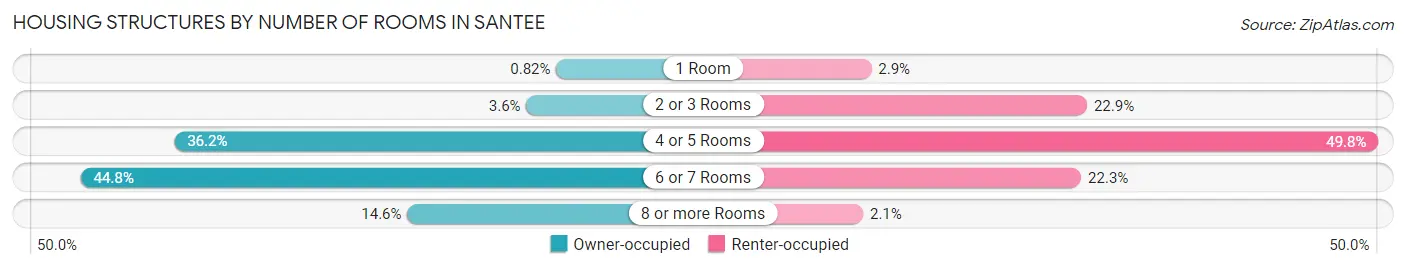
| Number of Rooms | Owner-occupied | Renter-occupied |
| 1 Room | 124 (0.8%) | 162 (2.9%) |
| 2 or 3 Rooms | 541 (3.6%) | 1,273 (22.9%) |
| 4 or 5 Rooms | 5,450 (36.2%) | 2,774 (49.8%) |
| 6 or 7 Rooms | 6,756 (44.8%) | 1,243 (22.3%) |
| 8 or more Rooms | 2,200 (14.6%) | 119 (2.1%) |
| Total | 15,071 (100.0%) | 5,571 (100.0%) |
Housing Structure by Heating Type in Santee
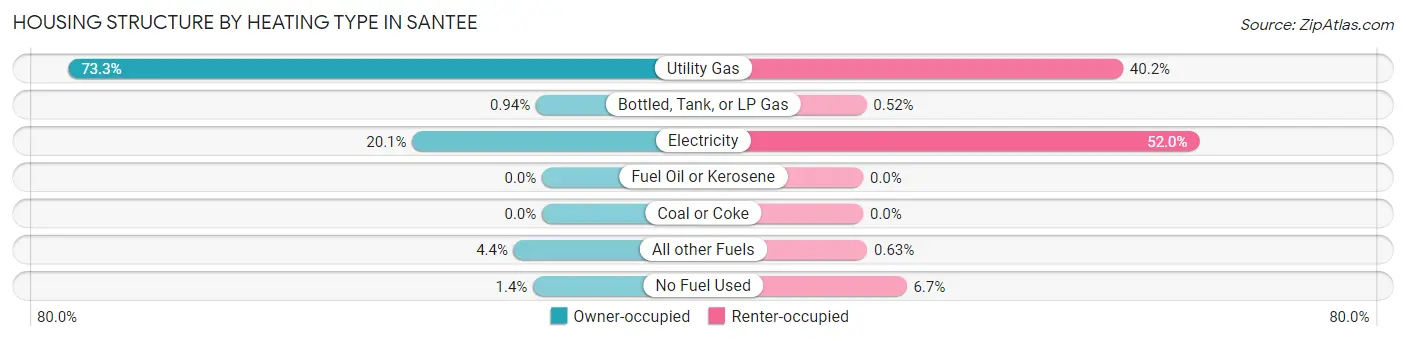
| Heating Type | Owner-occupied | Renter-occupied |
| Utility Gas | 11,040 (73.3%) | 2,238 (40.2%) |
| Bottled, Tank, or LP Gas | 142 (0.9%) | 29 (0.5%) |
| Electricity | 3,023 (20.1%) | 2,895 (52.0%) |
| Fuel Oil or Kerosene | 0 (0.0%) | 0 (0.0%) |
| Coal or Coke | 0 (0.0%) | 0 (0.0%) |
| All other Fuels | 658 (4.4%) | 35 (0.6%) |
| No Fuel Used | 208 (1.4%) | 374 (6.7%) |
| Total | 15,071 (100.0%) | 5,571 (100.0%) |
Household Vehicle Usage in Santee
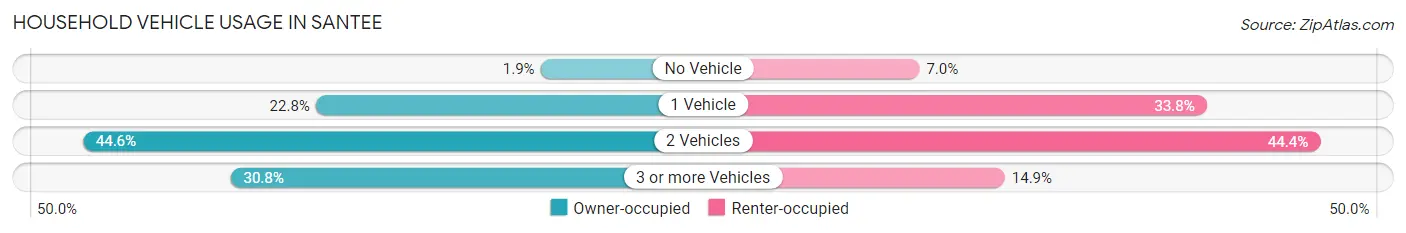
| Vehicles per Household | Owner-occupied | Renter-occupied |
| No Vehicle | 279 (1.8%) | 388 (7.0%) |
| 1 Vehicle | 3,440 (22.8%) | 1,880 (33.8%) |
| 2 Vehicles | 6,715 (44.6%) | 2,471 (44.4%) |
| 3 or more Vehicles | 4,637 (30.8%) | 832 (14.9%) |
| Total | 15,071 (100.0%) | 5,571 (100.0%) |
Real Estate & Mortgages in Santee
Real Estate and Mortgage Overview in Santee
| Characteristic | Without Mortgage | With Mortgage |
| Housing Units | 4,394 | 10,677 |
| Median Property Value | $518,800 | $626,600 |
| Median Household Income | $71,481 | $4,488 |
| Monthly Housing Costs | $844 | $4,051 |
| Real Estate Taxes | $2,533 | $358 |
Property Value by Mortgage Status in Santee
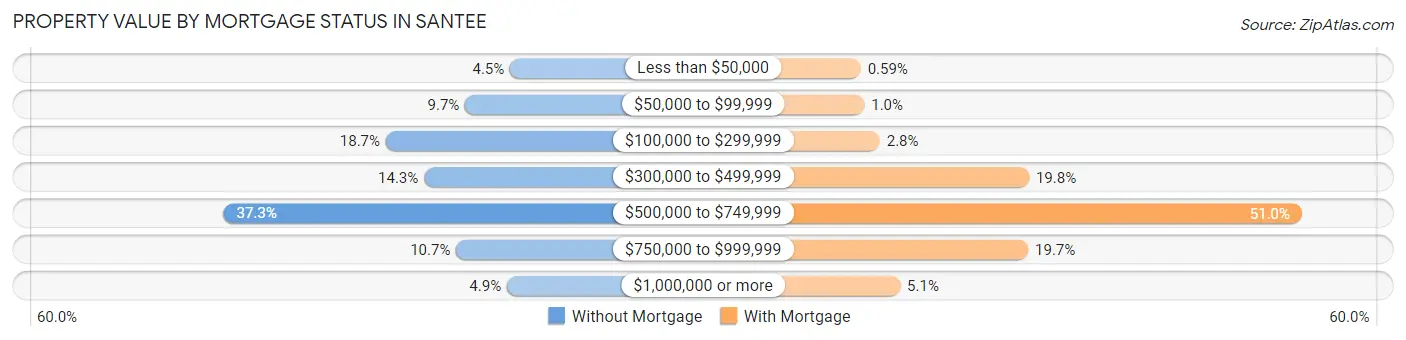
| Property Value | Without Mortgage | With Mortgage |
| Less than $50,000 | 198 (4.5%) | 63 (0.6%) |
| $50,000 to $99,999 | 424 (9.7%) | 107 (1.0%) |
| $100,000 to $299,999 | 822 (18.7%) | 296 (2.8%) |
| $300,000 to $499,999 | 630 (14.3%) | 2,116 (19.8%) |
| $500,000 to $749,999 | 1,637 (37.3%) | 5,445 (51.0%) |
| $750,000 to $999,999 | 469 (10.7%) | 2,105 (19.7%) |
| $1,000,000 or more | 214 (4.9%) | 545 (5.1%) |
| Total | 4,394 (100.0%) | 10,677 (100.0%) |
Household Income by Mortgage Status in Santee
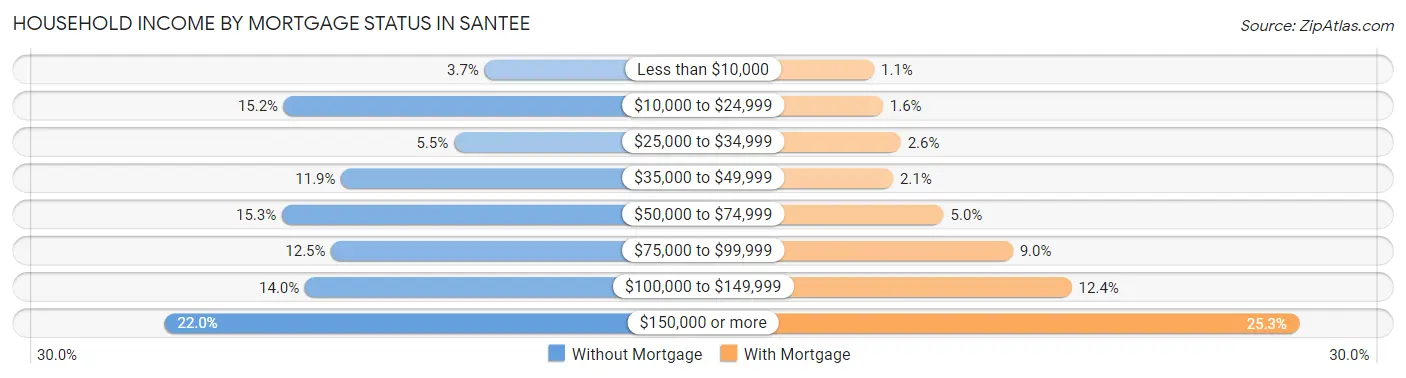
| Household Income | Without Mortgage | With Mortgage |
| Less than $10,000 | 163 (3.7%) | 113 (1.1%) |
| $10,000 to $24,999 | 667 (15.2%) | 167 (1.6%) |
| $25,000 to $34,999 | 240 (5.5%) | 275 (2.6%) |
| $35,000 to $49,999 | 523 (11.9%) | 228 (2.1%) |
| $50,000 to $74,999 | 672 (15.3%) | 537 (5.0%) |
| $75,000 to $99,999 | 548 (12.5%) | 959 (9.0%) |
| $100,000 to $149,999 | 614 (14.0%) | 1,319 (12.3%) |
| $150,000 or more | 967 (22.0%) | 2,704 (25.3%) |
| Total | 4,394 (100.0%) | 10,677 (100.0%) |
Property Value to Household Income Ratio in Santee
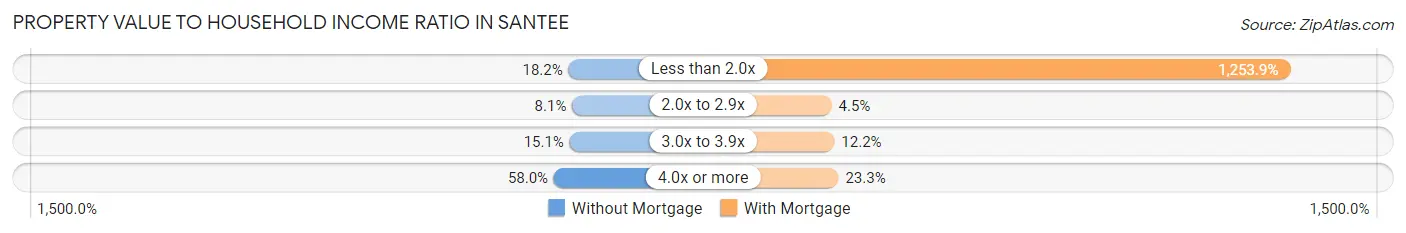
| Value-to-Income Ratio | Without Mortgage | With Mortgage |
| Less than 2.0x | 801 (18.2%) | 133,876 (1,253.9%) |
| 2.0x to 2.9x | 357 (8.1%) | 482 (4.5%) |
| 3.0x to 3.9x | 663 (15.1%) | 1,303 (12.2%) |
| 4.0x or more | 2,548 (58.0%) | 2,486 (23.3%) |
| Total | 4,394 (100.0%) | 10,677 (100.0%) |
Real Estate Taxes by Mortgage Status in Santee
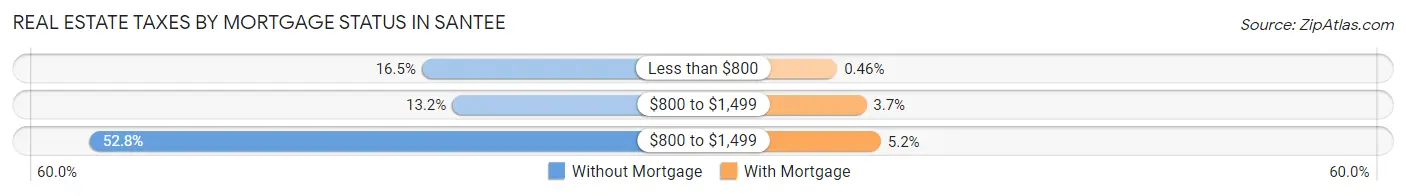
| Property Taxes | Without Mortgage | With Mortgage |
| Less than $800 | 724 (16.5%) | 49 (0.5%) |
| $800 to $1,499 | 578 (13.2%) | 390 (3.6%) |
| $800 to $1,499 | 2,322 (52.8%) | 560 (5.2%) |
| Total | 4,394 (100.0%) | 10,677 (100.0%) |
Health & Disability in Santee
Health Insurance Coverage by Age in Santee
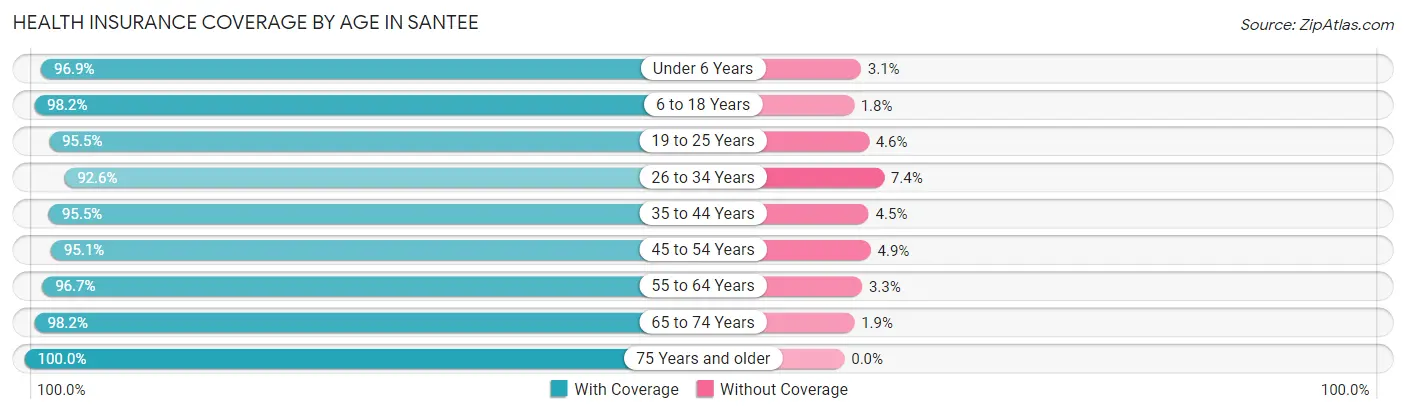
| Age Bracket | With Coverage | Without Coverage |
| Under 6 Years | 4,886 (96.9%) | 156 (3.1%) |
| 6 to 18 Years | 9,155 (98.2%) | 164 (1.8%) |
| 19 to 25 Years | 3,754 (95.5%) | 179 (4.5%) |
| 26 to 34 Years | 6,783 (92.6%) | 541 (7.4%) |
| 35 to 44 Years | 7,733 (95.5%) | 368 (4.5%) |
| 45 to 54 Years | 6,850 (95.1%) | 354 (4.9%) |
| 55 to 64 Years | 7,356 (96.7%) | 250 (3.3%) |
| 65 to 74 Years | 5,454 (98.2%) | 103 (1.8%) |
| 75 Years and older | 3,514 (100.0%) | 0 (0.0%) |
| Total | 55,485 (96.3%) | 2,115 (3.7%) |
Health Insurance Coverage by Citizenship Status in Santee
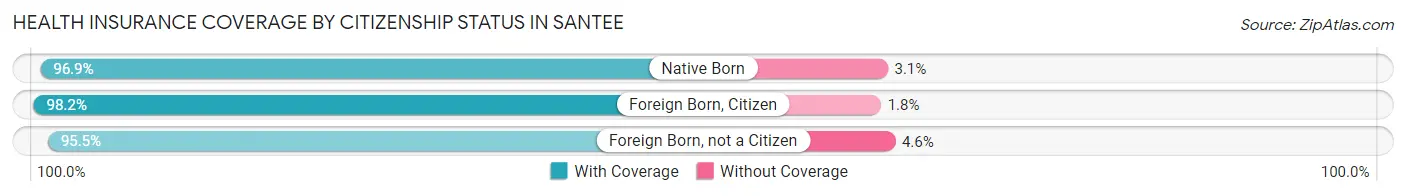
| Citizenship Status | With Coverage | Without Coverage |
| Native Born | 4,886 (96.9%) | 156 (3.1%) |
| Foreign Born, Citizen | 9,155 (98.2%) | 164 (1.8%) |
| Foreign Born, not a Citizen | 3,754 (95.5%) | 179 (4.5%) |
Health Insurance Coverage by Household Income in Santee
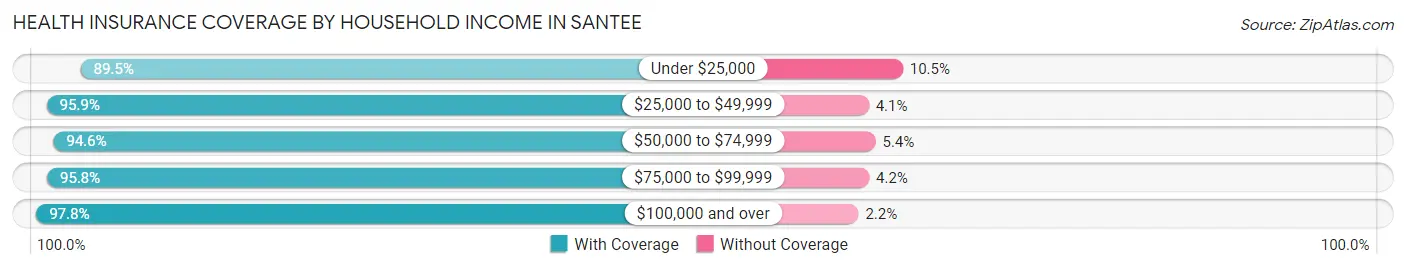
| Household Income | With Coverage | Without Coverage |
| Under $25,000 | 3,847 (89.5%) | 451 (10.5%) |
| $25,000 to $49,999 | 5,409 (95.9%) | 232 (4.1%) |
| $50,000 to $74,999 | 6,405 (94.6%) | 364 (5.4%) |
| $75,000 to $99,999 | 7,274 (95.8%) | 317 (4.2%) |
| $100,000 and over | 32,351 (97.8%) | 725 (2.2%) |
Public vs Private Health Insurance Coverage by Age in Santee
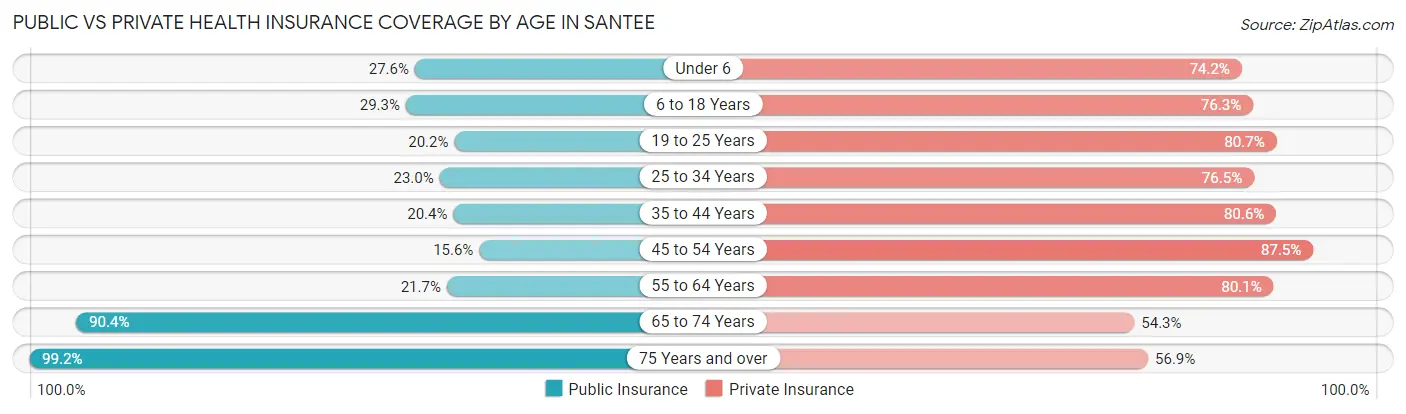
| Age Bracket | Public Insurance | Private Insurance |
| Under 6 | 1,390 (27.6%) | 3,742 (74.2%) |
| 6 to 18 Years | 2,726 (29.2%) | 7,114 (76.3%) |
| 19 to 25 Years | 796 (20.2%) | 3,173 (80.7%) |
| 25 to 34 Years | 1,683 (23.0%) | 5,603 (76.5%) |
| 35 to 44 Years | 1,655 (20.4%) | 6,531 (80.6%) |
| 45 to 54 Years | 1,125 (15.6%) | 6,302 (87.5%) |
| 55 to 64 Years | 1,647 (21.6%) | 6,095 (80.1%) |
| 65 to 74 Years | 5,025 (90.4%) | 3,018 (54.3%) |
| 75 Years and over | 3,484 (99.2%) | 1,998 (56.9%) |
| Total | 19,531 (33.9%) | 43,576 (75.6%) |
Disability Status by Sex by Age in Santee
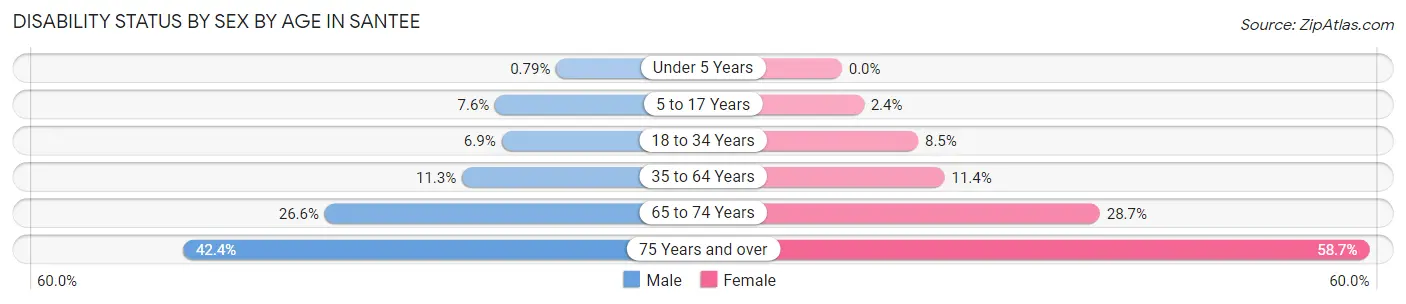
| Age Bracket | Male | Female |
| Under 5 Years | 20 (0.8%) | 0 (0.0%) |
| 5 to 17 Years | 376 (7.6%) | 104 (2.4%) |
| 18 to 34 Years | 436 (6.9%) | 484 (8.5%) |
| 35 to 64 Years | 1,266 (11.3%) | 1,338 (11.4%) |
| 65 to 74 Years | 659 (26.6%) | 884 (28.7%) |
| 75 Years and over | 621 (42.4%) | 1,203 (58.7%) |
Disability Class by Sex by Age in Santee
Disability Class: Hearing Difficulty
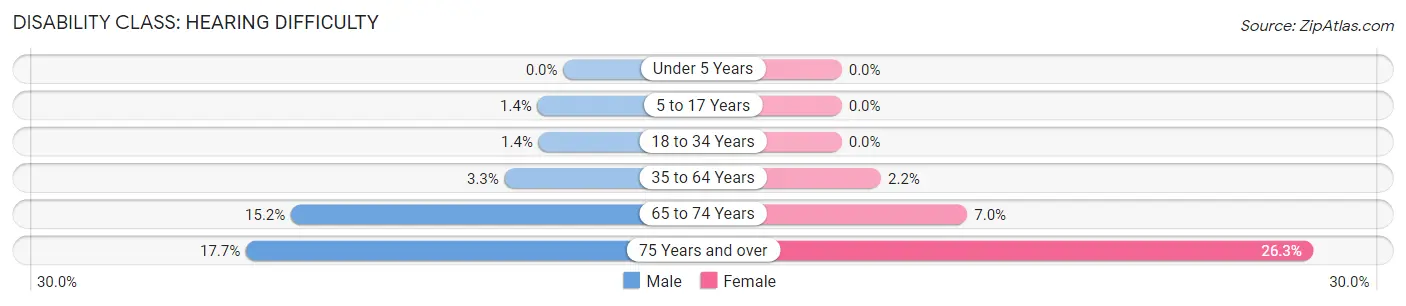
| Age Bracket | Male | Female |
| Under 5 Years | 0 (0.0%) | 0 (0.0%) |
| 5 to 17 Years | 71 (1.4%) | 0 (0.0%) |
| 18 to 34 Years | 87 (1.4%) | 0 (0.0%) |
| 35 to 64 Years | 367 (3.3%) | 256 (2.2%) |
| 65 to 74 Years | 376 (15.2%) | 215 (7.0%) |
| 75 Years and over | 259 (17.7%) | 538 (26.3%) |
Disability Class: Vision Difficulty
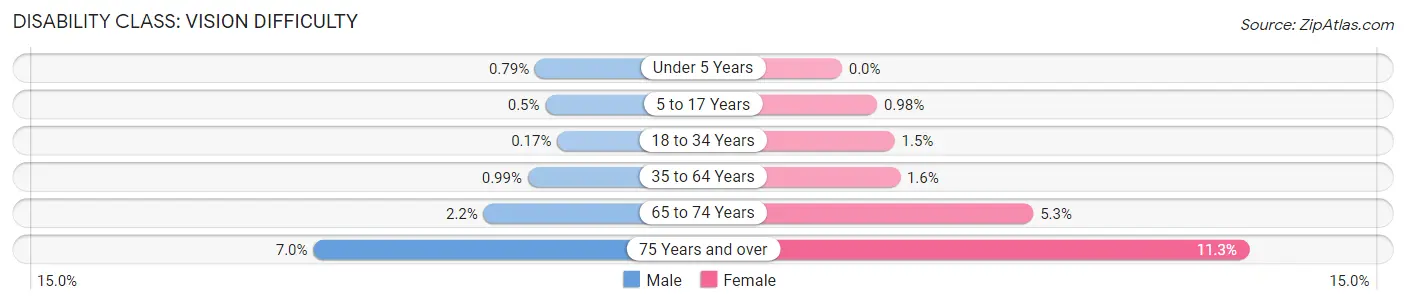
| Age Bracket | Male | Female |
| Under 5 Years | 20 (0.8%) | 0 (0.0%) |
| 5 to 17 Years | 25 (0.5%) | 42 (1.0%) |
| 18 to 34 Years | 11 (0.2%) | 84 (1.5%) |
| 35 to 64 Years | 111 (1.0%) | 189 (1.6%) |
| 65 to 74 Years | 55 (2.2%) | 164 (5.3%) |
| 75 Years and over | 102 (7.0%) | 232 (11.3%) |
Disability Class: Cognitive Difficulty
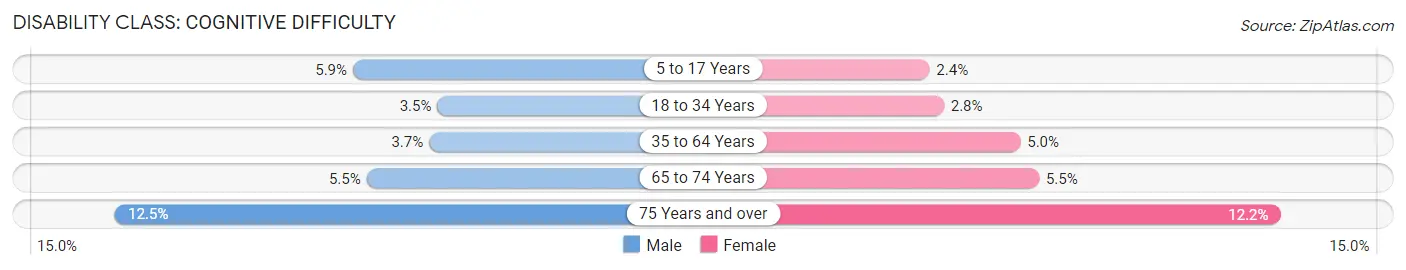
| Age Bracket | Male | Female |
| 5 to 17 Years | 290 (5.9%) | 104 (2.4%) |
| 18 to 34 Years | 222 (3.5%) | 162 (2.8%) |
| 35 to 64 Years | 420 (3.7%) | 581 (5.0%) |
| 65 to 74 Years | 136 (5.5%) | 169 (5.5%) |
| 75 Years and over | 183 (12.5%) | 250 (12.2%) |
Disability Class: Ambulatory Difficulty
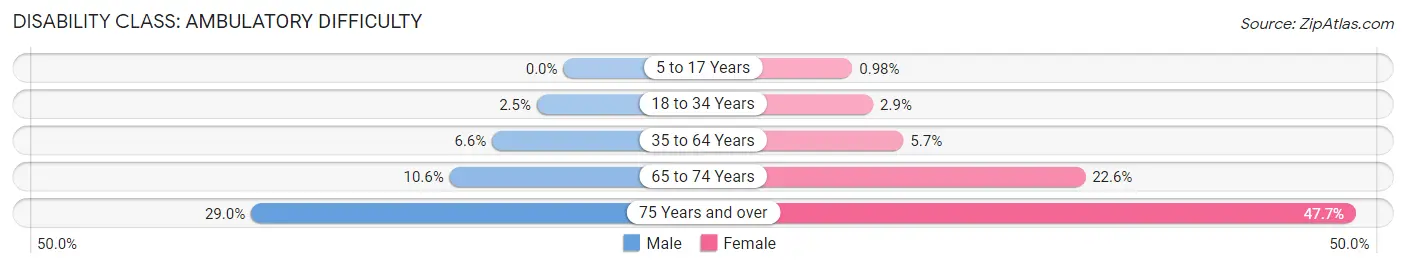
| Age Bracket | Male | Female |
| 5 to 17 Years | 0 (0.0%) | 42 (1.0%) |
| 18 to 34 Years | 156 (2.5%) | 166 (2.9%) |
| 35 to 64 Years | 742 (6.6%) | 669 (5.7%) |
| 65 to 74 Years | 262 (10.6%) | 695 (22.6%) |
| 75 Years and over | 425 (29.0%) | 977 (47.7%) |
Disability Class: Self-Care Difficulty
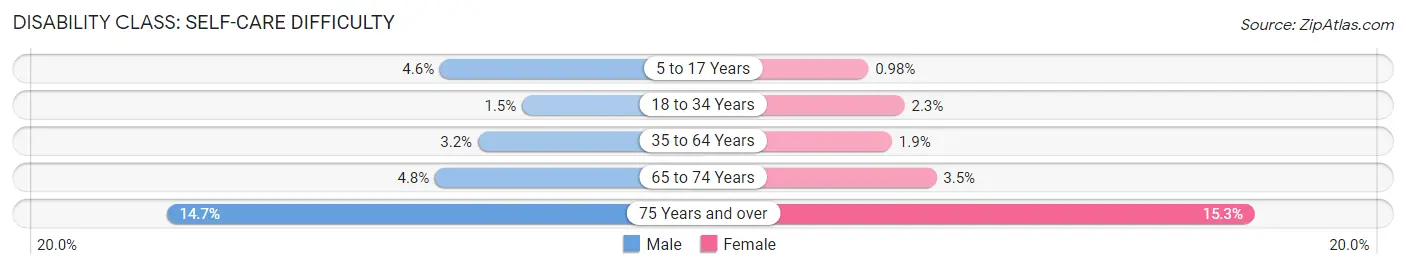
| Age Bracket | Male | Female |
| 5 to 17 Years | 227 (4.6%) | 42 (1.0%) |
| 18 to 34 Years | 97 (1.5%) | 133 (2.3%) |
| 35 to 64 Years | 356 (3.2%) | 218 (1.9%) |
| 65 to 74 Years | 118 (4.8%) | 108 (3.5%) |
| 75 Years and over | 216 (14.7%) | 314 (15.3%) |
Technology Access in Santee
Computing Device Access in Santee
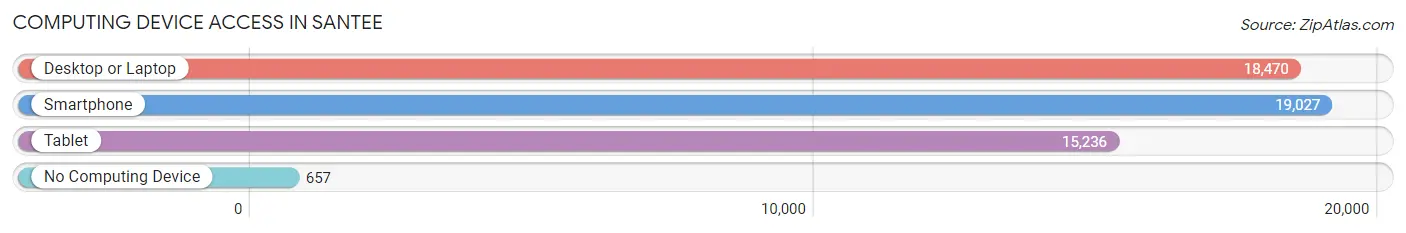
| Device Type | # Households | % Households |
| Desktop or Laptop | 18,470 | 89.5% |
| Smartphone | 19,027 | 92.2% |
| Tablet | 15,236 | 73.8% |
| No Computing Device | 657 | 3.2% |
| Total | 20,642 | 100.0% |
Internet Access in Santee
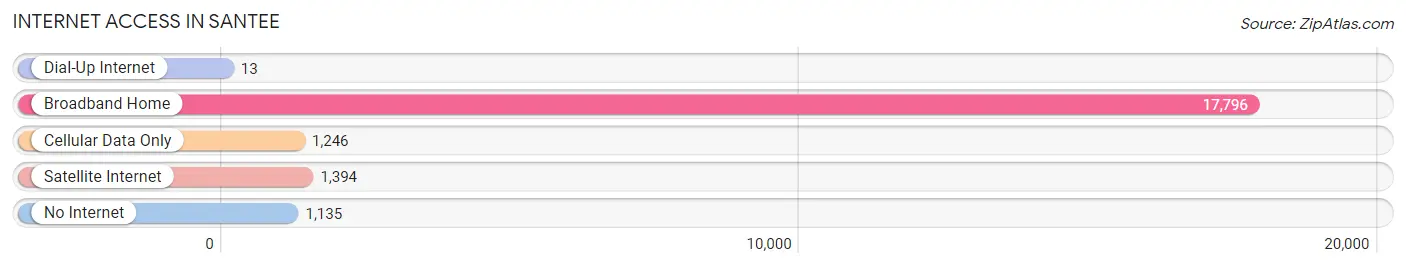
| Internet Type | # Households | % Households |
| Dial-Up Internet | 13 | 0.1% |
| Broadband Home | 17,796 | 86.2% |
| Cellular Data Only | 1,246 | 6.0% |
| Satellite Internet | 1,394 | 6.8% |
| No Internet | 1,135 | 5.5% |
| Total | 20,642 | 100.0% |
Santee Summary
Santee is a city located in San Diego County, California, United States. It is located in the East County region of San Diego County, just east of the city of San Diego. Santee is a suburban city with a population of 54,846 as of the 2010 census. It is located in the foothills of the Cuyamaca Mountains and is bordered by the cities of El Cajon, La Mesa, and San Diego.
History
The area of Santee was originally inhabited by the Kumeyaay people, who were hunter-gatherers. The first Europeans to settle in the area were Spanish missionaries, who established the Mission San Diego de Alcalá in 1769. The area was later part of the Rancho Mission de San Diego, which was granted to Juan Maria Osuna in 1845. The area was then subdivided into smaller ranches, and in 1868, the area was purchased by George A. Cowles. Cowles established the town of Santee in 1871, and it was incorporated as a city in 1980.
Geography
Santee is located at 32°51'17" North, 116°59'19" West (32.854722, -116.988611). It is situated in the foothills of the Cuyamaca Mountains, and is bordered by the cities of El Cajon, La Mesa, and San Diego. The city has a total area of 19.4 square miles, of which 19.2 square miles is land and 0.2 square miles is water.
Economy
Santee is a suburban city with a diverse economy. The city is home to several large employers, including the Sycuan Casino, the Santee School District, and the Santee Cooperatives. The city is also home to several small businesses, including retail stores, restaurants, and professional services.
Demographics
As of the 2010 census, there were 54,846 people, 19,717 households, and 14,845 families residing in the city. The population density was 2,837.2 people per square mile. The racial makeup of the city was 68.2% White, 8.3% African American, 0.7% Native American, 11.2% Asian, 0.5% Pacific Islander, 8.2% from other races, and 3.1% from two or more races. Hispanic or Latino of any race were 20.2% of the population.
The median income for a household in the city was $63,845, and the median income for a family was $71,945. The per capita income for the city was $27,845. About 6.2% of families and 8.3% of the population were below the poverty line, including 11.2% of those under age 18 and 5.2% of those age 65 or over.
Common Questions
What is Per Capita Income in Santee?
Per Capita income in Santee is $42,749.
What is the Median Family Income in Santee?
Median Family Income in Santee is $112,029.
What is the Median Household income in Santee?
Median Household Income in Santee is $101,777.
What is Income or Wage Gap in Santee?
Income or Wage Gap in Santee is 23.1%.
Women in Santee earn 76.9 cents for every dollar earned by a man.
What is Inequality or Gini Index in Santee?
Inequality or Gini Index in Santee is 0.40.
What is the Total Population of Santee?
Total Population of Santee is 59,497.
What is the Total Male Population of Santee?
Total Male Population of Santee is 29,868.
What is the Total Female Population of Santee?
Total Female Population of Santee is 29,629.
What is the Ratio of Males per 100 Females in Santee?
There are 100.81 Males per 100 Females in Santee.
What is the Ratio of Females per 100 Males in Santee?
There are 99.20 Females per 100 Males in Santee.
What is the Median Population Age in Santee?
Median Population Age in Santee is 39.0 Years.
What is the Average Family Size in Santee
Average Family Size in Santee is 3.3 People.
What is the Average Household Size in Santee
Average Household Size in Santee is 2.8 People.
How Large is the Labor Force in Santee?
There are 29,975 People in the Labor Forcein in Santee.
What is the Percentage of People in the Labor Force in Santee?
63.4% of People are in the Labor Force in Santee.
What is the Unemployment Rate in Santee?
Unemployment Rate in Santee is 5.4%.