Rowland Heights, CA Map & Demographics
Rowland Heights Map
Rowland Heights Overview
$36,848
PER CAPITA INCOME
$91,198
AVG FAMILY INCOME
$85,842
AVG HOUSEHOLD INCOME
20.7%
WAGE / INCOME GAP [ % ]
79.3¢/ $1
WAGE / INCOME GAP [ $ ]
$10,415
FAMILY INCOME DEFICIT
0.45
INEQUALITY / GINI INDEX
47,209
TOTAL POPULATION
23,335
MALE POPULATION
23,874
FEMALE POPULATION
97.74
MALES / 100 FEMALES
102.31
FEMALES / 100 MALES
44.0
MEDIAN AGE
3.4
AVG FAMILY SIZE
3.2
AVG HOUSEHOLD SIZE
24,757
LABOR FORCE [ PEOPLE ]
62.1%
PERCENT IN LABOR FORCE
6.3%
UNEMPLOYMENT RATE
Rowland Heights Zip Codes
Rowland Heights Area Codes
Income in Rowland Heights
Income Overview in Rowland Heights
Per Capita Income in Rowland Heights is $36,848, while median incomes of families and households are $91,198 and $85,842 respectively.
| Characteristic | Number | Measure |
| Per Capita Income | 47,209 | $36,848 |
| Median Family Income | 12,079 | $91,198 |
| Mean Family Income | 12,079 | $119,146 |
| Median Household Income | 14,822 | $85,842 |
| Mean Household Income | 14,822 | $113,161 |
| Income Deficit | 12,079 | $10,415 |
| Wage / Income Gap (%) | 47,209 | 20.66% |
| Wage / Income Gap ($) | 47,209 | 79.34¢ per $1 |
| Gini / Inequality Index | 47,209 | 0.45 |
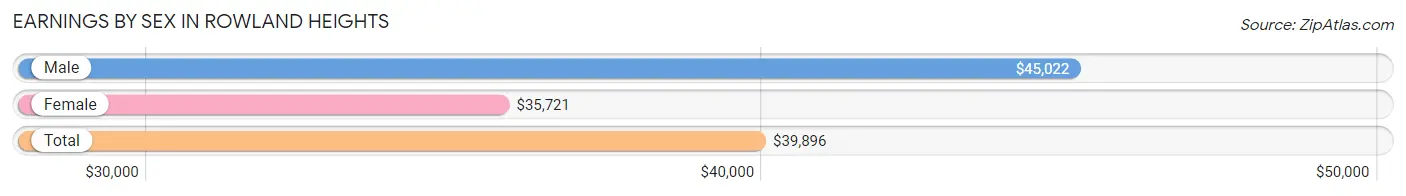
Earnings by Sex in Rowland Heights
Average Earnings in Rowland Heights are $39,896, $45,022 for men and $35,721 for women, a difference of 20.7%.
| Sex | Number | Average Earnings |
| Male | 13,345 (53.9%) | $45,022 |
| Female | 11,390 (46.1%) | $35,721 |
| Total | 24,735 (100.0%) | $39,896 |
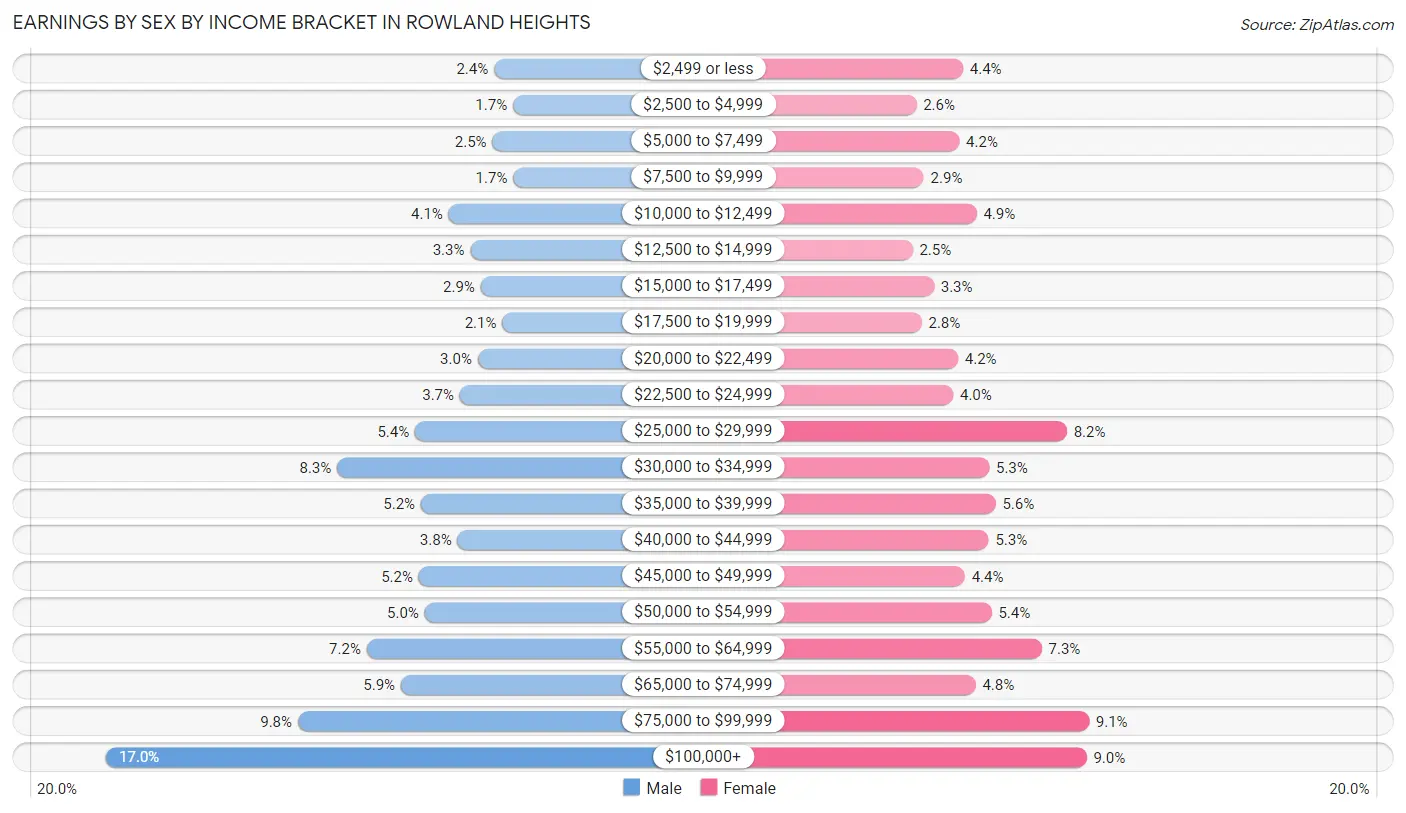
Earnings by Sex by Income Bracket in Rowland Heights
The most common earnings brackets in Rowland Heights are $100,000+ for men (2,262 | 17.0%) and $75,000 to $99,999 for women (1,033 | 9.1%).
| Income | Male | Female |
| $2,499 or less | 321 (2.4%) | 495 (4.3%) |
| $2,500 to $4,999 | 227 (1.7%) | 296 (2.6%) |
| $5,000 to $7,499 | 329 (2.5%) | 480 (4.2%) |
| $7,500 to $9,999 | 225 (1.7%) | 328 (2.9%) |
| $10,000 to $12,499 | 548 (4.1%) | 553 (4.9%) |
| $12,500 to $14,999 | 441 (3.3%) | 280 (2.5%) |
| $15,000 to $17,499 | 388 (2.9%) | 371 (3.3%) |
| $17,500 to $19,999 | 280 (2.1%) | 319 (2.8%) |
| $20,000 to $22,499 | 403 (3.0%) | 474 (4.2%) |
| $22,500 to $24,999 | 493 (3.7%) | 453 (4.0%) |
| $25,000 to $29,999 | 716 (5.4%) | 938 (8.2%) |
| $30,000 to $34,999 | 1,106 (8.3%) | 607 (5.3%) |
| $35,000 to $39,999 | 687 (5.1%) | 634 (5.6%) |
| $40,000 to $44,999 | 505 (3.8%) | 605 (5.3%) |
| $45,000 to $49,999 | 698 (5.2%) | 503 (4.4%) |
| $50,000 to $54,999 | 669 (5.0%) | 617 (5.4%) |
| $55,000 to $64,999 | 958 (7.2%) | 832 (7.3%) |
| $65,000 to $74,999 | 787 (5.9%) | 549 (4.8%) |
| $75,000 to $99,999 | 1,302 (9.8%) | 1,033 (9.1%) |
| $100,000+ | 2,262 (17.0%) | 1,023 (9.0%) |
| Total | 13,345 (100.0%) | 11,390 (100.0%) |
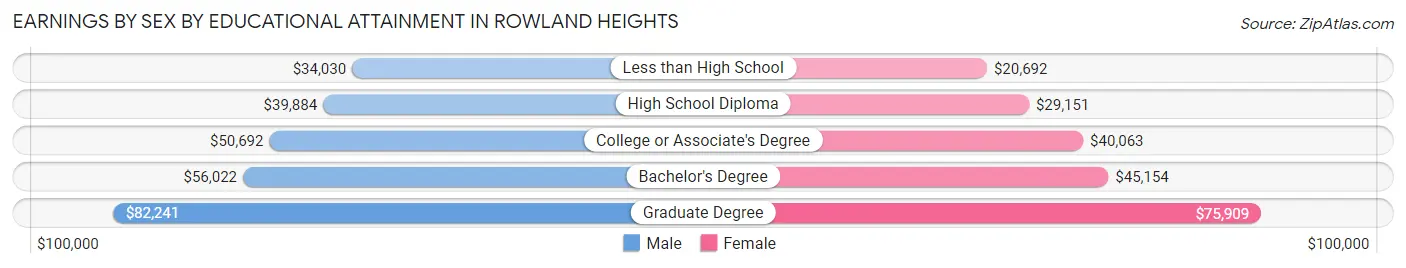
Earnings by Sex by Educational Attainment in Rowland Heights
Average earnings in Rowland Heights are $49,138 for men and $39,068 for women, a difference of 20.5%. Men with an educational attainment of graduate degree enjoy the highest average annual earnings of $82,241, while those with less than high school education earn the least with $34,030. Women with an educational attainment of graduate degree earn the most with the average annual earnings of $75,909, while those with less than high school education have the smallest earnings of $20,692.
| Educational Attainment | Male Income | Female Income |
| Less than High School | $34,030 | $20,692 |
| High School Diploma | $39,884 | $29,151 |
| College or Associate's Degree | $50,692 | $40,063 |
| Bachelor's Degree | $56,022 | $45,154 |
| Graduate Degree | $82,241 | $75,909 |
| Total | $49,138 | $39,068 |
Family Income in Rowland Heights
Family Income Brackets in Rowland Heights
According to the Rowland Heights family income data, there are 2,416 families falling into the $100,000 to $149,999 income range, which is the most common income bracket and makes up 20.0% of all families. Conversely, the $10,000 to $14,999 income bracket is the least frequent group with only 230 families (1.9%) belonging to this category.
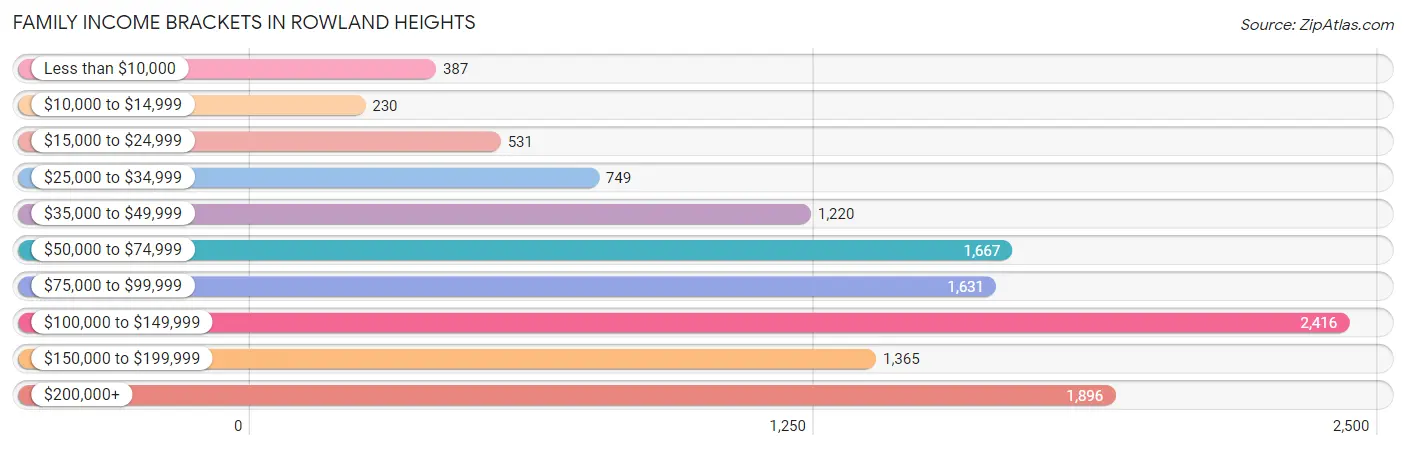
| Income Bracket | # Families | % Families |
| Less than $10,000 | 387 | 3.2% |
| $10,000 to $14,999 | 230 | 1.9% |
| $15,000 to $24,999 | 531 | 4.4% |
| $25,000 to $34,999 | 749 | 6.2% |
| $35,000 to $49,999 | 1,220 | 10.1% |
| $50,000 to $74,999 | 1,667 | 13.8% |
| $75,000 to $99,999 | 1,631 | 13.5% |
| $100,000 to $149,999 | 2,416 | 20.0% |
| $150,000 to $199,999 | 1,365 | 11.3% |
| $200,000+ | 1,896 | 15.7% |
Family Income by Famaliy Size in Rowland Heights
6-person families (473 | 3.9%) account for the highest median family income in Rowland Heights with $157,469 per family, while 3-person families (2,939 | 24.3%) have the highest median income of $34,351 per family member.
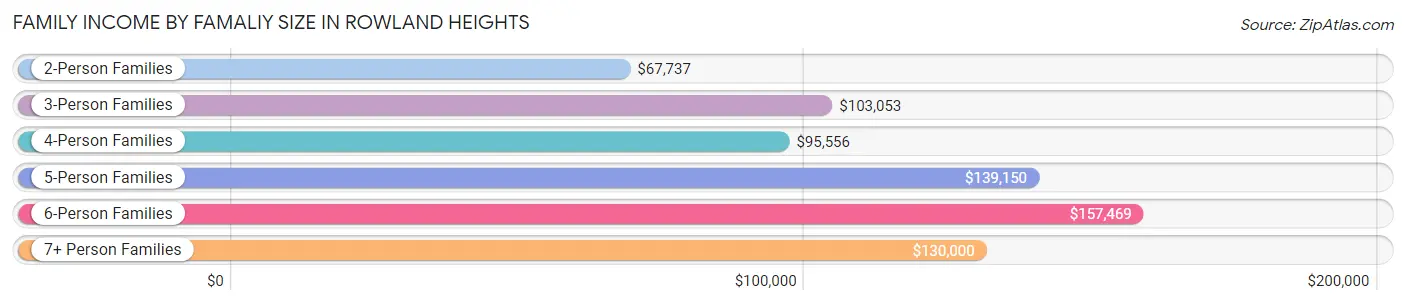
| Income Bracket | # Families | Median Income |
| 2-Person Families | 4,681 (38.8%) | $67,737 |
| 3-Person Families | 2,939 (24.3%) | $103,053 |
| 4-Person Families | 2,410 (20.0%) | $95,556 |
| 5-Person Families | 1,172 (9.7%) | $139,150 |
| 6-Person Families | 473 (3.9%) | $157,469 |
| 7+ Person Families | 404 (3.3%) | $130,000 |
| Total | 12,079 (100.0%) | $91,198 |
Family Income by Number of Earners in Rowland Heights
The median family income in Rowland Heights is $91,198, with families comprising 3+ earners (2,310) having the highest median family income of $154,881, while families with no earners (1,764) have the lowest median family income of $36,383, accounting for 19.1% and 14.6% of families, respectively.
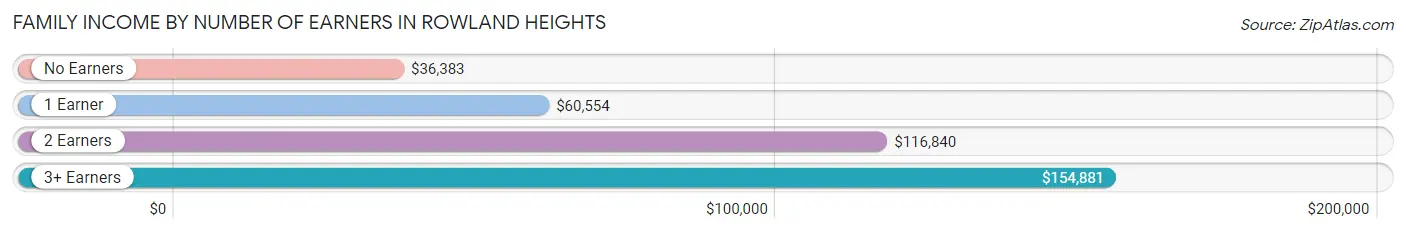
| Number of Earners | # Families | Median Income |
| No Earners | 1,764 (14.6%) | $36,383 |
| 1 Earner | 3,579 (29.6%) | $60,554 |
| 2 Earners | 4,426 (36.6%) | $116,840 |
| 3+ Earners | 2,310 (19.1%) | $154,881 |
| Total | 12,079 (100.0%) | $91,198 |
Household Income in Rowland Heights
Household Income Brackets in Rowland Heights
With 2,816 households falling in the category, the $100,000 to $149,999 income range is the most frequent in Rowland Heights, accounting for 19.0% of all households. In contrast, only 430 households (2.9%) fall into the $10,000 to $14,999 income bracket, making it the least populous group.
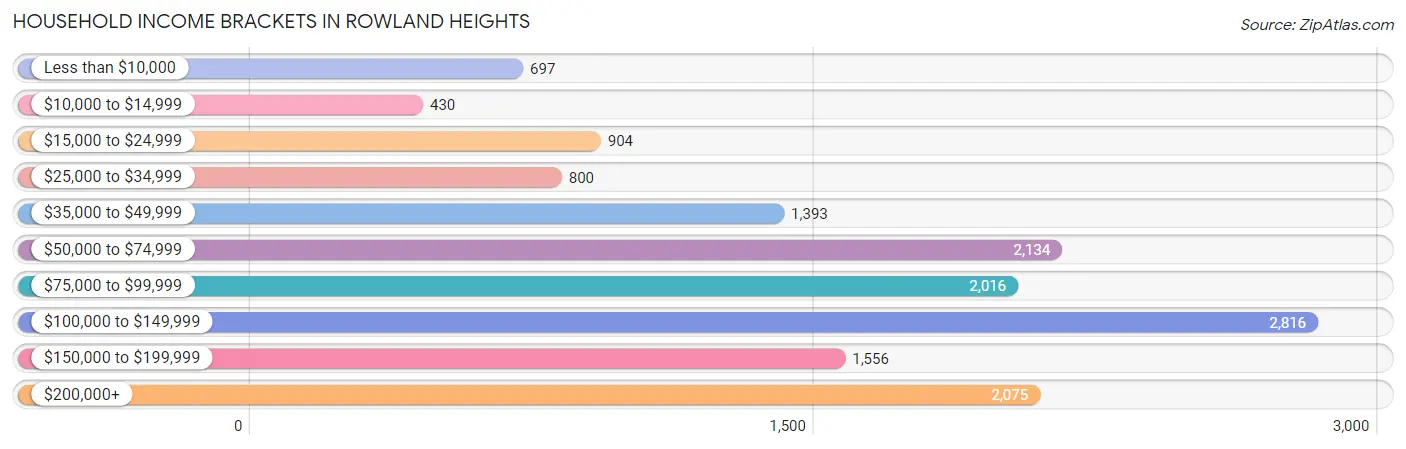
| Income Bracket | # Households | % Households |
| Less than $10,000 | 697 | 4.7% |
| $10,000 to $14,999 | 430 | 2.9% |
| $15,000 to $24,999 | 904 | 6.1% |
| $25,000 to $34,999 | 800 | 5.4% |
| $35,000 to $49,999 | 1,393 | 9.4% |
| $50,000 to $74,999 | 2,134 | 14.4% |
| $75,000 to $99,999 | 2,016 | 13.6% |
| $100,000 to $149,999 | 2,816 | 19.0% |
| $150,000 to $199,999 | 1,556 | 10.5% |
| $200,000+ | 2,075 | 14.0% |
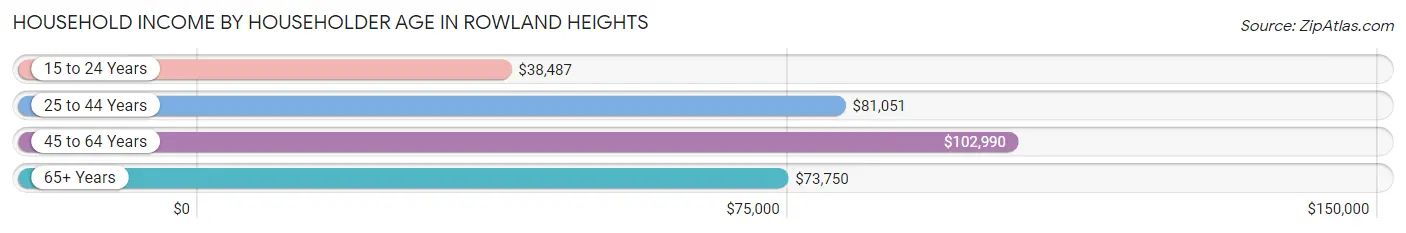
Household Income by Householder Age in Rowland Heights
The median household income in Rowland Heights is $85,842, with the highest median household income of $102,990 found in the 45 to 64 years age bracket for the primary householder. A total of 5,909 households (39.9%) fall into this category. Meanwhile, the 15 to 24 years age bracket for the primary householder has the lowest median household income of $38,487, with 313 households (2.1%) in this group.
| Income Bracket | # Households | Median Income |
| 15 to 24 Years | 313 (2.1%) | $38,487 |
| 25 to 44 Years | 3,863 (26.1%) | $81,051 |
| 45 to 64 Years | 5,909 (39.9%) | $102,990 |
| 65+ Years | 4,737 (32.0%) | $73,750 |
| Total | 14,822 (100.0%) | $85,842 |
Poverty in Rowland Heights
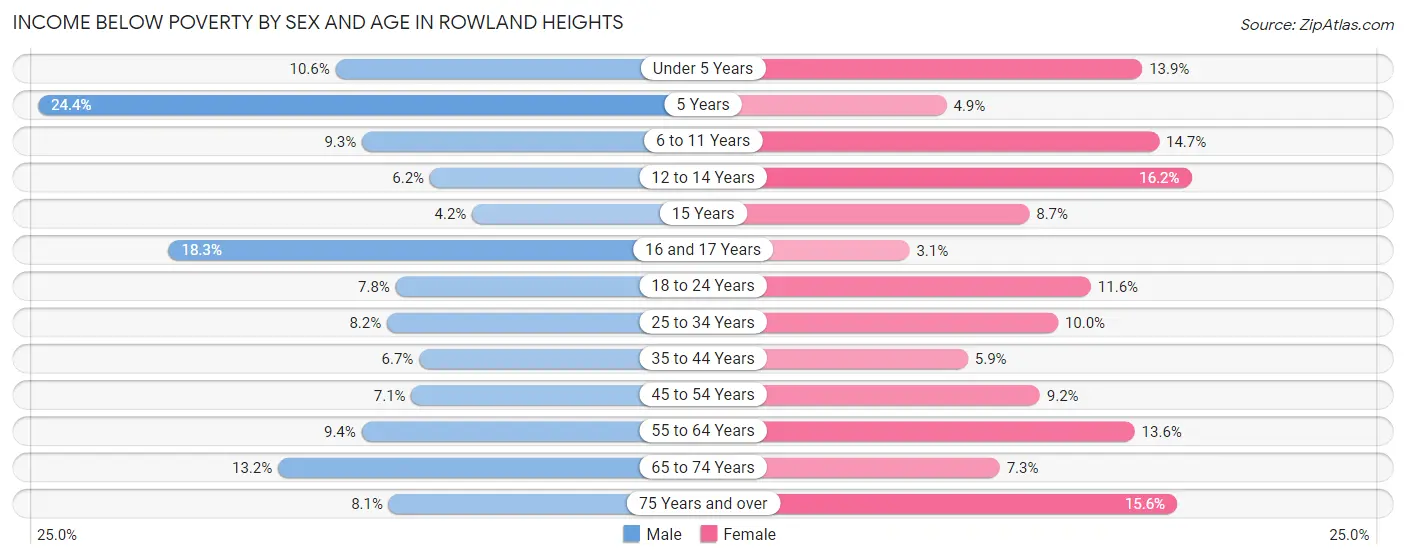
Income Below Poverty by Sex and Age in Rowland Heights
With 9.1% poverty level for males and 10.6% for females among the residents of Rowland Heights, 5 year old males and 12 to 14 year old females are the most vulnerable to poverty, with 29 males (24.4%) and 116 females (16.2%) in their respective age groups living below the poverty level.
| Age Bracket | Male | Female |
| Under 5 Years | 134 (10.6%) | 140 (13.9%) |
| 5 Years | 29 (24.4%) | 7 (4.9%) |
| 6 to 11 Years | 128 (9.3%) | 211 (14.7%) |
| 12 to 14 Years | 42 (6.2%) | 116 (16.2%) |
| 15 Years | 8 (4.2%) | 20 (8.7%) |
| 16 and 17 Years | 107 (18.3%) | 17 (3.1%) |
| 18 to 24 Years | 137 (7.8%) | 192 (11.6%) |
| 25 to 34 Years | 276 (8.2%) | 327 (10.0%) |
| 35 to 44 Years | 190 (6.7%) | 164 (5.9%) |
| 45 to 54 Years | 215 (7.0%) | 286 (9.2%) |
| 55 to 64 Years | 314 (9.4%) | 496 (13.6%) |
| 65 to 74 Years | 380 (13.2%) | 232 (7.3%) |
| 75 Years and over | 146 (8.1%) | 317 (15.5%) |
| Total | 2,106 (9.1%) | 2,525 (10.6%) |
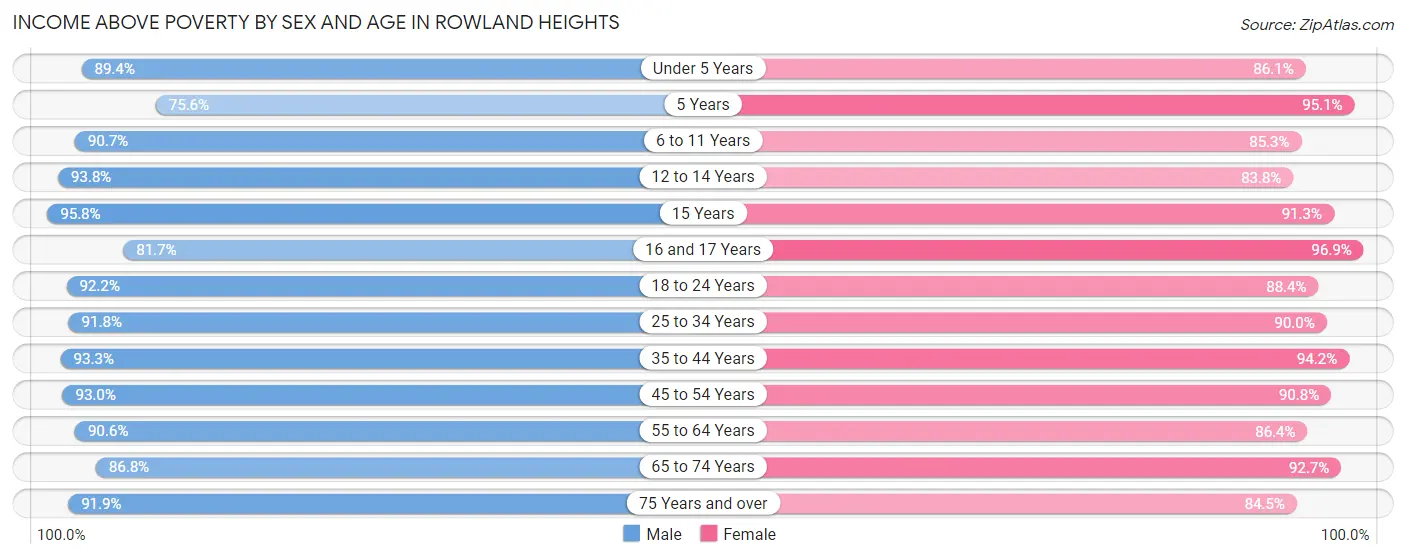
Income Above Poverty by Sex and Age in Rowland Heights
According to the poverty statistics in Rowland Heights, males aged 15 years and females aged 16 and 17 years are the age groups that are most secure financially, with 95.8% of males and 96.9% of females in these age groups living above the poverty line.
| Age Bracket | Male | Female |
| Under 5 Years | 1,134 (89.4%) | 864 (86.1%) |
| 5 Years | 90 (75.6%) | 137 (95.1%) |
| 6 to 11 Years | 1,242 (90.7%) | 1,222 (85.3%) |
| 12 to 14 Years | 636 (93.8%) | 599 (83.8%) |
| 15 Years | 181 (95.8%) | 210 (91.3%) |
| 16 and 17 Years | 477 (81.7%) | 525 (96.9%) |
| 18 to 24 Years | 1,623 (92.2%) | 1,469 (88.4%) |
| 25 to 34 Years | 3,098 (91.8%) | 2,932 (90.0%) |
| 35 to 44 Years | 2,649 (93.3%) | 2,640 (94.2%) |
| 45 to 54 Years | 2,833 (92.9%) | 2,825 (90.8%) |
| 55 to 64 Years | 3,039 (90.6%) | 3,154 (86.4%) |
| 65 to 74 Years | 2,490 (86.8%) | 2,932 (92.7%) |
| 75 Years and over | 1,657 (91.9%) | 1,722 (84.5%) |
| Total | 21,149 (90.9%) | 21,231 (89.4%) |
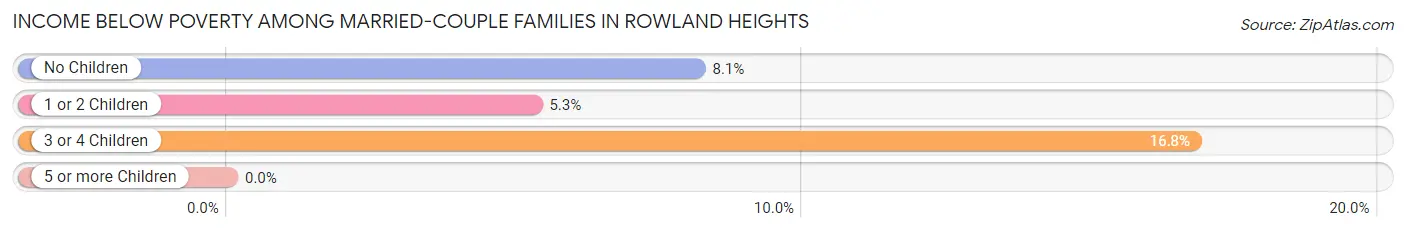
Income Below Poverty Among Married-Couple Families in Rowland Heights
The poverty statistics for married-couple families in Rowland Heights show that 7.5% or 669 of the total 8,872 families live below the poverty line. Families with 3 or 4 children have the highest poverty rate of 16.8%, comprising of 51 families. On the other hand, families with 5 or more children have the lowest poverty rate of 0.0%, which includes 0 families.
| Children | Above Poverty | Below Poverty |
| No Children | 5,314 (91.9%) | 471 (8.1%) |
| 1 or 2 Children | 2,627 (94.7%) | 147 (5.3%) |
| 3 or 4 Children | 253 (83.2%) | 51 (16.8%) |
| 5 or more Children | 9 (100.0%) | 0 (0.0%) |
| Total | 8,203 (92.5%) | 669 (7.5%) |
Income Below Poverty Among Single-Parent Households in Rowland Heights
According to the poverty data in Rowland Heights, 3.4% or 33 single-father households and 11.5% or 257 single-mother households are living below the poverty line. Among single-father households, those with 1 or 2 children have the highest poverty rate, with 12 households (6.4%) experiencing poverty. Likewise, among single-mother households, those with 3 or 4 children have the highest poverty rate, with 28 households (52.8%) falling below the poverty line.
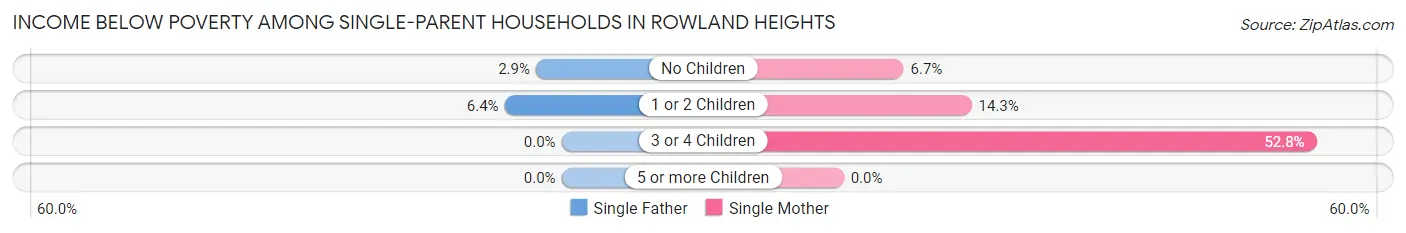
| Children | Single Father | Single Mother |
| No Children | 21 (2.9%) | 71 (6.7%) |
| 1 or 2 Children | 12 (6.4%) | 158 (14.3%) |
| 3 or 4 Children | 0 (0.0%) | 28 (52.8%) |
| 5 or more Children | 0 (0.0%) | 0 (0.0%) |
| Total | 33 (3.4%) | 257 (11.5%) |
Income Below Poverty Among Married-Couple vs Single-Parent Households in Rowland Heights
The poverty data for Rowland Heights shows that 669 of the married-couple family households (7.5%) and 290 of the single-parent households (9.0%) are living below the poverty level. Within the married-couple family households, those with 3 or 4 children have the highest poverty rate, with 51 households (16.8%) falling below the poverty line. Among the single-parent households, those with 3 or 4 children have the highest poverty rate, with 28 household (26.4%) living below poverty.
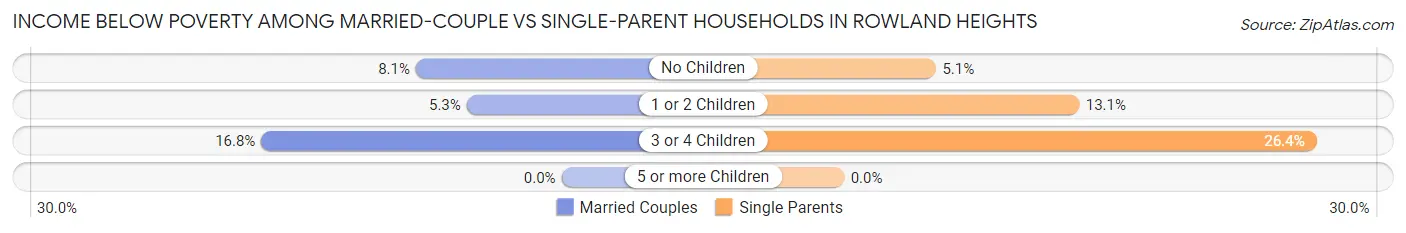
| Children | Married-Couple Families | Single-Parent Households |
| No Children | 471 (8.1%) | 92 (5.1%) |
| 1 or 2 Children | 147 (5.3%) | 170 (13.1%) |
| 3 or 4 Children | 51 (16.8%) | 28 (26.4%) |
| 5 or more Children | 0 (0.0%) | 0 (0.0%) |
| Total | 669 (7.5%) | 290 (9.0%) |
Race in Rowland Heights
The most populous races in Rowland Heights are Asian (28,541 | 60.5%), Hispanic or Latino (14,173 | 30.0%), and Some other Race (8,800 | 18.6%).
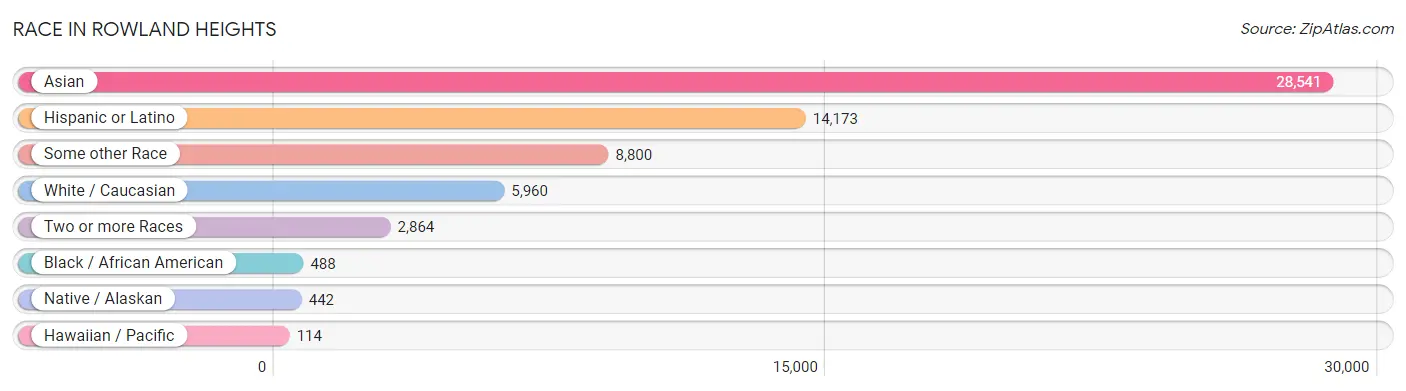
| Race | # Population | % Population |
| Asian | 28,541 | 60.5% |
| Black / African American | 488 | 1.0% |
| Hawaiian / Pacific | 114 | 0.2% |
| Hispanic or Latino | 14,173 | 30.0% |
| Native / Alaskan | 442 | 0.9% |
| White / Caucasian | 5,960 | 12.6% |
| Two or more Races | 2,864 | 6.1% |
| Some other Race | 8,800 | 18.6% |
| Total | 47,209 | 100.0% |
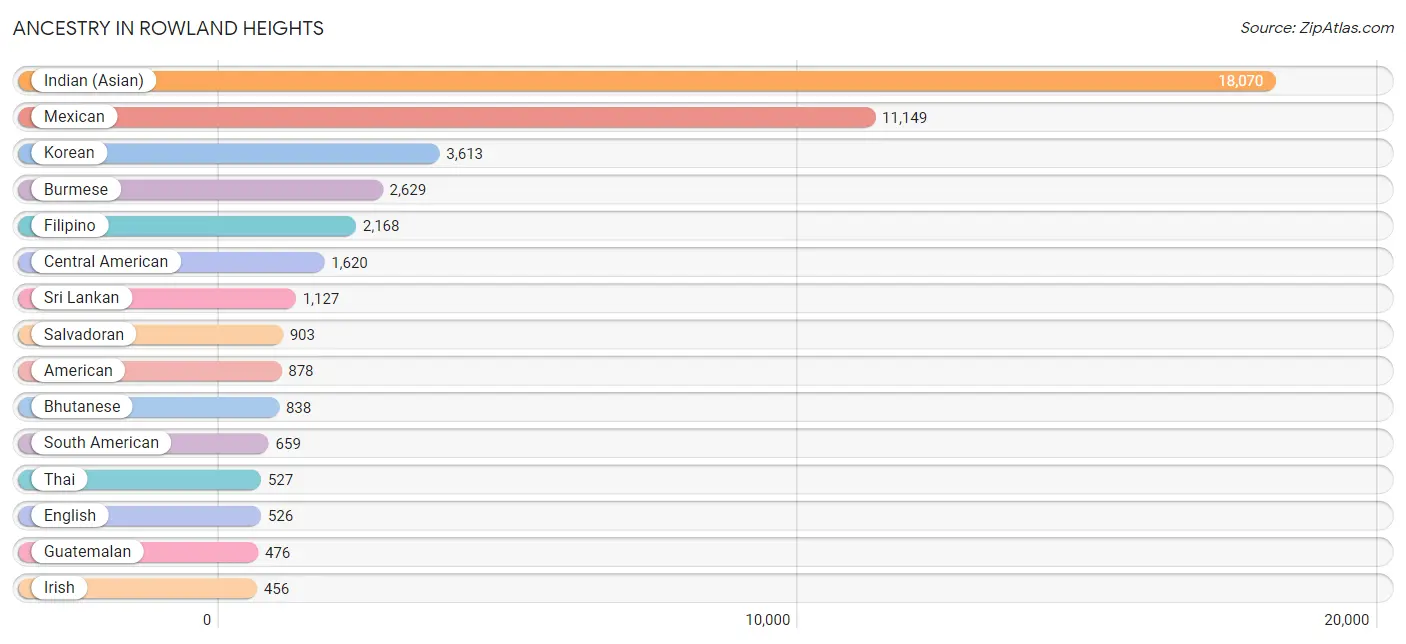
Ancestry in Rowland Heights
The most populous ancestries reported in Rowland Heights are Indian (Asian) (18,070 | 38.3%), Mexican (11,149 | 23.6%), Korean (3,613 | 7.6%), Burmese (2,629 | 5.6%), and Filipino (2,168 | 4.6%), together accounting for 79.7% of all Rowland Heights residents.
| Ancestry | # Population | % Population |
| American | 878 | 1.9% |
| Apache | 15 | 0.0% |
| Arab | 127 | 0.3% |
| Argentinean | 43 | 0.1% |
| Armenian | 69 | 0.2% |
| Austrian | 7 | 0.0% |
| Bhutanese | 838 | 1.8% |
| Bolivian | 19 | 0.0% |
| Brazilian | 8 | 0.0% |
| British | 87 | 0.2% |
| Burmese | 2,629 | 5.6% |
| Canadian | 12 | 0.0% |
| Celtic | 15 | 0.0% |
| Central American | 1,620 | 3.4% |
| Central American Indian | 62 | 0.1% |
| Cherokee | 22 | 0.1% |
| Chilean | 8 | 0.0% |
| Colombian | 37 | 0.1% |
| Comanche | 115 | 0.2% |
| Costa Rican | 61 | 0.1% |
| Creek | 10 | 0.0% |
| Croatian | 9 | 0.0% |
| Cuban | 16 | 0.0% |
| Danish | 12 | 0.0% |
| Dutch | 66 | 0.1% |
| Eastern European | 24 | 0.1% |
| Ecuadorian | 274 | 0.6% |
| Egyptian | 9 | 0.0% |
| English | 526 | 1.1% |
| European | 84 | 0.2% |
| Filipino | 2,168 | 4.6% |
| French | 98 | 0.2% |
| French Canadian | 20 | 0.0% |
| German | 448 | 0.9% |
| Greek | 10 | 0.0% |
| Guamanian / Chamorro | 8 | 0.0% |
| Guatemalan | 476 | 1.0% |
| Honduran | 5 | 0.0% |
| Hungarian | 27 | 0.1% |
| Indian (Asian) | 18,070 | 38.3% |
| Indonesian | 181 | 0.4% |
| Iranian | 49 | 0.1% |
| Irish | 456 | 1.0% |
| Italian | 385 | 0.8% |
| Japanese | 201 | 0.4% |
| Korean | 3,613 | 7.6% |
| Laotian | 433 | 0.9% |
| Lebanese | 32 | 0.1% |
| Malaysian | 77 | 0.2% |
| Mexican | 11,149 | 23.6% |
| Mexican American Indian | 294 | 0.6% |
| Mongolian | 37 | 0.1% |
| Native Hawaiian | 43 | 0.1% |
| Navajo | 23 | 0.1% |
| Nicaraguan | 26 | 0.1% |
| Nigerian | 31 | 0.1% |
| Northern European | 4 | 0.0% |
| Norwegian | 130 | 0.3% |
| Okinawan | 17 | 0.0% |
| Pakistani | 258 | 0.5% |
| Palestinian | 69 | 0.2% |
| Panamanian | 14 | 0.0% |
| Peruvian | 212 | 0.4% |
| Polish | 134 | 0.3% |
| Potawatomi | 5 | 0.0% |
| Puerto Rican | 146 | 0.3% |
| Russian | 145 | 0.3% |
| Salvadoran | 903 | 1.9% |
| Samoan | 120 | 0.3% |
| Scandinavian | 10 | 0.0% |
| Scotch-Irish | 58 | 0.1% |
| Scottish | 99 | 0.2% |
| South American | 659 | 1.4% |
| Spaniard | 84 | 0.2% |
| Spanish | 14 | 0.0% |
| Sri Lankan | 1,127 | 2.4% |
| Subsaharan African | 31 | 0.1% |
| Swedish | 67 | 0.1% |
| Taiwanese | 12 | 0.0% |
| Thai | 527 | 1.1% |
| Ukrainian | 26 | 0.1% |
| Venezuelan | 56 | 0.1% |
| Welsh | 25 | 0.1% |
| Yaqui | 10 | 0.0% |
| Yugoslavian | 6 | 0.0% | View All 85 Rows |
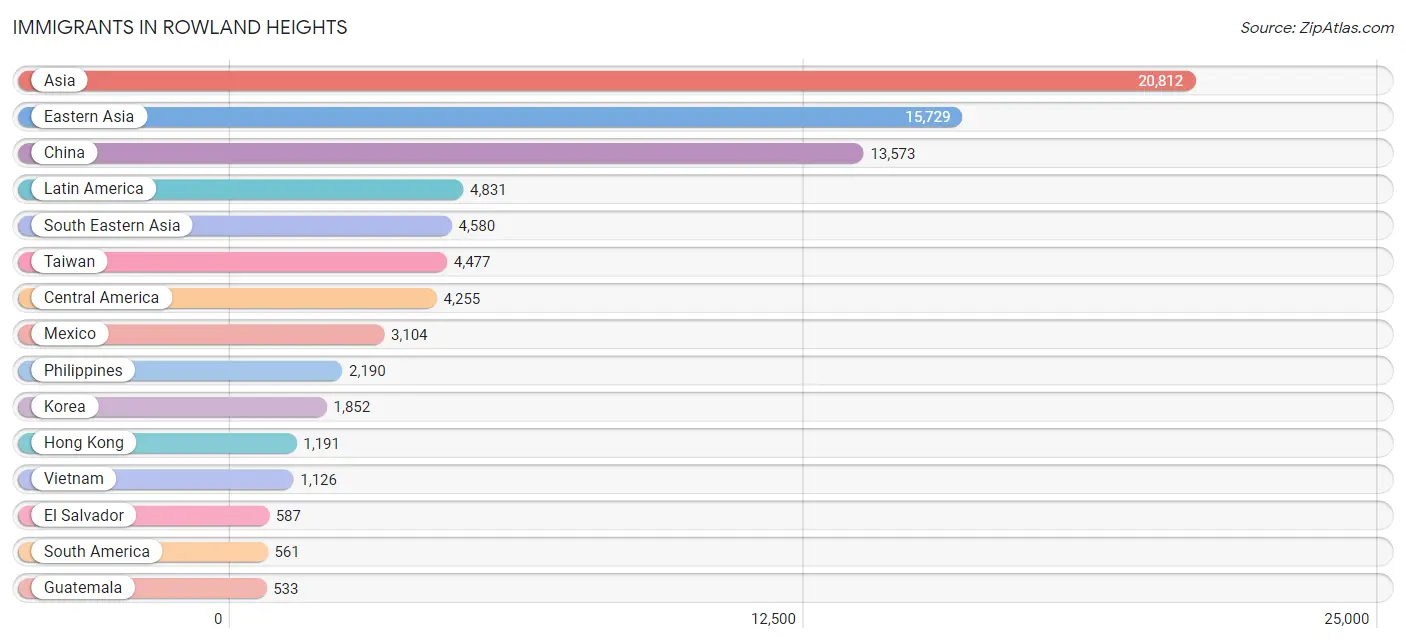
Immigrants in Rowland Heights
The most numerous immigrant groups reported in Rowland Heights came from Asia (20,812 | 44.1%), Eastern Asia (15,729 | 33.3%), China (13,573 | 28.7%), Latin America (4,831 | 10.2%), and South Eastern Asia (4,580 | 9.7%), together accounting for 126.1% of all Rowland Heights residents.
| Immigration Origin | # Population | % Population |
| Africa | 60 | 0.1% |
| Argentina | 75 | 0.2% |
| Asia | 20,812 | 44.1% |
| Belize | 11 | 0.0% |
| Bolivia | 11 | 0.0% |
| Brazil | 8 | 0.0% |
| Cambodia | 144 | 0.3% |
| Canada | 112 | 0.2% |
| Caribbean | 15 | 0.0% |
| Central America | 4,255 | 9.0% |
| China | 13,573 | 28.7% |
| Colombia | 43 | 0.1% |
| Costa Rica | 12 | 0.0% |
| Cuba | 9 | 0.0% |
| Eastern Asia | 15,729 | 33.3% |
| Eastern Europe | 70 | 0.2% |
| Ecuador | 128 | 0.3% |
| Egypt | 8 | 0.0% |
| El Salvador | 587 | 1.2% |
| England | 38 | 0.1% |
| Europe | 158 | 0.3% |
| Fiji | 47 | 0.1% |
| Germany | 30 | 0.1% |
| Guatemala | 533 | 1.1% |
| Guyana | 6 | 0.0% |
| Hong Kong | 1,191 | 2.5% |
| Hungary | 5 | 0.0% |
| India | 327 | 0.7% |
| Indonesia | 531 | 1.1% |
| Israel | 6 | 0.0% |
| Italy | 7 | 0.0% |
| Japan | 304 | 0.6% |
| Jordan | 11 | 0.0% |
| Korea | 1,852 | 3.9% |
| Kuwait | 27 | 0.1% |
| Laos | 52 | 0.1% |
| Latin America | 4,831 | 10.2% |
| Lebanon | 26 | 0.1% |
| Malaysia | 57 | 0.1% |
| Mexico | 3,104 | 6.6% |
| Middle Africa | 40 | 0.1% |
| Nicaragua | 8 | 0.0% |
| Nigeria | 12 | 0.0% |
| Northern Africa | 8 | 0.0% |
| Northern Europe | 51 | 0.1% |
| Norway | 13 | 0.0% |
| Oceania | 47 | 0.1% |
| Pakistan | 20 | 0.0% |
| Peru | 234 | 0.5% |
| Philippines | 2,190 | 4.6% |
| Romania | 4 | 0.0% |
| Russia | 55 | 0.1% |
| Singapore | 26 | 0.1% |
| South America | 561 | 1.2% |
| South Central Asia | 371 | 0.8% |
| South Eastern Asia | 4,580 | 9.7% |
| Southern Europe | 7 | 0.0% |
| Sri Lanka | 17 | 0.0% |
| Syria | 39 | 0.1% |
| Taiwan | 4,477 | 9.5% |
| Thailand | 207 | 0.4% |
| Trinidad and Tobago | 6 | 0.0% |
| Uzbekistan | 7 | 0.0% |
| Venezuela | 46 | 0.1% |
| Vietnam | 1,126 | 2.4% |
| Western Africa | 12 | 0.0% |
| Western Asia | 109 | 0.2% |
| Western Europe | 30 | 0.1% | View All 68 Rows |
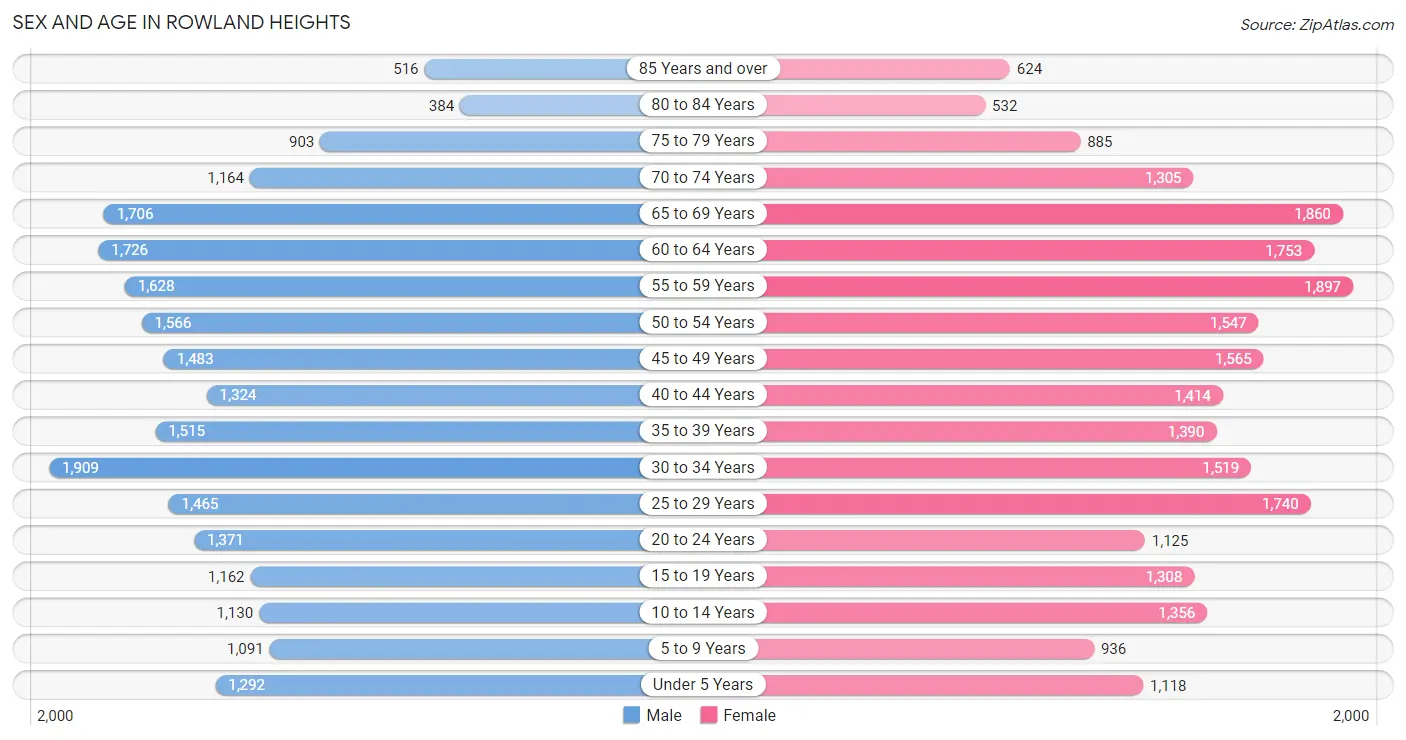
Sex and Age in Rowland Heights
Sex and Age in Rowland Heights
The most populous age groups in Rowland Heights are 30 to 34 Years (1,909 | 8.2%) for men and 55 to 59 Years (1,897 | 8.0%) for women.
| Age Bracket | Male | Female |
| Under 5 Years | 1,292 (5.5%) | 1,118 (4.7%) |
| 5 to 9 Years | 1,091 (4.7%) | 936 (3.9%) |
| 10 to 14 Years | 1,130 (4.8%) | 1,356 (5.7%) |
| 15 to 19 Years | 1,162 (5.0%) | 1,308 (5.5%) |
| 20 to 24 Years | 1,371 (5.9%) | 1,125 (4.7%) |
| 25 to 29 Years | 1,465 (6.3%) | 1,740 (7.3%) |
| 30 to 34 Years | 1,909 (8.2%) | 1,519 (6.4%) |
| 35 to 39 Years | 1,515 (6.5%) | 1,390 (5.8%) |
| 40 to 44 Years | 1,324 (5.7%) | 1,414 (5.9%) |
| 45 to 49 Years | 1,483 (6.4%) | 1,565 (6.6%) |
| 50 to 54 Years | 1,566 (6.7%) | 1,547 (6.5%) |
| 55 to 59 Years | 1,628 (7.0%) | 1,897 (8.0%) |
| 60 to 64 Years | 1,726 (7.4%) | 1,753 (7.3%) |
| 65 to 69 Years | 1,706 (7.3%) | 1,860 (7.8%) |
| 70 to 74 Years | 1,164 (5.0%) | 1,305 (5.5%) |
| 75 to 79 Years | 903 (3.9%) | 885 (3.7%) |
| 80 to 84 Years | 384 (1.7%) | 532 (2.2%) |
| 85 Years and over | 516 (2.2%) | 624 (2.6%) |
| Total | 23,335 (100.0%) | 23,874 (100.0%) |
Families and Households in Rowland Heights
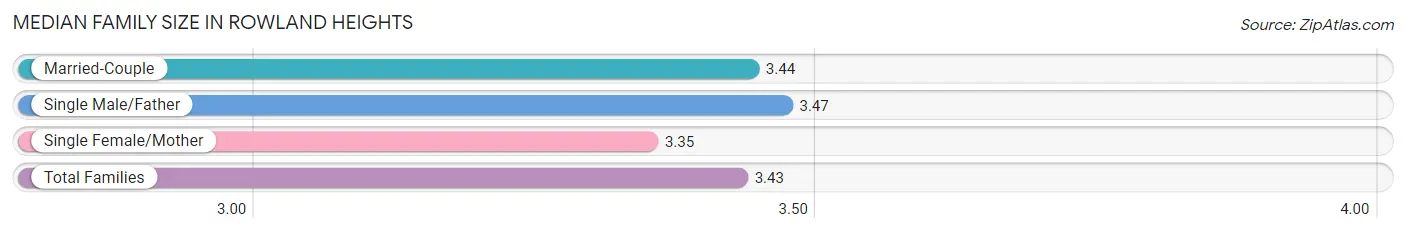
Median Family Size in Rowland Heights
The median family size in Rowland Heights is 3.43 persons per family, with single male/father families (973 | 8.1%) accounting for the largest median family size of 3.47 persons per family. On the other hand, single female/mother families (2,234 | 18.5%) represent the smallest median family size with 3.35 persons per family.
| Family Type | # Families | Family Size |
| Married-Couple | 8,872 (73.5%) | 3.44 |
| Single Male/Father | 973 (8.1%) | 3.47 |
| Single Female/Mother | 2,234 (18.5%) | 3.35 |
| Total Families | 12,079 (100.0%) | 3.43 |
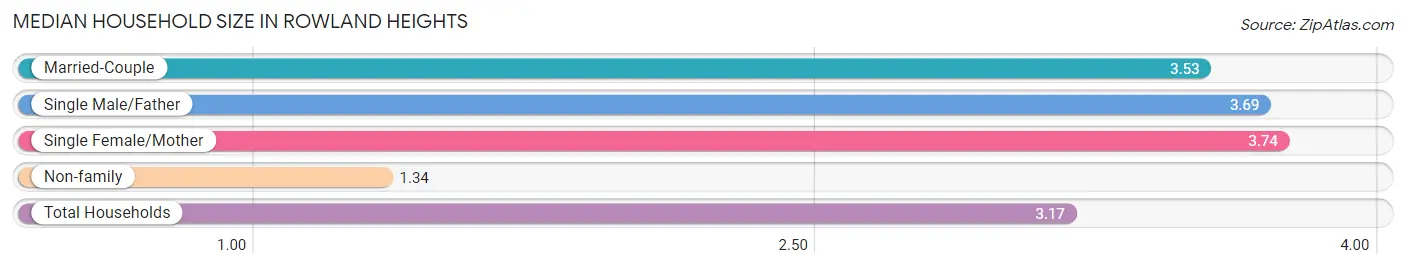
Median Household Size in Rowland Heights
The median household size in Rowland Heights is 3.17 persons per household, with single female/mother households (2,234 | 15.1%) accounting for the largest median household size of 3.74 persons per household. non-family households (2,743 | 18.5%) represent the smallest median household size with 1.34 persons per household.
| Household Type | # Households | Household Size |
| Married-Couple | 8,872 (59.9%) | 3.53 |
| Single Male/Father | 973 (6.6%) | 3.69 |
| Single Female/Mother | 2,234 (15.1%) | 3.74 |
| Non-family | 2,743 (18.5%) | 1.34 |
| Total Households | 14,822 (100.0%) | 3.17 |
Household Size by Marriage Status in Rowland Heights
Out of a total of 14,822 households in Rowland Heights, 12,079 (81.5%) are family households, while 2,743 (18.5%) are nonfamily households. The most numerous type of family households are 2-person households, comprising 4,192, and the most common type of nonfamily households are 1-person households, comprising 2,143.
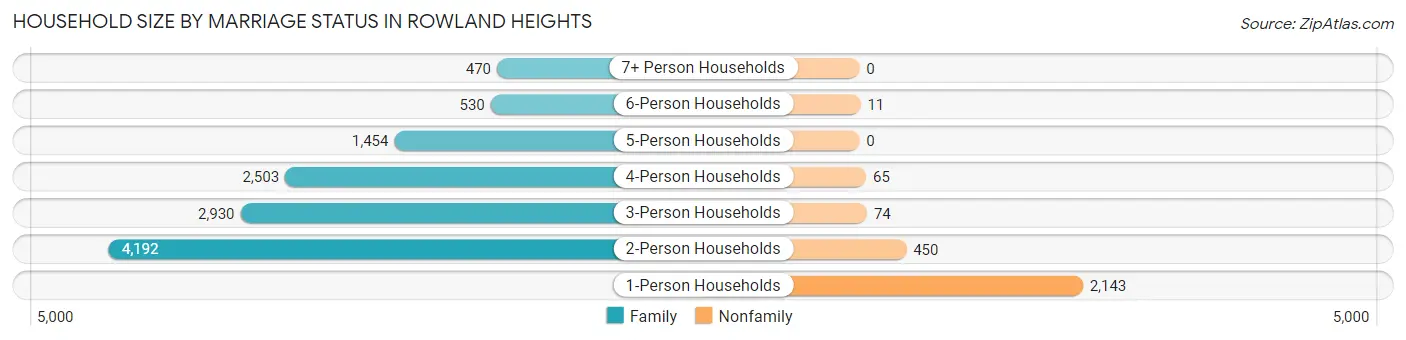
| Household Size | Family Households | Nonfamily Households |
| 1-Person Households | - | 2,143 (14.5%) |
| 2-Person Households | 4,192 (28.3%) | 450 (3.0%) |
| 3-Person Households | 2,930 (19.8%) | 74 (0.5%) |
| 4-Person Households | 2,503 (16.9%) | 65 (0.4%) |
| 5-Person Households | 1,454 (9.8%) | 0 (0.0%) |
| 6-Person Households | 530 (3.6%) | 11 (0.1%) |
| 7+ Person Households | 470 (3.2%) | 0 (0.0%) |
| Total | 12,079 (81.5%) | 2,743 (18.5%) |
Female Fertility in Rowland Heights
Fertility by Age in Rowland Heights
Average fertility rate in Rowland Heights is 30.0 births per 1,000 women. Women in the age bracket of 20 to 34 years have the highest fertility rate with 37.0 births per 1,000 women. Women in the age bracket of 20 to 34 years acount for 52.3% of all women with births.
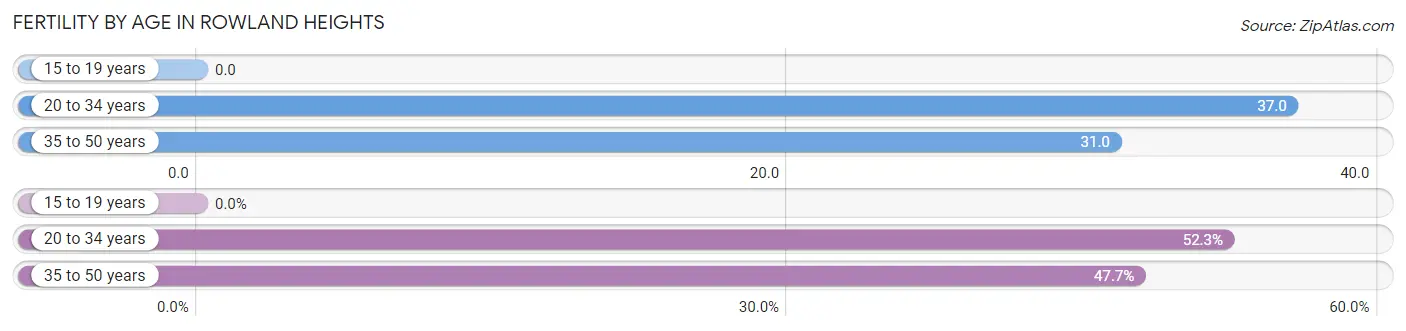
| Age Bracket | Women with Births | Births / 1,000 Women |
| 15 to 19 years | 0 (0.0%) | 0.0 |
| 20 to 34 years | 162 (52.3%) | 37.0 |
| 35 to 50 years | 148 (47.7%) | 31.0 |
| Total | 310 (100.0%) | 30.0 |
Fertility by Age by Marriage Status in Rowland Heights
86.5% of women with births (310) in Rowland Heights are married. The highest percentage of unmarried women with births falls into 20 to 34 years age bracket with 17.3% of them unmarried at the time of birth, while the lowest percentage of unmarried women with births belong to 35 to 50 years age bracket with 9.5% of them unmarried.
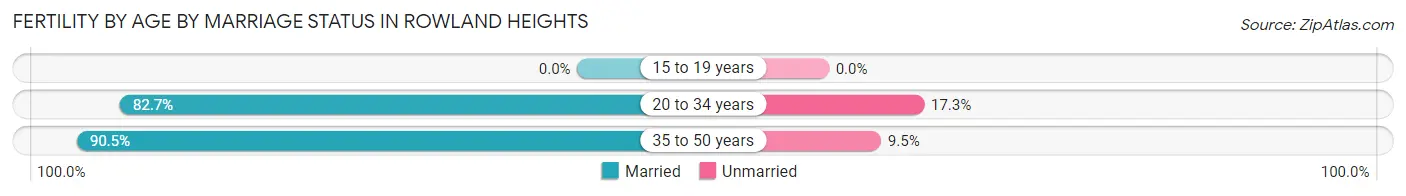
| Age Bracket | Married | Unmarried |
| 15 to 19 years | 0 (0.0%) | 0 (0.0%) |
| 20 to 34 years | 134 (82.7%) | 28 (17.3%) |
| 35 to 50 years | 134 (90.5%) | 14 (9.5%) |
| Total | 268 (86.5%) | 42 (13.6%) |
Fertility by Education in Rowland Heights
Average fertility rate in Rowland Heights is 30.0 births per 1,000 women. Women with the education attainment of high school diploma have the highest fertility rate of 42.0 births per 1,000 women, while women with the education attainment of graduate degree have the lowest fertility at 17.0 births per 1,000 women. Women with the education attainment of bachelor's degree represent 36.8% of all women with births.
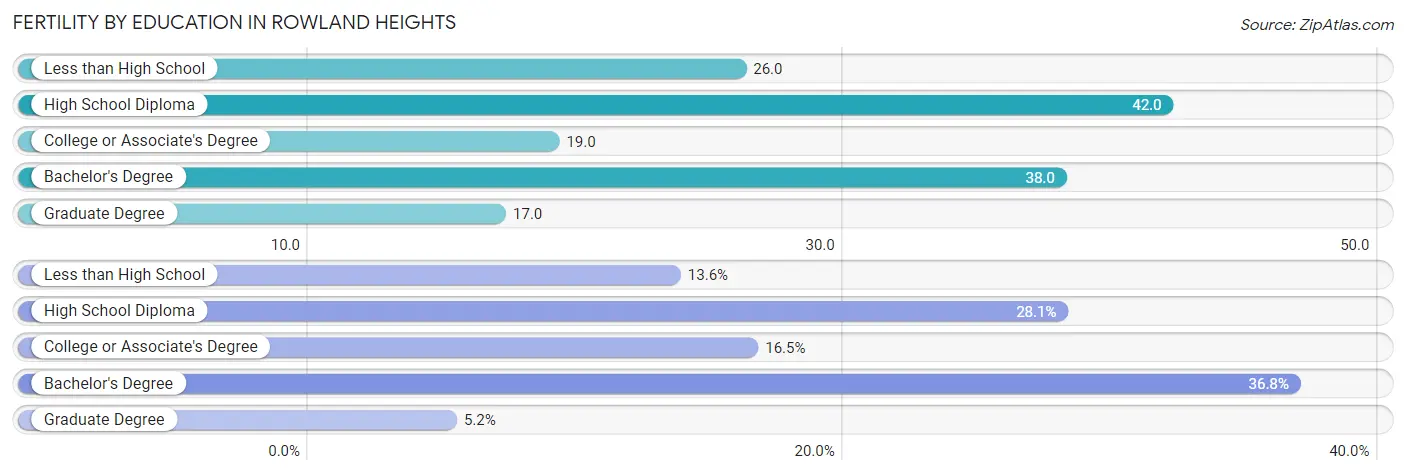
| Educational Attainment | Women with Births | Births / 1,000 Women |
| Less than High School | 42 (13.6%) | 26.0 |
| High School Diploma | 87 (28.1%) | 42.0 |
| College or Associate's Degree | 51 (16.5%) | 19.0 |
| Bachelor's Degree | 114 (36.8%) | 38.0 |
| Graduate Degree | 16 (5.2%) | 17.0 |
| Total | 310 (100.0%) | 30.0 |
Fertility by Education by Marriage Status in Rowland Heights
13.6% of women with births in Rowland Heights are unmarried. Women with the educational attainment of bachelor's degree are most likely to be married with 100.0% of them married at childbirth, while women with the educational attainment of college or associate's degree are least likely to be married with 39.2% of them unmarried at childbirth.
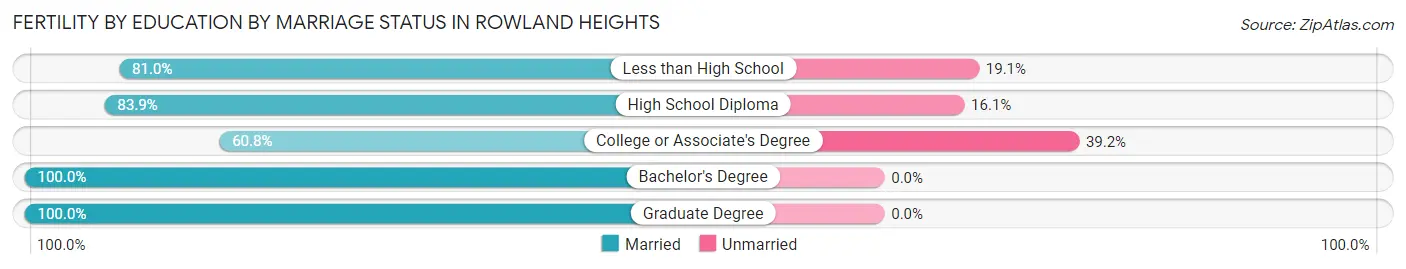
| Educational Attainment | Married | Unmarried |
| Less than High School | 34 (80.9%) | 8 (19.1%) |
| High School Diploma | 73 (83.9%) | 14 (16.1%) |
| College or Associate's Degree | 31 (60.8%) | 20 (39.2%) |
| Bachelor's Degree | 114 (100.0%) | 0 (0.0%) |
| Graduate Degree | 16 (100.0%) | 0 (0.0%) |
| Total | 268 (86.5%) | 42 (13.6%) |
Employment Characteristics in Rowland Heights
Employment by Class of Employer in Rowland Heights
Among the 22,604 employed individuals in Rowland Heights, private company employees (15,834 | 70.1%), self-employed (not incorporated) (1,743 | 7.7%), and self-employed (incorporated) (1,436 | 6.4%) make up the most common classes of employment.
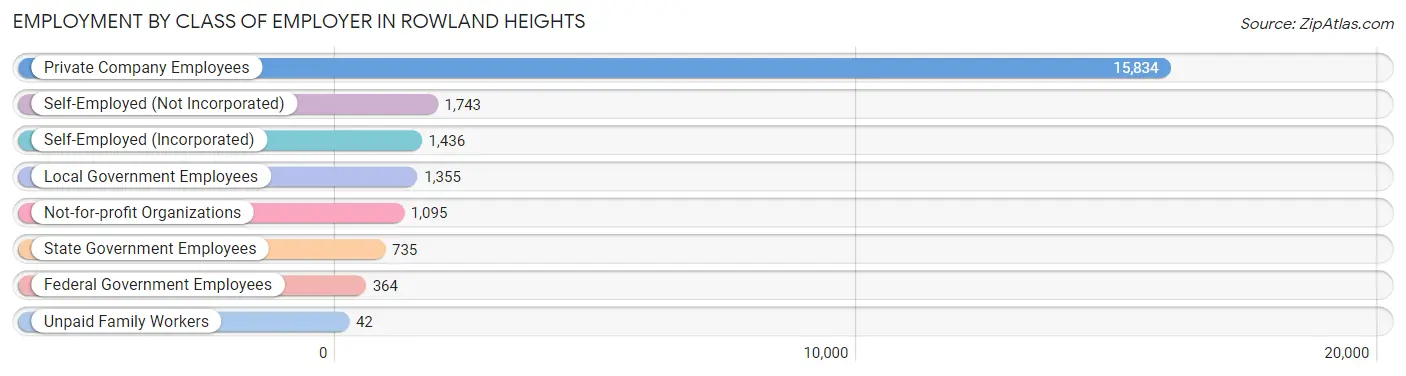
| Employer Class | # Employees | % Employees |
| Private Company Employees | 15,834 | 70.1% |
| Self-Employed (Incorporated) | 1,436 | 6.4% |
| Self-Employed (Not Incorporated) | 1,743 | 7.7% |
| Not-for-profit Organizations | 1,095 | 4.8% |
| Local Government Employees | 1,355 | 6.0% |
| State Government Employees | 735 | 3.3% |
| Federal Government Employees | 364 | 1.6% |
| Unpaid Family Workers | 42 | 0.2% |
| Total | 22,604 | 100.0% |
Employment Status by Age in Rowland Heights
According to the labor force statistics for Rowland Heights, out of the total population over 16 years of age (39,867), 62.1% or 24,757 individuals are in the labor force, with 6.3% or 1,560 of them unemployed. The age group with the highest labor force participation rate is 30 to 34 years, with 86.5% or 2,965 individuals in the labor force. Within the labor force, the 20 to 24 years age range has the highest percentage of unemployed individuals, with 16.7% or 318 of them being unemployed.
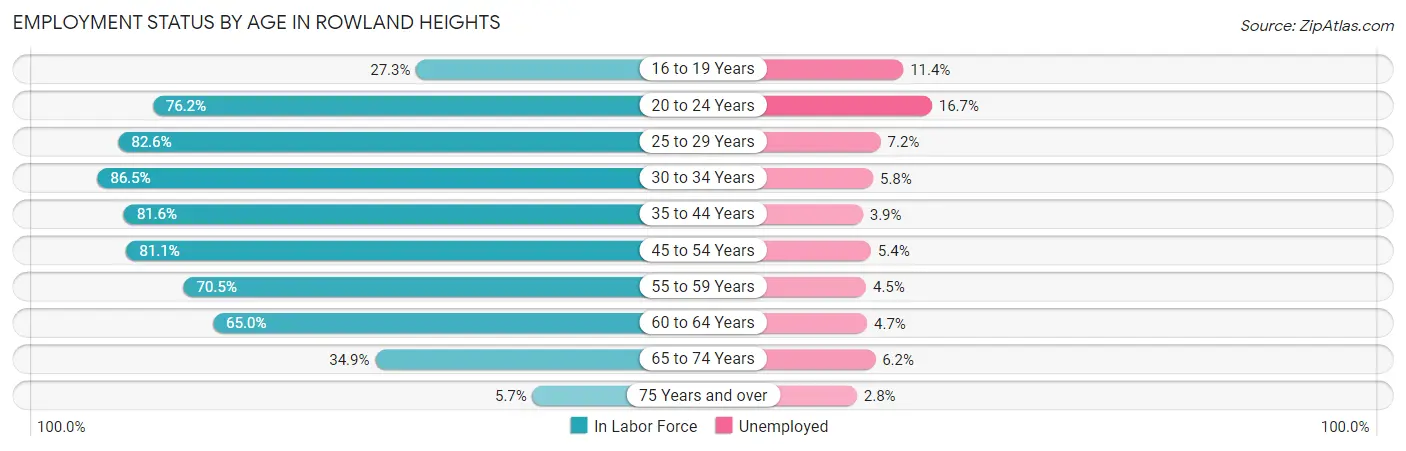
| Age Bracket | In Labor Force | Unemployed |
| 16 to 19 Years | 560 (27.3%) | 64 (11.4%) |
| 20 to 24 Years | 1,902 (76.2%) | 318 (16.7%) |
| 25 to 29 Years | 2,647 (82.6%) | 191 (7.2%) |
| 30 to 34 Years | 2,965 (86.5%) | 172 (5.8%) |
| 35 to 44 Years | 4,605 (81.6%) | 180 (3.9%) |
| 45 to 54 Years | 4,997 (81.1%) | 270 (5.4%) |
| 55 to 59 Years | 2,485 (70.5%) | 112 (4.5%) |
| 60 to 64 Years | 2,261 (65.0%) | 106 (4.7%) |
| 65 to 74 Years | 2,106 (34.9%) | 131 (6.2%) |
| 75 Years and over | 219 (5.7%) | 6 (2.8%) |
| Total | 24,757 (62.1%) | 1,560 (6.3%) |
Employment Status by Educational Attainment in Rowland Heights
According to labor force statistics for Rowland Heights, 78.4% of individuals (19,946) out of the total population between 25 and 64 years of age (25,441) are in the labor force, with 5.2% or 1,037 of them being unemployed. The group with the highest labor force participation rate are those with the educational attainment of bachelor's degree or higher, with 84.8% or 8,200 individuals in the labor force. Within the labor force, individuals with high school diploma education have the highest percentage of unemployment, with 6.8% or 308 of them being unemployed.
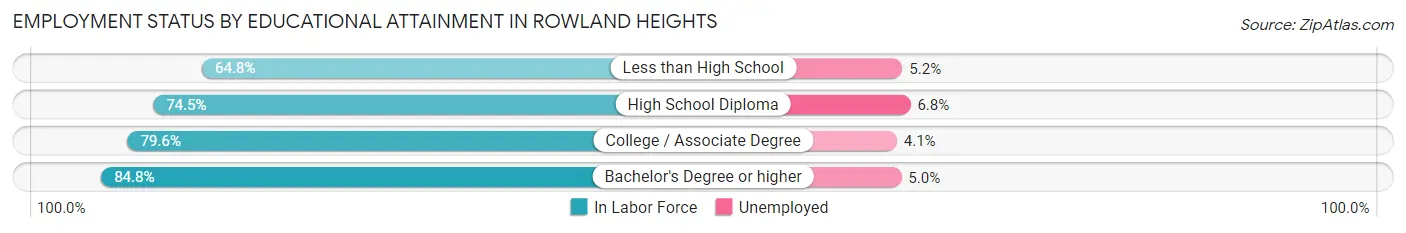
| Educational Attainment | In Labor Force | Unemployed |
| Less than High School | 2,129 (64.8%) | 171 (5.2%) |
| High School Diploma | 4,532 (74.5%) | 414 (6.8%) |
| College / Associate Degree | 5,096 (79.6%) | 262 (4.1%) |
| Bachelor's Degree or higher | 8,200 (84.8%) | 484 (5.0%) |
| Total | 19,946 (78.4%) | 1,323 (5.2%) |
Employment Occupations by Sex in Rowland Heights
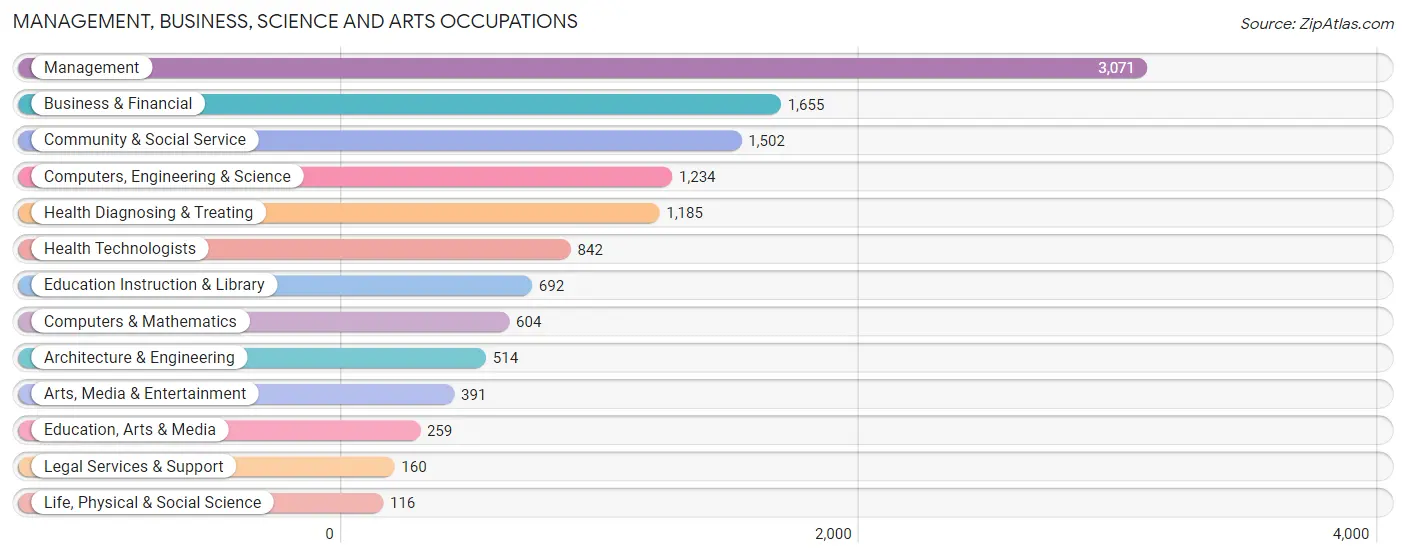
Management, Business, Science and Arts Occupations
The most common Management, Business, Science and Arts occupations in Rowland Heights are Management (3,071 | 13.3%), Business & Financial (1,655 | 7.1%), Community & Social Service (1,502 | 6.5%), Computers, Engineering & Science (1,234 | 5.3%), and Health Diagnosing & Treating (1,185 | 5.1%).
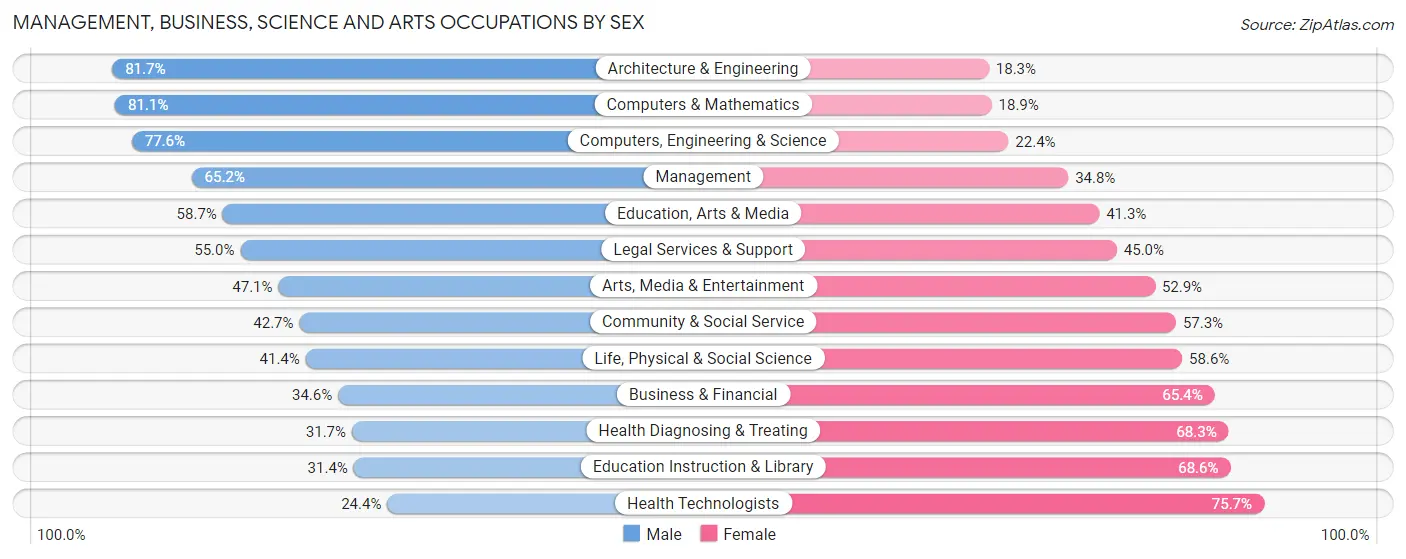
Management, Business, Science and Arts Occupations by Sex
Within the Management, Business, Science and Arts occupations in Rowland Heights, the most male-oriented occupations are Architecture & Engineering (81.7%), Computers & Mathematics (81.1%), and Computers, Engineering & Science (77.6%), while the most female-oriented occupations are Health Technologists (75.6%), Education Instruction & Library (68.6%), and Health Diagnosing & Treating (68.3%).
| Occupation | Male | Female |
| Management | 2,001 (65.2%) | 1,070 (34.8%) |
| Business & Financial | 573 (34.6%) | 1,082 (65.4%) |
| Computers, Engineering & Science | 958 (77.6%) | 276 (22.4%) |
| Computers & Mathematics | 490 (81.1%) | 114 (18.9%) |
| Architecture & Engineering | 420 (81.7%) | 94 (18.3%) |
| Life, Physical & Social Science | 48 (41.4%) | 68 (58.6%) |
| Community & Social Service | 641 (42.7%) | 861 (57.3%) |
| Education, Arts & Media | 152 (58.7%) | 107 (41.3%) |
| Legal Services & Support | 88 (55.0%) | 72 (45.0%) |
| Education Instruction & Library | 217 (31.4%) | 475 (68.6%) |
| Arts, Media & Entertainment | 184 (47.1%) | 207 (52.9%) |
| Health Diagnosing & Treating | 376 (31.7%) | 809 (68.3%) |
| Health Technologists | 205 (24.3%) | 637 (75.6%) |
| Total (Category) | 4,549 (52.6%) | 4,098 (47.4%) |
| Total (Overall) | 12,551 (54.2%) | 10,586 (45.8%) |
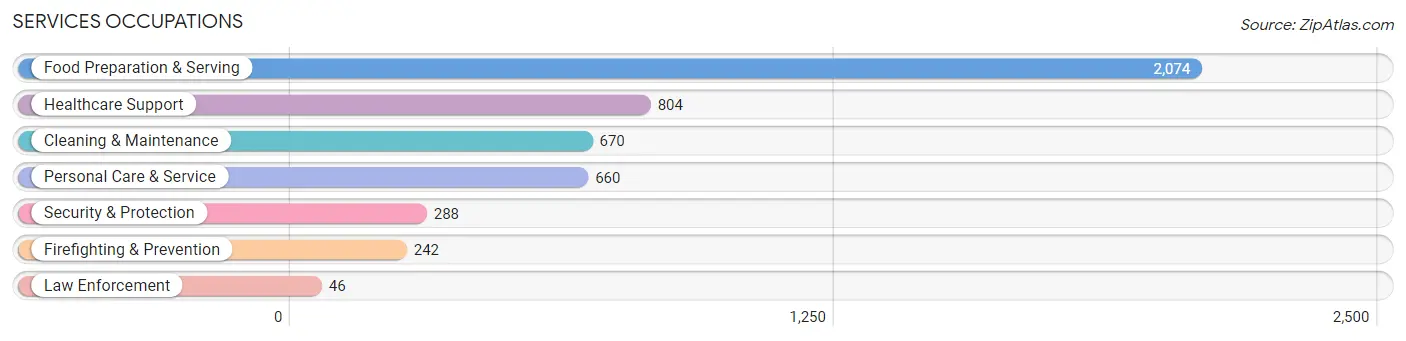
Services Occupations
The most common Services occupations in Rowland Heights are Food Preparation & Serving (2,074 | 9.0%), Healthcare Support (804 | 3.5%), Cleaning & Maintenance (670 | 2.9%), Personal Care & Service (660 | 2.9%), and Security & Protection (288 | 1.2%).
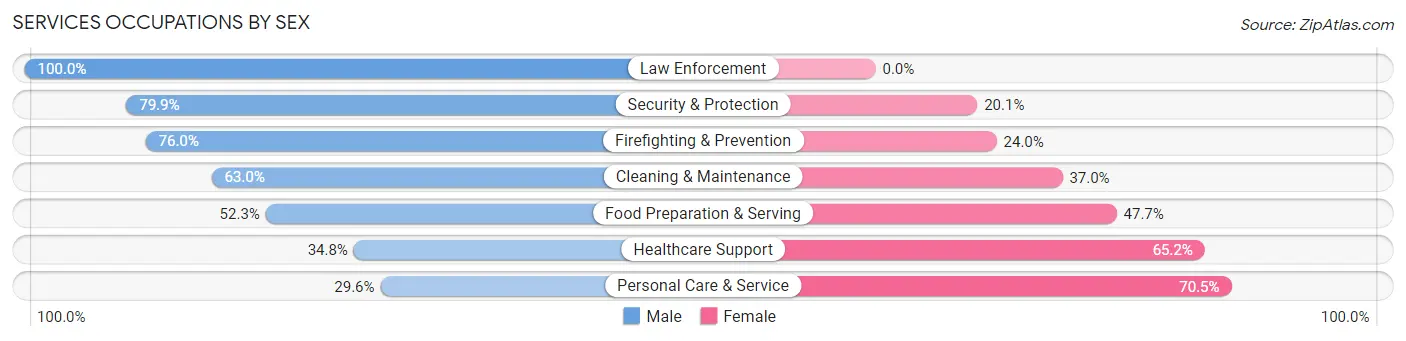
Services Occupations by Sex
Within the Services occupations in Rowland Heights, the most male-oriented occupations are Law Enforcement (100.0%), Security & Protection (79.9%), and Firefighting & Prevention (76.0%), while the most female-oriented occupations are Personal Care & Service (70.5%), Healthcare Support (65.2%), and Food Preparation & Serving (47.7%).
| Occupation | Male | Female |
| Healthcare Support | 280 (34.8%) | 524 (65.2%) |
| Security & Protection | 230 (79.9%) | 58 (20.1%) |
| Firefighting & Prevention | 184 (76.0%) | 58 (24.0%) |
| Law Enforcement | 46 (100.0%) | 0 (0.0%) |
| Food Preparation & Serving | 1,084 (52.3%) | 990 (47.7%) |
| Cleaning & Maintenance | 422 (63.0%) | 248 (37.0%) |
| Personal Care & Service | 195 (29.5%) | 465 (70.5%) |
| Total (Category) | 2,211 (49.2%) | 2,285 (50.8%) |
| Total (Overall) | 12,551 (54.2%) | 10,586 (45.8%) |
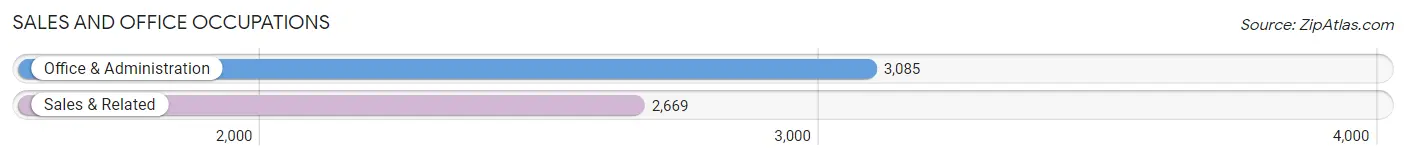
Sales and Office Occupations
The most common Sales and Office occupations in Rowland Heights are Office & Administration (3,085 | 13.3%), and Sales & Related (2,669 | 11.5%).
Sales and Office Occupations by Sex
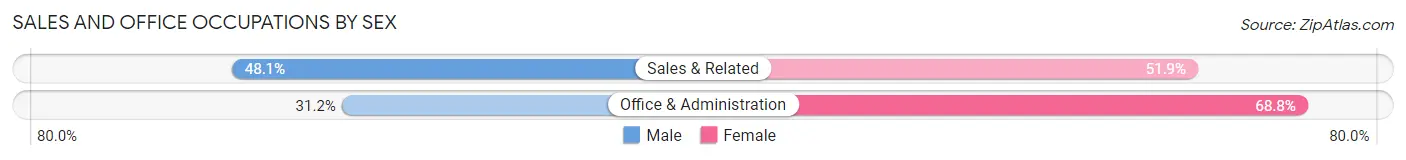
| Occupation | Male | Female |
| Sales & Related | 1,284 (48.1%) | 1,385 (51.9%) |
| Office & Administration | 963 (31.2%) | 2,122 (68.8%) |
| Total (Category) | 2,247 (39.1%) | 3,507 (61.0%) |
| Total (Overall) | 12,551 (54.2%) | 10,586 (45.8%) |
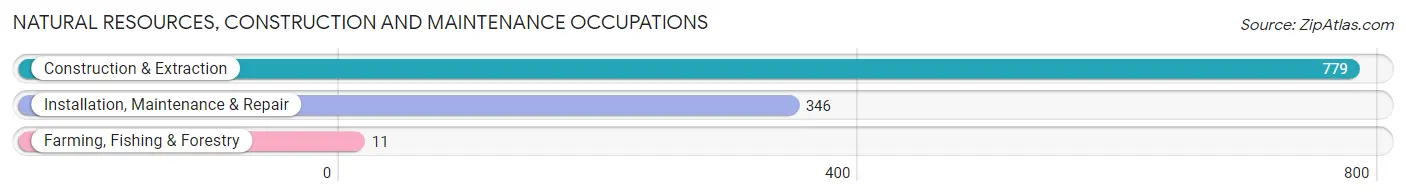
Natural Resources, Construction and Maintenance Occupations
The most common Natural Resources, Construction and Maintenance occupations in Rowland Heights are Construction & Extraction (779 | 3.4%), Installation, Maintenance & Repair (346 | 1.5%), and Farming, Fishing & Forestry (11 | 0.1%).
Natural Resources, Construction and Maintenance Occupations by Sex
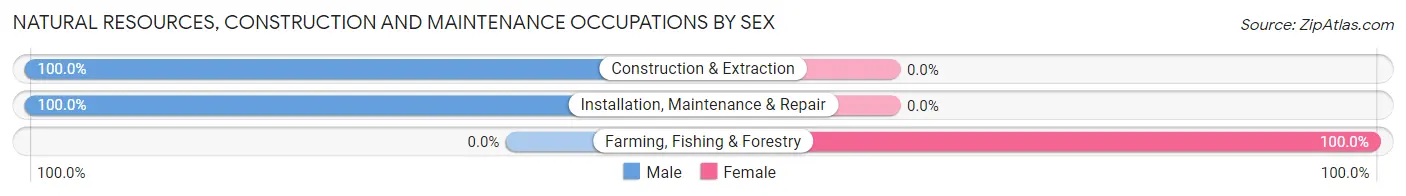
| Occupation | Male | Female |
| Farming, Fishing & Forestry | 0 (0.0%) | 11 (100.0%) |
| Construction & Extraction | 779 (100.0%) | 0 (0.0%) |
| Installation, Maintenance & Repair | 346 (100.0%) | 0 (0.0%) |
| Total (Category) | 1,125 (99.0%) | 11 (1.0%) |
| Total (Overall) | 12,551 (54.2%) | 10,586 (45.8%) |
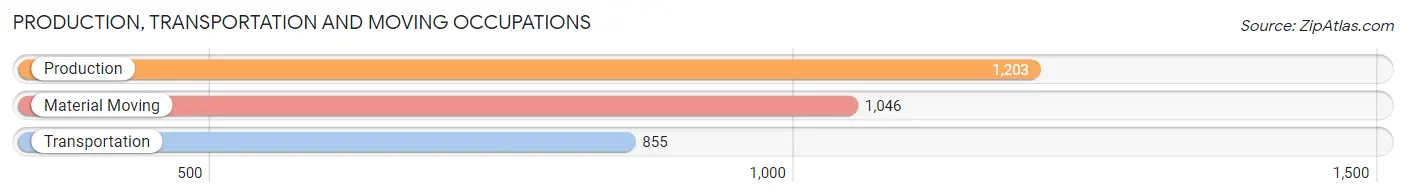
Production, Transportation and Moving Occupations
The most common Production, Transportation and Moving occupations in Rowland Heights are Production (1,203 | 5.2%), Material Moving (1,046 | 4.5%), and Transportation (855 | 3.7%).
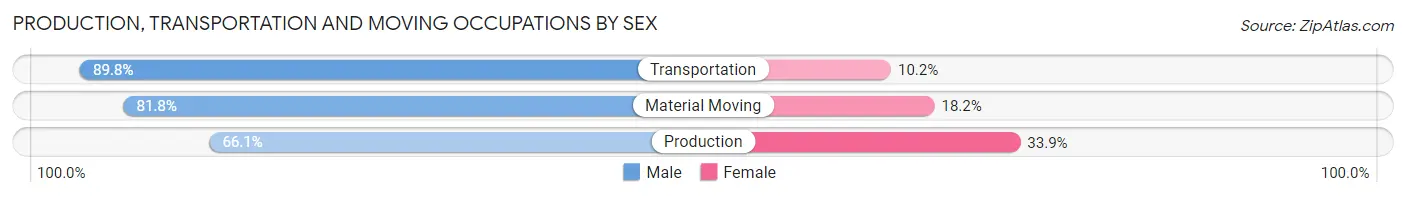
Production, Transportation and Moving Occupations by Sex
| Occupation | Male | Female |
| Production | 795 (66.1%) | 408 (33.9%) |
| Transportation | 768 (89.8%) | 87 (10.2%) |
| Material Moving | 856 (81.8%) | 190 (18.2%) |
| Total (Category) | 2,419 (77.9%) | 685 (22.1%) |
| Total (Overall) | 12,551 (54.2%) | 10,586 (45.8%) |
Employment Industries by Sex in Rowland Heights
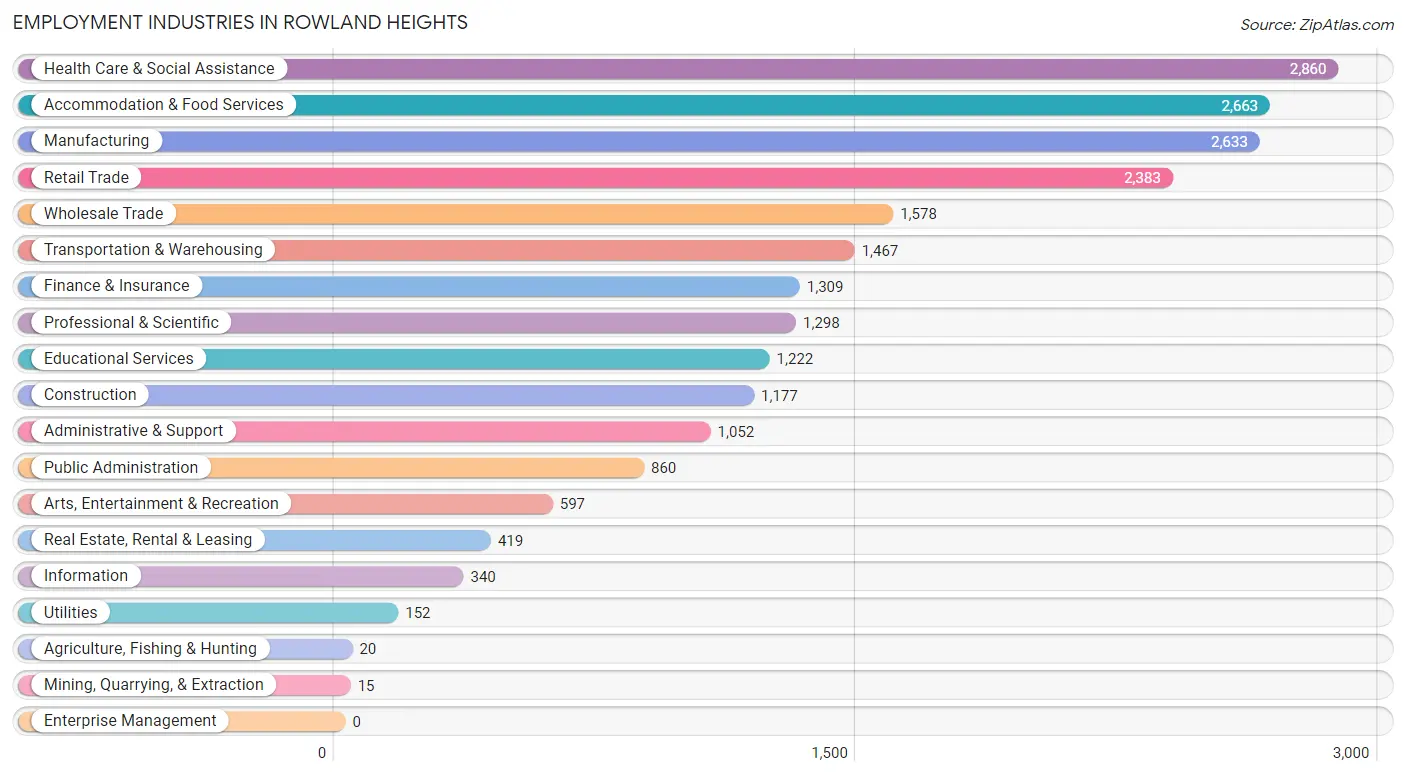
Employment Industries in Rowland Heights
The major employment industries in Rowland Heights include Health Care & Social Assistance (2,860 | 12.4%), Accommodation & Food Services (2,663 | 11.5%), Manufacturing (2,633 | 11.4%), Retail Trade (2,383 | 10.3%), and Wholesale Trade (1,578 | 6.8%).
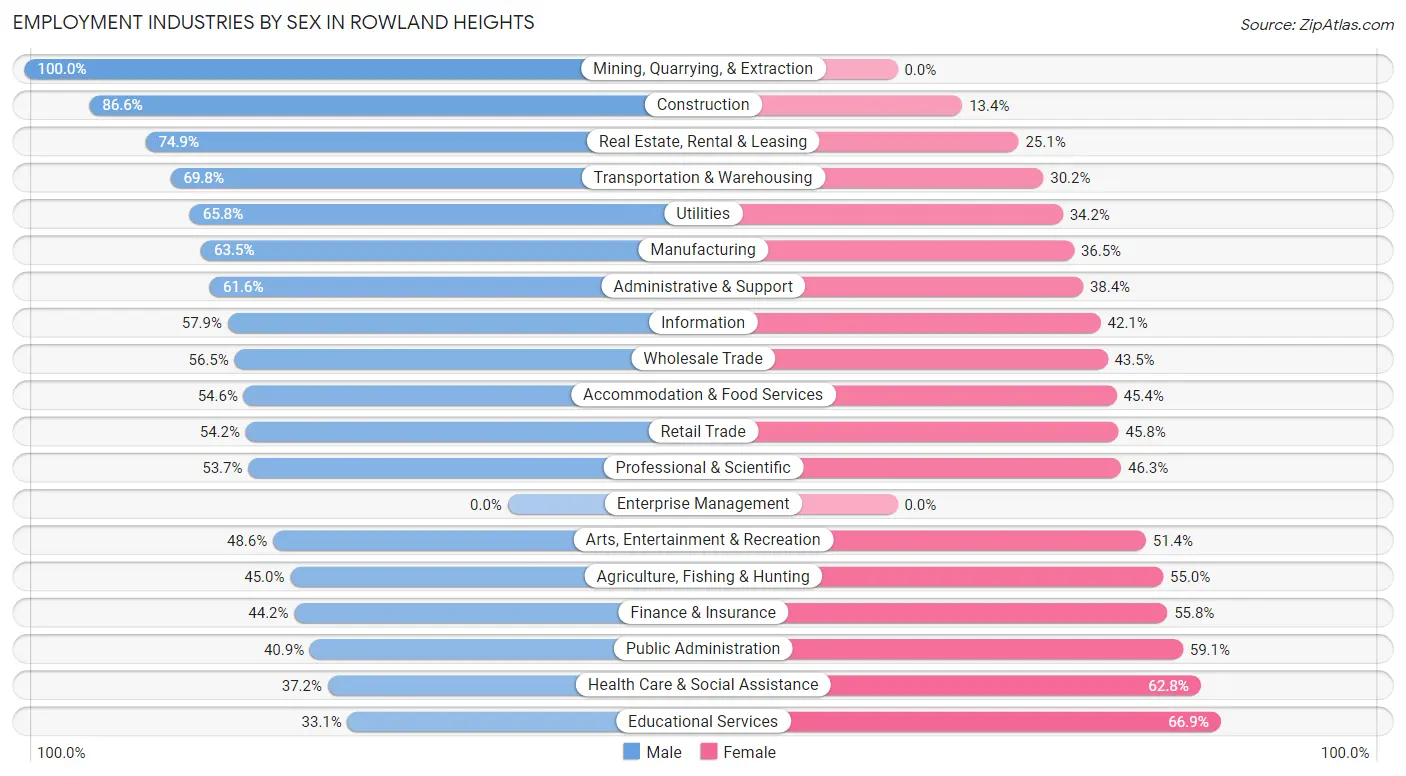
Employment Industries by Sex in Rowland Heights
The Rowland Heights industries that see more men than women are Mining, Quarrying, & Extraction (100.0%), Construction (86.6%), and Real Estate, Rental & Leasing (74.9%), whereas the industries that tend to have a higher number of women are Educational Services (66.9%), Health Care & Social Assistance (62.8%), and Public Administration (59.1%).
| Industry | Male | Female |
| Agriculture, Fishing & Hunting | 9 (45.0%) | 11 (55.0%) |
| Mining, Quarrying, & Extraction | 15 (100.0%) | 0 (0.0%) |
| Construction | 1,019 (86.6%) | 158 (13.4%) |
| Manufacturing | 1,671 (63.5%) | 962 (36.5%) |
| Wholesale Trade | 892 (56.5%) | 686 (43.5%) |
| Retail Trade | 1,292 (54.2%) | 1,091 (45.8%) |
| Transportation & Warehousing | 1,024 (69.8%) | 443 (30.2%) |
| Utilities | 100 (65.8%) | 52 (34.2%) |
| Information | 197 (57.9%) | 143 (42.1%) |
| Finance & Insurance | 578 (44.2%) | 731 (55.8%) |
| Real Estate, Rental & Leasing | 314 (74.9%) | 105 (25.1%) |
| Professional & Scientific | 697 (53.7%) | 601 (46.3%) |
| Enterprise Management | 0 (0.0%) | 0 (0.0%) |
| Administrative & Support | 648 (61.6%) | 404 (38.4%) |
| Educational Services | 405 (33.1%) | 817 (66.9%) |
| Health Care & Social Assistance | 1,065 (37.2%) | 1,795 (62.8%) |
| Arts, Entertainment & Recreation | 290 (48.6%) | 307 (51.4%) |
| Accommodation & Food Services | 1,455 (54.6%) | 1,208 (45.4%) |
| Public Administration | 352 (40.9%) | 508 (59.1%) |
| Total | 12,551 (54.2%) | 10,586 (45.8%) |
Education in Rowland Heights
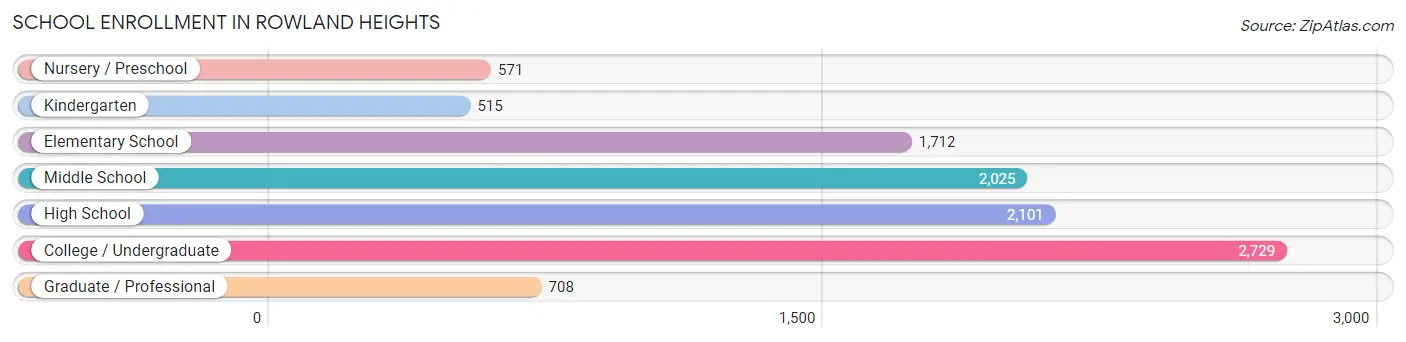
School Enrollment in Rowland Heights
The most common levels of schooling among the 10,361 students in Rowland Heights are college / undergraduate (2,729 | 26.3%), high school (2,101 | 20.3%), and middle school (2,025 | 19.5%).
| School Level | # Students | % Students |
| Nursery / Preschool | 571 | 5.5% |
| Kindergarten | 515 | 5.0% |
| Elementary School | 1,712 | 16.5% |
| Middle School | 2,025 | 19.5% |
| High School | 2,101 | 20.3% |
| College / Undergraduate | 2,729 | 26.3% |
| Graduate / Professional | 708 | 6.8% |
| Total | 10,361 | 100.0% |
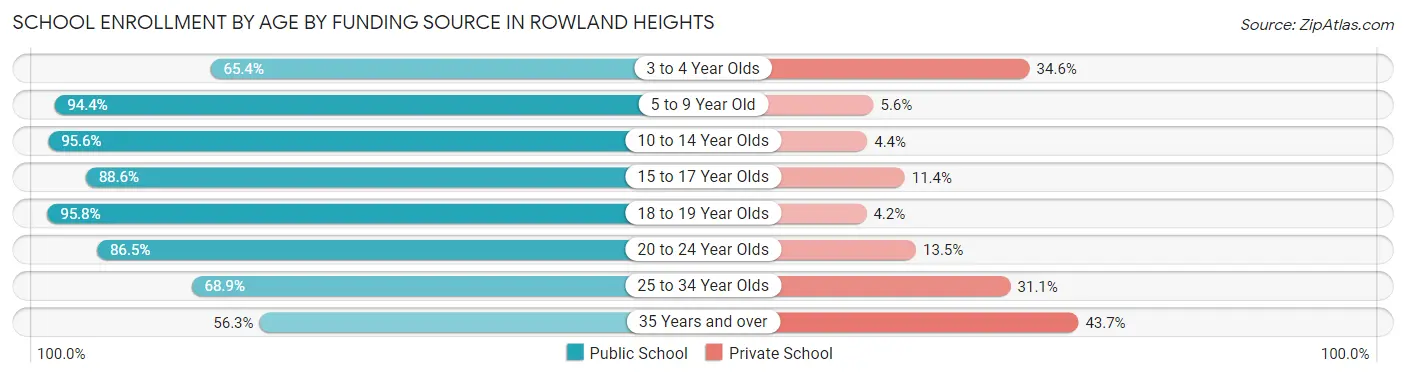
School Enrollment by Age by Funding Source in Rowland Heights
Out of a total of 10,361 students who are enrolled in schools in Rowland Heights, 1,430 (13.8%) attend a private institution, while the remaining 8,931 (86.2%) are enrolled in public schools. The age group of 35 years and over has the highest likelihood of being enrolled in private schools, with 265 (43.7% in the age bracket) enrolled. Conversely, the age group of 18 to 19 year olds has the lowest likelihood of being enrolled in a private school, with 723 (95.8% in the age bracket) attending a public institution.
| Age Bracket | Public School | Private School |
| 3 to 4 Year Olds | 400 (65.4%) | 212 (34.6%) |
| 5 to 9 Year Old | 1,901 (94.4%) | 112 (5.6%) |
| 10 to 14 Year Olds | 2,327 (95.6%) | 107 (4.4%) |
| 15 to 17 Year Olds | 1,369 (88.6%) | 176 (11.4%) |
| 18 to 19 Year Olds | 723 (95.8%) | 32 (4.2%) |
| 20 to 24 Year Olds | 1,077 (86.5%) | 168 (13.5%) |
| 25 to 34 Year Olds | 793 (68.9%) | 358 (31.1%) |
| 35 Years and over | 341 (56.3%) | 265 (43.7%) |
| Total | 8,931 (86.2%) | 1,430 (13.8%) |
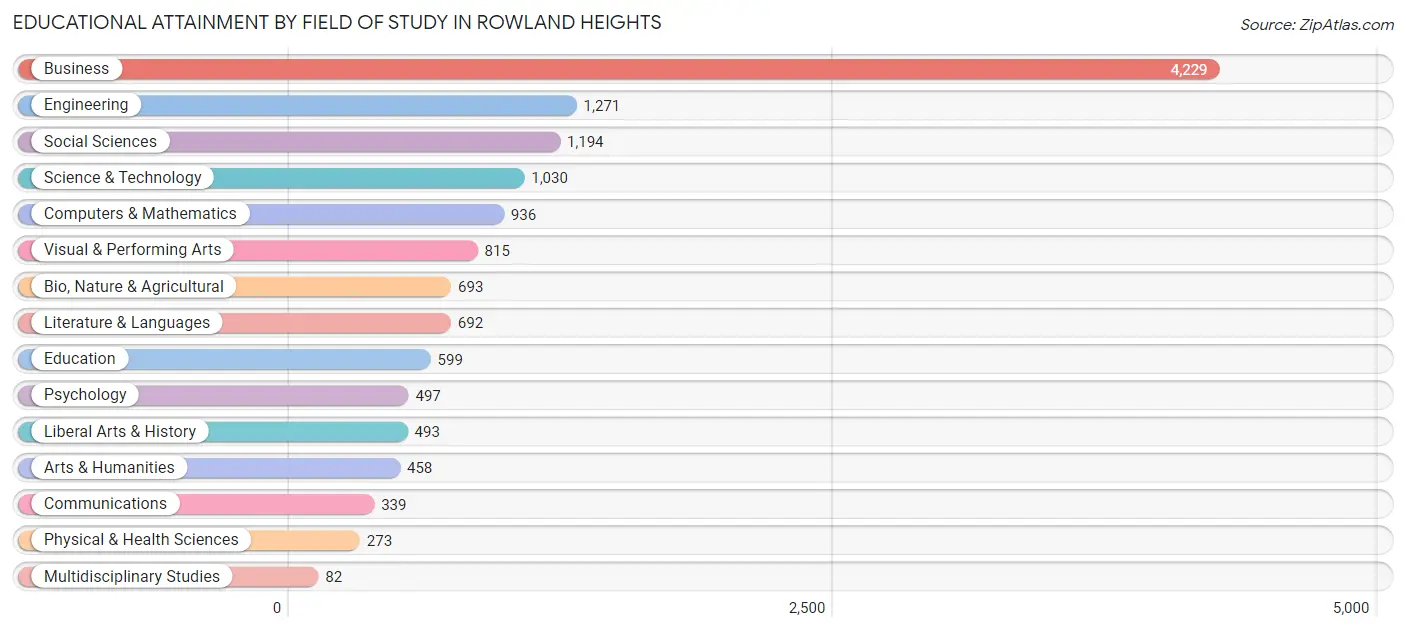
Educational Attainment by Field of Study in Rowland Heights
Business (4,229 | 31.1%), engineering (1,271 | 9.3%), social sciences (1,194 | 8.8%), science & technology (1,030 | 7.6%), and computers & mathematics (936 | 6.9%) are the most common fields of study among 13,601 individuals in Rowland Heights who have obtained a bachelor's degree or higher.
| Field of Study | # Graduates | % Graduates |
| Computers & Mathematics | 936 | 6.9% |
| Bio, Nature & Agricultural | 693 | 5.1% |
| Physical & Health Sciences | 273 | 2.0% |
| Psychology | 497 | 3.6% |
| Social Sciences | 1,194 | 8.8% |
| Engineering | 1,271 | 9.3% |
| Multidisciplinary Studies | 82 | 0.6% |
| Science & Technology | 1,030 | 7.6% |
| Business | 4,229 | 31.1% |
| Education | 599 | 4.4% |
| Literature & Languages | 692 | 5.1% |
| Liberal Arts & History | 493 | 3.6% |
| Visual & Performing Arts | 815 | 6.0% |
| Communications | 339 | 2.5% |
| Arts & Humanities | 458 | 3.4% |
| Total | 13,601 | 100.0% |
Transportation & Commute in Rowland Heights
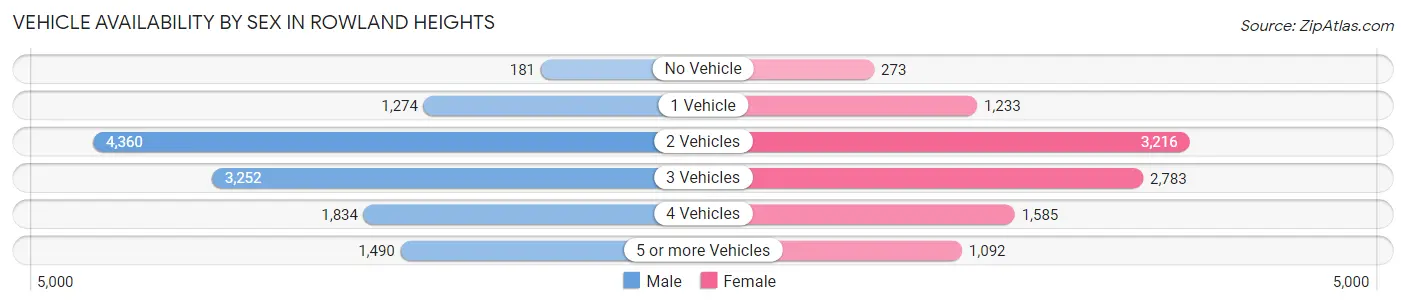
Vehicle Availability by Sex in Rowland Heights
The most prevalent vehicle ownership categories in Rowland Heights are males with 2 vehicles (4,360, accounting for 35.2%) and females with 2 vehicles (3,216, making up 42.8%).
| Vehicles Available | Male | Female |
| No Vehicle | 181 (1.5%) | 273 (2.7%) |
| 1 Vehicle | 1,274 (10.3%) | 1,233 (12.1%) |
| 2 Vehicles | 4,360 (35.2%) | 3,216 (31.6%) |
| 3 Vehicles | 3,252 (26.2%) | 2,783 (27.3%) |
| 4 Vehicles | 1,834 (14.8%) | 1,585 (15.6%) |
| 5 or more Vehicles | 1,490 (12.0%) | 1,092 (10.7%) |
| Total | 12,391 (100.0%) | 10,182 (100.0%) |
Commute Time in Rowland Heights
The most frequently occuring commute durations in Rowland Heights are 30 to 34 minutes (3,282 commuters, 16.3%), 20 to 24 minutes (2,715 commuters, 13.5%), and 15 to 19 minutes (2,553 commuters, 12.7%).
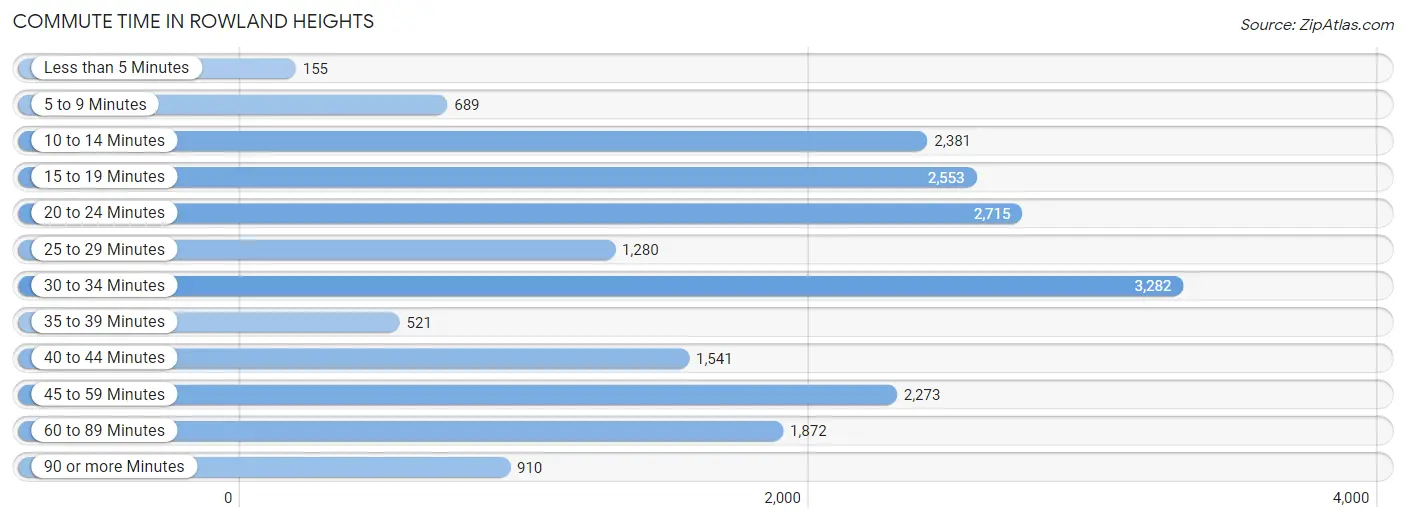
| Commute Time | # Commuters | % Commuters |
| Less than 5 Minutes | 155 | 0.8% |
| 5 to 9 Minutes | 689 | 3.4% |
| 10 to 14 Minutes | 2,381 | 11.8% |
| 15 to 19 Minutes | 2,553 | 12.7% |
| 20 to 24 Minutes | 2,715 | 13.5% |
| 25 to 29 Minutes | 1,280 | 6.4% |
| 30 to 34 Minutes | 3,282 | 16.3% |
| 35 to 39 Minutes | 521 | 2.6% |
| 40 to 44 Minutes | 1,541 | 7.6% |
| 45 to 59 Minutes | 2,273 | 11.3% |
| 60 to 89 Minutes | 1,872 | 9.3% |
| 90 or more Minutes | 910 | 4.5% |
Commute Time by Sex in Rowland Heights
The most common commute times in Rowland Heights are 30 to 34 minutes (1,729 commuters, 15.4%) for males and 30 to 34 minutes (1,553 commuters, 17.3%) for females.
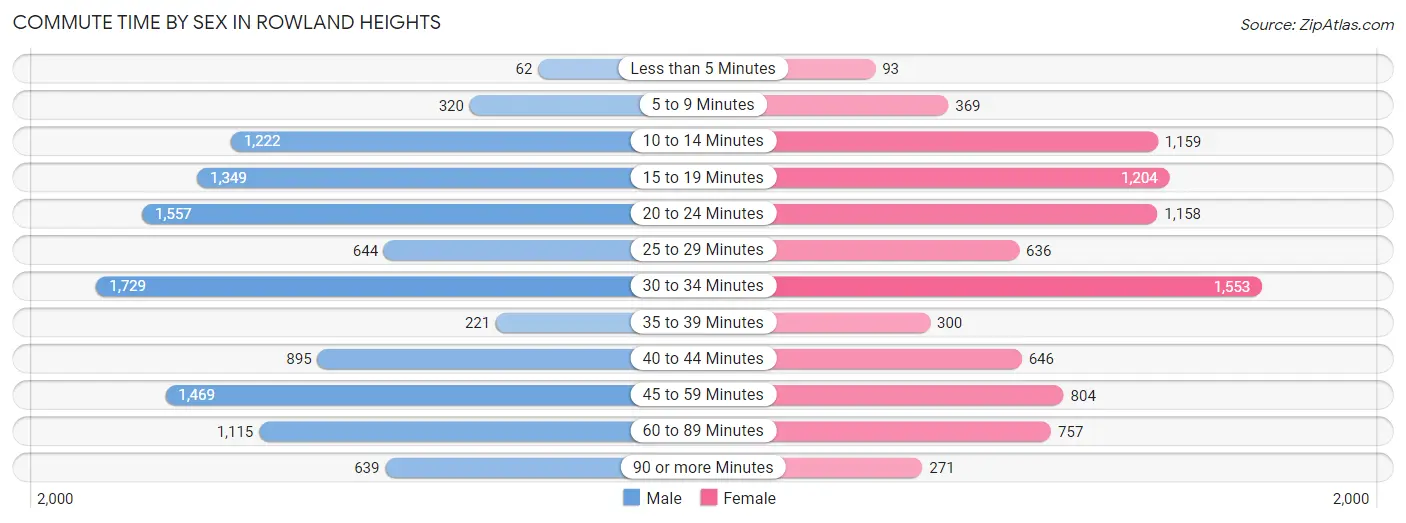
| Commute Time | Male | Female |
| Less than 5 Minutes | 62 (0.5%) | 93 (1.0%) |
| 5 to 9 Minutes | 320 (2.9%) | 369 (4.1%) |
| 10 to 14 Minutes | 1,222 (10.9%) | 1,159 (13.0%) |
| 15 to 19 Minutes | 1,349 (12.0%) | 1,204 (13.5%) |
| 20 to 24 Minutes | 1,557 (13.9%) | 1,158 (12.9%) |
| 25 to 29 Minutes | 644 (5.7%) | 636 (7.1%) |
| 30 to 34 Minutes | 1,729 (15.4%) | 1,553 (17.3%) |
| 35 to 39 Minutes | 221 (2.0%) | 300 (3.4%) |
| 40 to 44 Minutes | 895 (8.0%) | 646 (7.2%) |
| 45 to 59 Minutes | 1,469 (13.1%) | 804 (9.0%) |
| 60 to 89 Minutes | 1,115 (9.9%) | 757 (8.5%) |
| 90 or more Minutes | 639 (5.7%) | 271 (3.0%) |
Time of Departure to Work by Sex in Rowland Heights
The most frequent times of departure to work in Rowland Heights are 8:00 AM to 8:29 AM (1,767, 15.8%) for males and 8:00 AM to 8:29 AM (1,446, 16.2%) for females.
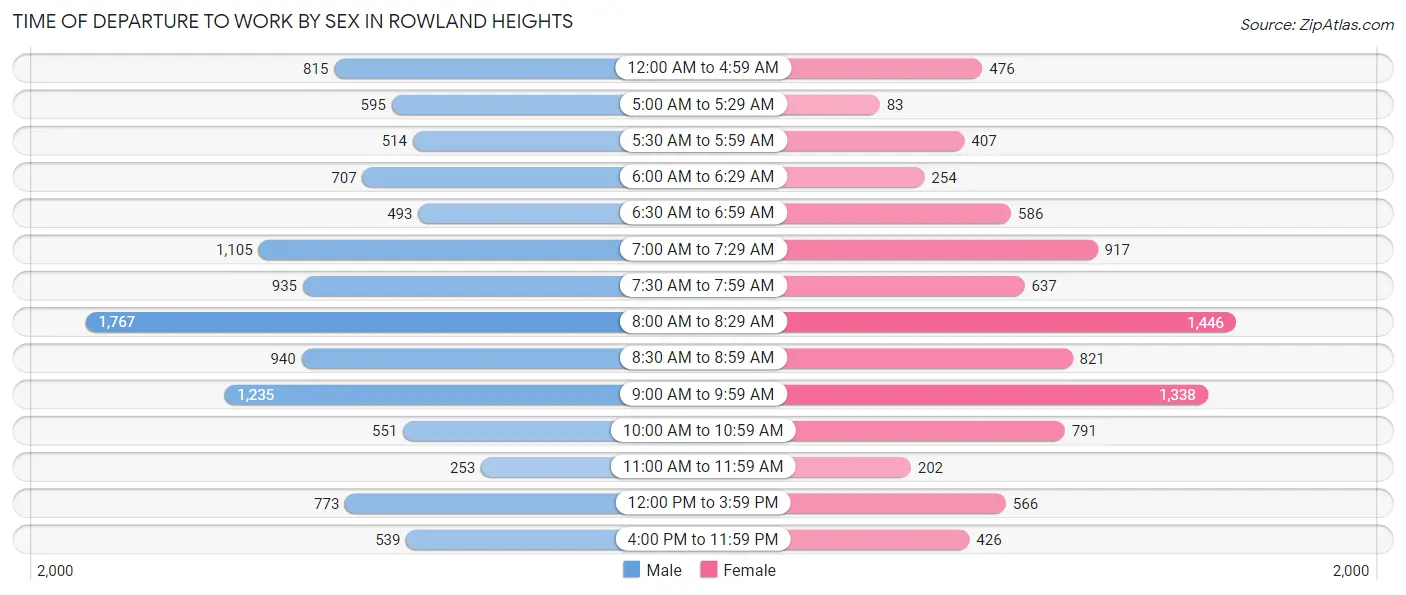
| Time of Departure | Male | Female |
| 12:00 AM to 4:59 AM | 815 (7.3%) | 476 (5.3%) |
| 5:00 AM to 5:29 AM | 595 (5.3%) | 83 (0.9%) |
| 5:30 AM to 5:59 AM | 514 (4.6%) | 407 (4.5%) |
| 6:00 AM to 6:29 AM | 707 (6.3%) | 254 (2.8%) |
| 6:30 AM to 6:59 AM | 493 (4.4%) | 586 (6.6%) |
| 7:00 AM to 7:29 AM | 1,105 (9.9%) | 917 (10.2%) |
| 7:30 AM to 7:59 AM | 935 (8.3%) | 637 (7.1%) |
| 8:00 AM to 8:29 AM | 1,767 (15.8%) | 1,446 (16.2%) |
| 8:30 AM to 8:59 AM | 940 (8.4%) | 821 (9.2%) |
| 9:00 AM to 9:59 AM | 1,235 (11.0%) | 1,338 (14.9%) |
| 10:00 AM to 10:59 AM | 551 (4.9%) | 791 (8.8%) |
| 11:00 AM to 11:59 AM | 253 (2.2%) | 202 (2.3%) |
| 12:00 PM to 3:59 PM | 773 (6.9%) | 566 (6.3%) |
| 4:00 PM to 11:59 PM | 539 (4.8%) | 426 (4.8%) |
| Total | 11,222 (100.0%) | 8,950 (100.0%) |
Housing Occupancy in Rowland Heights
Occupancy by Ownership in Rowland Heights
Of the total 14,822 dwellings in Rowland Heights, owner-occupied units account for 9,821 (66.3%), while renter-occupied units make up 5,001 (33.7%).
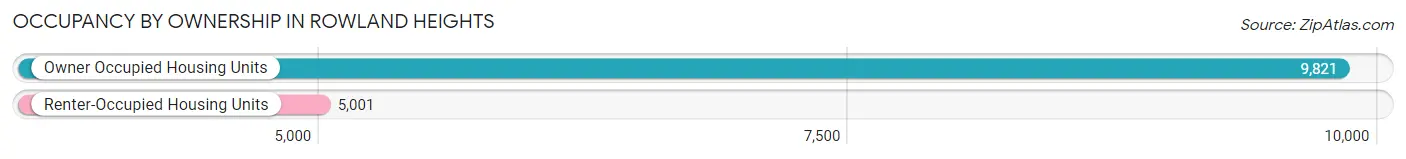
| Occupancy | # Housing Units | % Housing Units |
| Owner Occupied Housing Units | 9,821 | 66.3% |
| Renter-Occupied Housing Units | 5,001 | 33.7% |
| Total Occupied Housing Units | 14,822 | 100.0% |
Occupancy by Household Size in Rowland Heights
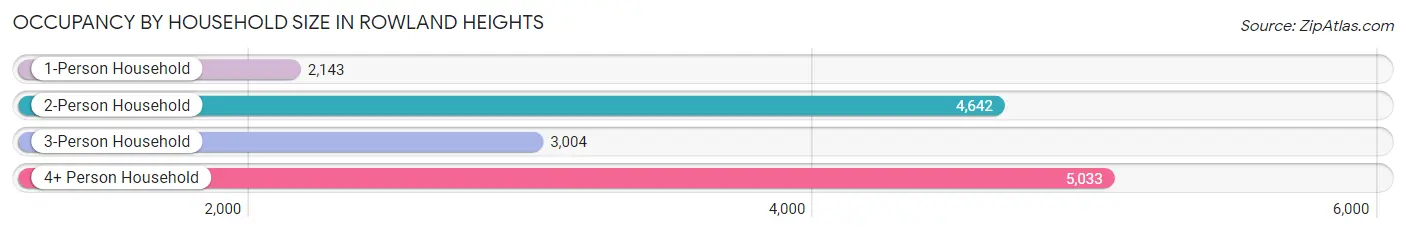
| Household Size | # Housing Units | % Housing Units |
| 1-Person Household | 2,143 | 14.5% |
| 2-Person Household | 4,642 | 31.3% |
| 3-Person Household | 3,004 | 20.3% |
| 4+ Person Household | 5,033 | 34.0% |
| Total Housing Units | 14,822 | 100.0% |
Occupancy by Ownership by Household Size in Rowland Heights
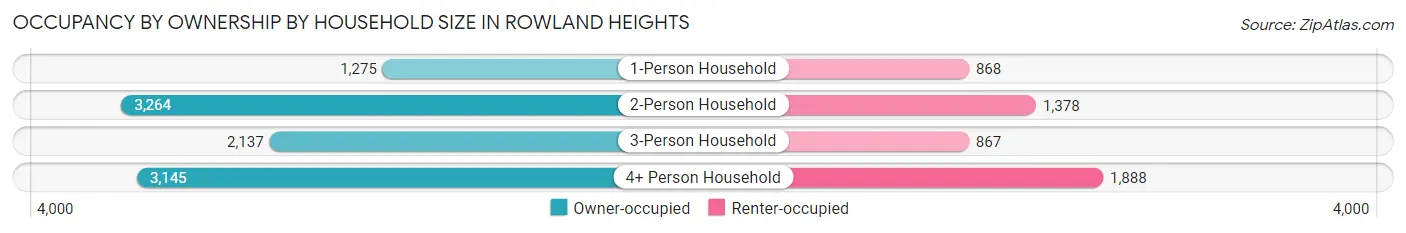
| Household Size | Owner-occupied | Renter-occupied |
| 1-Person Household | 1,275 (59.5%) | 868 (40.5%) |
| 2-Person Household | 3,264 (70.3%) | 1,378 (29.7%) |
| 3-Person Household | 2,137 (71.1%) | 867 (28.9%) |
| 4+ Person Household | 3,145 (62.5%) | 1,888 (37.5%) |
| Total Housing Units | 9,821 (66.3%) | 5,001 (33.7%) |
Occupancy by Educational Attainment in Rowland Heights
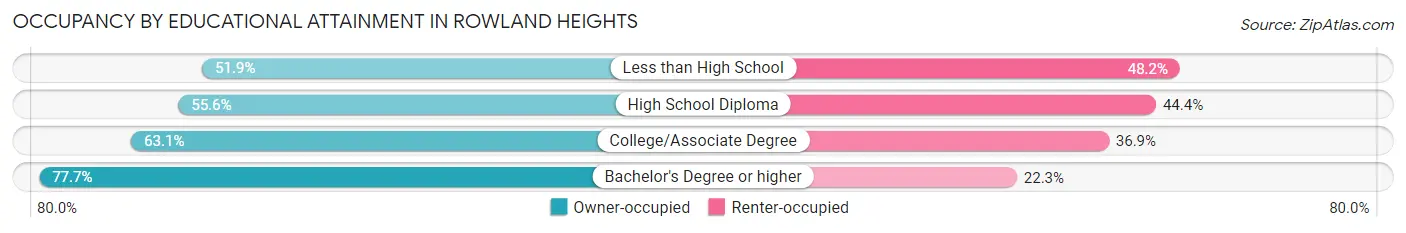
| Household Size | Owner-occupied | Renter-occupied |
| Less than High School | 941 (51.8%) | 874 (48.1%) |
| High School Diploma | 1,776 (55.6%) | 1,417 (44.4%) |
| College/Associate Degree | 2,248 (63.1%) | 1,315 (36.9%) |
| Bachelor's Degree or higher | 4,856 (77.7%) | 1,395 (22.3%) |
Occupancy by Age of Householder in Rowland Heights
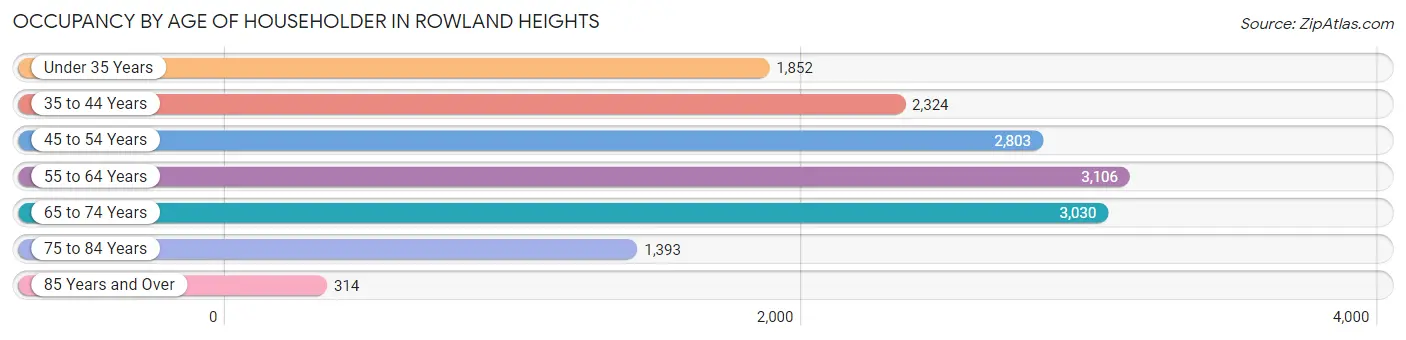
| Age Bracket | # Households | % Households |
| Under 35 Years | 1,852 | 12.5% |
| 35 to 44 Years | 2,324 | 15.7% |
| 45 to 54 Years | 2,803 | 18.9% |
| 55 to 64 Years | 3,106 | 21.0% |
| 65 to 74 Years | 3,030 | 20.4% |
| 75 to 84 Years | 1,393 | 9.4% |
| 85 Years and Over | 314 | 2.1% |
| Total | 14,822 | 100.0% |
Housing Finances in Rowland Heights
Median Income by Occupancy in Rowland Heights
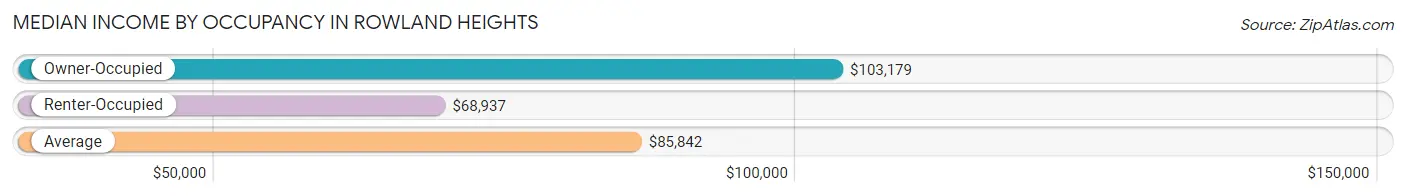
| Occupancy Type | # Households | Median Income |
| Owner-Occupied | 9,821 (66.3%) | $103,179 |
| Renter-Occupied | 5,001 (33.7%) | $68,937 |
| Average | 14,822 (100.0%) | $85,842 |
Occupancy by Householder Income Bracket in Rowland Heights
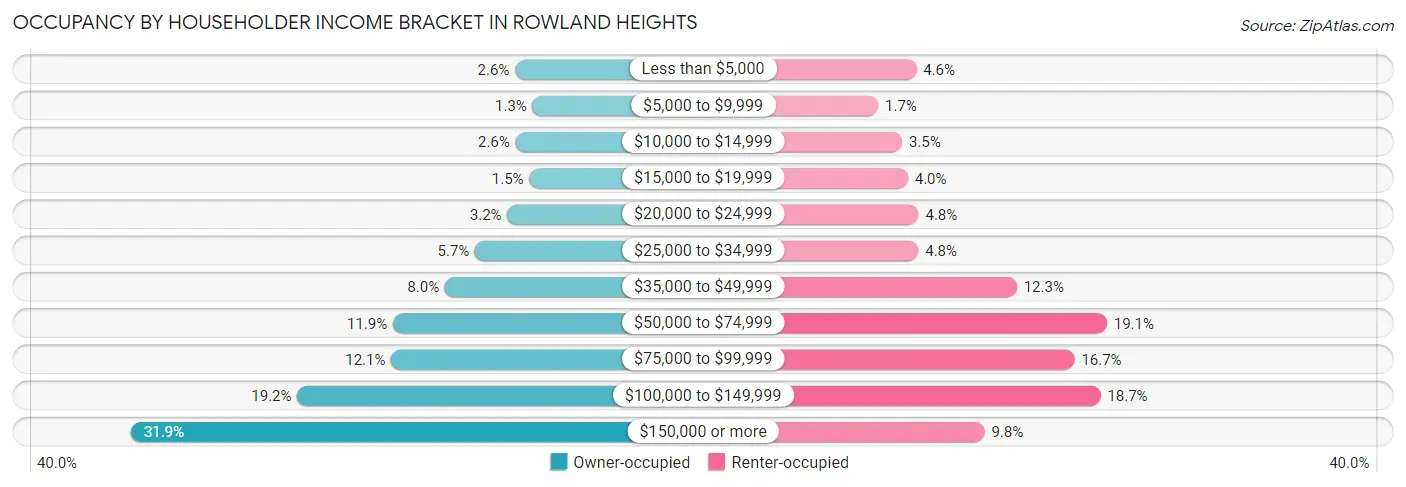
| Income Bracket | Owner-occupied | Renter-occupied |
| Less than $5,000 | 257 (2.6%) | 231 (4.6%) |
| $5,000 to $9,999 | 127 (1.3%) | 86 (1.7%) |
| $10,000 to $14,999 | 254 (2.6%) | 177 (3.5%) |
| $15,000 to $19,999 | 151 (1.5%) | 199 (4.0%) |
| $20,000 to $24,999 | 315 (3.2%) | 240 (4.8%) |
| $25,000 to $34,999 | 557 (5.7%) | 239 (4.8%) |
| $35,000 to $49,999 | 783 (8.0%) | 614 (12.3%) |
| $50,000 to $74,999 | 1,172 (11.9%) | 957 (19.1%) |
| $75,000 to $99,999 | 1,184 (12.1%) | 834 (16.7%) |
| $100,000 to $149,999 | 1,888 (19.2%) | 933 (18.7%) |
| $150,000 or more | 3,133 (31.9%) | 491 (9.8%) |
| Total | 9,821 (100.0%) | 5,001 (100.0%) |
Monthly Housing Cost Tiers in Rowland Heights
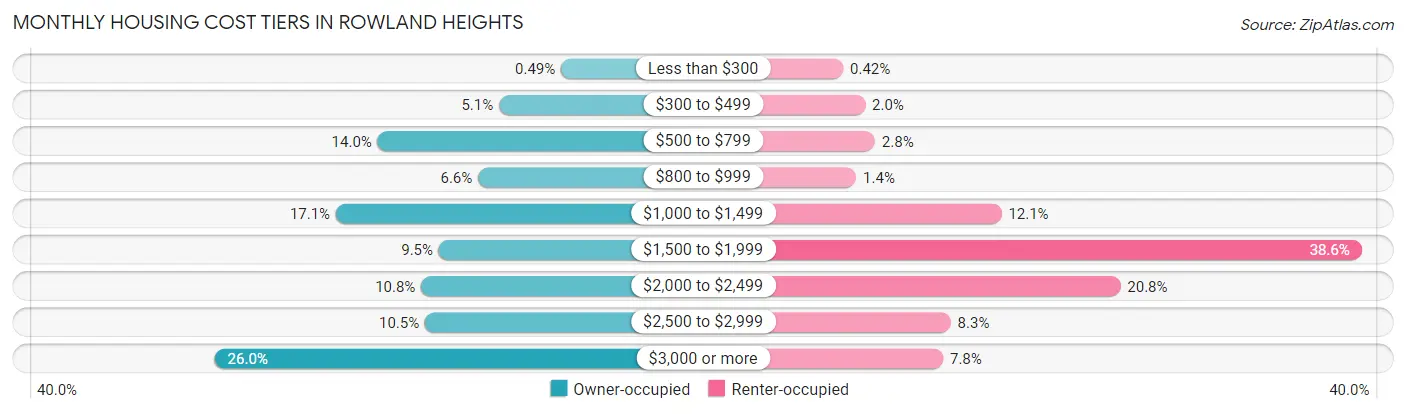
| Monthly Cost | Owner-occupied | Renter-occupied |
| Less than $300 | 48 (0.5%) | 21 (0.4%) |
| $300 to $499 | 497 (5.1%) | 102 (2.0%) |
| $500 to $799 | 1,375 (14.0%) | 138 (2.8%) |
| $800 to $999 | 648 (6.6%) | 69 (1.4%) |
| $1,000 to $1,499 | 1,676 (17.1%) | 604 (12.1%) |
| $1,500 to $1,999 | 932 (9.5%) | 1,931 (38.6%) |
| $2,000 to $2,499 | 1,060 (10.8%) | 1,042 (20.8%) |
| $2,500 to $2,999 | 1,032 (10.5%) | 417 (8.3%) |
| $3,000 or more | 2,553 (26.0%) | 389 (7.8%) |
| Total | 9,821 (100.0%) | 5,001 (100.0%) |
Physical Housing Characteristics in Rowland Heights
Housing Structures in Rowland Heights
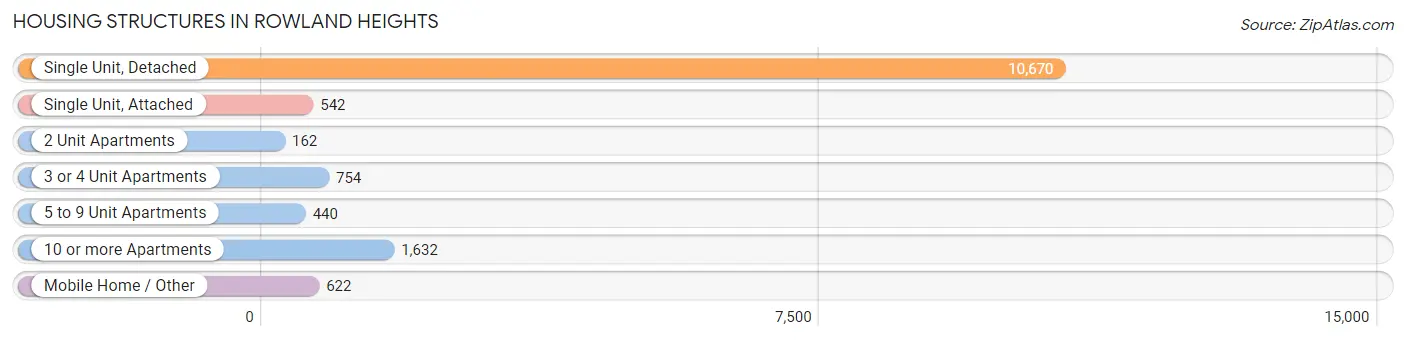
| Structure Type | # Housing Units | % Housing Units |
| Single Unit, Detached | 10,670 | 72.0% |
| Single Unit, Attached | 542 | 3.7% |
| 2 Unit Apartments | 162 | 1.1% |
| 3 or 4 Unit Apartments | 754 | 5.1% |
| 5 to 9 Unit Apartments | 440 | 3.0% |
| 10 or more Apartments | 1,632 | 11.0% |
| Mobile Home / Other | 622 | 4.2% |
| Total | 14,822 | 100.0% |
Housing Structures by Occupancy in Rowland Heights
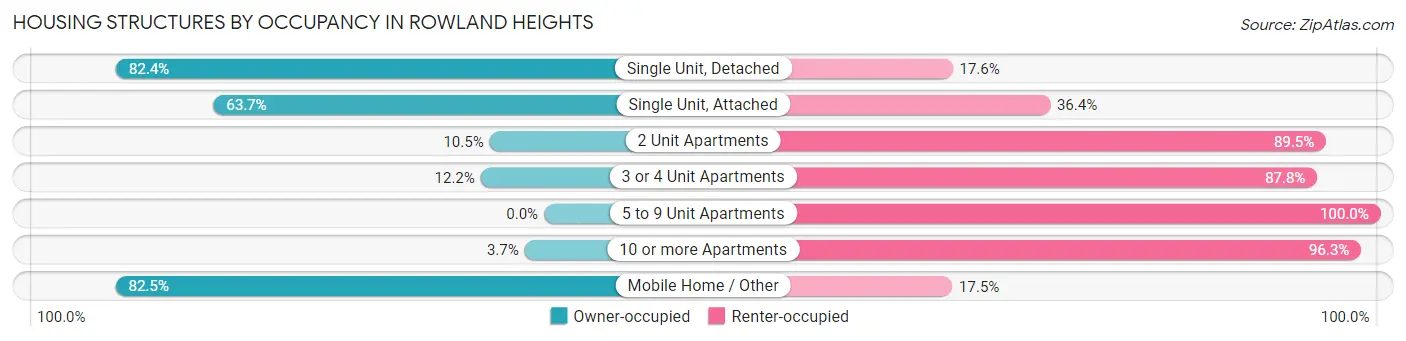
| Structure Type | Owner-occupied | Renter-occupied |
| Single Unit, Detached | 8,793 (82.4%) | 1,877 (17.6%) |
| Single Unit, Attached | 345 (63.6%) | 197 (36.3%) |
| 2 Unit Apartments | 17 (10.5%) | 145 (89.5%) |
| 3 or 4 Unit Apartments | 92 (12.2%) | 662 (87.8%) |
| 5 to 9 Unit Apartments | 0 (0.0%) | 440 (100.0%) |
| 10 or more Apartments | 61 (3.7%) | 1,571 (96.3%) |
| Mobile Home / Other | 513 (82.5%) | 109 (17.5%) |
| Total | 9,821 (66.3%) | 5,001 (33.7%) |
Housing Structures by Number of Rooms in Rowland Heights
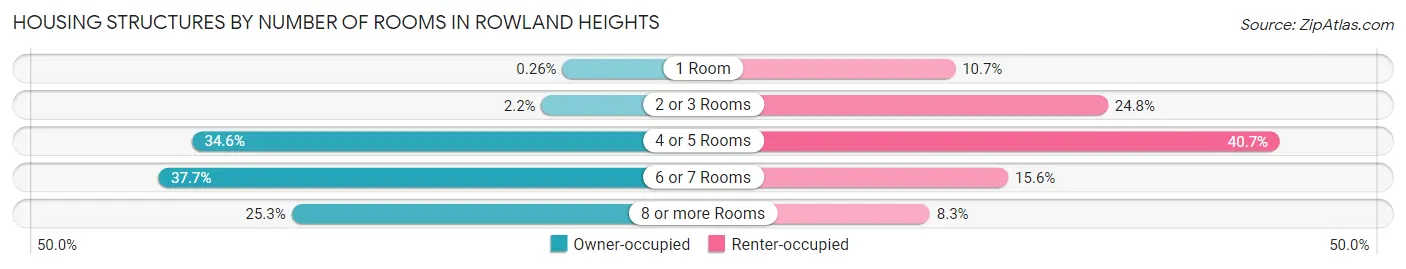
| Number of Rooms | Owner-occupied | Renter-occupied |
| 1 Room | 26 (0.3%) | 533 (10.7%) |
| 2 or 3 Rooms | 216 (2.2%) | 1,239 (24.8%) |
| 4 or 5 Rooms | 3,394 (34.6%) | 2,035 (40.7%) |
| 6 or 7 Rooms | 3,699 (37.7%) | 778 (15.6%) |
| 8 or more Rooms | 2,486 (25.3%) | 416 (8.3%) |
| Total | 9,821 (100.0%) | 5,001 (100.0%) |
Housing Structure by Heating Type in Rowland Heights
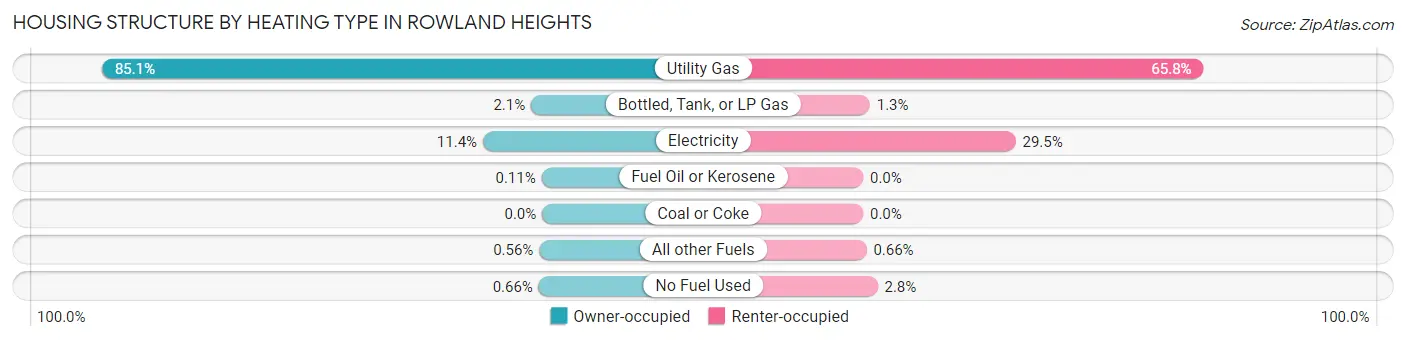
| Heating Type | Owner-occupied | Renter-occupied |
| Utility Gas | 8,357 (85.1%) | 3,289 (65.8%) |
| Bottled, Tank, or LP Gas | 209 (2.1%) | 65 (1.3%) |
| Electricity | 1,124 (11.4%) | 1,474 (29.5%) |
| Fuel Oil or Kerosene | 11 (0.1%) | 0 (0.0%) |
| Coal or Coke | 0 (0.0%) | 0 (0.0%) |
| All other Fuels | 55 (0.6%) | 33 (0.7%) |
| No Fuel Used | 65 (0.7%) | 140 (2.8%) |
| Total | 9,821 (100.0%) | 5,001 (100.0%) |
Household Vehicle Usage in Rowland Heights
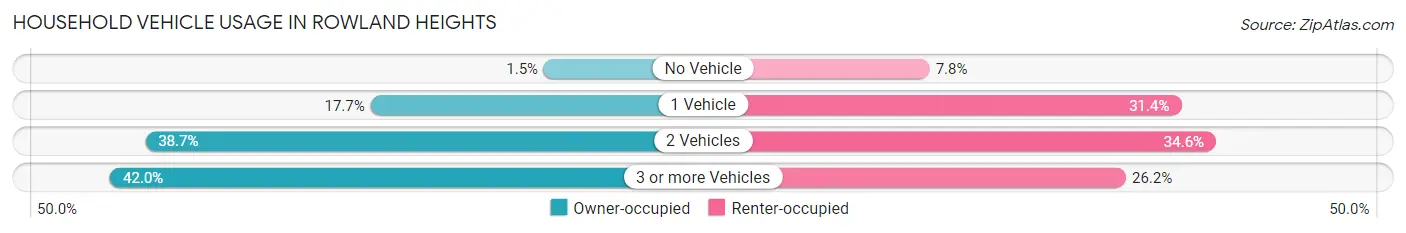
| Vehicles per Household | Owner-occupied | Renter-occupied |
| No Vehicle | 149 (1.5%) | 391 (7.8%) |
| 1 Vehicle | 1,739 (17.7%) | 1,570 (31.4%) |
| 2 Vehicles | 3,805 (38.7%) | 1,732 (34.6%) |
| 3 or more Vehicles | 4,128 (42.0%) | 1,308 (26.2%) |
| Total | 9,821 (100.0%) | 5,001 (100.0%) |
Real Estate & Mortgages in Rowland Heights
Real Estate and Mortgage Overview in Rowland Heights
| Characteristic | Without Mortgage | With Mortgage |
| Housing Units | 3,964 | 5,857 |
| Median Property Value | $724,000 | $778,900 |
| Median Household Income | $82,740 | $2,312 |
| Monthly Housing Costs | $832 | $2,553 |
| Real Estate Taxes | $4,914 | $80 |
Property Value by Mortgage Status in Rowland Heights
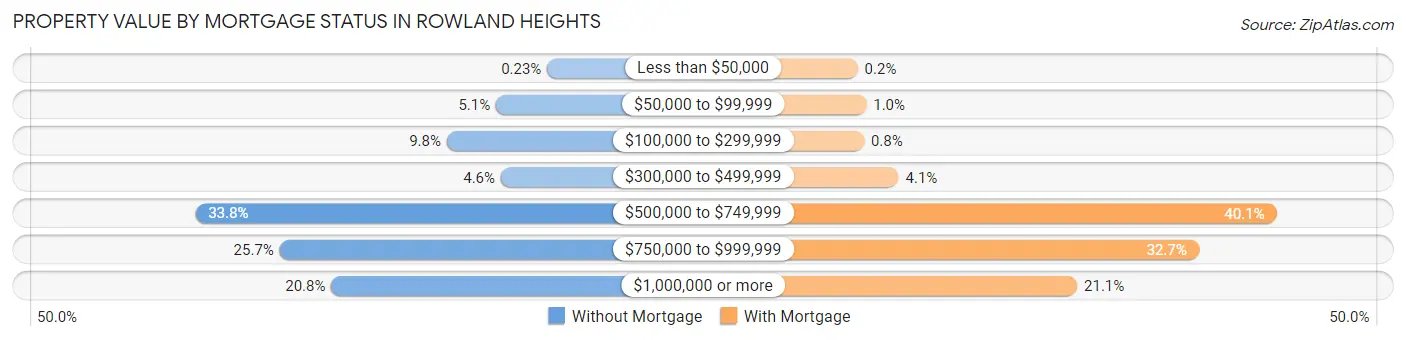
| Property Value | Without Mortgage | With Mortgage |
| Less than $50,000 | 9 (0.2%) | 12 (0.2%) |
| $50,000 to $99,999 | 202 (5.1%) | 60 (1.0%) |
| $100,000 to $299,999 | 388 (9.8%) | 47 (0.8%) |
| $300,000 to $499,999 | 184 (4.6%) | 240 (4.1%) |
| $500,000 to $749,999 | 1,338 (33.8%) | 2,348 (40.1%) |
| $750,000 to $999,999 | 1,019 (25.7%) | 1,914 (32.7%) |
| $1,000,000 or more | 824 (20.8%) | 1,236 (21.1%) |
| Total | 3,964 (100.0%) | 5,857 (100.0%) |
Household Income by Mortgage Status in Rowland Heights
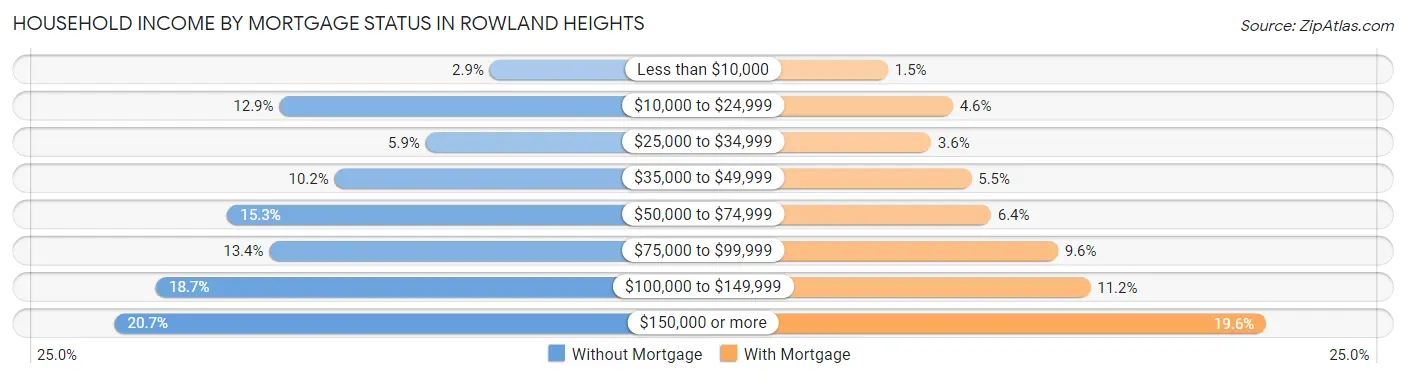
| Household Income | Without Mortgage | With Mortgage |
| Less than $10,000 | 113 (2.9%) | 90 (1.5%) |
| $10,000 to $24,999 | 510 (12.9%) | 271 (4.6%) |
| $25,000 to $34,999 | 234 (5.9%) | 210 (3.6%) |
| $35,000 to $49,999 | 406 (10.2%) | 323 (5.5%) |
| $50,000 to $74,999 | 608 (15.3%) | 377 (6.4%) |
| $75,000 to $99,999 | 529 (13.4%) | 564 (9.6%) |
| $100,000 to $149,999 | 743 (18.7%) | 655 (11.2%) |
| $150,000 or more | 821 (20.7%) | 1,145 (19.6%) |
| Total | 3,964 (100.0%) | 5,857 (100.0%) |
Property Value to Household Income Ratio in Rowland Heights
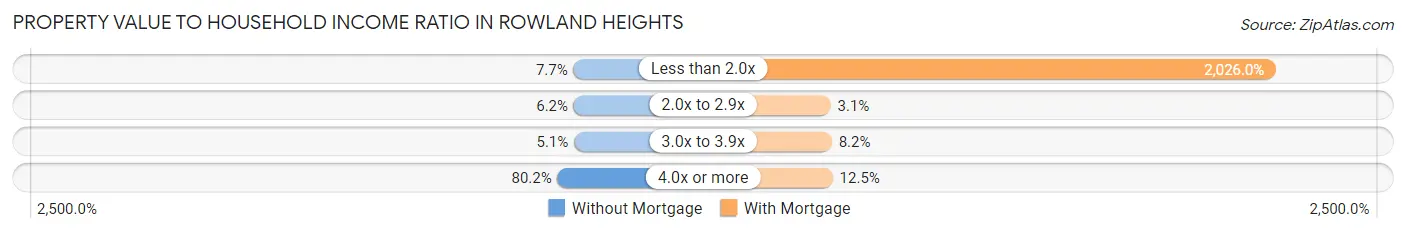
| Value-to-Income Ratio | Without Mortgage | With Mortgage |
| Less than 2.0x | 307 (7.7%) | 118,661 (2,026.0%) |
| 2.0x to 2.9x | 244 (6.2%) | 180 (3.1%) |
| 3.0x to 3.9x | 202 (5.1%) | 481 (8.2%) |
| 4.0x or more | 3,179 (80.2%) | 730 (12.5%) |
| Total | 3,964 (100.0%) | 5,857 (100.0%) |
Real Estate Taxes by Mortgage Status in Rowland Heights
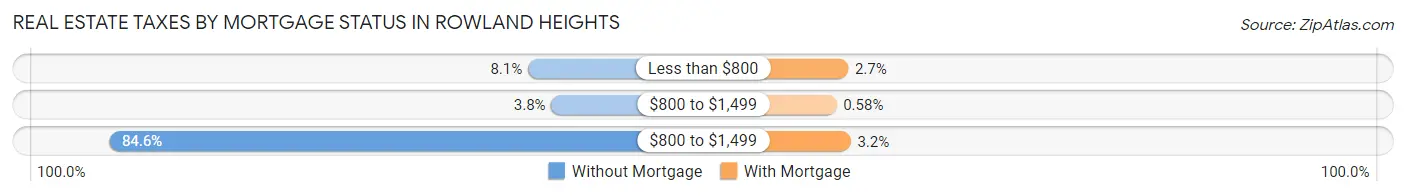
| Property Taxes | Without Mortgage | With Mortgage |
| Less than $800 | 319 (8.1%) | 160 (2.7%) |
| $800 to $1,499 | 150 (3.8%) | 34 (0.6%) |
| $800 to $1,499 | 3,353 (84.6%) | 186 (3.2%) |
| Total | 3,964 (100.0%) | 5,857 (100.0%) |
Health & Disability in Rowland Heights
Health Insurance Coverage by Age in Rowland Heights
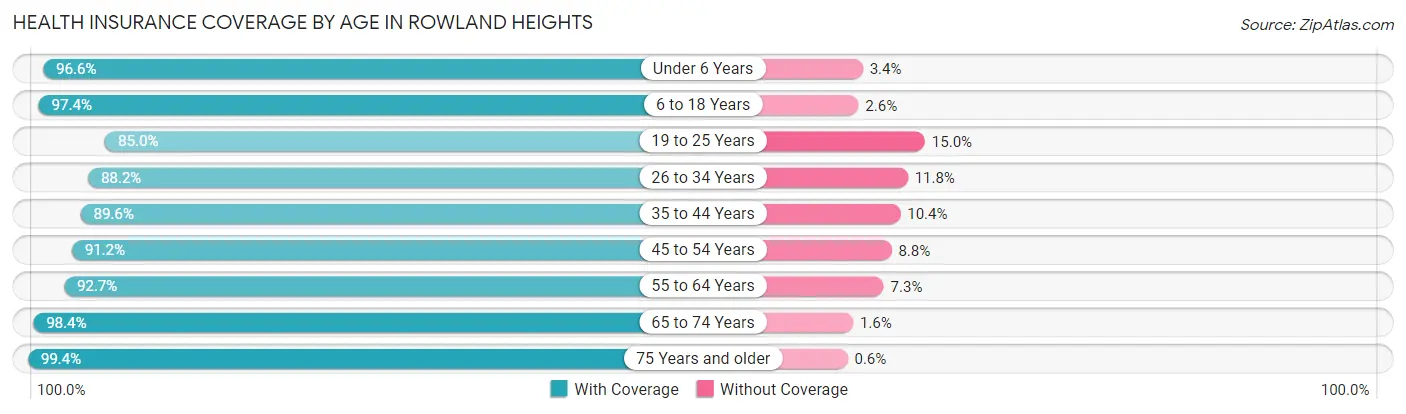
| Age Bracket | With Coverage | Without Coverage |
| Under 6 Years | 2,581 (96.6%) | 92 (3.4%) |
| 6 to 18 Years | 6,098 (97.4%) | 165 (2.6%) |
| 19 to 25 Years | 2,918 (85.0%) | 516 (15.0%) |
| 26 to 34 Years | 5,373 (88.2%) | 720 (11.8%) |
| 35 to 44 Years | 5,054 (89.6%) | 589 (10.4%) |
| 45 to 54 Years | 5,617 (91.2%) | 542 (8.8%) |
| 55 to 64 Years | 6,489 (92.7%) | 514 (7.3%) |
| 65 to 74 Years | 5,936 (98.4%) | 98 (1.6%) |
| 75 Years and older | 3,819 (99.4%) | 23 (0.6%) |
| Total | 43,885 (93.1%) | 3,259 (6.9%) |
Health Insurance Coverage by Citizenship Status in Rowland Heights
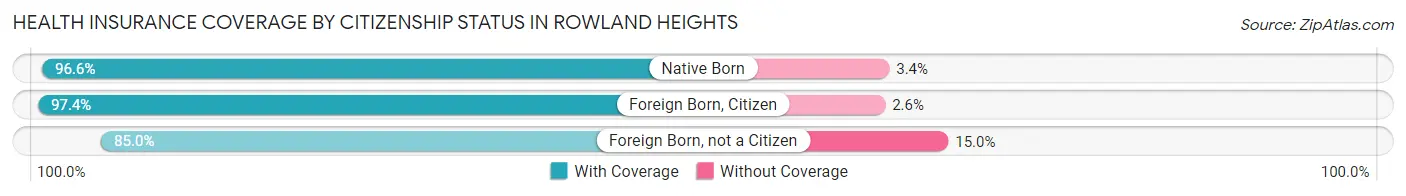
| Citizenship Status | With Coverage | Without Coverage |
| Native Born | 2,581 (96.6%) | 92 (3.4%) |
| Foreign Born, Citizen | 6,098 (97.4%) | 165 (2.6%) |
| Foreign Born, not a Citizen | 2,918 (85.0%) | 516 (15.0%) |
Health Insurance Coverage by Household Income in Rowland Heights
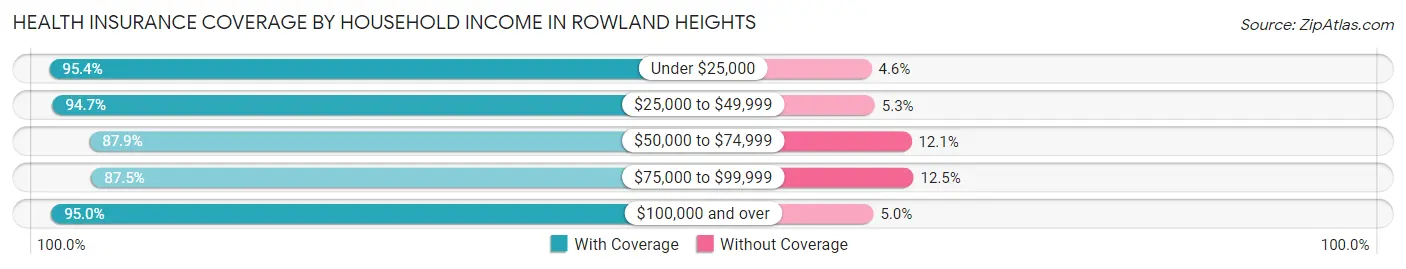
| Household Income | With Coverage | Without Coverage |
| Under $25,000 | 3,875 (95.4%) | 188 (4.6%) |
| $25,000 to $49,999 | 5,220 (94.7%) | 290 (5.3%) |
| $50,000 to $74,999 | 5,466 (87.9%) | 754 (12.1%) |
| $75,000 to $99,999 | 5,473 (87.5%) | 783 (12.5%) |
| $100,000 and over | 23,626 (95.0%) | 1,244 (5.0%) |
Public vs Private Health Insurance Coverage by Age in Rowland Heights
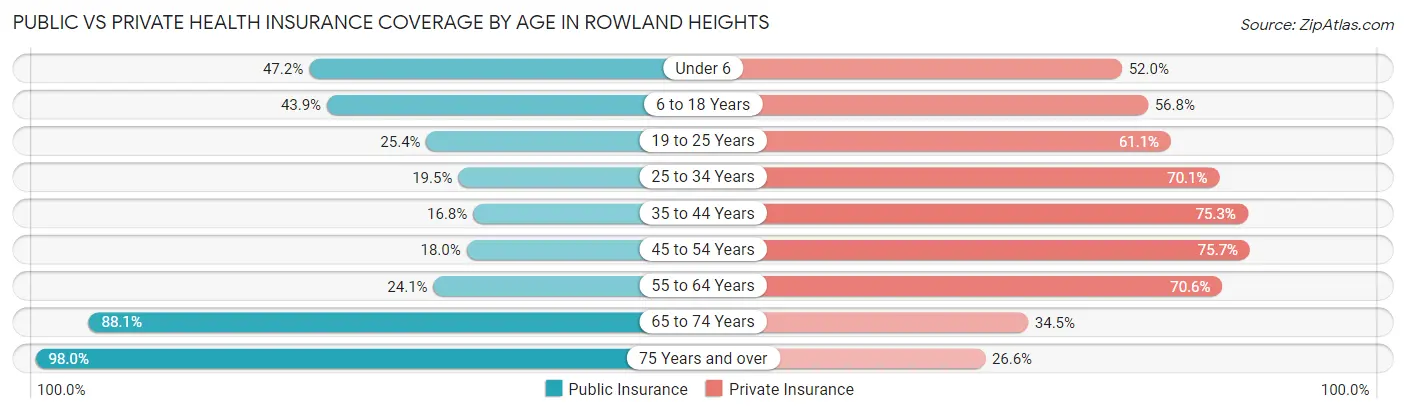
| Age Bracket | Public Insurance | Private Insurance |
| Under 6 | 1,262 (47.2%) | 1,389 (52.0%) |
| 6 to 18 Years | 2,748 (43.9%) | 3,557 (56.8%) |
| 19 to 25 Years | 873 (25.4%) | 2,098 (61.1%) |
| 25 to 34 Years | 1,189 (19.5%) | 4,269 (70.1%) |
| 35 to 44 Years | 945 (16.8%) | 4,251 (75.3%) |
| 45 to 54 Years | 1,107 (18.0%) | 4,665 (75.7%) |
| 55 to 64 Years | 1,689 (24.1%) | 4,946 (70.6%) |
| 65 to 74 Years | 5,318 (88.1%) | 2,084 (34.5%) |
| 75 Years and over | 3,764 (98.0%) | 1,021 (26.6%) |
| Total | 18,895 (40.1%) | 28,280 (60.0%) |
Disability Status by Sex by Age in Rowland Heights
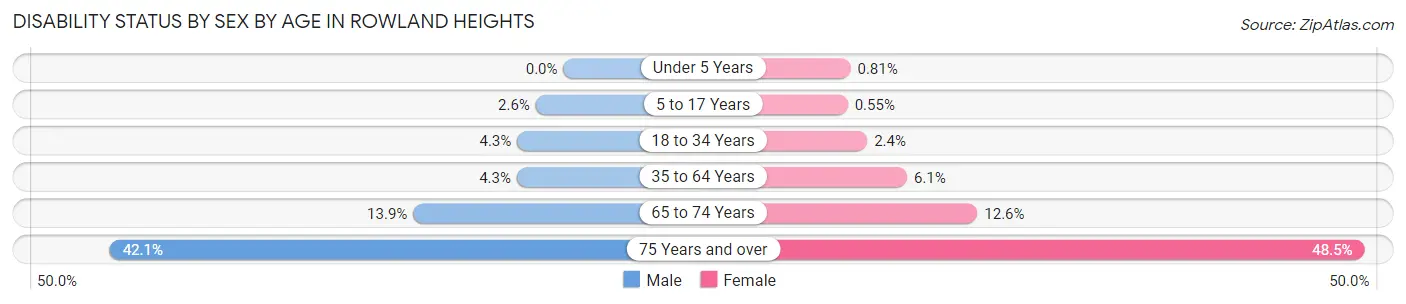
| Age Bracket | Male | Female |
| Under 5 Years | 0 (0.0%) | 9 (0.8%) |
| 5 to 17 Years | 77 (2.6%) | 17 (0.5%) |
| 18 to 34 Years | 218 (4.3%) | 116 (2.4%) |
| 35 to 64 Years | 399 (4.3%) | 579 (6.0%) |
| 65 to 74 Years | 400 (13.9%) | 398 (12.6%) |
| 75 Years and over | 759 (42.1%) | 989 (48.5%) |
Disability Class by Sex by Age in Rowland Heights
Disability Class: Hearing Difficulty
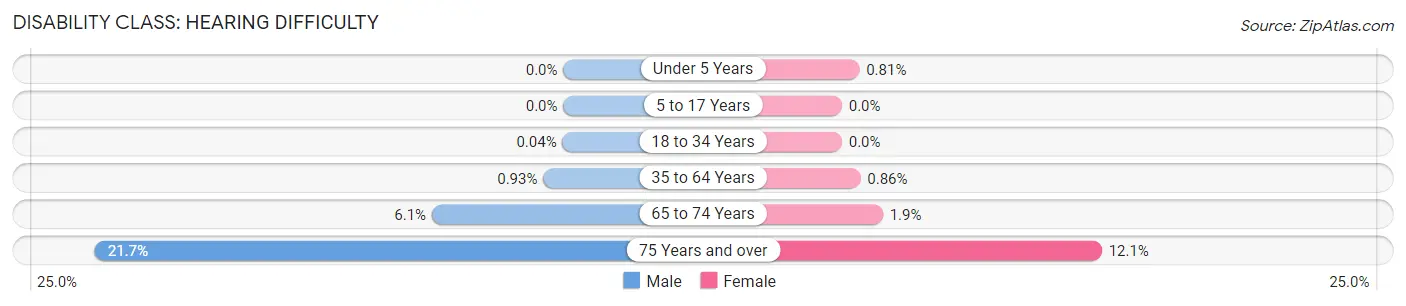
| Age Bracket | Male | Female |
| Under 5 Years | 0 (0.0%) | 9 (0.8%) |
| 5 to 17 Years | 0 (0.0%) | 0 (0.0%) |
| 18 to 34 Years | 2 (0.0%) | 0 (0.0%) |
| 35 to 64 Years | 86 (0.9%) | 82 (0.9%) |
| 65 to 74 Years | 175 (6.1%) | 60 (1.9%) |
| 75 Years and over | 392 (21.7%) | 246 (12.1%) |
Disability Class: Vision Difficulty
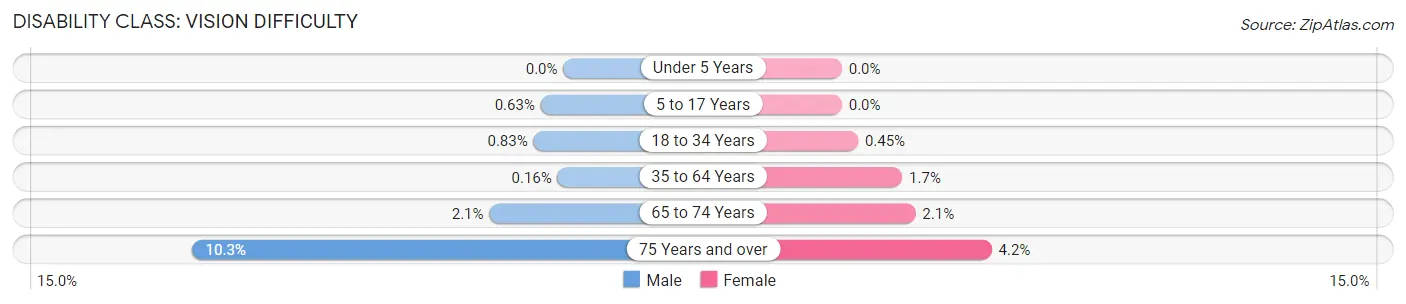
| Age Bracket | Male | Female |
| Under 5 Years | 0 (0.0%) | 0 (0.0%) |
| 5 to 17 Years | 19 (0.6%) | 0 (0.0%) |
| 18 to 34 Years | 42 (0.8%) | 22 (0.4%) |
| 35 to 64 Years | 15 (0.2%) | 161 (1.7%) |
| 65 to 74 Years | 59 (2.1%) | 65 (2.1%) |
| 75 Years and over | 186 (10.3%) | 85 (4.2%) |
Disability Class: Cognitive Difficulty
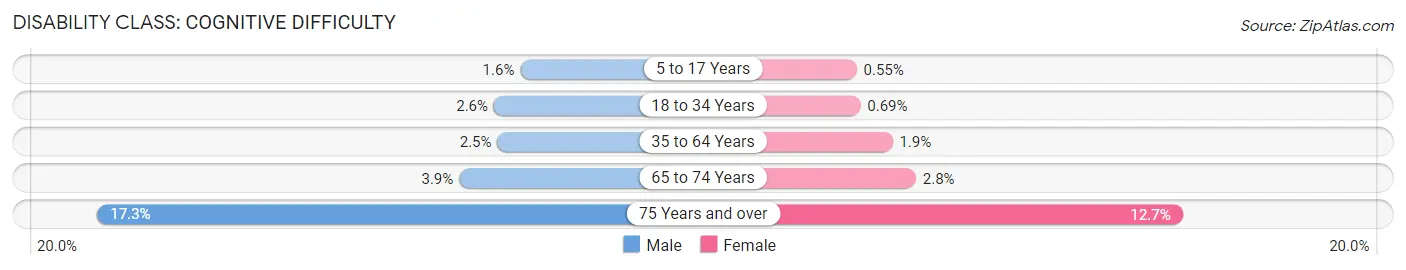
| Age Bracket | Male | Female |
| 5 to 17 Years | 48 (1.6%) | 17 (0.5%) |
| 18 to 34 Years | 131 (2.6%) | 34 (0.7%) |
| 35 to 64 Years | 226 (2.5%) | 180 (1.9%) |
| 65 to 74 Years | 111 (3.9%) | 87 (2.8%) |
| 75 Years and over | 312 (17.3%) | 258 (12.7%) |
Disability Class: Ambulatory Difficulty
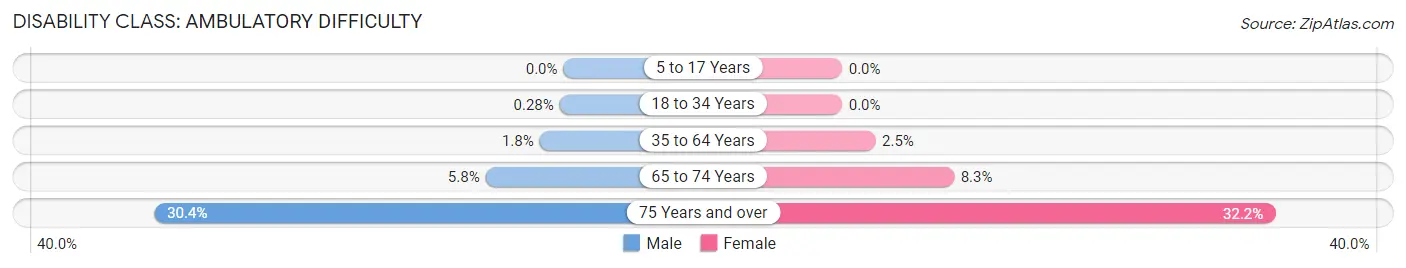
| Age Bracket | Male | Female |
| 5 to 17 Years | 0 (0.0%) | 0 (0.0%) |
| 18 to 34 Years | 14 (0.3%) | 0 (0.0%) |
| 35 to 64 Years | 164 (1.8%) | 236 (2.5%) |
| 65 to 74 Years | 166 (5.8%) | 263 (8.3%) |
| 75 Years and over | 548 (30.4%) | 656 (32.2%) |
Disability Class: Self-Care Difficulty
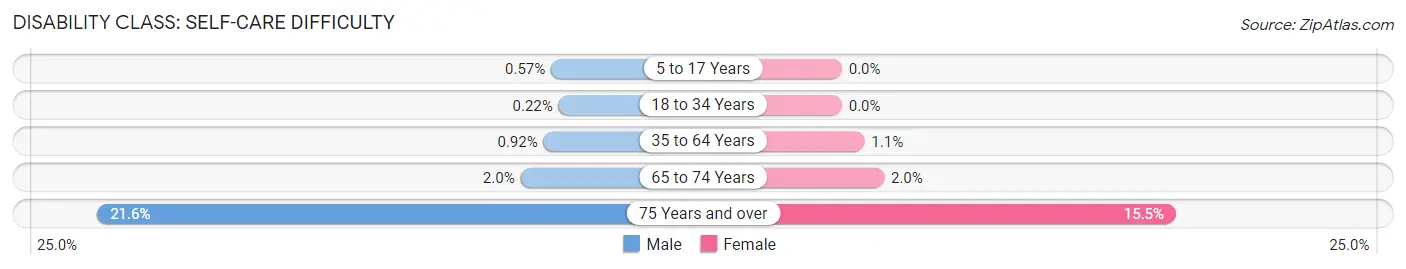
| Age Bracket | Male | Female |
| 5 to 17 Years | 17 (0.6%) | 0 (0.0%) |
| 18 to 34 Years | 11 (0.2%) | 0 (0.0%) |
| 35 to 64 Years | 85 (0.9%) | 100 (1.1%) |
| 65 to 74 Years | 57 (2.0%) | 62 (2.0%) |
| 75 Years and over | 390 (21.6%) | 316 (15.5%) |
Technology Access in Rowland Heights
Computing Device Access in Rowland Heights
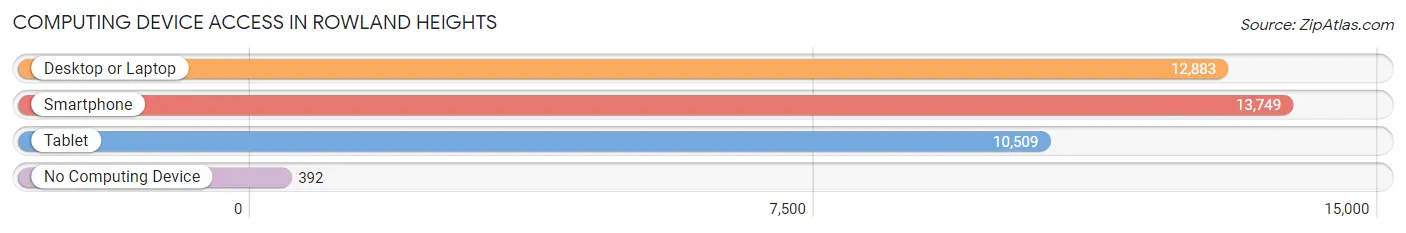
| Device Type | # Households | % Households |
| Desktop or Laptop | 12,883 | 86.9% |
| Smartphone | 13,749 | 92.8% |
| Tablet | 10,509 | 70.9% |
| No Computing Device | 392 | 2.6% |
| Total | 14,822 | 100.0% |
Internet Access in Rowland Heights
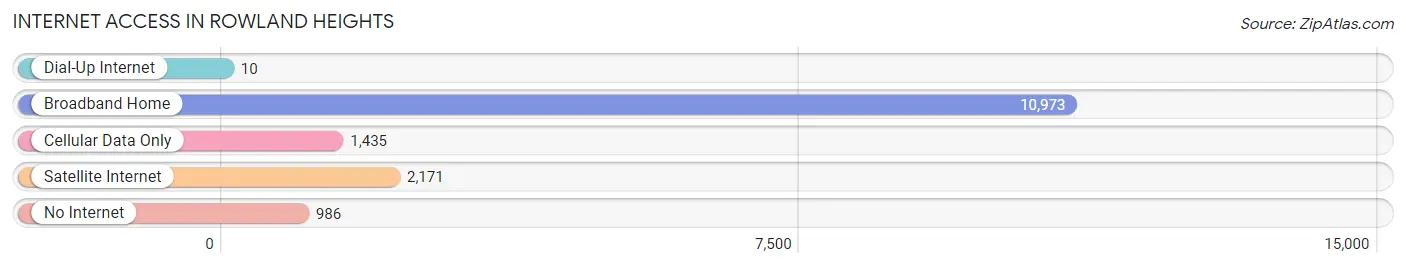
| Internet Type | # Households | % Households |
| Dial-Up Internet | 10 | 0.1% |
| Broadband Home | 10,973 | 74.0% |
| Cellular Data Only | 1,435 | 9.7% |
| Satellite Internet | 2,171 | 14.6% |
| No Internet | 986 | 6.7% |
| Total | 14,822 | 100.0% |
Rowland Heights Summary
History
The area now known as Rowland Heights was originally part of the Rancho La Puente, a Mexican land grant given to John A. Rowland in 1842. The area was sparsely populated until the 1960s when it began to experience rapid growth due to the development of the San Gabriel Valley. The area was officially incorporated as the City of Rowland Heights in 1964.
Geography
Rowland Heights is located in the San Gabriel Valley, approximately 25 miles east of downtown Los Angeles. It is bordered by the cities of La Puente to the north, Industry to the east, Diamond Bar to the south, and Hacienda Heights to the west. The city covers an area of 8.2 square miles and has an elevation of 500 feet. The terrain is mostly hilly, with some flat areas.
Economy
Rowland Heights is a primarily residential community, with a few commercial and industrial areas. The city’s economy is largely driven by the retail and service industries, with many businesses located along Colima Road and Nogales Street. The city is also home to several large employers, including the Rowland Unified School District, Wal-Mart, and the Los Angeles County Sheriff’s Department.
Demographics
As of the 2010 census, the population of Rowland Heights was 48,993. The racial makeup of the city was 44.3% White, 2.2% African American, 0.7% Native American, 39.2% Asian, 0.2% Pacific Islander, 9.3% from other races, and 4.2% from two or more races. The median household income was $68,845, and the median family income was $76,845. The per capita income was $27,845. The population was spread out, with 28.3% under the age of 18, 8.2% from 18 to 24, 33.2% from 25 to 44, 22.2% from 45 to 64, and 8.1% who were 65 years of age or older.
Rowland Heights is a diverse community, with a large Asian population. The city is home to a large Chinese-American population, as well as a growing Korean-American population. The city is also home to a large Filipino-American population, as well as a growing Latino population.
Common Questions
What is Per Capita Income in Rowland Heights?
Per Capita income in Rowland Heights is $36,848.
What is the Median Family Income in Rowland Heights?
Median Family Income in Rowland Heights is $91,198.
What is the Median Household income in Rowland Heights?
Median Household Income in Rowland Heights is $85,842.
What is Income or Wage Gap in Rowland Heights?
Income or Wage Gap in Rowland Heights is 20.7%.
Women in Rowland Heights earn 79.3 cents for every dollar earned by a man.
What is Family Income Deficit in Rowland Heights?
Family Income Deficit in Rowland Heights is $10,415.
Families that are below poverty line in Rowland Heights earn $10,415 less on average than the poverty threshold level.
What is Inequality or Gini Index in Rowland Heights?
Inequality or Gini Index in Rowland Heights is 0.45.
What is the Total Population of Rowland Heights?
Total Population of Rowland Heights is 47,209.
What is the Total Male Population of Rowland Heights?
Total Male Population of Rowland Heights is 23,335.
What is the Total Female Population of Rowland Heights?
Total Female Population of Rowland Heights is 23,874.
What is the Ratio of Males per 100 Females in Rowland Heights?
There are 97.74 Males per 100 Females in Rowland Heights.
What is the Ratio of Females per 100 Males in Rowland Heights?
There are 102.31 Females per 100 Males in Rowland Heights.
What is the Median Population Age in Rowland Heights?
Median Population Age in Rowland Heights is 44.0 Years.
What is the Average Family Size in Rowland Heights
Average Family Size in Rowland Heights is 3.4 People.
What is the Average Household Size in Rowland Heights
Average Household Size in Rowland Heights is 3.2 People.
How Large is the Labor Force in Rowland Heights?
There are 24,757 People in the Labor Forcein in Rowland Heights.
What is the Percentage of People in the Labor Force in Rowland Heights?
62.1% of People are in the Labor Force in Rowland Heights.
What is the Unemployment Rate in Rowland Heights?
Unemployment Rate in Rowland Heights is 6.3%.